north slave resiliency study - northwest …warehouse.pws.gov.nt.ca/pdf/energy/north slave...
TRANSCRIPT
NORTH SLAVE RESILIENCY STUDYFINAL REPORT - ATTACHMENTS
Prepared for the Government of the Northwest Territories
March 2016
Manitoba Hydro International 211 Commerce DriveWinnipeg, Manitoba R3P 1A3 Canadamhi.ca

North Slave Resiliency Study March 2016
Final Report – Attachments i
TABLE OF CONTENTS
ATTACHMENT 1: REFERENCE POINT - SYSTEM LOADS & GENERATION NEXT 10 TO 20 YEARS
1.0 REFERENCE POINT: SYSTEM LOADS AND GENERATION IN THE NEXT 10-20 YEARS ............................................................................................................................A 1-1
1.1 INTRODUCTION ...............................................................................................................................................A1-1
1.2 BACKGROUND ..................................................................................................................................................A1-1
1.2.1 NORTH SLAVE REGION .......................................................................................................................A1-1
1.2.2 EXISTING AND HISTORIC SYSTEM GENERATION AND CAPACITY .................................A1-2
1.2.3 CURRENT INFORMATION REGARDING HYDROLOGY ON THE NORTH SLAVE SYSTEM .......................................................................................................................................................................A1-5
1.2.4 SNARE WATER STABILIZATION FUND ........................................................................................A1-6
1.2.5 CURRENT NTPC RATE STABILIZATION FUND (RSF) ............................................................A1-7
1.2.6 EXISTING SYSTEM CAPACITY PLANNING REQUIREMENTS ...............................................A1-8
1.2.7 FREQUENCY OF YELLOWKNIFE POWER OUTAGES .............................................................A1-10
1.2.8 BASE CASE LOAD FORECAST – NEXT 20 YEARS ....................................................................A1-10
ATTACHMENT 2: HYDROLOGICAL BACKGROUND & ASSESSMENT MANITOBA HYDRO REVIEW DRAFT DECEMBER 2015
1. INTRODUCTION ............................................................................................................................................ 1
2. SCOPE OF REVIEW ....................................................................................................................................... 1
3. MATERIALS AND METHODS .......................................................................................................................23.1 MATERIALS REVIEWED ........................................................................................................................................2
3.2 ELECTRONIC RECORDS AND DATA SOURCES .............................................................................................2
3.3 MODEL DEVELOPMENT AND SIMULATION .................................................................................................3 4. RESULTS ............................................................................................................................................................6
4.1 REVIEW AND UPDATE OF LTA HYDRO ENERGY PRODUCTION (WORK PLAN ITEMS 1 & 2).........................................................................................................................................................................................6
4.2 WORK REQUIRED FOR FUTURE DETAILED UPDATE OF GENERATION ESTIMATE (WORK PLAN ITEM 3) ..........................................................................................................................................................9
4.3 REVIEW OF MONITORING NETWORK & FORECASTING SYSTEM (WORK PLAN ITEM 4) .........................................................................................................................................10
4.4 OPTIONS AVAILABLE TO REDUCE DIESEL DEPENDENCY (WORK PLAN ITEM 5) ...................13
4.5 CLIMATE CHANGE (WORK PLAN ITEM 6) ...................................................................................................14
5. SUMMARY OF KEY FINDINGS ...................................................................................................................16
North Slave Resiliency Study March 2016
Final Report – Attachments ii
ATTACHMENT 3: INFRASTRUCTURE OPTIONS BACKGROUND
3.0 INFRASTRUCTURE OPTIONS BACKGROUND ..............................................................................A3-1 CRITERIA FOR EXAMINATION OF INFRASTRUCTURE OPTIONS ...............................................A3-1
OVERVIEW OF EXISTING INFRASTRUCTURE OPTIONS ................................................................A3-3
HYDRO SYSTEM DEVELOPMENT OPTIONS .........................................................................................A3-4
OTHER RENEWABLE GENERATION OPTIONS ...................................................................................A3-6
FOSSIL FUEL GENERATION OPTIONS ....................................................................................................A3-9 OTHER RESOURCE PLANNING OPTIONS..............................................................................................A3-11
ATTACHMENT 4: RATE STRUCTURE AND OTHER NON-INFRASTRUCTURE OPTIONS BACKGROUND
4.0 RATE STRUCTURE AND NON-INFRASTRUCTURE OPTIONS BACKGROUND ................................A4-1
4.1 RATE RELATED OPTIONS IN NWT AND OTHER CANADIAN JURISDICTIONS ....................A4-1
4.1.1 NWT RATE PRACTICE DEALING WITH LOW WATER LEVELS ........................................A4-1
4.1.2 EXISTING RATE RELATED OPTIONS IN OTHER CANADIAN JURISDICTIONS ..........A4-3
4.1.3
4.1.4
CONCLUSIONS RE: RATE RELATED OPTIONS IN OTHER CANADIAN
JURISDICTIONS......................................................................................................................................A4-7REVIEW RATE RELATED OPTIONS TO LIMIT RATE INSTABILITY FROM WATER VARIABILITY...........................................................................................................................................A4-8
4.2 REVIEW OTHER NON-INFRASTRUCTURE OPTIONS ......................................................................A4-9

ATTACHMENT 1:
REFERENCE POINT - SYSTEM LOADS & GENERATION NEXT
10 TO 20 YEARS

North Slave Resiliency Study March 2016
Attachment 1: Reference Point - System Loads & Generation Next 10 to 20 Years A1-1
1.0 REFERENCE POINT: SYSTEM LOADS AND GENERATION IN THE NEXT 10-20 YEARS
1.1 INTRODUCTION
This Attachment uses existing information and studies to provide the following:
• Background - North Slave system historical and current load requirements, generation capabilities and planning;
• Base Case load forecast - Next 20 Years; and • Potential industrial load scenarios - Next 10 Years.
1.2 BACKGROUND
1.2.1 North Slave Region
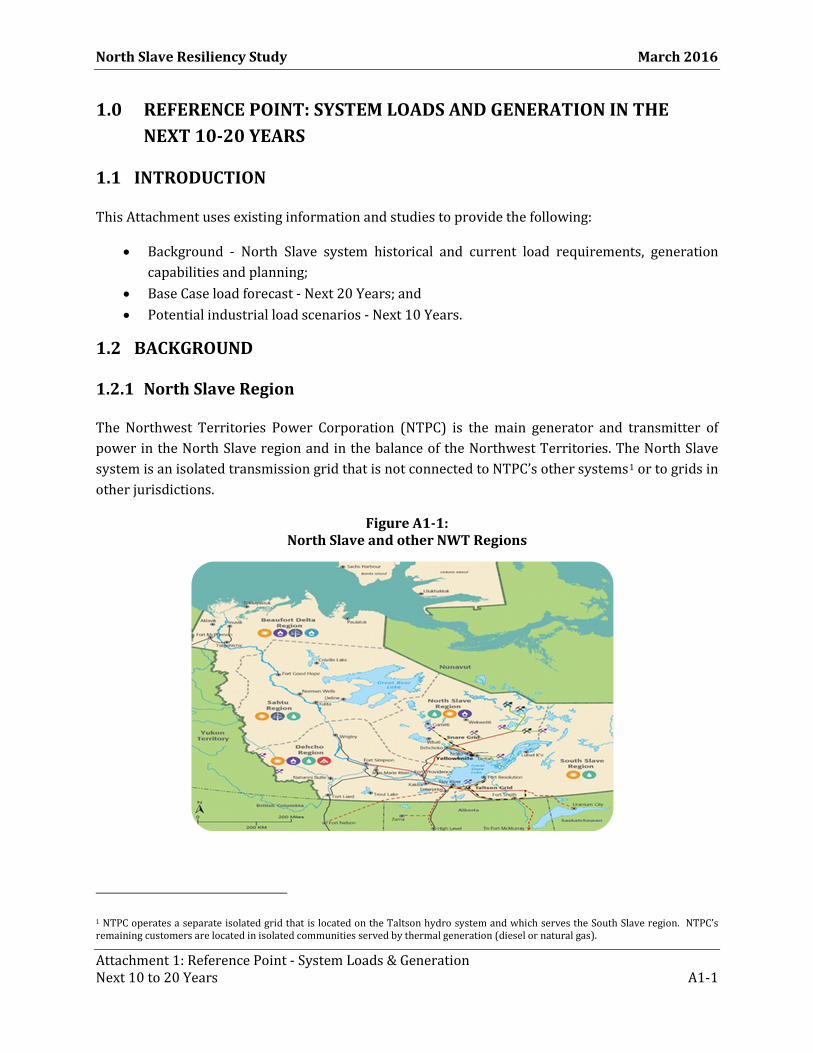
The Northwest Territories Power Corporation (NTPC) is the main generator and transmitter of power in the North Slave region and in the balance of the Northwest Territories. The North Slave system is an isolated transmission grid that is not connected to NTPC’s other systems1 or to grids in other jurisdictions.
Figure A1-1: North Slave and other NWT Regions
1 NTPC operates a separate isolated grid that is located on the Taltson hydro system and which serves the South Slave region. NTPC’s remaining customers are located in isolated communities served by thermal generation (diesel or natural gas).
North Slave Resiliency Study March 2016
Attachment 1: Reference Point - System Loads & Generation Next 10 to 20 Years A1-2
1.2.2 Existing and Historic System Generation and Capacity
The current generation on the North Slave system is approximately 195 GW.h/year supplied to the following customers2:
• Approximately 170 GW.h/year to a wholesale customer (Northlands Utilities (YK) Ltd. or NUL-YK), which distributes power to the City of Yellowknife;
• Approximately 8.5 GW.h/year to retail customers in Behchoko and Dettah; and • Approximately 7.0 GW.h/year to the currently non-operating Giant mine located in the
Yellowknife area.
NTPC supplies power to the North Slave system through a combination of hydro and diesel generation as reviewed below:
• Hydro generation is supplied from two separate facilities located on separate watersheds in the Mackenzie River Basin:
o The Bluefish generating station (a single plant, with 6.6 MW generating capacity located to the east of Yellowknife);
o The Snare system (four plants, with total 29.4 MW generating capacity located to the west of Yellowknife).
o The Bluefish and Snare hydro systems are on separate transmission lines and both lack any redundancy.
• Up to 27.3 MW of diesel generating capacity located in Yellowknife (Jackfish diesel plant). As reviewed below, some of the diesel generation units are currently changing to reflect end of life and new acquisitions.
As illustrated in Table A1-1 below, the North Slave system generation characteristics can be divided into two distinct periods:
(1) the period prior to termination of operational activities for the two gold mines (Giant and Miramar Con) when the annual generation load on the North Slave system often exceeded 250 GW.h/year, and was supplied from a mix of hydro and diesel generation sources; and
(2) the period after termination of the Giant and Con mines’ operational activities (about 2004/05 fiscal year), when these mines went into care and maintenance mode (with materially reduced load requirements) and load on the system has been typically slightly below 200 GW.h/year.3
2 The difference between total power generation and total sales are attributable to grid system losses. 3 In 2013, Miramar Con mine became a customer of NUL-YK due to its relatively small maintenance load. It is assumed that Miramar Con mine became a general service customer of NUL-YK, as NUL’s Terms and Conditions of Service does not include an industrial rate class. It is also noted that at the retail level. Both NTPC and NUL-YK employ the same customer categories at the retail level (residential, general service, and streetlights).
North Slave Resiliency Study March 2016
Attachment 1: Reference Point - System Loads & Generation Next 10 to 20 Years A1-3
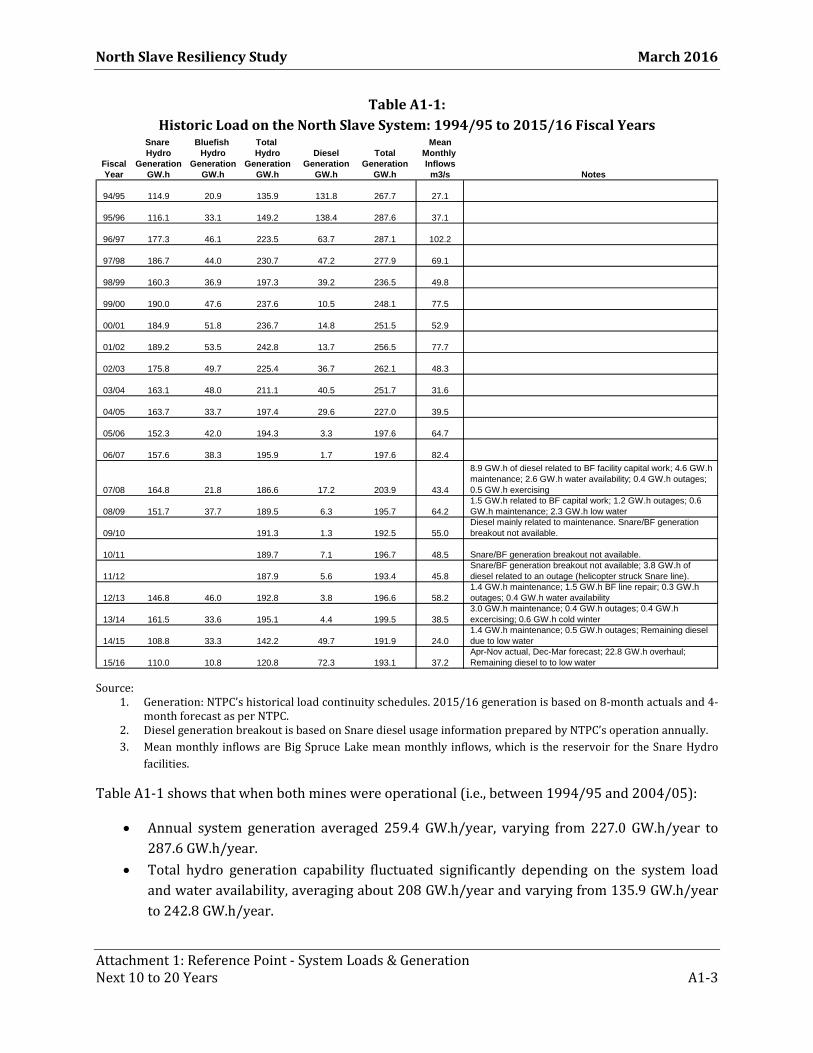
Table A1-1: Historic Load on the North Slave System: 1994/95 to 2015/16 Fiscal Years
Source:
1. Generation: NTPC’s historical load continuity schedules. 2015/16 generation is based on 8-month actuals and 4-month forecast as per NTPC.
2. Diesel generation breakout is based on Snare diesel usage information prepared by NTPC’s operation annually. 3. Mean monthly inflows are Big Spruce Lake mean monthly inflows, which is the reservoir for the Snare Hydro
facilities.
Table A1-1 shows that when both mines were operational (i.e., between 1994/95 and 2004/05):
• Annual system generation averaged 259.4 GW.h/year, varying from 227.0 GW.h/year to 287.6 GW.h/year.
• Total hydro generation capability fluctuated significantly depending on the system load and water availability, averaging about 208 GW.h/year and varying from 135.9 GW.h/year to 242.8 GW.h/year.
Snare Bluefish Total MeanHydro Hydro Hydro Diesel Total Monthly
Fiscal Generation Generation Generation Generation Generation InflowsYear GW.h GW.h GW.h GW.h GW.h m3/s Notes
94/95 114.9 20.9 135.9 131.8 267.7 27.1
95/96 116.1 33.1 149.2 138.4 287.6 37.1
96/97 177.3 46.1 223.5 63.7 287.1 102.2
97/98 186.7 44.0 230.7 47.2 277.9 69.1
98/99 160.3 36.9 197.3 39.2 236.5 49.8
99/00 190.0 47.6 237.6 10.5 248.1 77.5
00/01 184.9 51.8 236.7 14.8 251.5 52.9
01/02 189.2 53.5 242.8 13.7 256.5 77.7
02/03 175.8 49.7 225.4 36.7 262.1 48.3
03/04 163.1 48.0 211.1 40.5 251.7 31.6
04/05 163.7 33.7 197.4 29.6 227.0 39.5
05/06 152.3 42.0 194.3 3.3 197.6 64.7
06/07 157.6 38.3 195.9 1.7 197.6 82.4
07/08 164.8 21.8 186.6 17.2 203.9 43.4
8.9 GW.h of diesel related to BF facility capital work; 4.6 GW.h maintenance; 2.6 GW.h water availability; 0.4 GW.h outages; 0.5 GW.h exercising
08/09 151.7 37.7 189.5 6.3 195.7 64.21.5 GW.h related to BF capital work; 1.2 GW.h outages; 0.6 GW.h maintenance; 2.3 GW.h low water
09/10 191.3 1.3 192.5 55.0Diesel mainly related to maintenance. Snare/BF generation breakout not available.
10/11 189.7 7.1 196.7 48.5 Snare/BF generation breakout not available.
11/12 187.9 5.6 193.4 45.8Snare/BF generation breakout not available; 3.8 GW.h of diesel related to an outage (helicopter struck Snare line).
12/13 146.8 46.0 192.8 3.8 196.6 58.21.4 GW.h maintenance; 1.5 GW.h BF line repair; 0.3 GW.h outages; 0.4 GW.h water availability
13/14 161.5 33.6 195.1 4.4 199.5 38.53.0 GW.h maintenance; 0.4 GW.h outages; 0.4 GW.h excercising; 0.6 GW.h cold winter
14/15 108.8 33.3 142.2 49.7 191.9 24.01.4 GW.h maintenance; 0.5 GW.h outages; Remaining diesel due to low water
15/16 110.0 10.8 120.8 72.3 193.1 37.2Apr-Nov actual, Dec-Mar forecast; 22.8 GW.h overhaul; Remaining diesel to to low water
North Slave Resiliency Study March 2016
Attachment 1: Reference Point - System Loads & Generation Next 10 to 20 Years A1-4
• Diesel generation was required to supply the balance of the required generation, averaging 51.5 GW.h/year and varying from 10.5 GW.h/year to over 138.4 GW.h/year.
After 2004/05 and the closing of both mines, total grid load reduced by approximately 25% from 2005/06 to 2015/16 compared to the previous eleven years, averaging 196.2 GW.h/year and varying from 191.9 GW.h/year to 203.9 GW.h/year. Diesel generation requirements during this period were roughly 70% lower than in the previous eleven years, averaging 15.7 GWh/year and varying from 1.7 GW.h/year to 72.3 GW.h/year.
In summary, the mine closures resulted in surplus hydro generation on the North Slave system under non-drought water conditions. Diesel generation consequently was used primarily for peaking or backup purposes during non-drought water years.4 Prior to the last two drought years, diesel generation requirements relating to water availability or cold weather were minimal (e.g., under 0.5 GW.h/year to 2.6 GW.h/year). While recent drought conditions in 2014/15 and 2015/16 indicate that low water diesel generation requirements (and related costs) can be significant, the North Slave system has not otherwise required material thermal generation to meet current loads subsequent to the mine closures.
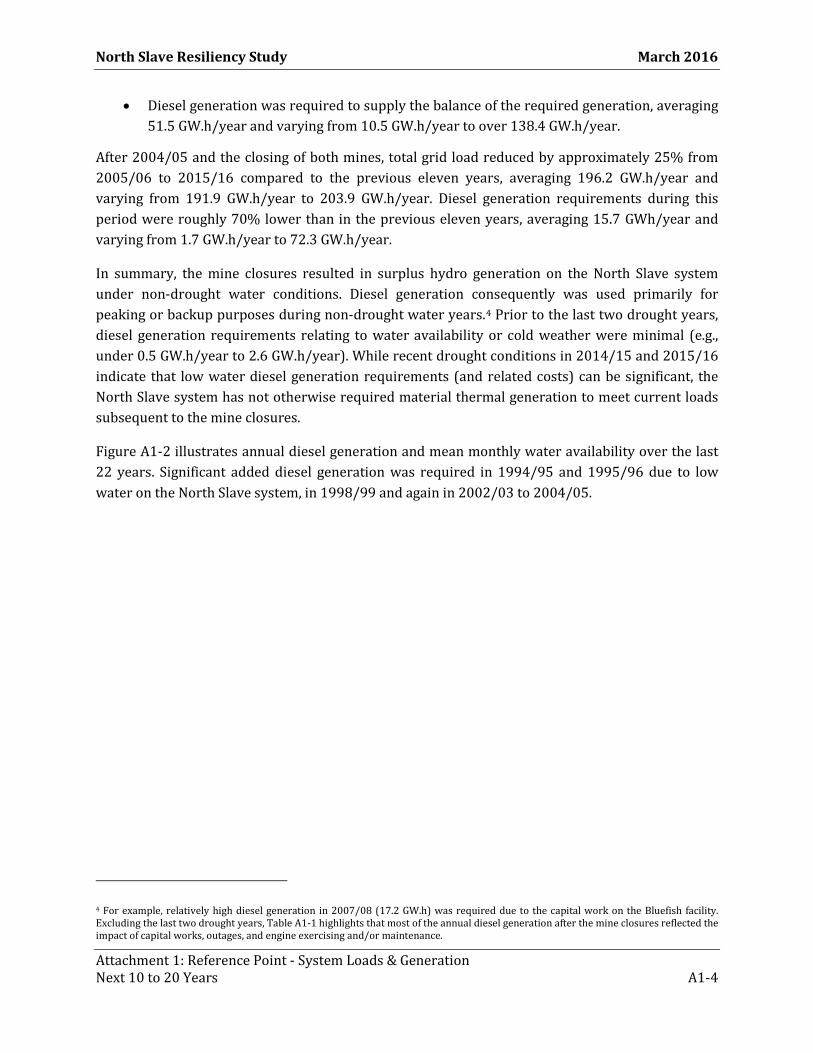
Figure A1-2 illustrates annual diesel generation and mean monthly water availability over the last 22 years. Significant added diesel generation was required in 1994/95 and 1995/96 due to low water on the North Slave system, in 1998/99 and again in 2002/03 to 2004/05.
4 For example, relatively high diesel generation in 2007/08 (17.2 GW.h) was required due to the capital work on the Bluefish facility. Excluding the last two drought years, Table A1-1 highlights that most of the annual diesel generation after the mine closures reflected the impact of capital works, outages, and engine exercising and/or maintenance.
North Slave Resiliency Study March 2016
Attachment 1: Reference Point - System Loads & Generation Next 10 to 20 Years A1-5
Figure A1-2 North Slave Diesel Generation and Mean Inflows: 1994/95 to 2015/16
Based on the diesel generation and water availability relationship shown in Figure A1-1 for the last 22 years, material diesel generation appears to have been required on the North Slave system due to low water events approximately once every decade.
1.2.3 Current Information regarding Hydrology on the North Slave System
NTPC currently lacks a hydrological power generation forecast model. As reviewed below, the current "normal" or long term average (LTA) hydro generation estimate for the North Slave system of 220 GW.h/year as adopted in recent General Rate Applications (GRAs) is not based on a hydrological model result relevant to current system loads or on the post-1992 hydrological record.
In the early 1990s, NTPC used HEC-3 Reservoir System Analysis software to determine forecast variability in the annual hydro generation and diesel requirements on the Snare system. NTPC also appears to have used the TRESMOD regulation model at that time for the same purpose. However, these models were not maintained beyond that period.
In the 1995/98 GRA, LTA hydro generation for NTPC Snare generation was estimated at 174.3 GW.h using the average output for HEC-3 Reservoir System Analysis software simulation run for the period of 1940 to 1992.5 This is the last estimate of LTA hydro generation prepared for the Snare system using a hydrological power generation forecast model that reflects the full range of
5 NTPC proposed a 174.3 GWh LTA hydro generation in the 1995/98 Phase I rate application as part of the proposed Rate Stabilization Fund.
0.0
20.0
40.0
60.0
80.0
100.0
120.0
0.0
20.0
40.0
60.0
80.0
100.0
120.0
140.0
160.0
94/9
595
/96
96/9
797
/98
98/9
999
/00
00/0
101
/02
02/0
303
/04
04/0
505
/06
06/0
707
/08
08/0
909
/10
10/1
111
/12
12/1
313
/14
14/1
515
/16
m3/
s
GW.h
Diesel Generation and Monthly Inflows
Diesel Generation Mean Inflows
Mines On Mines Off
Low water
High loadLow water
Bluefish work: 8.9 GWh
Low water
North Slave Resiliency Study March 2016
Attachment 1: Reference Point - System Loads & Generation Next 10 to 20 Years A1-6
available hydrological record. This LTA hydro generation estimate reflects the higher grid loads applicable at that time, e.g., in the range of 278-288 GW.h/year generation requirement.
This LTA estimate was revised to 177 GW.h in the 1995/98 GRA negotiated settlement6 and was further revised to 220 GW.h in the 2006/08 GRA simply to reflect an estimate of the additional average hydro generation resulting from the NTPC purchase of the Bluefish facility.7
In summary, the current LTA hydro generation estimate of 220 GW.h/year builds upon the earlier 1995/98 GRA estimate that was based on the hydrological model (HEC-3) applied assuming a system load considerably higher than today (due to then existing industrial load) and the 1940-1992 hydrological record. Considering that LTA annual hydro generation capability changes as system load changes, the current 220 GW.h/year estimate does not reflect the much lower system loads that exist today. The current LTA annual hydro generation estimate of 220 GW.h/year also does not reflect the hydrological record after 1992.
Based on an LTA of 220 GW.h/year, it might be assumed that hydro generation alone in most years could supply all of the generation requirements for the lower loads that have existed on the North Slave system since 2004/05 (i.e., generation load below 220 GW.h/year). However, as reviewed in Table A1-1, diesel generation has been required (due to variety of factors) in each year during this recent period - and low water conditions have led to relatively large diesel generation requirements in the last two years. It remains unclear today from this information what level of LTA diesel generation should be assumed at current system loads based on LTA hydro generation.
1.2.4 Snare Water Stabilization Fund
In the 1995/98 GRA, NTPC proposed establishing a Snare Water Stabilization Fund based on the LTA hydro generation estimate for the North Slave system in order to shelter or stabilize customer rates from annual swings related to water availability change impacts on diesel generation. Under this proposal, any variation of actual hydro generation from the LTA would be credited or charged to a Snare Water Stabilization Fund based on diesel generation impacts. The fund would pay for additional diesel generation required during low water conditions and be replenished by diesel generation savings during high water conditions. The NWT PUB approved the proposed fund in Decision 1-97.
Loads on both hydro systems are currently sufficiently low such that diesel generation requirements at LTA hydro generation are assumed to relate only to winter peaking, generation maintenance, emergency, and capital project impacts. Under such assumptions, a water-based stabilization fund would only be charged for diesel generation under drought conditions. The fund would not require replenishing when hydro availability is above LTA because the existing low loads
6 Negotiated Settlement cover letter from Howard-Mackie dated November 13, 1996. 7 NTPC 2006/08 Phase I GRA, p. 3-25. Allows 43 GW.h/year added average for Bluefish LTA generation.
North Slave Resiliency Study March 2016
Attachment 1: Reference Point - System Loads & Generation Next 10 to 20 Years A1-7
cannot use the additional hydro generation to reduce diesel generation below LTA expected requirements.
1.2.5 Current NTPC Rate Stabilization Fund (RSF)
In practice today, based on a 2010 directive from the Territorial government, there currently exists a single Territory-wide rider, which is generally implemented when the consolidated fund balance reaches +/- $2.5 million. This rider is calculated to target a zero balance, generally within a 12-month period (without any distinction between targets for fuel price and targets for water portions of the fund).
In accordance with PUB Decision 16-2010, effective December 2010, all individual NTPC rate stabilization funds (Diesel communities, Normal Wells, Inuvik, Taltson, Snare Water, and Snare Fuel) have been consolidated into a single NTPC Territory-wide Consolidated Fuel and Water Rate Stabilization Fund (RSF). The RSF addresses a variety of rate stabilization measures, such as fuel price stabilization and diesel generation stabilization that are affected by hydro generation variations due to water availability.
In the 20012/14 GRA, NTPC included the forecast cost of 1.2 GW.h of diesel generation in the Snare zone [North Slave] revenue requirement.8 During the GRA review process, NTPC confirmed that the cost of any diesel generation above the 1.2 GW.h included in rates is proposed to be charged or credited to the RSF. In Decision 1-2013, the PUB considered the reference to LTA hydro generation of 220 GW.h/year to be redundant in view of NTPC’s proposal that the fund (as applicable to the Snare [North Slave] zone) would capture all diesel cost variances, and it approved the following revised wording of the RSF operation as applicable to the Snare zone:9
"For the Snare Zone, the fuel costs for diesel generation built into base rates will not be charged via the fund, but fuel costs for diesel generation which are greater or less than this level are charged or credited to the fund."
The PUB also stated that with respect to incentives for NTPC to maximize use of the hydro resource,
"The Board continues to be concerned by an RSF mechanism which allows pass through of all diesel costs as this may not provide the appropriate incentive for NTPC to maximize use of the hydro resource. The Board directs NTPC to address the feasibility of NTPC assuming forecast risk on diesel volume variances for the Snare Zone at the time of the next GRA."
Subsequent to Decision 1-2013, the RSF had no way to offset the impact of the recent North Slave drought impacts. NTPC went from a balance of zero in the water stabilization fund in April 2014 to
8 NTPC 2012/14 Phase I GRA, p. 3-19. 9 NWT PUB Decision 1-2013, p. 94.
North Slave Resiliency Study March 2016
Attachment 1: Reference Point - System Loads & Generation Next 10 to 20 Years A1-8
a balance owing from ratepayers of $3.4 million at the end of September 2014, with reservoir levels near record lows and with the expectation that ongoing drought conditions would greatly increase the balance owing from ratepayers.
To address this situation, NTPC filed a September 3, 2014 application for a two-year stabilization fund rate rider to collect a forecast $20 million added cost resulting from over $60 GW.h of additional diesel generation costs that were forecast to be needed due to the record low water conditions. NTPC subsequently withdrew its application when the GNWT agreed to fund the additional $20 million fuel costs for 2014-15. One year later, GNWT provided a further $28 million in 2015-16 to NTPC to offset the increased electricity costs due to the additional diesel generation required as a result of continued drought conditions on the North Slave system.
1.2.6 Existing System Capacity Planning Requirements
The North Slave system capacity planning must satisfy two-part criteria with respect to Required Firm Capacity (RFC):
(i) Loss of Load Expectation (LOLE): to be less than 2.0 hours/year, subject to engineering judgment (as measured by use of the SYSREP software):10 and
(ii) Yellowknife Minimum Diesel “Emergency” or N-1 Criteria: Yellowknife must have sufficient generation capacity to meet the non-industrial peak, plus 5%, with the Snare transmission line L199 out of service11 resulting in the system capacity loss of 29.4 MW.
The Snare System LOLE test (the SYSREP model) was last run in 2013 for NTPC’s internal operational consideration using the North Slave load (with an up to date North Slave load shape) and the L199 unavailability factor. The test concluded that the entire North Slave system’s LOLE load carrying capability was approximately 35.1 MW; and that the peak demand on the system was in order of 36 MW, indicating a slight LOLE shortfall.
With respect to the N-1 criterion, the Snare system N-1 test only includes loads that must be served under the hypothetical stress event (see below). It is based on assessing all generation that could be available on a sustained basis to serve Yellowknife/Dettah under an N-1 event (loss of L199):
• Bluefish at the practical winter planning peak (6.6 MW); and • Jackfish units at maximum continuous ratings, or any NTPC condition-based deratings.
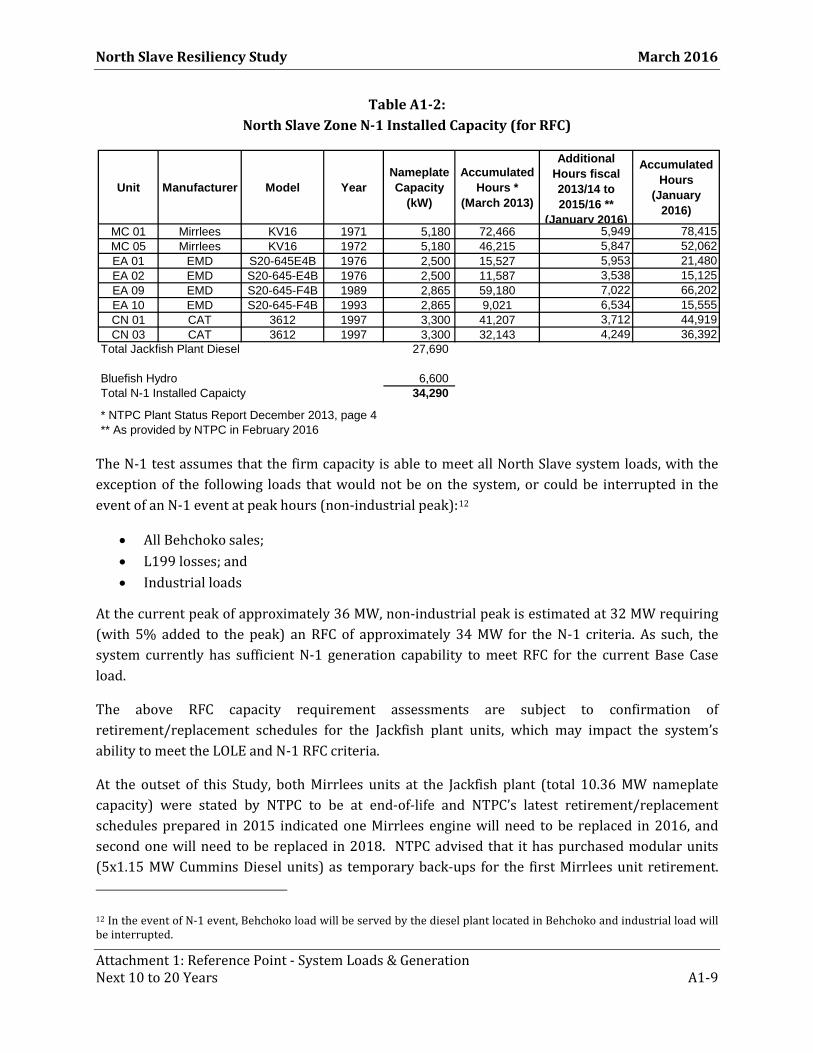
The existing N-1 installed capacity is 34.3 MW as detailed in Table A1-2, ignoring near-term diesel unit retirements.
10 Loss of Load Expectation is measured as expected number of hours in the specified period when a loss of load occurs. 11 Loss of the Snare transmission line (L199) is considered the largest single contingency for the system (or the N-1 event). The N-1 event is determined by engineering judgment.
North Slave Resiliency Study March 2016
Attachment 1: Reference Point - System Loads & Generation Next 10 to 20 Years A1-9
Table A1-2: North Slave Zone N-1 Installed Capacity (for RFC)
The N-1 test assumes that the firm capacity is able to meet all North Slave system loads, with the exception of the following loads that would not be on the system, or could be interrupted in the event of an N-1 event at peak hours (non-industrial peak):12
• All Behchoko sales; • L199 losses; and • Industrial loads
At the current peak of approximately 36 MW, non-industrial peak is estimated at 32 MW requiring (with 5% added to the peak) an RFC of approximately 34 MW for the N-1 criteria. As such, the system currently has sufficient N-1 generation capability to meet RFC for the current Base Case load.
The above RFC capacity requirement assessments are subject to confirmation of retirement/replacement schedules for the Jackfish plant units, which may impact the system’s ability to meet the LOLE and N-1 RFC criteria.
At the outset of this Study, both Mirrlees units at the Jackfish plant (total 10.36 MW nameplate capacity) were stated by NTPC to be at end-of-life and NTPC’s latest retirement/replacement schedules prepared in 2015 indicated one Mirrlees engine will need to be replaced in 2016, and second one will need to be replaced in 2018. NTPC advised that it has purchased modular units (5x1.15 MW Cummins Diesel units) as temporary back-ups for the first Mirrlees unit retirement.
12 In the event of N-1 event, Behchoko load will be served by the diesel plant located in Behchoko and industrial load will be interrupted.
Unit Manufacturer Model YearNameplate Capacity
(kW)
Accumulated Hours *
(March 2013)
Additional Hours fiscal 2013/14 to 2015/16 **
(January 2016)
Accumulated Hours
(January 2016)
MC 01 Mirrlees KV16 1971 5,180 72,466 5,949 78,415MC 05 Mirrlees KV16 1972 5,180 46,215 5,847 52,062EA 01 EMD S20-645E4B 1976 2,500 15,527 5,953 21,480EA 02 EMD S20-645-E4B 1976 2,500 11,587 3,538 15,125EA 09 EMD S20-645-F4B 1989 2,865 59,180 7,022 66,202EA 10 EMD S20-645-F4B 1993 2,865 9,021 6,534 15,555CN 01 CAT 3612 1997 3,300 41,207 3,712 44,919CN 03 CAT 3612 1997 3,300 32,143 4,249 36,392
Total Jackfish Plant Diesel 27,690
Bluefish Hydro 6,600 Total N-1 Installed Capaicty 34,290
* NTPC Plant Status Report December 2013, page 4** As provided by NTPC in February 2016
North Slave Resiliency Study March 2016
Attachment 1: Reference Point - System Loads & Generation Next 10 to 20 Years A1-10
The NWT PUB issued Decision 15-2015 on December 10, 2015 approving a project permit for the purchase and installation of these modular units at the Jackfish plant to replace one of the Mirrlees diesel units. In 2016, NTPC has indicated to the study team that the first Mirrless unit has now been replaced with the purchase of the new modular diesel generation and that the second unit has undergone an overhaul which will potentially extend its life for up to 20 years.
Although the Mirrlees have been the only units that had been scheduled for replacement over the next twenty years, intensive diesel use during the 2014-2016 drought and concurrent long hydro unit overhauls has materially increased accumulated running hours on several diesel units (see Table A1-2). NTPC has bee observing that mid-life gensets can be pushed to end-of-life in a couple of years when run continuously. Long running hours advance block replacements and ultimately scrapping of the units.
1.2.7 Frequency of Yellowknife Power Outages
In September 2012 the NWT PUB initiated a review of the high frequency of power outages in the City of Yellowknife in response to media reports and a number of informal customer complaints. During this review, NTPC identified a number of initiatives that NTPC completed or was undertaking to improve the North Slave system reliability. NTPC indicated it was pursuing a 3-year goal of a 70% reduction in interruption frequency as follows:
• 30% reduction from 2012 in 2013 • 30% reduction from 2013 in 2014 • 30% reduction from 2014 in 2015
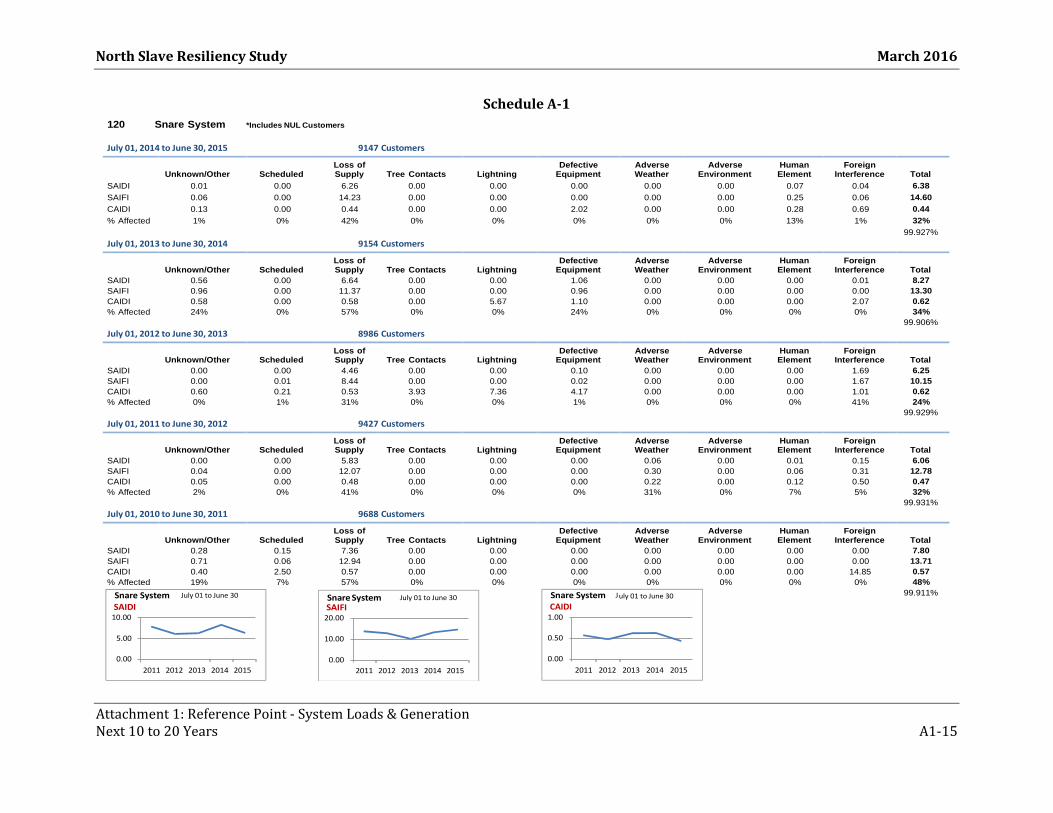
As a means of monitoring the reliability improvement implementation plan, the PUB directed NTPC to file periodic reports with respect to implementation of the North Slave system reliability improvement initiatives. A summary of outages on the North Slave system for 2010-2015 period is provided in Schedule A-1. Review of this summary suggests that outages were mainly caused by loss of supply, which would be caused by generation and transmission tripping/failures.
1.2.8 Base Case Load Forecast – Next 20 Years
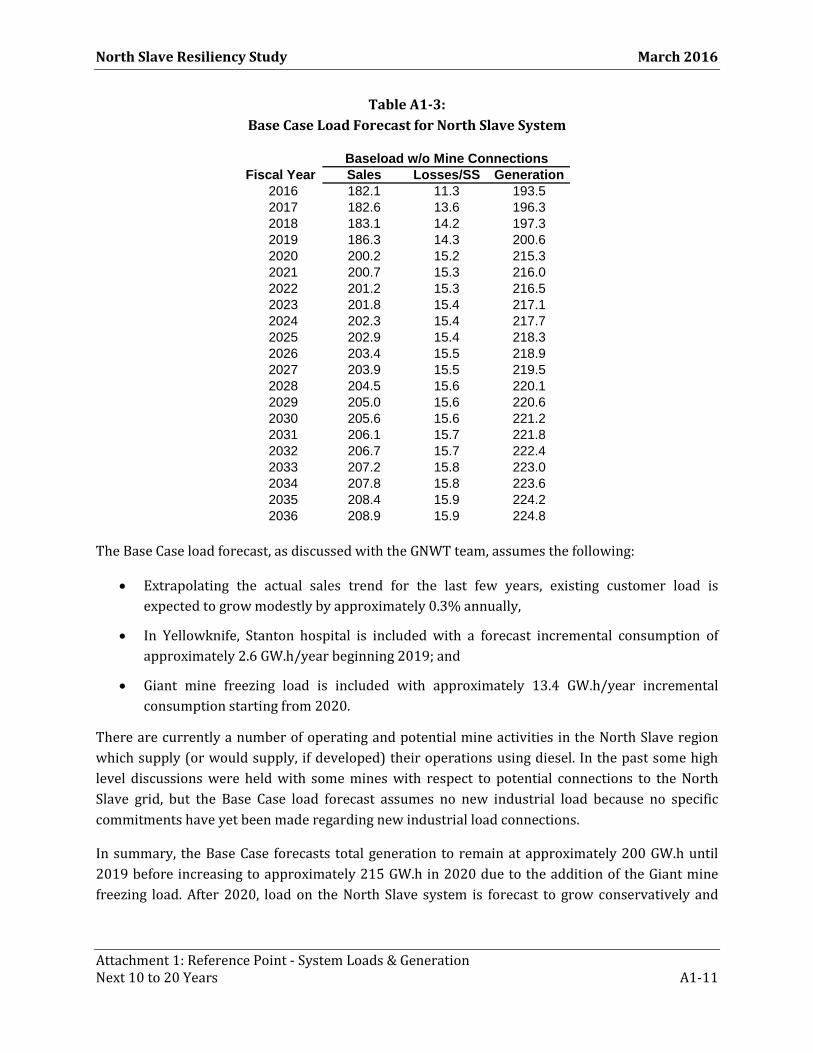
Table A1-3 provides the long term (20-year) Base Case load forecast for the existing customers on the North Slave system.
North Slave Resiliency Study March 2016
Attachment 1: Reference Point - System Loads & Generation Next 10 to 20 Years A1-11
Table A1-3: Base Case Load Forecast for North Slave System
The Base Case load forecast, as discussed with the GNWT team, assumes the following:
• Extrapolating the actual sales trend for the last few years, existing customer load is expected to grow modestly by approximately 0.3% annually,
• In Yellowknife, Stanton hospital is included with a forecast incremental consumption of approximately 2.6 GW.h/year beginning 2019; and
• Giant mine freezing load is included with approximately 13.4 GW.h/year incremental consumption starting from 2020.
There are currently a number of operating and potential mine activities in the North Slave region which supply (or would supply, if developed) their operations using diesel. In the past some high level discussions were held with some mines with respect to potential connections to the North Slave grid, but the Base Case load forecast assumes no new industrial load because no specific commitments have yet been made regarding new industrial load connections.
In summary, the Base Case forecasts total generation to remain at approximately 200 GW.h until 2019 before increasing to approximately 215 GW.h in 2020 due to the addition of the Giant mine freezing load. After 2020, load on the North Slave system is forecast to grow conservatively and
Fiscal Year Sales Losses/SS Generation2016 182.1 11.3 193.52017 182.6 13.6 196.32018 183.1 14.2 197.32019 186.3 14.3 200.62020 200.2 15.2 215.32021 200.7 15.3 216.02022 201.2 15.3 216.52023 201.8 15.4 217.12024 202.3 15.4 217.72025 202.9 15.4 218.32026 203.4 15.5 218.92027 203.9 15.5 219.52028 204.5 15.6 220.12029 205.0 15.6 220.62030 205.6 15.6 221.22031 206.1 15.7 221.82032 206.7 15.7 222.42033 207.2 15.8 223.02034 207.8 15.8 223.62035 208.4 15.9 224.22036 208.9 15.9 224.8
Baseload w/o Mine Connections
North Slave Resiliency Study March 2016
Attachment 1: Reference Point - System Loads & Generation Next 10 to 20 Years A1-12
reach 225 GW.h by 2036. Absent any new industrial connections, the long term North Slave system Base Case load is forecast to remain significantly below pre-2005/06 levels.
The assumed LTA hydro supply availability under the Base Case forecast for existing North Slave system generation remains at 220 GW.h/year, subject to anticipated Bluefish Hydro station upgrades in the near term.13 Under these conditions, North Slave system Base Case loads would remain low enough that diesel generation requirements at LTA hydro generation may be assumed (subject to review as to updated water model assessments) to relate only to sporadic winter peaking, generation maintenance, emergency, and/or capital project impacts, with significant additional diesel generation requirements occurring only under low water conditions.
1.2.8.1 Demand Side Management Impacts on Forecast Loads
In its 2014 Energy Charrette Report response, the GNWT provided a summary of GNWT energy initiatives for 2015-16 as part of the NWT Energy Action Plan.14 GNWT energy initiatives include Energy Conservation and Efficiency programs comprising:
• Energy Efficiency Incentive Program (EEIP) • Commercial Energy Conservation and Efficiency Program (CECEP) • EnerGuide Program • LED Streetlight Conversion Project • Support to Community Governments for Energy Efficiency Retrofits • Identify Power Plant Residual Heat Projects • Core Funding for the Arctic Energy Alliance (AEA)
The EEIP program began May 1, 2014 and rebates all NWT residents for energy efficient product purchases as part of the GNWT’s efforts to increase energy efficiency and help residents to reduce the high cost of energy.
Since 2010, NUL-Yellowknife has also commenced implementation of a program to convert streetlights in the City to LED bulbs.
These energy efficiency programs are relatively recent and an estimate of their overall impact on the future Base Case load in the NWT is not available for the purposes of the current assessment.15 The Base Case load forecast therefore does not reflect any potential impacts of the ongoing and planned demand side management (DSM) programs. Such impacts would reduce generation over
13 Such upgrades are expected as a result of the preliminary investigations undertaken into options to increase capacity and efficiency at the Bluefish Hydro station combined with a new generator to replace the original unit installed in 1942 (see Potential Industrial Load Scenarios). 14 The GNWT Response to the 2014 Energy Charrette Report, p.30 15 NTPC estimated the revenue loss from the implementation of the LED streetlights program in 10 communities to date at approximately $0.234 million/year.
North Slave Resiliency Study March 2016
Attachment 1: Reference Point - System Loads & Generation Next 10 to 20 Years A1-13
the 20-year forecast by increasing surplus hydro generation at LTA water conditions without materially changing the potential need for material diesel generation under low water conditions.
Potential Industrial Load Scenarios - Next 10 Years
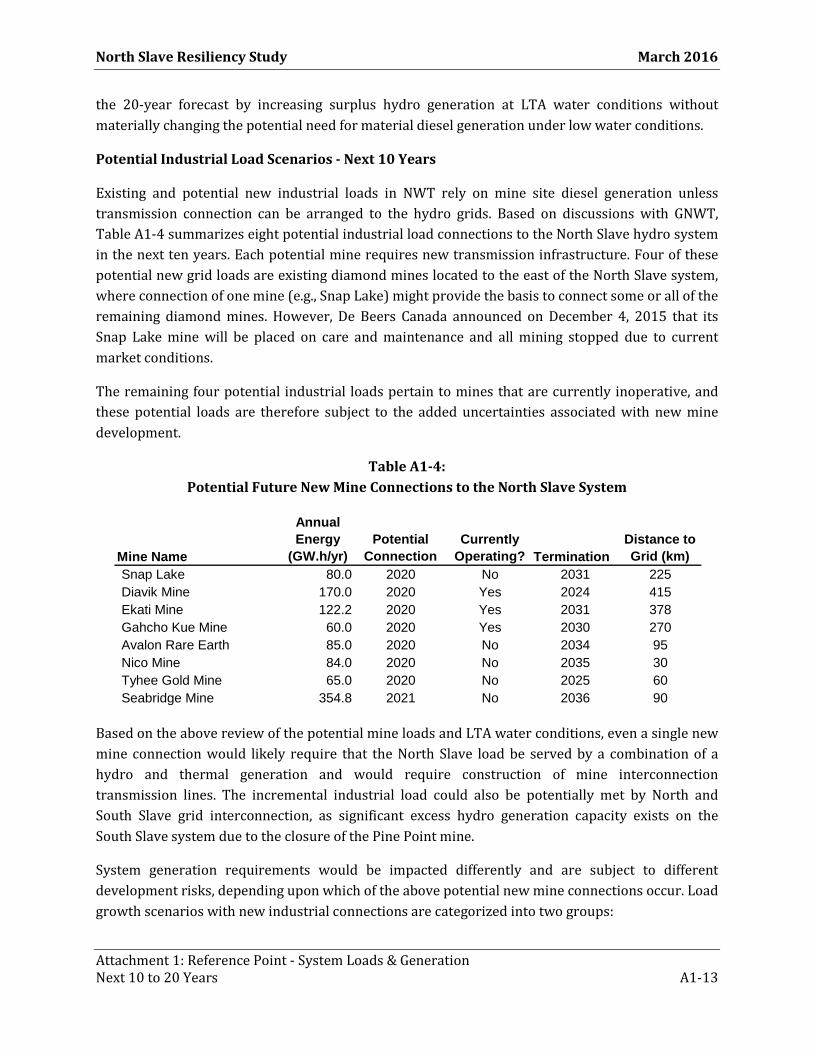
Existing and potential new industrial loads in NWT rely on mine site diesel generation unless transmission connection can be arranged to the hydro grids. Based on discussions with GNWT, Table A1-4 summarizes eight potential industrial load connections to the North Slave hydro system in the next ten years. Each potential mine requires new transmission infrastructure. Four of these potential new grid loads are existing diamond mines located to the east of the North Slave system, where connection of one mine (e.g., Snap Lake) might provide the basis to connect some or all of the remaining diamond mines. However, De Beers Canada announced on December 4, 2015 that its Snap Lake mine will be placed on care and maintenance and all mining stopped due to current market conditions.
The remaining four potential industrial loads pertain to mines that are currently inoperative, and these potential loads are therefore subject to the added uncertainties associated with new mine development.
Table A1-4: Potential Future New Mine Connections to the North Slave System
Based on the above review of the potential mine loads and LTA water conditions, even a single new mine connection would likely require that the North Slave load be served by a combination of a hydro and thermal generation and would require construction of mine interconnection transmission lines. The incremental industrial load could also be potentially met by North and South Slave grid interconnection, as significant excess hydro generation capacity exists on the South Slave system due to the closure of the Pine Point mine.
System generation requirements would be impacted differently and are subject to different development risks, depending upon which of the above potential new mine connections occur. Load growth scenarios with new industrial connections are categorized into two groups:
Mine Name
Annual Energy
(GW.h/yr)Potential
ConnectionCurrently
Operating? TerminationDistance to Grid (km)
Snap Lake 80.0 2020 No 2031 225Diavik Mine 170.0 2020 Yes 2024 415Ekati Mine 122.2 2020 Yes 2031 378Gahcho Kue Mine 60.0 2020 Yes 2030 270Avalon Rare Earth 85.0 2020 No 2034 95Nico Mine 84.0 2020 No 2035 30Tyhee Gold Mine 65.0 2020 No 2025 60Seabridge Mine 354.8 2021 No 2036 90
North Slave Resiliency Study March 2016
Attachment 1: Reference Point - System Loads & Generation Next 10 to 20 Years A1-14
• Load growth due to NTPC actively pursuing industrial load connections from one or more existing diamond mines (which currently employ on-site diesel generation for most or all of their load); and
• Load growth with industrial load connections initiated by the prospective new mines - in this instance, connection involves shorter transmission lines than is needed for the diamond mines, but connection opportunities depend upon the timing for each mine's actual development (which remain very uncertain today).
Overall, the supply and capacity profile assumptions for the North Slave system with any of the potential industrial load scenarios in Table A1-4 could include the following:
• The assumed LTA hydro supply availability for existing North Slave generation remains at 220 GW.h/year (as described above). This represents an approximately 10% increased output compared to the current underutilized generation level of 200 GW.h per year. It is understood that further investigation may enhance this value, considering that the historical hydro generation amounts of this system exceeded 240 GWh in the early 2000s.
• NTPC’s 2016/17 capital plan is expected to include a project with respect to the Bluefish Hydro station upgrades as a result of preliminary investigations undertaken for increasing capacity and efficiency at the Bluefish Hydro station. Options include improving penstock routing and efficiency combined with a new generator to replace the original unit, which was installed in 1942. This project could increase the capacity of the Bluefish station by approximately 3 MW.
• Absent other new renewable generation, the balance of new generation requirements with new industrial load must be supplied by thermal plant. Based on NTPC’s experience in Inuvik LNG generation may be a cost-effective alternative to diesel generation for both mines and NTPC.
• Hydro generation will need to be backed up by sufficient installed firm capacity (diesel, LNG, or other alternatives). Coordinated planning with any connecting mine would likely be important in this regard.
• There may also be grid expansion/interconnection possibilities to benefit from new industrial load. For example, as previously noted, a North and South Slave grid interconnection could make use of the significant excess hydro generation capacity on the South Slave system after the closure of the Pine Point mine.
North Slave Resiliency Study March 2016
Attachment 1: Reference Point - System Loads & Generation Next 10 to 20 Years A1-15
Schedule A-1
SAIDI 10.00
5.00
0.00 2011 2012 2013 2014 2015
Snare System July 01 to June 30 SAIFI
20.00
10.00
0.00 2011 2012 2013 2014 2015
CAIDI 1.00 0.50 0.00
2011 2012 2013 2014 2015
120 Snare System *Includes NUL Customers
July 01, 2014 to June 30, 2015 9147 Customers
Loss of Defective Adverse Adverse Human Foreign Unknown/Other Scheduled Supply Tree Contacts Lightning Equipment Weather Environment Element Interference Total SAIDI 0.01 0.00 6.26 0.00 0.00 0.00 0.00 0.00 0.07 0.04 6.38 SAIFI 0.06 0.00 14.23 0.00 0.00 0.00 0.00 0.00 0.25 0.06 14.60 CAIDI 0.13 0.00 0.44 0.00 0.00 2.02 0.00 0.00 0.28 0.69 0.44 % Affected 1% 0% 42% 0% 0% 0% 0% 0% 13% 1% 32%
99.927% July 01, 2013 to June 30, 2014 9154 Customers
Loss of Defective Adverse Adverse Human Foreign Unknown/Other Scheduled Supply Tree Contacts Lightning Equipment Weather Environment Element Interference Total SAIDI 0.56 0.00 6.64 0.00 0.00 1.06 0.00 0.00 0.00 0.01 8.27 SAIFI 0.96 0.00 11.37 0.00 0.00 0.96 0.00 0.00 0.00 0.00 13.30 CAIDI 0.58 0.00 0.58 0.00 5.67 1.10 0.00 0.00 0.00 2.07 0.62 % Affected 24% 0% 57% 0% 0% 24% 0% 0% 0% 0% 34%
99.906% July 01, 2012 to June 30, 2013 8986 Customers
Loss of Defective Adverse Adverse Human Foreign Unknown/Other Scheduled Supply Tree Contacts Lightning Equipment Weather Environment Element Interference Total SAIDI 0.00 0.00 4.46 0.00 0.00 0.10 0.00 0.00 0.00 1.69 6.25 SAIFI 0.00 0.01 8.44 0.00 0.00 0.02 0.00 0.00 0.00 1.67 10.15 CAIDI 0.60 0.21 0.53 3.93 7.36 4.17 0.00 0.00 0.00 1.01 0.62 % Affected 0% 1% 31% 0% 0% 1% 0% 0% 0% 41% 24%
99.929% July 01, 2011 to June 30, 2012 9427 Customers
Loss of Defective Adverse Adverse Human Foreign Unknown/Other Scheduled Supply Tree Contacts Lightning Equipment Weather Environment Element Interference Total SAIDI 0.00 0.00 5.83 0.00 0.00 0.00 0.06 0.00 0.01 0.15 6.06 SAIFI 0.04 0.00 12.07 0.00 0.00 0.00 0.30 0.00 0.06 0.31 12.78 CAIDI 0.05 0.00 0.48 0.00 0.00 0.00 0.22 0.00 0.12 0.50 0.47 % Affected 2% 0% 41% 0% 0% 0% 31% 0% 7% 5% 32%
99.931% July 01, 2010 to June 30, 2011 9688 Customers
Loss of Defective Adverse Adverse Human Foreign Unknown/Other Scheduled Supply Tree Contacts Lightning Equipment Weather Environment Element Interference Total SAIDI 0.28 0.15 7.36 0.00 0.00 0.00 0.00 0.00 0.00 0.00 7.80 SAIFI 0.71 0.06 12.94 0.00 0.00 0.00 0.00 0.00 0.00 0.00 13.71 CAIDI 0.40 2.50 0.57 0.00 0.00 0.00 0.00 0.00 0.00 14.85 0.57 % Affected 19% 7% 57% 0% 0% 0% 0% 0% 0% 0% 48%
Snare System July 01 to June 30 Snare System J uly 01 to June 30 99.911%
North Slave Resiliency Study March 2016
Attachment 1: Reference Point - System Loads & Generation Next 10 to 20 Years A1-16
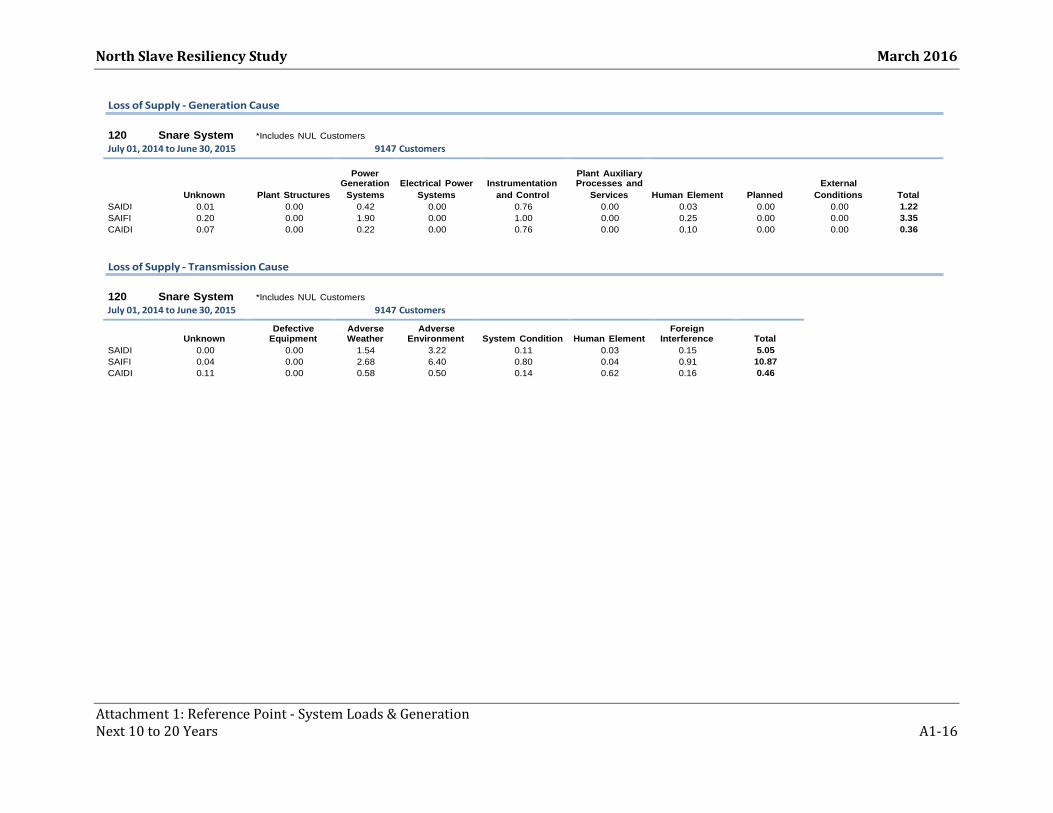
Loss of Supply - Generation Cause
120 Snare System *Includes NUL Customers July 01, 2014 to June 30, 2015 9147 Customers
Power
Plant Auxiliary Generation Electrical Power Instrumentation Processes and External
Unknown Plant Structures Systems Systems and Control Services Human Element Planned Conditions Total SAIDI 0.01 0.00 0.42 0.00 0.76 0.00 0.03 0.00 0.00 1.22 SAIFI 0.20 0.00 1.90 0.00 1.00 0.00 0.25 0.00 0.00 3.35 CAIDI 0.07 0.00 0.22 0.00 0.76 0.00 0.10 0.00 0.00 0.36
Loss of Supply - Transmission Cause
120 Snare System *Includes NUL Customers July 01, 2014 to June 30, 2015 9147 Customers
Defective Adverse Adverse Foreign Unknown Equipment Weather Environment System Condition Human Element Interference Total
SAIDI 0.00 0.00 1.54 3.22 0.11 0.03 0.15 5.05 SAIFI 0.04 0.00 2.68 6.40 0.80 0.04 0.91 10.87 CAIDI 0.11 0.00 0.58 0.50 0.14 0.62 0.16 0.46
ATTACHMENT 2:
HYDROLOGICAL BACKGROUND & ASSESSMENT MANITOBA HYDRO REVIEW
FEBRUARY 2016

NTPC North Slave Resilience Study A High-Level Review of the North Slave System
FEBRUARY 2016
NTPC North Slave Resilience Study February 2016
i
TABLE OF CONTENTS
1. INTRODUCTION ............................................................................................................................ 1
2. SCOPE OF REVIEW ...................................................................................................................... 1
3. MATERIALS AND METHODS ..................................................................................................... 2
3.1 Materials Reviewed ...................................................................................................................................................... 2
3.2 Electronic Records and Data Sources ........................................................................................................... 2
3.3 Model Development and Simulation .............................................................................................................. 3
4. RESULTS .......................................................................................................................................... 6
4.1 Review and Update of LTA Hydro Energy Production (Work Plan Items 1 & 2) ........ 6
4.2 Work Required for Future Detailed Update of Generation Estimate (Work Plan Item 3) ................................................................................................................................................................................................... 9
4.3 Review of Monitoring Network & Forecasting System (Work Plan Item 4) ................. 10
4.4 Options Available to Reduce Diesel Dependency (Work Plan Item 5) ............................. 13
4.5 Climate Change (Work Plan Item 6) ............................................................................................................ 14
5. SUMMARY OF KEY FINDINGS ................................................................................................... 16
APPENDIX A – SCHEMATIC DIAGRAMS OF NORTH SLAVE HYDRO SYSTEM ................. I
APPENDIX B – CLIMATE CHANGE REVIEW ............................................................................... IV
APPENDIX C – PROJECT WORKPLAN AND SCOPING DOCUMENT .............................. XV
NTPC North Slave Resilience Study February 2016
1
1. INTRODUCTION In the North Slave Region of the Northwest Territories, energy needs are met by a combination of hydroelectric generation from the Snare and Bluefish Hydro systems and supplementary diesel generation.
The Snare Hydro system is located on the Snare River and has a total installed capacity of approximately 30MW. It includes four separate hydro plants: Snare Rapids, Snare Falls, Snare Cascades, and Snare Forks. With a live storage of approximately 546 million m3, Big Spruce Lake acts as the reservoir to the system, with Snare Rapids GS setting the flow regime for the remainder of stations in the cascade hydroelectric complex.
The Bluefish Hydro system operates as a run of river plant on the Yellowknife River with two adjacent powerhouses providing total installed capacity of 7.5MW. Located on the McCrea River, a tributary to the Yellowknife River, Duncan Lake operates as a seasonal reservoir to provide additional flows throughout the winter months and has a live storage capacity of approximately 207 million m3.
A line diagram schematic of the Snare and Bluefish Hydro systems are included in Appendix A.
2. SCOPE OF REVIEW For this study, Manitoba Hydro was tasked to conduct a high-level review of the resilience of the North Slave System and identify future work required for a more comprehensive assessment. The following areas were included in the study:
Review past studies and simulations of long-term average (LTA) hydro energy production and provide a high-level update of potential LTA hydro energy production for loads of 255GWh and 200GWh (Work Plan Items 1 & 2)
Identify information and work required to conduct a future detailed LTA update (Work Plan Item 3)
Review existing hydroclimatic data monitoring networks and inflow forecasting systems (Work Plan Item 4)
Identify potential options available to reduce diesel dependency (Work Plan Item 5) Identify information available regarding historical trends, paleo records, and future climate
projections of water supply and extreme events in the region (Work Plan Item 6).
Additional information regarding the scope of work can be found in Appendix C.
NTPC North Slave Resilience Study February 2016
2
3. MATERIALS AND METHODS
3.1 Materials Reviewed Given the scope of work and available timeline, a large portion of this study comprised of a review of past modeling studies, hydrologic records, and documentation of hydro system characteristics. The Government of Northwest Territories provided five main attachments summarizing the information available from NTPC. In addition to this resource, the following materials were obtained through information requests and online sources to aid in this study:
AMEC (2003). Runoff Forecasting Procedures: Snare Hydro System. Submitted to Northwest Territories Power Corporation, Yellowknife, NT. AMEC Reference RC-C-141208-11.01 Rev. A. 31 pgs.
EBA Engineering Consultants Ltd (2005). 2005 Dam Safety Review: Bluefish Dam and Duncan Dam. Draft Report. Job # 1700176, 176 pgs.
EBA Engineering Consultants Ltd (2012). Bluefish Replacement Dam Design Report. EBA File E14101129.004. 301 pgs.
Helwig, P.C. (1996). Preliminary Planning Study: Snare Yellowknife System Expansion. Northwest Territories Power Corporation, Hay River, NT. 71pgs
Helwig, P.C. (1998). Upper Snare Site 7 Hydroelectric Project: Critical Review of NKSL’s Report. Northwest Territories Power Corporation, Yellowknife, NT. 72pgs.
Klohn Crippen Berger (2006). Snare Hydro System Comprehensive Dam Safety Review. 321 pgs. Kokelj (2003). Hydrologic Overview of the North and South Slave Regions. Water Resources
Division, Indian and Northern Affairs Canada, Yellowknife, NT. 50 pgs. MVLWB (2012). Amendment of Type A Water Licence: Bluefish Power Generation Facilities.
Water Licence MV2005L4-0008. NTPC. Water Management and Operating Plans filed with MLWB and WLWB for Snare Hydro
and Bluefish Hydro: 2009 – 2015. Steed, C. (2015). Personal Communication to D. Mahon Re: Bluefish Forecasting Procedure.
3.2 Electronic Records and Data Sources The following electronic records were provided by Intergroup and GNWT for this study:
Daily Hydraulic and Energy Production Data for Snare and Bluefish Hydro (2011 – 2014) Big Spruce Lake Weekly water levels (1950 – 2014) Big Spruce Lake Monthly Inflow Data (1950 – 2014) Bluefish and Duncan Lake Water level data (1975/1987 – 2014) Bluefish and Duncan Lake Flow Data (2006 – 2010) Bluefish Monthly Average Powerflow Data (1982 – 1988). Yellowknife River flow data (1939-2014)
The following additional online resources were also used:
Water Survey of Canada National Water Data Archive HYDAT Database: http://www.ec.gc.ca/rhc-wsc/default.asp?lang=En&n=9018B5EC-1
Environment Canada Historical Climate Data Archive: http://climate.weather.gc.ca/index_e.html Government of Northwest Territories Snow Survey Database:
http://www.enr.gov.nt.ca/programs/snow-surveys/spreadsheet-summary
NTPC North Slave Resilience Study February 2016
3
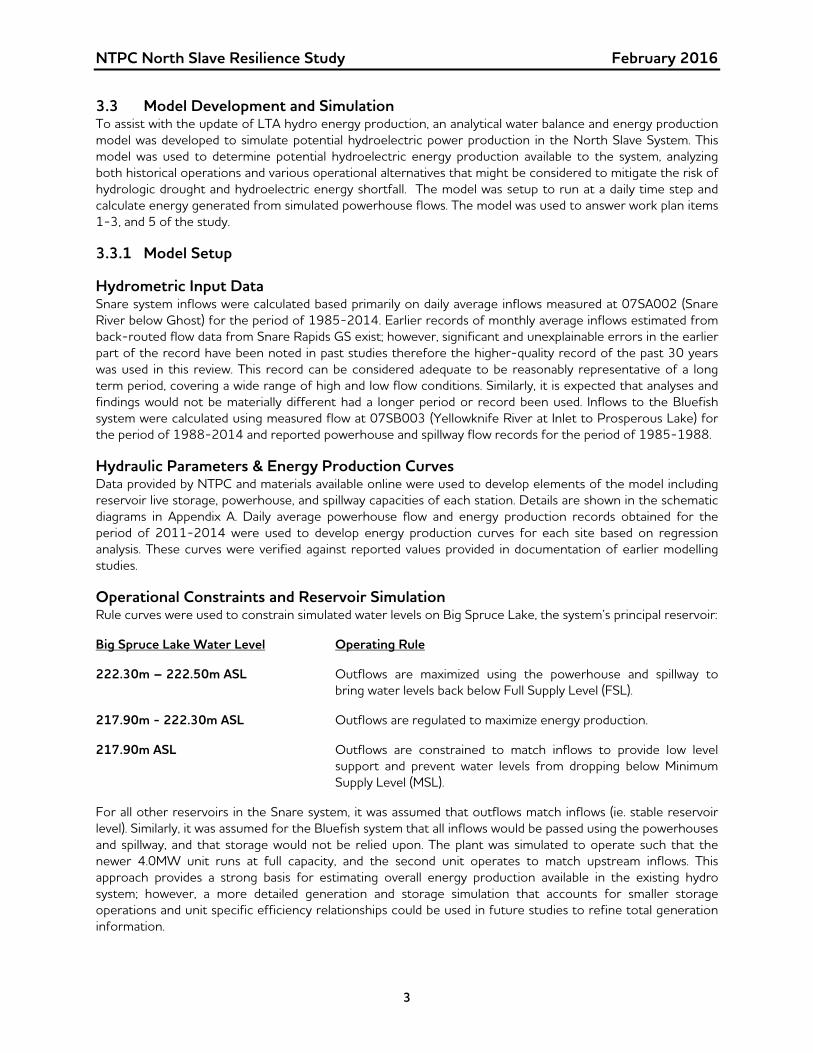
3.3 Model Development and Simulation To assist with the update of LTA hydro energy production, an analytical water balance and energy production model was developed to simulate potential hydroelectric power production in the North Slave System. This model was used to determine potential hydroelectric energy production available to the system, analyzing both historical operations and various operational alternatives that might be considered to mitigate the risk of hydrologic drought and hydroelectric energy shortfall. The model was setup to run at a daily time step and calculate energy generated from simulated powerhouse flows. The model was used to answer work plan items 1-3, and 5 of the study.
3.3.1 Model Setup
Hydrometric Input Data Snare system inflows were calculated based primarily on daily average inflows measured at 07SA002 (Snare River below Ghost) for the period of 1985-2014. Earlier records of monthly average inflows estimated from back-routed flow data from Snare Rapids GS exist; however, significant and unexplainable errors in the earlier part of the record have been noted in past studies therefore the higher-quality record of the past 30 years was used in this review. This record can be considered adequate to be reasonably representative of a long term period, covering a wide range of high and low flow conditions. Similarly, it is expected that analyses and findings would not be materially different had a longer period or record been used. Inflows to the Bluefish system were calculated using measured flow at 07SB003 (Yellowknife River at Inlet to Prosperous Lake) for the period of 1988-2014 and reported powerhouse and spillway flow records for the period of 1985-1988.
Hydraulic Parameters & Energy Production Curves Data provided by NTPC and materials available online were used to develop elements of the model including reservoir live storage, powerhouse, and spillway capacities of each station. Details are shown in the schematic diagrams in Appendix A. Daily average powerhouse flow and energy production records obtained for the period of 2011-2014 were used to develop energy production curves for each site based on regression analysis. These curves were verified against reported values provided in documentation of earlier modelling studies.
Operational Constraints and Reservoir Simulation Rule curves were used to constrain simulated water levels on Big Spruce Lake, the system’s principal reservoir:
Big Spruce Lake Water Level Operating Rule
222.30m – 222.50m ASL Outflows are maximized using the powerhouse and spillway to bring water levels back below Full Supply Level (FSL).
217.90m - 222.30m ASL Outflows are regulated to maximize energy production.
217.90m ASL Outflows are constrained to match inflows to provide low level support and prevent water levels from dropping below Minimum Supply Level (MSL).
For all other reservoirs in the Snare system, it was assumed that outflows match inflows (ie. stable reservoir level). Similarly, it was assumed for the Bluefish system that all inflows would be passed using the powerhouses and spillway, and that storage would not be relied upon. The plant was simulated to operate such that the newer 4.0MW unit runs at full capacity, and the second unit operates to match upstream inflows. This approach provides a strong basis for estimating overall energy production available in the existing hydro system; however, a more detailed generation and storage simulation that accounts for smaller storage operations and unit specific efficiency relationships could be used in future studies to refine total generation information.
NTPC North Slave Resilience Study February 2016
4
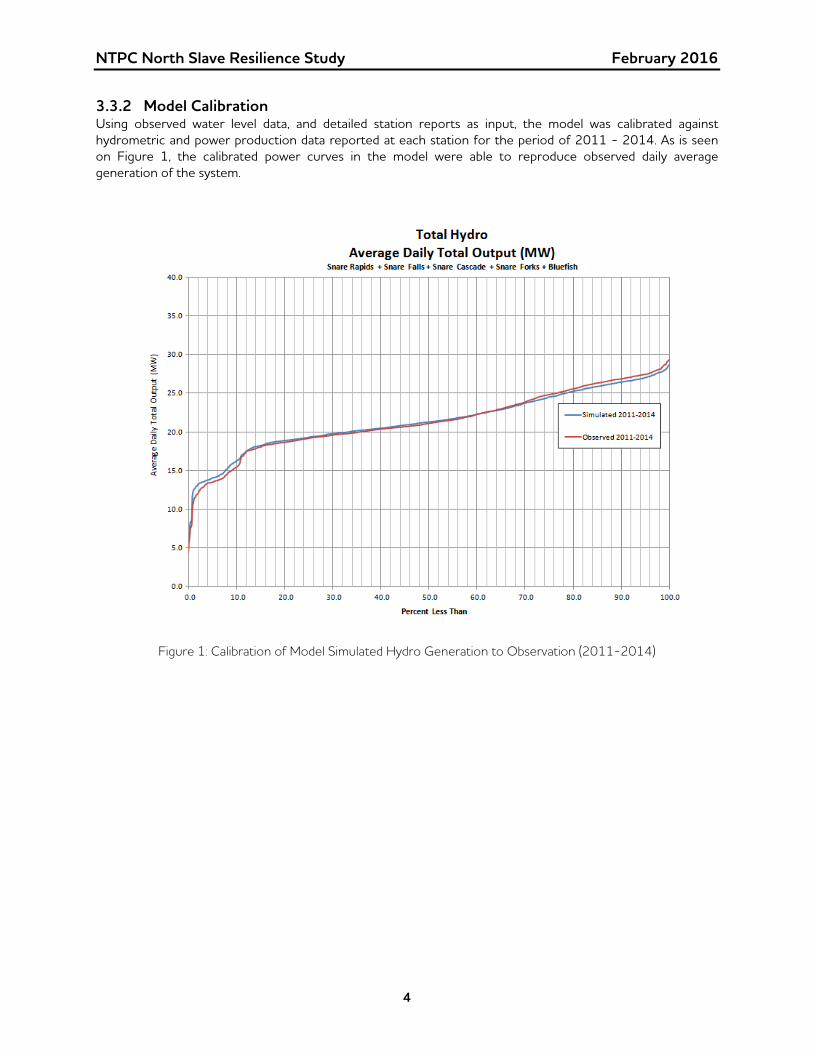
3.3.2 Model Calibration Using observed water level data, and detailed station reports as input, the model was calibrated against hydrometric and power production data reported at each station for the period of 2011 - 2014. As is seen on Figure 1, the calibrated power curves in the model were able to reproduce observed daily average generation of the system.
Figure 1: Calibration of Model Simulated Hydro Generation to Observation (2011-2014)
NTPC North Slave Resilience Study February 2016
5
3.3.3 Comparison to Historical Operations Using the calibrated model, a simulation over the 30 period of record (1985-2014) was conducted with the objective to maximize hydro generation and determine the full hydro potential available in the existing system. The simulation provides an estimate of the idealized maximum generation available, without consideration of forced or maintenance outages, must-run diesel operations, or detailed constraints related to the supply/demand balance. Supply/demand balance considerations include meeting peak load hour demand, modelling any capacity limitations (e.g., energy limited peak cycling of hydro generation or forced outages) or minimum generation constraints where there is insufficient load to run maximum hydro generation after reducing diesel generation. In essence, the simulation is an energy model that assumes there is sufficient load available, net of diesel generation, to consume full hydro station capability. The model also assumes that sufficient diesel capacity and energy is available such that storage need not be conserved for later use.
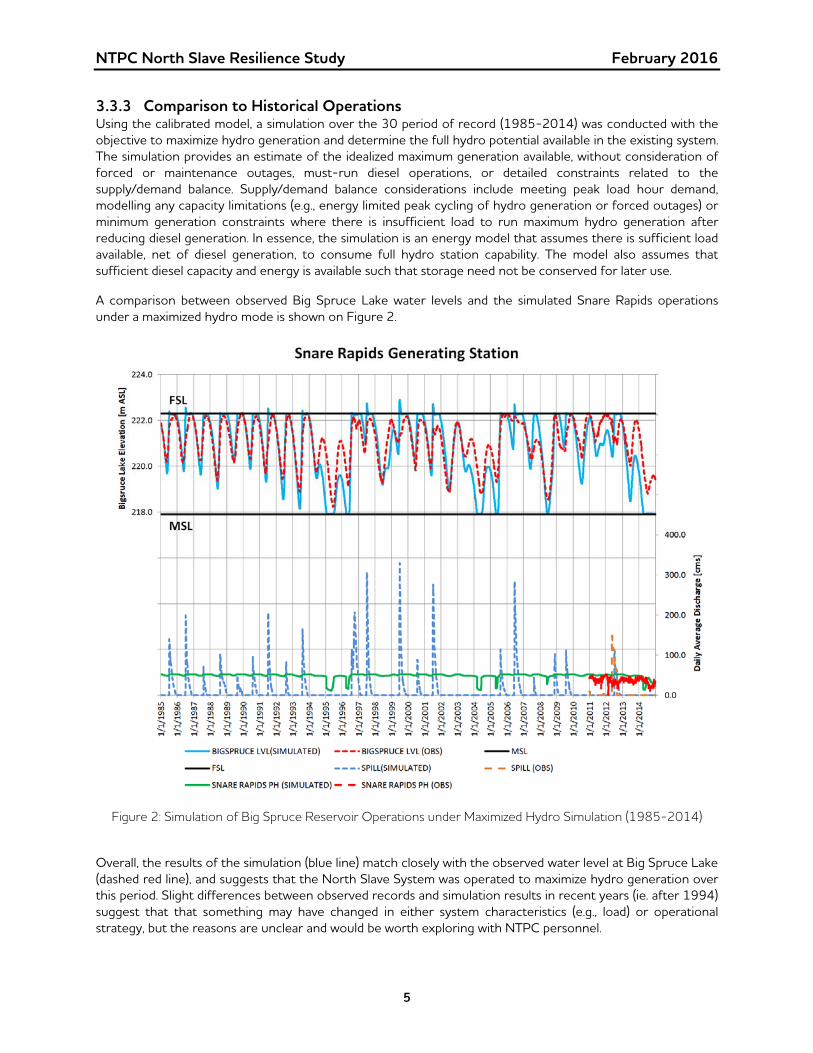
A comparison between observed Big Spruce Lake water levels and the simulated Snare Rapids operations under a maximized hydro mode is shown on Figure 2.
Figure 2: Simulation of Big Spruce Reservoir Operations under Maximized Hydro Simulation (1985-2014)
Overall, the results of the simulation (blue line) match closely with the observed water level at Big Spruce Lake (dashed red line), and suggests that the North Slave System was operated to maximize hydro generation over this period. Slight differences between observed records and simulation results in recent years (ie. after 1994) suggest that that something may have changed in either system characteristics (e.g., load) or operational strategy, but the reasons are unclear and would be worth exploring with NTPC personnel.
NTPC North Slave Resilience Study February 2016
6
4. RESULTS
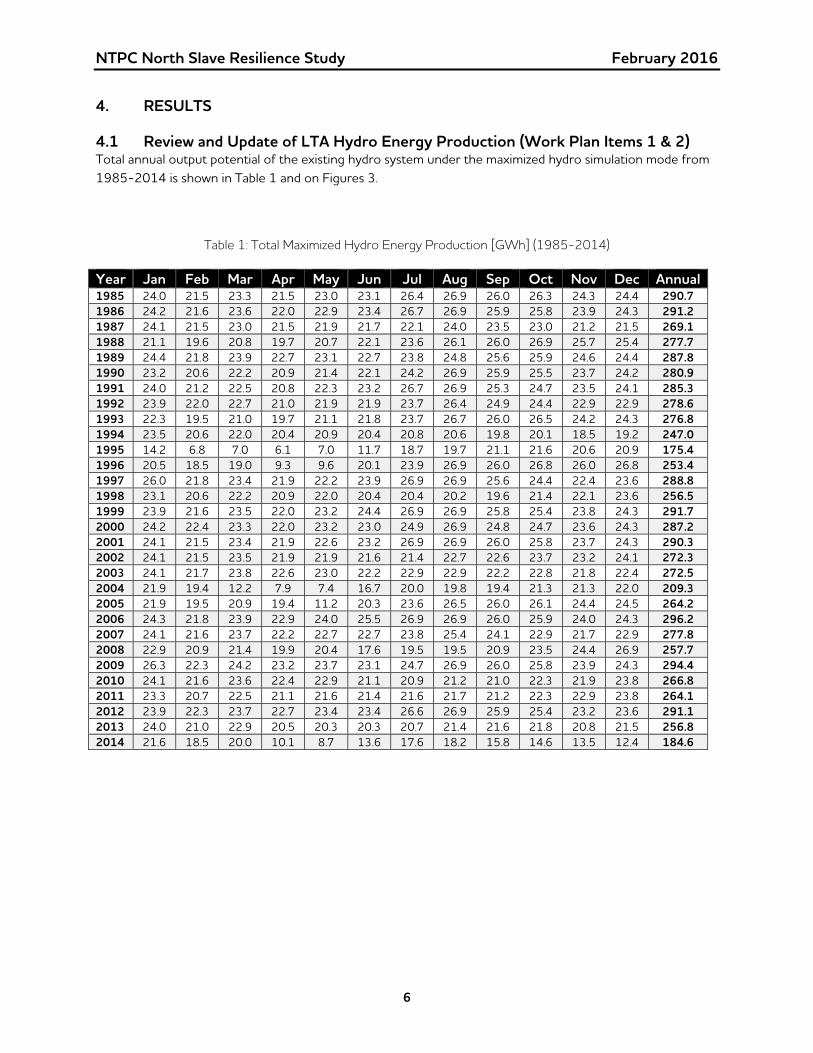
4.1 Review and Update of LTA Hydro Energy Production (Work Plan Items 1 & 2) Total annual output potential of the existing hydro system under the maximized hydro simulation mode from 1985-2014 is shown in Table 1 and on Figures 3.
Table 1: Total Maximized Hydro Energy Production [GWh] (1985-2014)
Year Jan Feb Mar Apr May Jun Jul Aug Sep Oct Nov Dec Annual1985 24.0 21.5 23.3 21.5 23.0 23.1 26.4 26.9 26.0 26.3 24.3 24.4 290.7 1986 24.2 21.6 23.6 22.0 22.9 23.4 26.7 26.9 25.9 25.8 23.9 24.3 291.2 1987 24.1 21.5 23.0 21.5 21.9 21.7 22.1 24.0 23.5 23.0 21.2 21.5 269.1 1988 21.1 19.6 20.8 19.7 20.7 22.1 23.6 26.1 26.0 26.9 25.7 25.4 277.7 1989 24.4 21.8 23.9 22.7 23.1 22.7 23.8 24.8 25.6 25.9 24.6 24.4 287.8 1990 23.2 20.6 22.2 20.9 21.4 22.1 24.2 26.9 25.9 25.5 23.7 24.2 280.9 1991 24.0 21.2 22.5 20.8 22.3 23.2 26.7 26.9 25.3 24.7 23.5 24.1 285.3 1992 23.9 22.0 22.7 21.0 21.9 21.9 23.7 26.4 24.9 24.4 22.9 22.9 278.6 1993 22.3 19.5 21.0 19.7 21.1 21.8 23.7 26.7 26.0 26.5 24.2 24.3 276.8 1994 23.5 20.6 22.0 20.4 20.9 20.4 20.8 20.6 19.8 20.1 18.5 19.2 247.0 1995 14.2 6.8 7.0 6.1 7.0 11.7 18.7 19.7 21.1 21.6 20.6 20.9 175.4 1996 20.5 18.5 19.0 9.3 9.6 20.1 23.9 26.9 26.0 26.8 26.0 26.8 253.4 1997 26.0 21.8 23.4 21.9 22.2 23.9 26.9 26.9 25.6 24.4 22.4 23.6 288.8 1998 23.1 20.6 22.2 20.9 22.0 20.4 20.4 20.2 19.6 21.4 22.1 23.6 256.5 1999 23.9 21.6 23.5 22.0 23.2 24.4 26.9 26.9 25.8 25.4 23.8 24.3 291.7 2000 24.2 22.4 23.3 22.0 23.2 23.0 24.9 26.9 24.8 24.7 23.6 24.3 287.2 2001 24.1 21.5 23.4 21.9 22.6 23.2 26.9 26.9 26.0 25.8 23.7 24.3 290.3 2002 24.1 21.5 23.5 21.9 21.9 21.6 21.4 22.7 22.6 23.7 23.2 24.1 272.3 2003 24.1 21.7 23.8 22.6 23.0 22.2 22.9 22.9 22.2 22.8 21.8 22.4 272.5 2004 21.9 19.4 12.2 7.9 7.4 16.7 20.0 19.8 19.4 21.3 21.3 22.0 209.3 2005 21.9 19.5 20.9 19.4 11.2 20.3 23.6 26.5 26.0 26.1 24.4 24.5 264.2 2006 24.3 21.8 23.9 22.9 24.0 25.5 26.9 26.9 26.0 25.9 24.0 24.3 296.2 2007 24.1 21.6 23.7 22.2 22.7 22.7 23.8 25.4 24.1 22.9 21.7 22.9 277.8 2008 22.9 20.9 21.4 19.9 20.4 17.6 19.5 19.5 20.9 23.5 24.4 26.9 257.7 2009 26.3 22.3 24.2 23.2 23.7 23.1 24.7 26.9 26.0 25.8 23.9 24.3 294.4 2010 24.1 21.6 23.6 22.4 22.9 21.1 20.9 21.2 21.0 22.3 21.9 23.8 266.8 2011 23.3 20.7 22.5 21.1 21.6 21.4 21.6 21.7 21.2 22.3 22.9 23.8 264.1 2012 23.9 22.3 23.7 22.7 23.4 23.4 26.6 26.9 25.9 25.4 23.2 23.6 291.1 2013 24.0 21.0 22.9 20.5 20.3 20.3 20.7 21.4 21.6 21.8 20.8 21.5 256.8 2014 21.6 18.5 20.0 10.1 8.7 13.6 17.6 18.2 15.8 14.6 13.5 12.4 184.6
NTPC North Slave Resilience Study February 2016
7
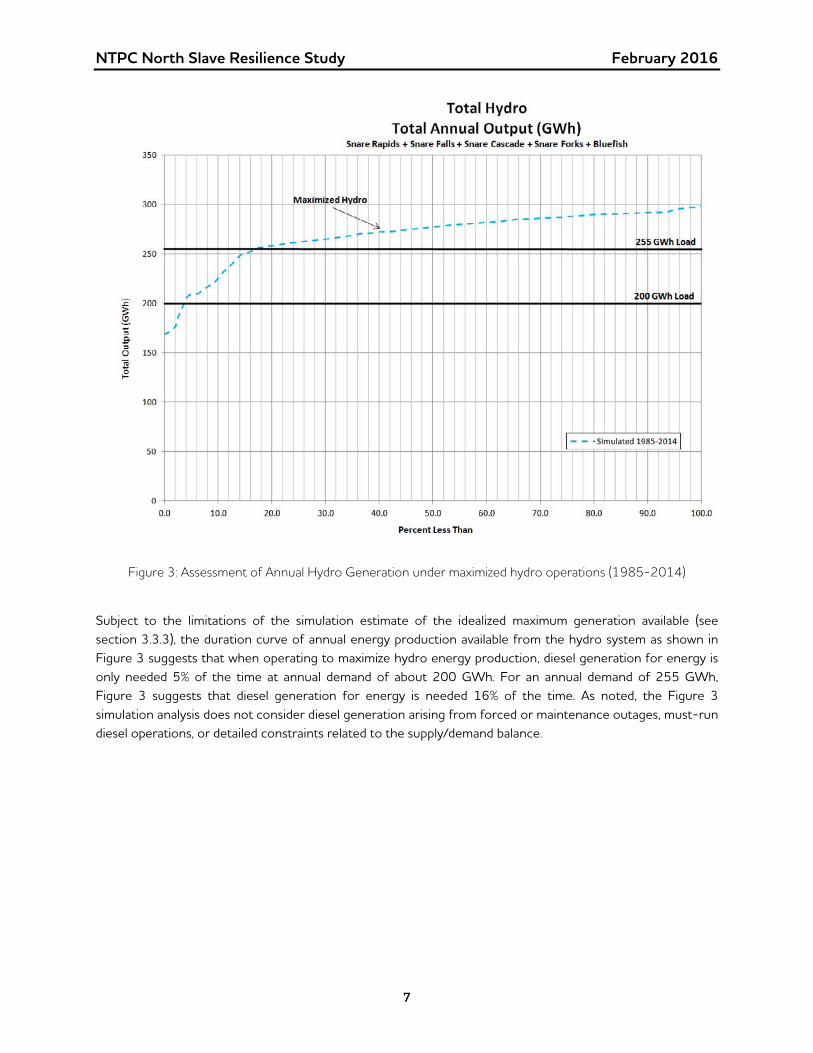
Figure 3: Assessment of Annual Hydro Generation under maximized hydro operations (1985-2014)
Subject to the limitations of the simulation estimate of the idealized maximum generation available (see section 3.3.3), the duration curve of annual energy production available from the hydro system as shown in Figure 3 suggests that when operating to maximize hydro energy production, diesel generation for energy is only needed 5% of the time at annual demand of about 200 GWh. For an annual demand of 255 GWh, Figure 3 suggests that diesel generation for energy is needed 16% of the time. As noted, the Figure 3 simulation analysis does not consider diesel generation arising from forced or maintenance outages, must-run diesel operations, or detailed constraints related to the supply/demand balance.
NTPC North Slave Resilience Study February 2016
8
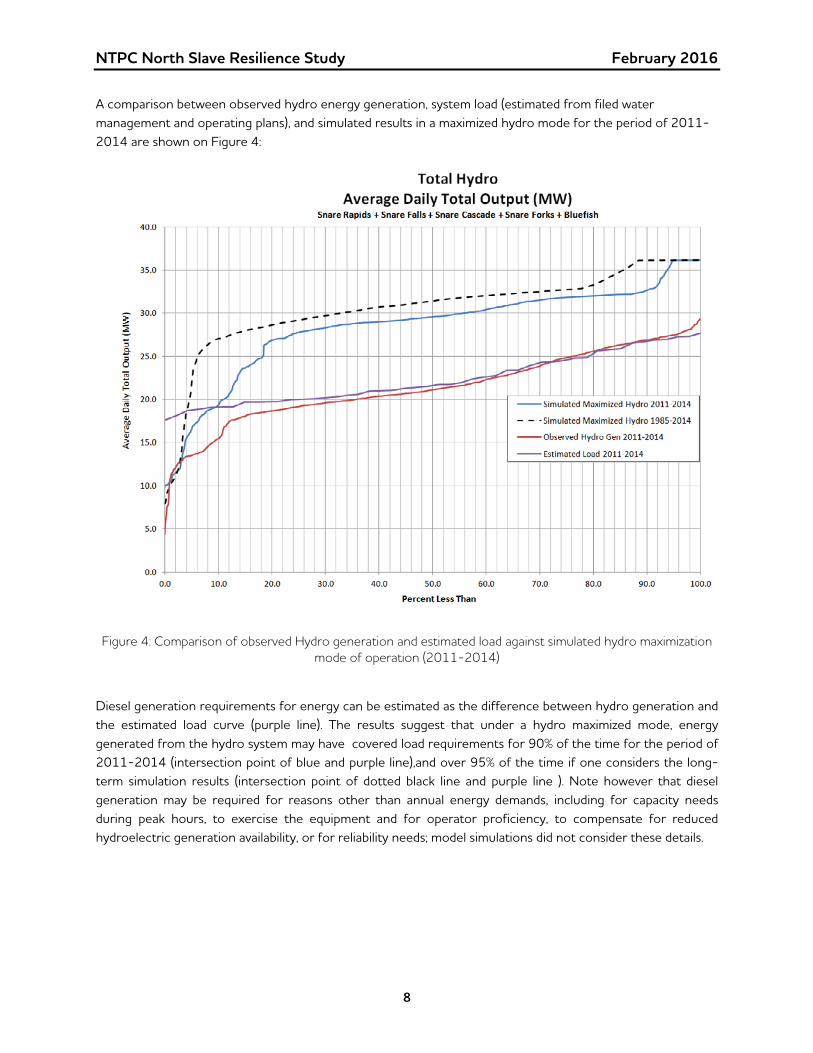
A comparison between observed hydro energy generation, system load (estimated from filed water management and operating plans), and simulated results in a maximized hydro mode for the period of 2011-2014 are shown on Figure 4:
Figure 4: Comparison of observed Hydro generation and estimated load against simulated hydro maximization mode of operation (2011-2014)
Diesel generation requirements for energy can be estimated as the difference between hydro generation and the estimated load curve (purple line). The results suggest that under a hydro maximized mode, energy generated from the hydro system may have covered load requirements for 90% of the time for the period of 2011-2014 (intersection point of blue and purple line),and over 95% of the time if one considers the long-term simulation results (intersection point of dotted black line and purple line ). Note however that diesel generation may be required for reasons other than annual energy demands, including for capacity needs during peak hours, to exercise the equipment and for operator proficiency, to compensate for reduced hydroelectric generation availability, or for reliability needs; model simulations did not consider these details.
NTPC North Slave Resilience Study February 2016
9
4.2 Work Required for Future Detailed Update of Generation Estimate (Work Plan Item 3)
While the modeling work conducted to date provides a good basis to investigate drought resiliency in the North Slave System, additional studies should be performed in the future to confirm these preliminary findings and refine estimates of LTA for system planning studies. Some items to address in future work are listed in the following subsections.
4.2.1 Detailed assessment of supply/demand balance in the North Slave System. The current study assumes that demand in the North Slave system is available to use hydro generation at all times; however, seasonal, monthly, weekly, and hourly fluctuations in energy demand or requirements to run diesel generation for reasons other than energy (e.g. to exercise the equipment) may reduce the overall efficiency of a hydro-maximized operating regime.
A detailed supply/demand analysis may identify minimum loading conditions where hydro generation must be backed down at times (after diesel is minimized), thus incurring more spill.
Conversely to the minimum generation detail at low load periods, under very low inflow conditions, it may be necessary to store water in advance of winter peak load such that peak demands can be met with hydro and diesel resources. Storing water by reducing generation may subsequently result in increased spilled generation if inflow conditions were to transition to above average.
4.2.2 Review of historical unit dispatch, maintenance and forced outage rates The preliminary assessment assumed 100% hydro unit availability and optimized turbine efficiencies. Further analysis would be required to determine how closely actual plant operations and system conditions match these idealized assumptions. Without additional information and further analysis, it is not possible to completely discern between lost hydro generation due to sub-optimal operations, outages, and reductions in domestic load.
4.2.3 Optimization of Duncan Lake Reservoir in conjunction with Big Spruce Lake This preliminary analysis focused on maximizing energy production through Big Spruce Lake operations; however, it should be noted that Duncan Lake is a large reservoir for the Bluefish system, and that further maximization of hydro energy production could potentially be achieved by optimally operating both reservoirs and related generation facilities as part of one system; again, the objective would be to minimize diesel generation over the long-term. Further studies could identify the potential benefits that could be realized through multi-reservoir optimization of the Snare and Bluefish Hydro systems.
NTPC North Slave Resilience Study February 2016
10
4.3 Review of Monitoring Network & Forecasting System (Work Plan Item 4) Based on the hydrometric records obtained and reports documenting the existing inflow forecasting procedure, the following observations can be made regarding the existing monitoring network and forecasting system (see subsections below).
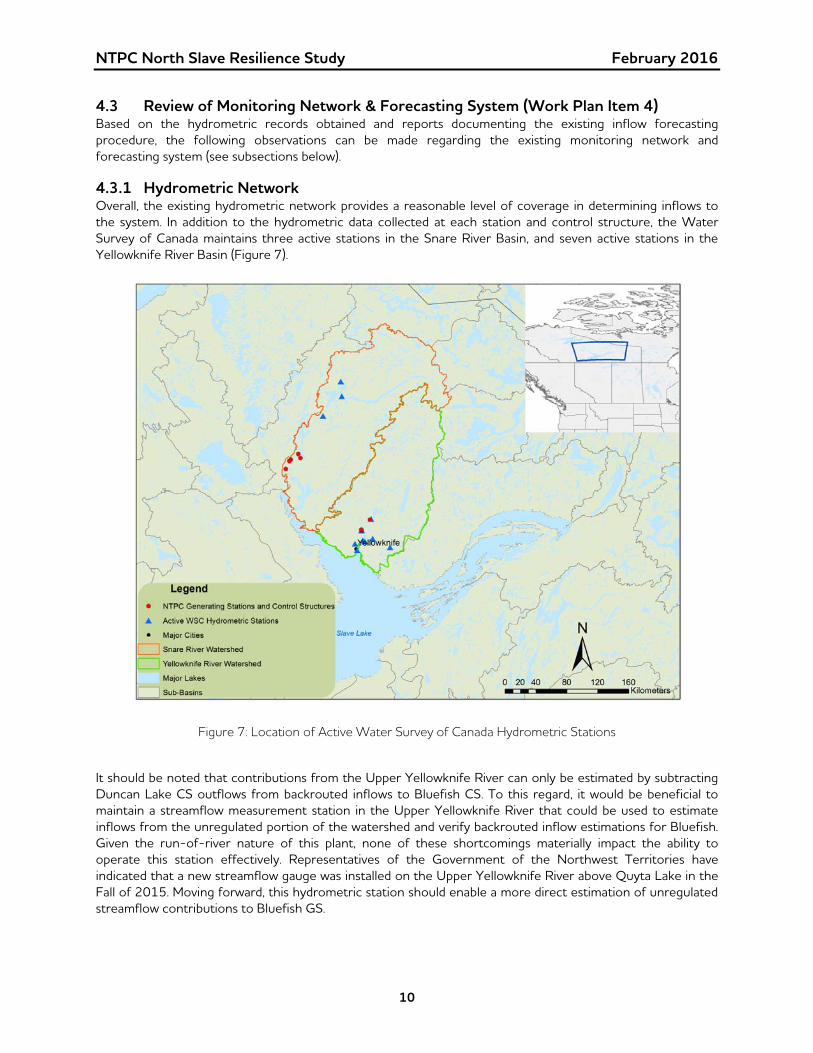
4.3.1 Hydrometric Network Overall, the existing hydrometric network provides a reasonable level of coverage in determining inflows to the system. In addition to the hydrometric data collected at each station and control structure, the Water Survey of Canada maintains three active stations in the Snare River Basin, and seven active stations in the Yellowknife River Basin (Figure 7).
Figure 7: Location of Active Water Survey of Canada Hydrometric Stations
It should be noted that contributions from the Upper Yellowknife River can only be estimated by subtracting Duncan Lake CS outflows from backrouted inflows to Bluefish CS. To this regard, it would be beneficial to maintain a streamflow measurement station in the Upper Yellowknife River that could be used to estimate inflows from the unregulated portion of the watershed and verify backrouted inflow estimations for Bluefish. Given the run-of-river nature of this plant, none of these shortcomings materially impact the ability to operate this station effectively. Representatives of the Government of the Northwest Territories have indicated that a new streamflow gauge was installed on the Upper Yellowknife River above Quyta Lake in the Fall of 2015. Moving forward, this hydrometric station should enable a more direct estimation of unregulated streamflow contributions to Bluefish GS.
NTPC North Slave Resilience Study February 2016
11
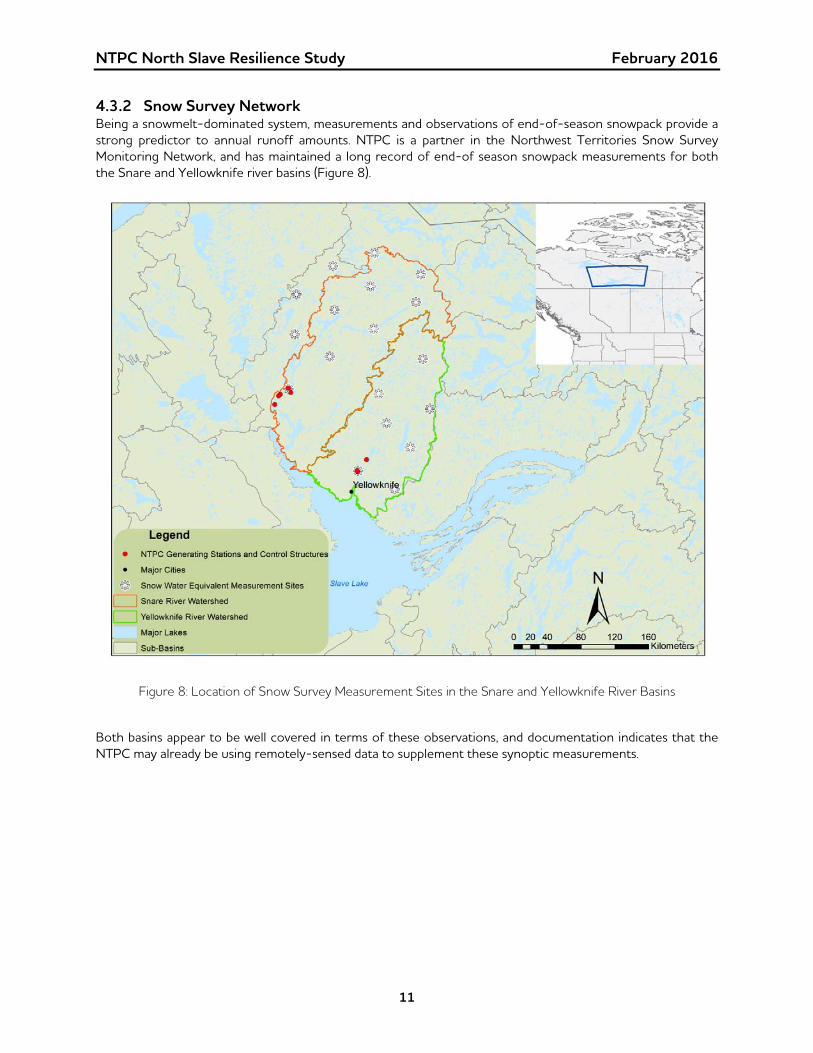
4.3.2 Snow Survey Network Being a snowmelt-dominated system, measurements and observations of end-of-season snowpack provide a strong predictor to annual runoff amounts. NTPC is a partner in the Northwest Territories Snow Survey Monitoring Network, and has maintained a long record of end-of season snowpack measurements for both the Snare and Yellowknife river basins (Figure 8).
Figure 8: Location of Snow Survey Measurement Sites in the Snare and Yellowknife River Basins
Both basins appear to be well covered in terms of these observations, and documentation indicates that the NTPC may already be using remotely-sensed data to supplement these synoptic measurements.
NTPC North Slave Resilience Study February 2016
12
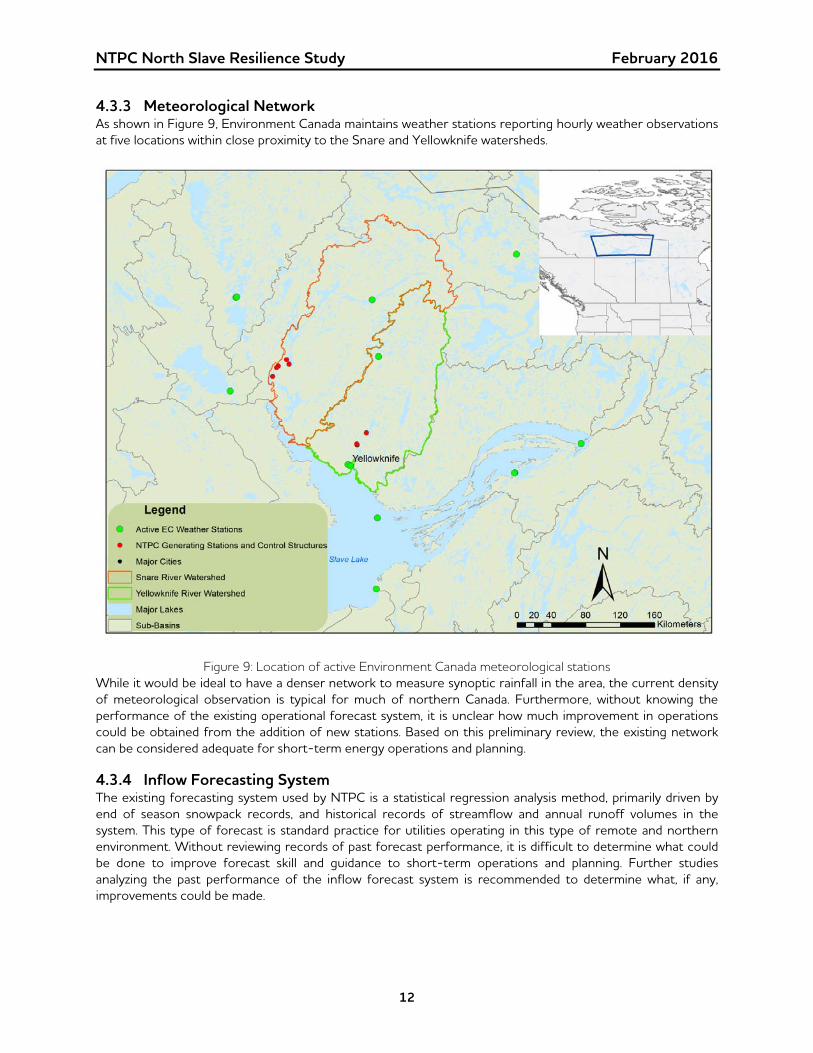
4.3.3 Meteorological Network As shown in Figure 9, Environment Canada maintains weather stations reporting hourly weather observations at five locations within close proximity to the Snare and Yellowknife watersheds.
Figure 9: Location of active Environment Canada meteorological stations While it would be ideal to have a denser network to measure synoptic rainfall in the area, the current density of meteorological observation is typical for much of northern Canada. Furthermore, without knowing the performance of the existing operational forecast system, it is unclear how much improvement in operations could be obtained from the addition of new stations. Based on this preliminary review, the existing network can be considered adequate for short-term energy operations and planning.
4.3.4 Inflow Forecasting System The existing forecasting system used by NTPC is a statistical regression analysis method, primarily driven by end of season snowpack records, and historical records of streamflow and annual runoff volumes in the system. This type of forecast is standard practice for utilities operating in this type of remote and northern environment. Without reviewing records of past forecast performance, it is difficult to determine what could be done to improve forecast skill and guidance to short-term operations and planning. Further studies analyzing the past performance of the inflow forecast system is recommended to determine what, if any, improvements could be made.
NTPC North Slave Resilience Study February 2016
13
4.4 Options Available to Reduce Diesel Dependency (Work Plan Item 5) Based on the results of the hydro-maximized simulation and available documentation of future resources available in the system, several options were identified as having the potential to reduce diesel generation. These options are discussed in the following subsections.
4.4.1 Operational Strategy and Decision Support System A comparison between historical observation and simulated operations under a hydro-maximized mode are shown on Figure 2 in Section 3.3.3.
Overall, the results of the simulation match closely with the observed records available and this suggests that the North Slave System was operated to maximize hydro generation over this period. In more recent years, post 1994, the simulation results do not appear to match the observed record as closely as the simulation matched the observed record prior to 1994. The reasons for this variation are not readily apparent.
A potential reason for this variation may be related to the operational strategy adopted under low-flow conditions. The hydro maximized simulation shows a deeper cycling of the reservoir compared to the observed record, which may be an indication of objectives used in the decision support system to protect against the costs of a major drought when below-average inflow or short-term drought conditions are anticipated. Time constraints and data limitations did not allow for a fulsome review of these items and it is recommended that the current system operation strategy and decision support system be reviewed in future studies.
4.4.2 Additional Storage and New Hydro Generation Development The existing system storage volume available is relatively large compared to river flows, but is not likely to eliminate all diesel generation requirements, as diesel generation will continue to be required to meet peak loads, and outage conditions.
The value of additional storage is dependent on the goal. If the goal is to minimize long term average diesel costs, then additional storage may provide only marginal benefits, as sufficient storage already exists to meet energy demands in most years for a 200 GWh annual load. However, if the objective is to minimize the cost impacts of an isolated drought event, then additional storage could be used to offset diesel costs during the drought. If the system were to be operated to minimize the cost of a major drought, it requires that storage be conserved when below average inflows are anticipated such that reservoirs are full at the beginning of a major drought. This mode of operation will potentially cause increased spill, reducing the long term average energy available from hydro.
The storage at Big Spruce is sufficient to allow the Snare River plants to reliably generate about 140 GWh under the range of historic inflows when operated for system firmness. The total hydro generation, including the Yellowknife River would be approximately 170 GWh.
To meet a 200 GWh load using only hydraulic resources, it is estimated that about 170 GWh of energy would be required from the Snare River system during coincident droughts on the Snare and Yellowknife Rivers. This would require an additional 175 Mm³ of storage or roughly the storage associated with Ghost Lake, for a total live storage capacity of 725 Mm3. This amount of storage would correspond to approximately 4 metres of operating range on Ghost Lake.
To meet a 255 GWh load using only hydraulic resources, it is estimated that about 225 GWh of energy would be required from the Snare River system during coincident droughts on the Snare and Yellowknife Rivers. This would require an additional 910 Mm3, for a total live storage capacity of 1 460 Mm³, or more than twice the existing storage on Big Spruce lake, to fully meet system load using only hydro resources under drought conditions.
NTPC North Slave Resilience Study February 2016
14
Developing new hydro generation sites would increase both the available storage, and the annual energy that could be generated from the water in storage. However, the cost of increasing the system storage, or providing new generation, is likely more than the savings associated with reduced diesel operation, especially if system loads remain near 200 GWh/yr.
4.4.3 Development of Alternative Renewables Adding non-dispatchable renewable energy (eg., Solar and Wind Generation) to the North Slave portfolio would likely have the effect of reducing efficiency of the hydro system and not increasing overall generating capability of the system, as existing hydro would need to be spilled when these expensive energy resources would otherwise not be needed to meet load.
4.5 Climate Change (Work Plan Item 6) The following section summarizes literature reviewed regarding historical observations and climatic trends in the region, paleoclimatic studies, and future climate projections, with recommendations on future work that can be done to quantify climate change impacts in the North Slave Region and develop adaptation strategies to manage future risk. Additional information can be found in Appendix B.
4.5.1 Historical Climate and Observed Trends The Canadian Arctic’s climate has shown an unprecedented rate of change in terms of both temperature and precipitation during the past 50 years largely due to the arctic amplification (Furgal, C., and Prowse, T.D., 2008). Over the period 1948-2005 some of the most extreme warm years have been observed throughout the entire North, with the greatest temperature increase being observed in the western Arctic, specifically the Yukon and Mackenzie District at 2.2oC and 2.0oC, respectively (Zhang et al., 2000, Furgal,C., and Prowse, T.D., 2008). Over the same period annual precipitation totals have increased throughout all of northern Canada (Furgal, C., and Prowse, T.D., 2008).
4.5.2 Paleoclimatology and Paleo Records Paleoclimatology data or paleodata is recognized as a potential source for extending observed records further back in time to determine if larger extreme events outside the observed record can be found. Sources of paleodata in the Snare and Yellowknife River sub-basins include tree rings, boreholes, charcoal, and lake sediment. No specific studies pertaining to extending the hydrology record within the Study area have been located.
4.5.3 Future Climate Projections Into the future, climate models project a continued increase in temperature (mean annual changes- 2020s: 2.0oC, 2080s: 6.0oC) and precipitation (mean annual changes- 2020s: 5-8%, 2080s: 15-30%) with greatest temperature changes at higher latitudes which will result in significant changes to the physical environment in particular snow, permafrost, river, lakes, and sea ice (Furgal, C., and Prowse, T.D., 2008). The greatest temperature changes are projected to occur during the winter and fall seasons (Furgal, C., and Prowse, T.D., 2008).
In general, some studies related to hydrology project increasing mean annual runoff in northern basins including the Mackenzie River Basin with the average timing of peak streamflow occurring earlier with reduced magnitude due to earlier snowmelt and reduced snow accumulation (Milly, Dunne & Vecchia 2005, Koirala, Hirabayashi, Mahendran & Kanae, 2014). Seasonally, winter flows are generally projected to increase and in some instances, summer flows are projected to decrease (Milly, Dunne & Vecchia 2005, Koirala, Hirabayashi, Mahendran & Kanae, 2014).
Future projections of extreme events and their associated impacts are of particular importance. However, studies of future extremes are generally surrounded by greater uncertainty than studies of future climate averages. In general, there is greater confidence in changes to temperature based extreme indices and while some studies project increases in extreme precipitation, results are typically qualified with lower confidence.
NTPC North Slave Resilience Study February 2016
15
Future projections of multi-year hydrological droughts and extreme floods cannot be analyzed through temperature and precipitation change alone as the hydrology of watersheds can be complex. Due to insufficient agreement among future projections of extreme hydrological events, the IPCC typically assigns low confidence to their projections (SREX, 2012). Future studies to examine how extreme events such as future hydrological droughts and floods need to be undertaken.
4.5.4 Future Work on Climate Change Impacts and Adaptation As a result of this changing climate, utilities across North America and Canada will be challenged on many fronts as changes occur to temperature and precipitation patterns, runoff, frequency and intensity of severe weather events, and sea level. For hydroelectric power companies like those in the North West Territories these changes have the potential to influence:
energy production/generation, infrastructure, energy demand and; the physical environment.
Physical assets are planned, constructed, and operated based on historical climatic and hydrologic conditions and changes in climate may alter their performance. In addition, transmission and distribution systems may be exposed to a number of vulnerabilities of climate change such as extreme weather events. It is imperative that hydropower companies like those in the North West Territories strive to assess the risks associated with climate change and determine how to best adapt to future conditions.
To help plan and prepare for a changing climate there are a variety of actions that can be undertaking. Developing a comprehensive understanding of historic climate and observed trends could be done as an initial effort towards understanding variability and trends in the region. This would include reviewing the quality of the observed records and correcting for errors as best as possible. Furthermore, evaluating the value-added in extending the observed record back in time using paleodata could improve the understanding of long term variability and extremes in the region. Efforts to set-up physically based hydrological models could aid in identifying areas needed for improved monitoring and confirming the understanding of the dominate processes relevant to the local hydrologic regime which would be integral for future climate change assessments. These models could also be used as a tool to support short term forecasting and operation planning.
As a first step to understand climate change impacts relevant to operations efforts should be made to collaborate and participate in working groups and ongoing studies in the region such as the Arctic Net “Providing Climate Scenarios for the Canadian Arctic with Improved Post-Processing Method“ (http://www.arcticnet.ulaval.ca/research/summary.php?project_id=116) collaborative study, and the Changing Cold Regions Network (CCRN) (http://www.ccrnetwork.ca/). This would provide information regarding potential changes to the hydrologic regime in the future as well as access to researchers who are experts in the field of hydrology and climate change science. In addition there are other industry working groups such as Center for Energy Advancement through Innovation (CEATI), Natural Resources Canada Energy Working Group, Canadian Electric Association, Canadian Hydropower Association, Canadian Standards Association, and Ouranos who are actively involved in understanding climate change impacts and developing adaptation strategies. These agencies have large resources available to their members including best practice documentation, maturity matrices, information exchanges and workshops that allow members to interact and collaborate with others facing similar challenges.
A second and larger step to this process would be to work with climate change experts and government to develop a long term strategy to quantify impacts of climate change, assess the risks and identify adaptation strategies for hydropower production and energy security in the region. This process would require identifying the key areas that need to be studied and the resources and investments in monitoring and
NTPC North Slave Resilience Study February 2016
16
modeling to support these studies. This would be a larger investment in time, resources and finances and would likely need to be aligned with the strategies and polices at the territorial and federal government levels.
5. SUMMARY OF KEY FINDINGS Based on the analysis conducted in this high-level review, the following conclusions can be made:
The North Slave hydro system appears to be drought resilient with sufficient reservoir storage, hydroelectric generation, and diesel resources to meet annual energy needs.
Based on a high level analysis with readily available information on historical operations, it appears as though NTPC has been reasonably managing its hydro system in a manner that minimizes the costs associated with diesel generation. Differences have been noted in this study between actual diesel operation during drought conditions and the estimates provided by the simulation model for maximized hydro projection, and further investigation to review and explain these differences could be useful in order to assess any potential opportunities for savings in overall production costs.
Additional more detailed studies could be performed to review the assumptions made for this preliminary study and further refine LTA estimates for future system planning studies.
While the existing system storage volume available is relatively large compared to river flows, changes in operations are not likely to eliminate the need for diesel generation during severe drought, emergencies, or to provide capacity to meet peak loads. There appears to be a surplus of hydro energy available in the system which could be used to service new load in most years.
Adding new generation such as wind or solar to the Snare Grid with current load levels would likely result in a high percentage of the added energy being spilled in all but the most extreme drought years. Adding additional reservoir storage to the system would have the effect of reducing production costs during drought years, but the costs associated with these options would have to be assessed in further detailed studies.
The current hydrometric and climate monitoring network is adequate for short-term energy operations and planning. The existing inflow forecasting system used is typical for the environment that NTPC is operating in.
The Canadian Arctic’s climate has shown an increase in both temperature and precipitation during the past 50 years, though trends in historical streamflow are less consistent. A literature review of available paleontological data found that there is a significant amount of relevant material available in the study area, but none of it appears to have been analyzed with respect to long-term streamflow variability and persistence.
Being further north, the effects of climate change are expected to be experienced earlier than in more southern latitudes and studies to date project an overall warmer and wetter climate in the future. There is a large amount of uncertainty regarding climate change impacts to extremes, with some potential changes including earlier and less peaky spring freshets, increased inter-annual variability, and more extreme droughts. Due to insufficient agreement among future projections of extreme hydrological events, future studies to examine how extreme events such as future hydrological droughts and floods may occur in the region would have to be undertaken.
NTPC North Slave Resilience Study February 2016
I
APPENDIX A – SCHEMATIC DIAGRAMS OF NORTH SLAVE HYDRO SYSTEM
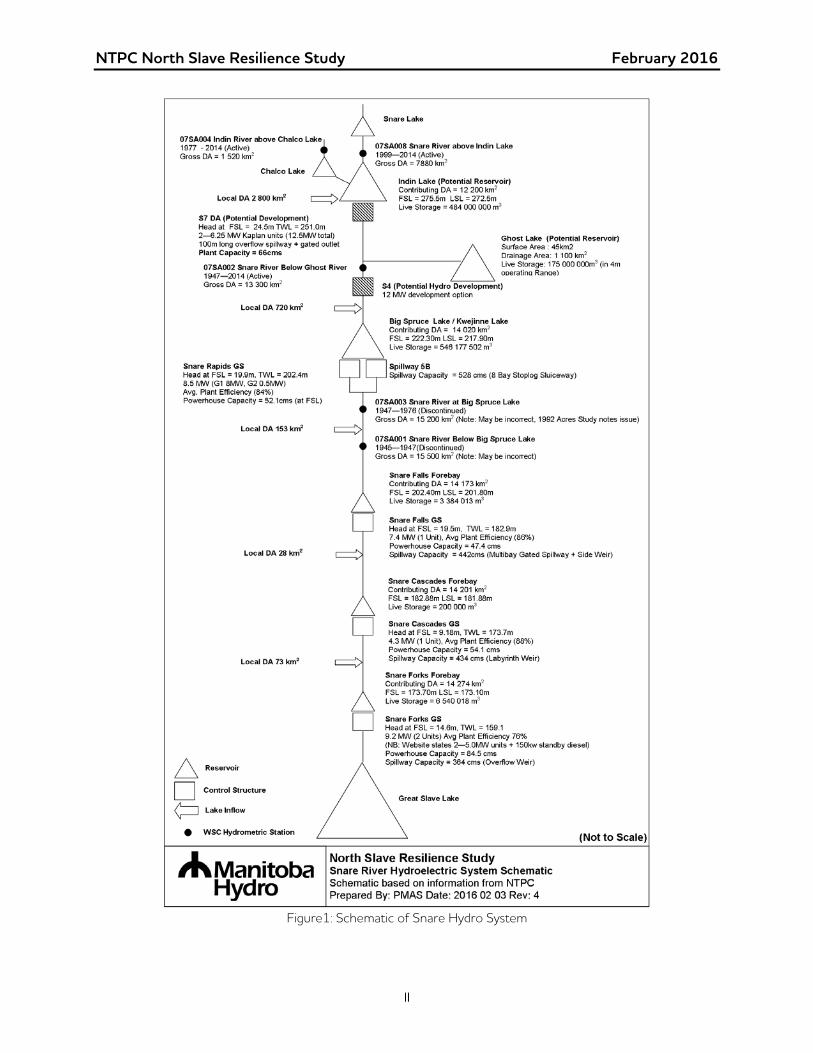
NTPC North Slave Resilience Study February 2016
II
Figure1: Schematic of Snare Hydro System
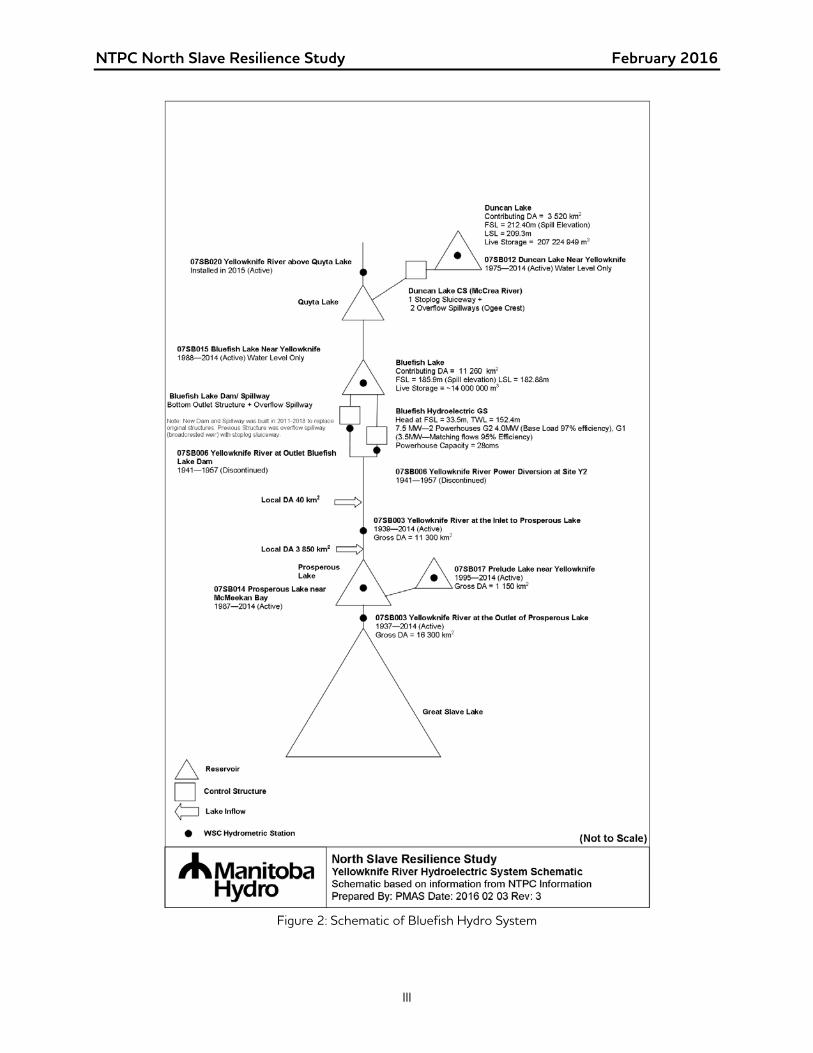
NTPC North Slave Resilience Study February 2016
III
Figure 2: Schematic of Bluefish Hydro System

NTPC North Slave Resilience Study February 2016
IV
APPENDIX B – CLIMATE CHANGE REVIEW
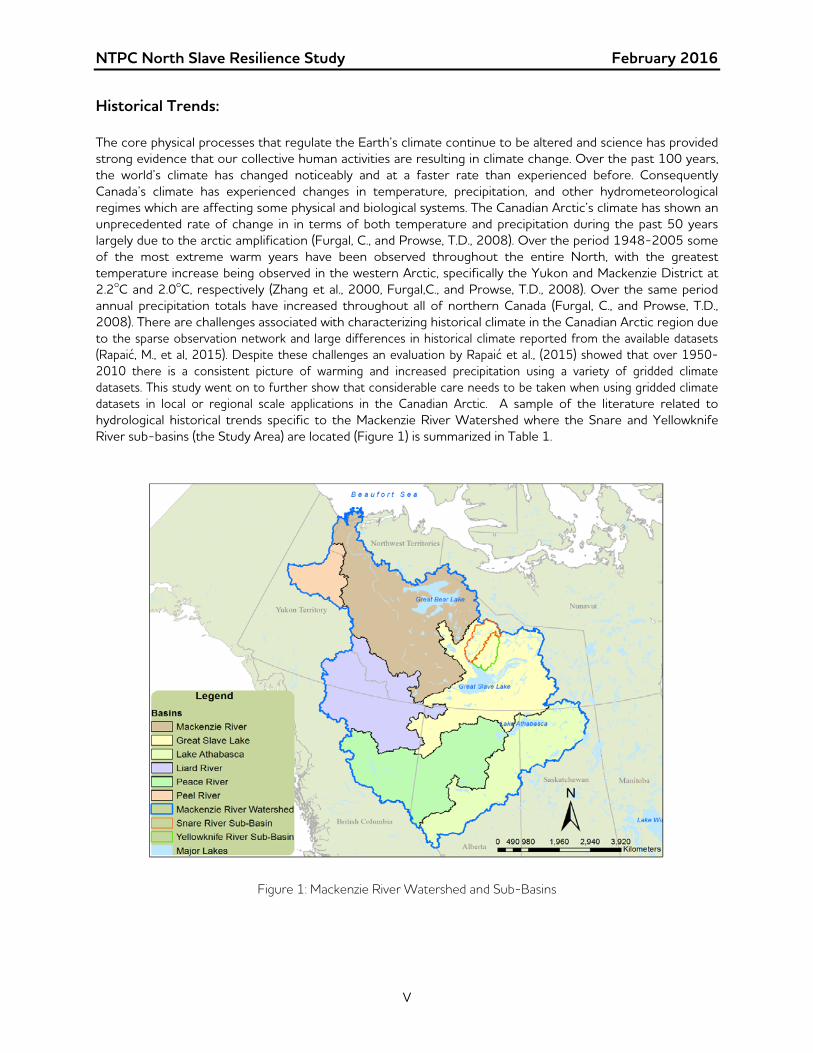
NTPC North Slave Resilience Study February 2016
V
Historical Trends: The core physical processes that regulate the Earth’s climate continue to be altered and science has provided strong evidence that our collective human activities are resulting in climate change. Over the past 100 years, the world’s climate has changed noticeably and at a faster rate than experienced before. Consequently Canada’s climate has experienced changes in temperature, precipitation, and other hydrometeorological regimes which are affecting some physical and biological systems. The Canadian Arctic’s climate has shown an unprecedented rate of change in in terms of both temperature and precipitation during the past 50 years largely due to the arctic amplification (Furgal, C., and Prowse, T.D., 2008). Over the period 1948-2005 some of the most extreme warm years have been observed throughout the entire North, with the greatest temperature increase being observed in the western Arctic, specifically the Yukon and Mackenzie District at 2.2oC and 2.0oC, respectively (Zhang et al., 2000, Furgal,C., and Prowse, T.D., 2008). Over the same period annual precipitation totals have increased throughout all of northern Canada (Furgal, C., and Prowse, T.D., 2008). There are challenges associated with characterizing historical climate in the Canadian Arctic region due to the sparse observation network and large differences in historical climate reported from the available datasets (Rapaić, M., et al, 2015). Despite these challenges an evaluation by Rapaić et al., (2015) showed that over 1950-2010 there is a consistent picture of warming and increased precipitation using a variety of gridded climate datasets. This study went on to further show that considerable care needs to be taken when using gridded climate datasets in local or regional scale applications in the Canadian Arctic. A sample of the literature related to hydrological historical trends specific to the Mackenzie River Watershed where the Snare and Yellowknife River sub-basins (the Study Area) are located (Figure 1) is summarized in Table 1.
Figure 1: Mackenzie River Watershed and Sub-Basins
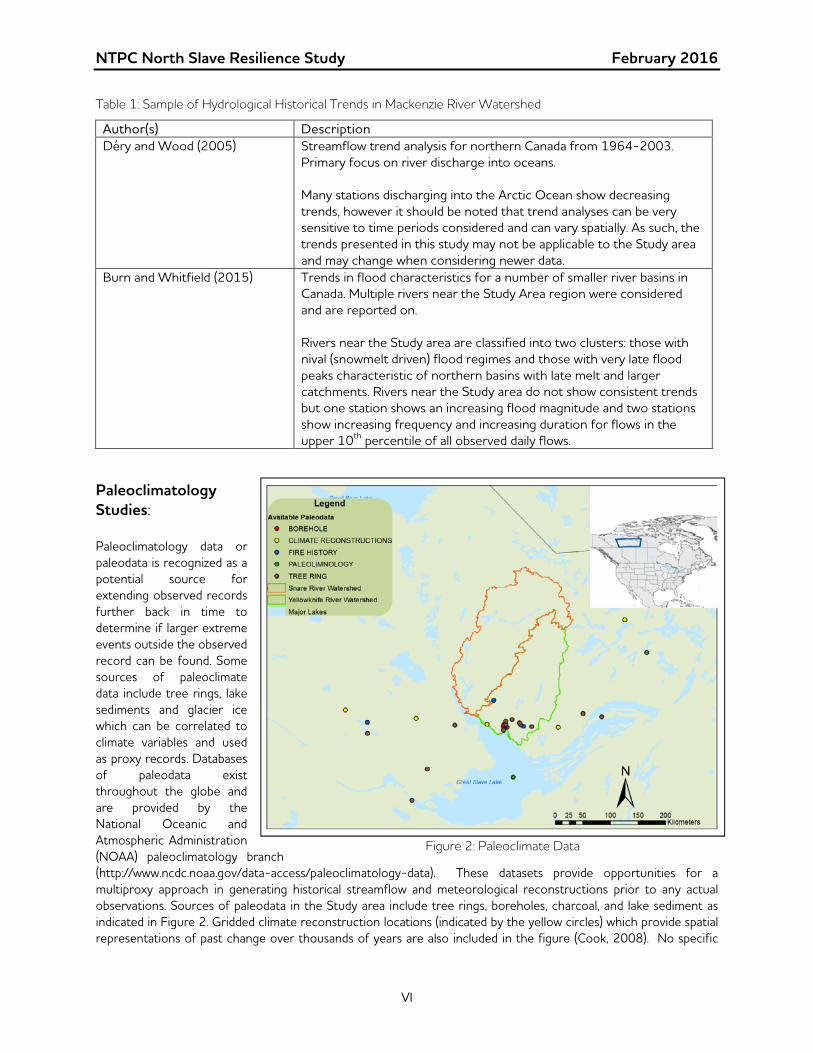
NTPC North Slave Resilience Study February 2016
VI
Table 1: Sample of Hydrological Historical Trends in Mackenzie River Watershed
Author(s) DescriptionDéry and Wood (2005)
Streamflow trend analysis for northern Canada from 1964-2003. Primary focus on river discharge into oceans. Many stations discharging into the Arctic Ocean show decreasing trends, however it should be noted that trend analyses can be very sensitive to time periods considered and can vary spatially. As such, the trends presented in this study may not be applicable to the Study area and may change when considering newer data.
Burn and Whitfield (2015) Trends in flood characteristics for a number of smaller river basins in Canada. Multiple rivers near the Study Area region were considered and are reported on. Rivers near the Study area are classified into two clusters: those with nival (snowmelt driven) flood regimes and those with very late flood peaks characteristic of northern basins with late melt and larger catchments. Rivers near the Study area do not show consistent trends but one station shows an increasing flood magnitude and two stations show increasing frequency and increasing duration for flows in the upper 10th percentile of all observed daily flows.
Paleoclimatology Studies: Paleoclimatology data or paleodata is recognized as a potential source for extending observed records further back in time to determine if larger extreme events outside the observed record can be found. Some sources of paleoclimate data include tree rings, lake sediments and glacier ice which can be correlated to climate variables and used as proxy records. Databases of paleodata exist throughout the globe and are provided by the National Oceanic and Atmospheric Administration (NOAA) paleoclimatology branch (http://www.ncdc.noaa.gov/data-access/paleoclimatology-data). These datasets provide opportunities for a multiproxy approach in generating historical streamflow and meteorological reconstructions prior to any actual observations. Sources of paleodata in the Study area include tree rings, boreholes, charcoal, and lake sediment as indicated in Figure 2. Gridded climate reconstruction locations (indicated by the yellow circles) which provide spatial representations of past change over thousands of years are also included in the figure (Cook, 2008). No specific
Figure 2: Paleoclimate Data
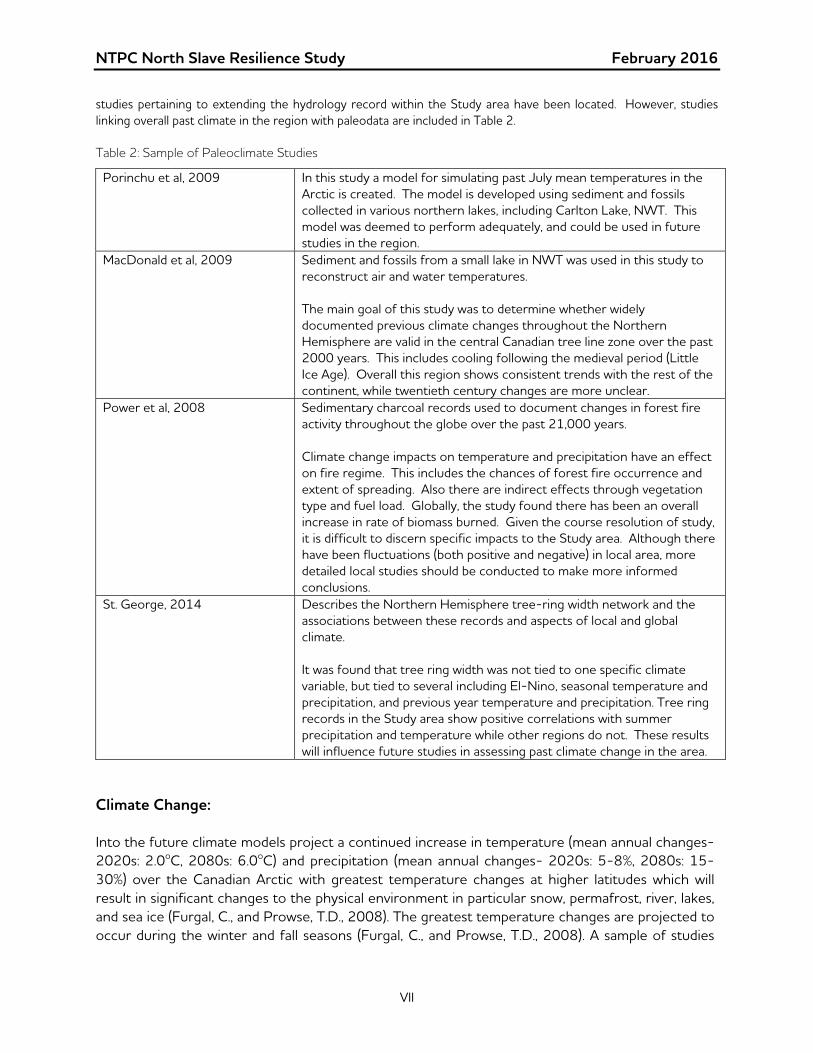
NTPC North Slave Resilience Study February 2016
VII
studies pertaining to extending the hydrology record within the Study area have been located. However, studies linking overall past climate in the region with paleodata are included in Table 2.
Table 2: Sample of Paleoclimate Studies
Porinchu et al, 2009 In this study a model for simulating past July mean temperatures in the Arctic is created. The model is developed using sediment and fossils collected in various northern lakes, including Carlton Lake, NWT. This model was deemed to perform adequately, and could be used in future studies in the region.
MacDonald et al, 2009 Sediment and fossils from a small lake in NWT was used in this study to reconstruct air and water temperatures. The main goal of this study was to determine whether widely documented previous climate changes throughout the Northern Hemisphere are valid in the central Canadian tree line zone over the past 2000 years. This includes cooling following the medieval period (Little Ice Age). Overall this region shows consistent trends with the rest of the continent, while twentieth century changes are more unclear.
Power et al, 2008 Sedimentary charcoal records used to document changes in forest fire activity throughout the globe over the past 21,000 years. Climate change impacts on temperature and precipitation have an effect on fire regime. This includes the chances of forest fire occurrence and extent of spreading. Also there are indirect effects through vegetation type and fuel load. Globally, the study found there has been an overall increase in rate of biomass burned. Given the course resolution of study, it is difficult to discern specific impacts to the Study area. Although there have been fluctuations (both positive and negative) in local area, more detailed local studies should be conducted to make more informed conclusions.
St. George, 2014 Describes the Northern Hemisphere tree-ring width network and the associations between these records and aspects of local and global climate. It was found that tree ring width was not tied to one specific climate variable, but tied to several including El-Nino, seasonal temperature and precipitation, and previous year temperature and precipitation. Tree ring records in the Study area show positive correlations with summer precipitation and temperature while other regions do not. These results will influence future studies in assessing past climate change in the area.
Climate Change: Into the future climate models project a continued increase in temperature (mean annual changes- 2020s: 2.0oC, 2080s: 6.0oC) and precipitation (mean annual changes- 2020s: 5-8%, 2080s: 15-30%) over the Canadian Arctic with greatest temperature changes at higher latitudes which will result in significant changes to the physical environment in particular snow, permafrost, river, lakes, and sea ice (Furgal, C., and Prowse, T.D., 2008). The greatest temperature changes are projected to occur during the winter and fall seasons (Furgal, C., and Prowse, T.D., 2008). A sample of studies
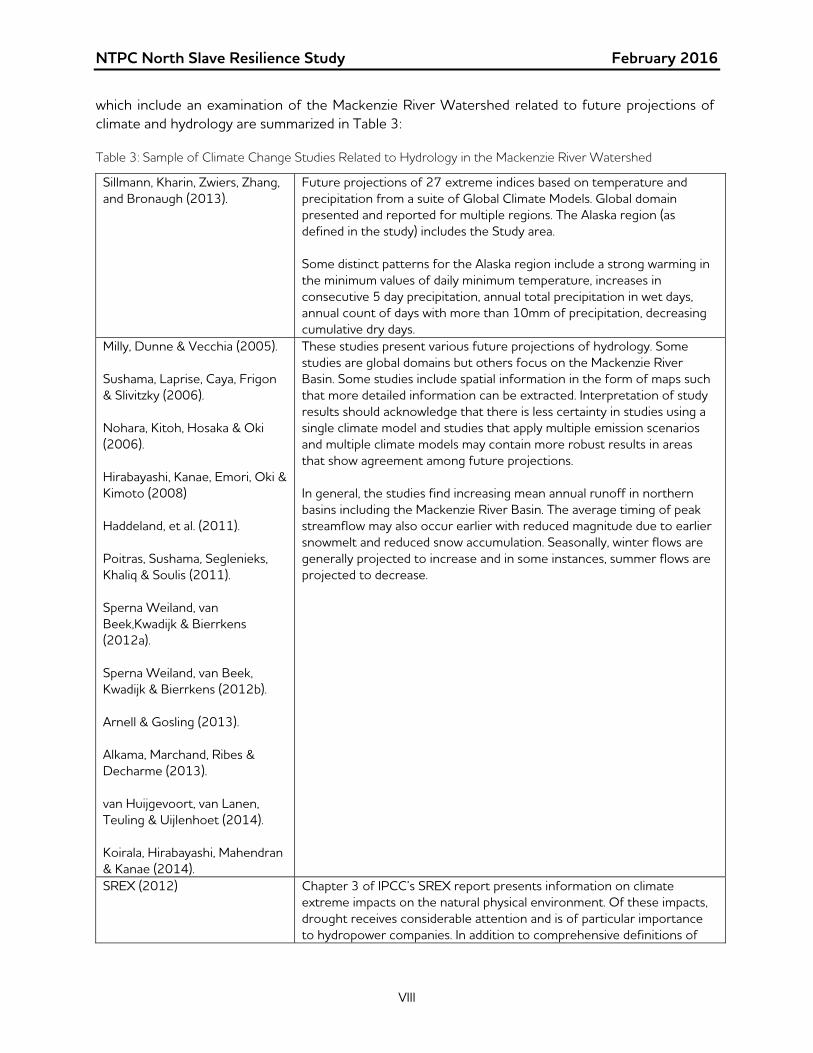
NTPC North Slave Resilience Study February 2016
VIII
which include an examination of the Mackenzie River Watershed related to future projections of climate and hydrology are summarized in Table 3:
Table 3: Sample of Climate Change Studies Related to Hydrology in the Mackenzie River Watershed
Sillmann, Kharin, Zwiers, Zhang, and Bronaugh (2013).
Future projections of 27 extreme indices based on temperature andprecipitation from a suite of Global Climate Models. Global domain presented and reported for multiple regions. The Alaska region (as defined in the study) includes the Study area. Some distinct patterns for the Alaska region include a strong warming in the minimum values of daily minimum temperature, increases in consecutive 5 day precipitation, annual total precipitation in wet days, annual count of days with more than 10mm of precipitation, decreasing cumulative dry days.
Milly, Dunne & Vecchia (2005). Sushama, Laprise, Caya, Frigon & Slivitzky (2006). Nohara, Kitoh, Hosaka & Oki (2006). Hirabayashi, Kanae, Emori, Oki & Kimoto (2008) Haddeland, et al. (2011). Poitras, Sushama, Seglenieks, Khaliq & Soulis (2011). Sperna Weiland, van Beek,Kwadijk & Bierrkens (2012a). Sperna Weiland, van Beek, Kwadijk & Bierrkens (2012b). Arnell & Gosling (2013). Alkama, Marchand, Ribes & Decharme (2013). van Huijgevoort, van Lanen, Teuling & Uijlenhoet (2014). Koirala, Hirabayashi, Mahendran & Kanae (2014).
These studies present various future projections of hydrology. Some studies are global domains but others focus on the Mackenzie River Basin. Some studies include spatial information in the form of maps such that more detailed information can be extracted. Interpretation of study results should acknowledge that there is less certainty in studies using a single climate model and studies that apply multiple emission scenarios and multiple climate models may contain more robust results in areas that show agreement among future projections. In general, the studies find increasing mean annual runoff in northern basins including the Mackenzie River Basin. The average timing of peak streamflow may also occur earlier with reduced magnitude due to earlier snowmelt and reduced snow accumulation. Seasonally, winter flows are generally projected to increase and in some instances, summer flows are projected to decrease.
SREX (2012) Chapter 3 of IPCC’s SREX report presents information on climate extreme impacts on the natural physical environment. Of these impacts, drought receives considerable attention and is of particular importance to hydropower companies. In addition to comprehensive definitions of
NTPC North Slave Resilience Study February 2016
IX
drought types on page 167 (meteorological, agricultural, hydrological, socioeconomic), the report summarizes observed changes and projected future changes in dryness for various regions. Similar to Sillmann, Kharin, Zwiers, Zhang, and Bronaugh (2013), the study area fall into the Alaska region. For the Alaska region there is medium confidence that dryness has increased in parts of the region since 1950. However, due to inconsistent signals, there is low confidence in how future dryness is projected to change.
There is a high degree of uncertainty when projecting future climate conditions and it is recommended that a range of future climate projections (climate models and emission scenarios) be considered when examining potential impacts. A variety of sources of climate change information can be used to undertake an assessment of climate change impacts. These sources are available over the Study area and are described as follows:
Global Climate Model Data (Figure 3): The Intergovernmental Panel on Climate Change (IPCC) published its Fifth Assessment Report (AR5) in 2013. AR5 is the latest IPCC assessment report and was based on results from Global Climate Models (GCMs) from the Coupled Model Intercomparison Project Phase 5 (CMIP5). GCMs are numerical models used to translate future atmospheric forcing (i.e.: GHG) scenarios into physically consistent effects on the climate at the global scale. GCMs compute energy and mass balances, based on physical equations and are the most advanced tools for projecting future climate. GCMs are forced by Representative Concentration Pathways (RCPs) which are used to prescribe the levels of various forcing agents (e.g., GHGs and aerosols) in the atmosphere. RCPs include a number of assumptions about societal evolution and represent different demographic, social, economic, regulatory, technological, and environmental developments. Four RCPs are currently considered, representing a range of futures from optimistic (RCP2.6) to a business as usual case (RCP8.5). Global CO2 emissions are presently tracking closest to RCP8.5 but given the large time horizon, it is not possible to accurately predict which RCP will be the closest to reality in the year 2100. GCMs use relatively coarse resolutions, ranging from approximately 40km to 400km horizontally, and include 18 to 95 vertical levels. The coarser resolutions can make it challenging to interpret projected changes in precipitation and temperature at finer scales such as small river basins. Over 40 GCMs are currently available in the CMIP5 ensemble however data availability and time periods vary among GCMs. As such, only a smaller subset of GCMs are typically available for studies requiring certain variables and certain periods of time. GCMs are typically run with multiple RCPs and are sometimes run multiple times with slightly different initial conditions to sample natural climate variability. A combination of various simulations can produce a large ensemble of future climate simulations available for assessment. There are various avenues to acquire GCM data including data portals (http://cmip-pcmdi.llnl.gov/cmip5/data_portal.html) or directly from modeling agencies such as the Canadian Centre for Climate Modeling and Analysis (CCCma; http://www.cccma.ec.gc.ca/data/cgcm4/CanESM2/index.shtml).
Regional Climate Model Data (Figure 4): Since the spatial resolution of GCMs is often too coarse for use in study of small areas, Regional Climate Models (RCMs) are used to downscale GCM results to finer resolutions. RCMs are forced by GCMs at their boundaries and simulate the climate for a limited area such as North America. Just like the GCMs, these models are physically based but their resolution is typically 50km or less allowing them to account for important local forcing factors such as topographical variation (which is important in mountain regions) and other geographic features
NTPC North Slave Resilience Study February 2016
X
which GCMs are unable to resolve. RCM data availability typically follows GCM data availability since they depend on GCM data. Work is currently underway for the latest Coordinated Regional Climate Downscaling Experiment (CORDEX) which uses CMIP5 GCMs. Data from the North American Regional Climate Change Assessment Program (NARCCAP) which used the previous vintage of GCMs is currently available at: http://www.narccap.ucar.edu/ and has been widely used in the literature. RCM data is also available directly from Environment Canada for the Canadian Regional Climate Model version 4 (e.g.: http://www.cccma.ec.gc.ca/data/crcm423/crcm423.shtml) which is provided by the Climate Simulation Team at the Ouranos Consortium in Montreal.
Post Treatment of Climate Model Data: Most climate models (GCMs and RCMs) have a tendency to under or over estimate baseline climate conditions. When these differences in climate models occur consistently they are called biases. In general, this means the raw climate simulations need to be adjusted before they are used in a regional climate analysis. Various post-treatment methods such as quantile mapping and the delta method can be used to develop regional climate scenarios. The Delta method is one of the most common methods as it provides realistic temporal sequencing associated with the historic record and allows future climate change impacts to be evaluated in the context of historical events.
Statistically Downscaled Data (Figure 5): Another common approach to bring coarse GCM data to a finer resolution is through a process called statistical downscaling. Statistical downscaling uses an observed dataset (e.g., gauge data or a gridded data product) to remove bias and produce finer scale climate simulations. Many different statistical downscaling methods exist in the literature ranging from weather generators to more advanced approaches that consider spatial correlation as well as quantile adjustments. The Pacific Climate Impacts Consortium (PCIC) based out of Victoria, has produced a range of statistically downscaled climate simulations for Canada which can be accessed at: https://pacificclimate.org/data/statistically-downscaled-climate-scenarios. Data from two statistical downscaling methods are available at the 10x10km resolution for all of Canada.
Future projections of extreme events and their associated impacts are of particular importance. However, studies of future extremes are generally surrounded by greater uncertainty than studies of future climate averages. Additionally, defining extreme events can be challenging and depends on the specific objectives of a study. Assessments of climate change impacts due to extreme events may involve a regional analysis or rely on peer-reviewed and published scientific literature. Examples of such literature include IPCC reports such as the AR5 as well as their Special Report on Extremes (SREX). In general, there is greater confidence in changes to temperature based extreme indices and while some studies project increases in extreme precipitation, results are typically qualified with lower confidence. Future projections of multi-year hydrological droughts and extreme floods cannot be analyzed through temperature and precipitation change alone as the hydrology of watersheds can be complex. Due to insufficient agreement among future projections of extreme hydrological events, the IPCC typically assigns low confidence to their projections (SREX, 2012). Future studies to examine how extreme events such as future hydrological droughts and floods need to be undertaken.
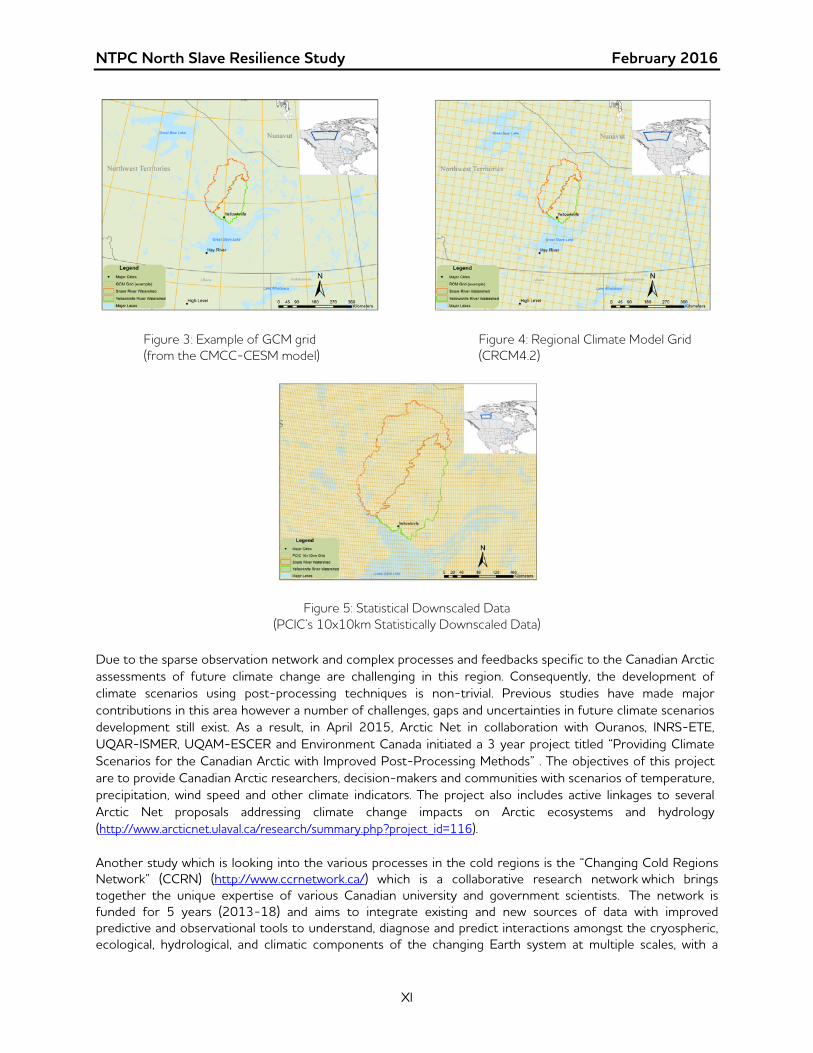
NTPC North Slave Resilience Study February 2016
XI
Figure 3: Example of GCM grid Figure 4: Regional Climate Model Grid (from the CMCC-CESM model) (CRCM4.2)
Figure 5: Statistical Downscaled Data (PCIC’s 10x10km Statistically Downscaled Data)
Due to the sparse observation network and complex processes and feedbacks specific to the Canadian Arctic assessments of future climate change are challenging in this region. Consequently, the development of climate scenarios using post-processing techniques is non-trivial. Previous studies have made major contributions in this area however a number of challenges, gaps and uncertainties in future climate scenarios development still exist. As a result, in April 2015, Arctic Net in collaboration with Ouranos, INRS-ETE, UQAR-ISMER, UQAM-ESCER and Environment Canada initiated a 3 year project titled “Providing Climate Scenarios for the Canadian Arctic with Improved Post-Processing Methods” . The objectives of this project are to provide Canadian Arctic researchers, decision-makers and communities with scenarios of temperature, precipitation, wind speed and other climate indicators. The project also includes active linkages to several Arctic Net proposals addressing climate change impacts on Arctic ecosystems and hydrology (http://www.arcticnet.ulaval.ca/research/summary.php?project_id=116). Another study which is looking into the various processes in the cold regions is the “Changing Cold Regions Network” (CCRN) (http://www.ccrnetwork.ca/) which is a collaborative research network which brings together the unique expertise of various Canadian university and government scientists. The network is funded for 5 years (2013-18) and aims to integrate existing and new sources of data with improved predictive and observational tools to understand, diagnose and predict interactions amongst the cryospheric, ecological, hydrological, and climatic components of the changing Earth system at multiple scales, with a
NTPC North Slave Resilience Study February 2016
XII
geographic focus on Western Canada’s rapidly changing cold interior. Baker Creek is located just a few kilometers north of Yellowknife, Northwest Territories is one of the study basins for this network.
As a result of this changing climate, utilities across North America and Canada will be challenged on many fronts as changes occur to temperature and precipitation patterns, runoff, frequency and intensity of severe weather events, and sea level. For hydroelectric power companies like those in the North West Territories these changes have the potential to influence:
energy production/generation, infrastructure, energy demand and; the physical environment.
Physical assets are planned, constructed, and operated based on historical climatic and hydrologic conditions and changes in climate may alter their performance. In addition, transmission and distribution systems may be exposed to a number of vulnerabilities of climate change such as extreme weather events. It is imperative that hydropower companies like those in the North West Territories strive to assess the risks associated with climate change and determine how to best adapt to future conditions.
Recommendations on Future Studies: Developing a comprehensive understanding of historic climate and observed trends could be done as an initial effort towards understanding variability and trends in the region. This would include reviewing the quality of the observed records and correcting for errors as best as possible. Furthermore, evaluating the value-added in extending the observed record back in time using paleodata could improve the understanding of long term variability and extremes in the region. Efforts to set-up physically based hydrological models could aid in identifying areas needed for improved monitoring and confirming the understanding of the dominate processes relevant to the local hydrologic regime which would be integral for future climate change assessments. These models could also be used as a tool to support short term forecasting and operation planning.
As a first step to understand climate change impacts relevant to operations efforts should be made to collaborate and participate in working groups and ongoing studies in the region such as the Arctic Net collaborative study. This would provide information regarding potential changes to the hydrologic regime in the future as well as access to researchers who are experts in the field of hydrology and climate change science. In addition there are other industry working groups such as Center for Energy Advancement through Innovation (CEATI), Natural Resources Canada Energy Working Group, Canadian Electric Association, Canadian Hydropower Association, Canadian Standards Association, and Ouranos actively involved in understanding climate change impacts and developing adaptation strategies. These agencies have large resources available to their members including best practice documentation, maturity matrices, information exchanges and workshops that allow members to interact and collaborate with others facing similar challenges.
A second and larger step to this process would be to work with climate change experts and the government to develop a long term strategy to quantify impacts of climate change, assess the risks and identify adaptation strategies for hydropower production and energy security in the region. This process would require identifying the key areas that need to be studied and the resources and investments in monitoring and modeling to support these studies. This would be a larger investment in time, resources and finances and would likely need to be aligned with the strategies and polices at both the territorial and federal government levels.
NTPC North Slave Resilience Study February 2016
XIII
References: Arnell, N. W. & Gosling, S. N. (2013). The impacts of climate change on river flow regimes at the global scale. Journal of Hydrology, 486: 351-364. Alkama, R., Marchand, L., Ribes, A., & Decharme, B. (2013). Detection of global runoff changes: results from observations and CMIP5 experiments. Hydrology and Earth Systems Sciences, 17, 2967-2979.
Burn, D. H., & Whitfield, P. H. (2015). Changes in floods and flood regimes in Canada. Canadian Water Resources Journal, Published Online June 2, 2015. doi: 10.1080/07011784.2015.1026844
Cook, E.R., (2008). North American Drought Atlas Version 2a. National Oceanic and Atmospheric Administration Climatic Data Center [Online]. https://www.ncdc.noaa.gov/paleo/study/6319, Accessed on Nov 19, 2015.
Déry, S.J. and Wood, E.F., (2005). Decreasing discharge in northern Canada. Geophysical Research Letters, 32, L10401.
Furgal,C., and Prose, T.D. (2008): Northern Canada; in From Impacts to Adapation: Canada in a Changing Climate 2007, edited by D.S. Lemmen, F.j. Warren, K. Lacroiz and E.Bush; Governement of Canada, Ottawa, ON, P. 57-118.
Hirabayashi, Y., Kanae, S., Emori, S., Oki, T., & Kimoto, M. (2008): Global projections of changing risks of floods and droughts in a changing climate, Hydrological Sciences Journal, 53(4): 754-772. Haddeland, I., Clark, D. B., Franssen, W., Ludwig, F., Voß, F., Arnell, N. W.,…P. Yeh, P. (2011). Multimodel estimate of the global terrestrial water balance: Setup and first results. Journal of Hydrometeorology, 12: 869–884.
Koirala, S., Hirabayashi, Y., Mahendran R., & Kanae S. (2014). Global assessment of agreement among streamflow projections using CMIP5 model outputs. Environmental Research Letters, 9: 1-11. MacDonald, G.M., D.F. Porinchu, N. Rolland, K.V. Kremenetsky, and D.S. Kaufman. (2009). Paleolimnological evidence of the response of the central Canadian treeline zone to radiative forcing and hemispheric patterns of temperature change over the past 2000 years. Journal of Paleolimnology, 41(1), 129-141. Maja Rapaić, Ross Brown, Marko Markovic & Diane Chaumont (2015): An Evaluation of Temperature and Precipitation Surface-Based and Reanalysis Datasets for the Canadian Arctic, 1950–2010, Atmosphere-Ocean, DOI: 10.1080/07055900.2015.1045825 McBean, G., Alekseev, G., Chen, D., Førland, E., Fyfe, J., Groisman, P.Y.,King, R., Melling, H., Vose, R., and Whitfeld P.H. (2005): Arctic climate past and present in Arctic Climate Impact Assessment: Cambridge University Press, Cambridge, United Kingdom, p 22-60. Milly, P. C. D., Dunne, K. A., & Vecchia, A. V., (2005). Global pattern of trends in streamflow and water availability in a changing climate. Letters to Nature, 438: 347-350. Nohara, D., Kitoh, A., Hosaka, M., & Oki, T. (2006). Impact of climate change on river discharge projected by multimodel ensemble. Journal of Hydrometeorology, 7: 1076-1089.
NTPC North Slave Resilience Study February 2016
XIV
Poitras, V., Sushama, L., Seglenieks, F., Khaliq, M. N., & Soulis, E. (2011). Projected changes to streamflow characteristics over Western Canada as simulated by the Canadian RCM. Journal of Hydrometeorology, 12: 1395-1413. Porinchu, D., Rolland, N., Moser, K., (2009). Development of a chironomid-based air temperature inference model for the central Canadian Arctic. Journal of Paleolimnology, 41(2), 349-368. Power, M.J., Marlon, J., Bartlein, P.J., Harrison, S.P., Mayle, F.E., Ballouche, A., Bradshaw, R., Carcaillet, C., Cordova, C., Mooney, S., Moreno, P., Prentice, I.C., Thonicke, K., Tinner, W., Whitlock, C., Zhang, Y., Zhao, Y., Anderson, R.S., Beer, R., Behling, H., Briles, C., Brown, K.J., Brunelle A., Bush, M., Camill, P., Chu, G.Q., Clark, J., Colombaroli, D., Connor, S., Daniels, M., Daniau, A.-L., Dodson, J., Doughty, E., Edwards, M.E., Fisinger, W., Foster, D., Frechette J., Gaillard, M.-J., Gil-Romera, G. Gavin, D.G., Gobet, E., Haberle, S., Hallett, D.J., Higuera, P., Hope, G., Horn, S., Impagliazzo, S., Inoue, J., Kaltenrieder, P., Kennedy, L., Kong, Z.C., Larsen, C., Long, C.J., Lynch, J., Lynch, B., McGlone, M., Meeks, S., Mensing, S., Meyer, G., Minckley, T., Mohr, J, Nelson, D., New, J., Newnham, R., Noti, R., Oswald, W., Pierce, J., Richard, P.J.H., Rowe, C., Sanchez Goņi, M.F., Shuman, B.J., Takahara, H., Toney, J., Turney, C.., Umbanhower, C., Vandergoes, M., Vanniere, B., Vescovi, E., Walsh, M., Wang, X., Williams, N., Wilmshurst, J., Zhang , J.H. (2008). Changes in fire regimes since the Last Glacial Maximum: an assessment based on a global synthesis and analysis of charcoal data. Climate Dynamics, Vol. 30, No. 7-8, pp. 887-907. Sillmann, J., Kharin, V.V., Zwiers, F.W., Zhang, X., and Bronaugh, D., (2013). Climate extremes indices in the CMIP5 multipmodel ensemble: Part 2. Future climate projections. Journal of Geophysical Research: Atmospheres. 118, 2473-2493. SREX, 2012. Managing the Risks of Extreme Events and Disasters to Advance Climate Change Adaptation. A Special Report of Working Groups I and II of the Intergovernmental Panel on Climate Change [Field, C.B., V. Barros, T.F. Stocker, D. Qin, D.J. Dokken, K.L. Ebi, M.D. Mastrandrea, K.J. Mach, G.-K. Plattner, S.K. Allen, M. Tignor, and P.M. Midgley (eds.)]. Cambridge University Press, Cambridge, UK, and New York, NY, USA. Sperna Weiland, F. C., van Beek, L. P. H., Kwadijk, J. C. J., & Bierrkens, M. F. P. (2012a). Global patterns of change in discharge regimes for 2100. Hydrology and Earth System Science, 16: 1047-1062. Sperna Weiland, F. C., van Beek, L. P. H., Kwadijk, J. C. J., & Bierrkens, M. F. P., (2012b). On the suitability of GCM runoff fields for river discharge modeling: A case study using model output from HadGEM2 and ECHAM5. Journal of Hydrometeorology, 13: 140-154. St. George, 2014. An overview of tree-ring width records across the Northern Hemisphere, Quaternary Science Reviews (95), 132-150. Sushama, L., Laprise, R., Caya, D., Frigon, A., & Slivitzky, M. (2006). Canadian RCM projected climate-change signal and its sensitivity to model errors. International Journal of Climatology, 26(15): 2141-2159. van Huijgevoort, M. H. J., van Lanen, H. A. J., Teuling, A. J., & Uijlenhoet, R. (2014). Identification of changes in hydrological drought characteristics from a multi-GCM driven ensemble constrained by observed discharge. Journal of Hydrology, 512: 421-434. Whitfield, P.H. (2005): Arctic climate: past and present; in Arctic Climate Impact Assessments. Cambridge University Press, Cambridge, United Kingdon, p 22-60. Zhang, X., Vincent, L.A, Hogg, W.D. and Niisoo, A. (2000): Temperature and precipitation trends in Canada during the 20th Century; Atmsphere-Ocean, v. 38, p. 395-429.

NTPC North Slave Resilience Study February 2016
XV
APPENDIX C – PROJECT WORKPLAN AND SCOPING DOCUMENT
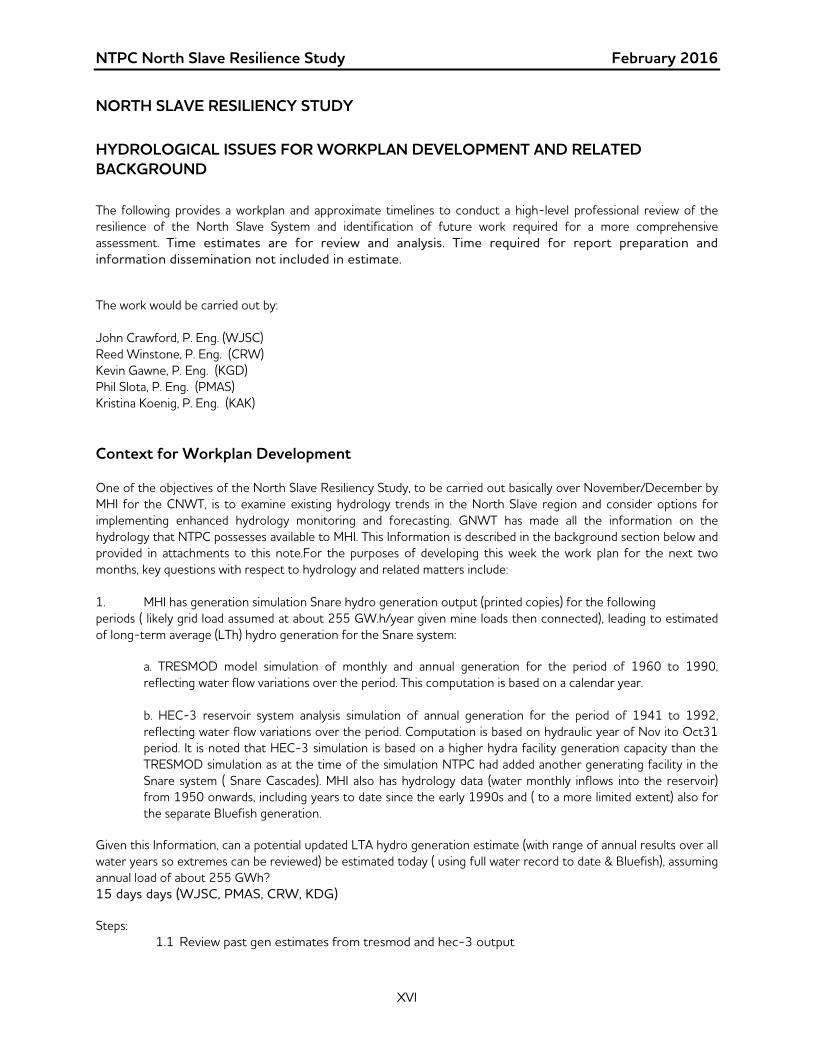
NTPC North Slave Resilience Study February 2016
XVI
NORTH SLAVE RESILIENCY STUDY
HYDROLOGICAL ISSUES FOR WORKPLAN DEVELOPMENT AND RELATED BACKGROUND The following provides a workplan and approximate timelines to conduct a high-level professional review of the resilience of the North Slave System and identification of future work required for a more comprehensive assessment. Time estimates are for review and analysis. Time required for report preparation and information dissemination not included in estimate.
The work would be carried out by: John Crawford, P. Eng. (WJSC) Reed Winstone, P. Eng. (CRW) Kevin Gawne, P. Eng. (KGD) Phil Slota, P. Eng. (PMAS) Kristina Koenig, P. Eng. (KAK)
Context for Workplan Development One of the objectives of the North Slave Resiliency Study, to be carried out basically over November/December by MHI for the CNWT, is to examine existing hydrology trends in the North Slave region and consider options for implementing enhanced hydrology monitoring and forecasting. GNWT has made all the information on the hydrology that NTPC possesses available to MHI. This Information is described in the background section below and provided in attachments to this note.For the purposes of developing this week the work plan for the next two months, key questions with respect to hydrology and related matters include: 1. MHI has generation simulation Snare hydro generation output (printed copies) for the following periods ( likely grid load assumed at about 255 GW.h/year given mine loads then connected), leading to estimated of long-term average (LTh) hydro generation for the Snare system:
a. TRESMOD model simulation of monthly and annual generation for the period of 1960 to 1990, reflecting water flow variations over the period. This computation is based on a calendar year. b. HEC-3 reservoir system analysis simulation of annual generation for the period of 1941 to 1992, reflecting water flow variations over the period. Computation is based on hydraulic year of Nov ito Oct31 period. It is noted that HEC-3 simulation is based on a higher hydra facility generation capacity than the TRESMOD simulation as at the time of the simulation NTPC had added another generating facility in the Snare system ( Snare Cascades). MHI also has hydrology data (water monthly inflows into the reservoir) from 1950 onwards, including years to date since the early 1990s and ( to a more limited extent) also for the separate Bluefish generation.
Given this Information, can a potential updated LTA hydro generation estimate (with range of annual results over all water years so extremes can be reviewed) be estimated today ( using full water record to date & Bluefish), assuming annual load of about 255 GWh? 15 days days (WJSC, PMAS, CRW, KDG) Steps:
1.1 Review past gen estimates from tresmod and hec-3 output
NTPC North Slave Resilience Study February 2016
XVII
1.2 Develop correlation between historic flows and generation 1.3 Update estimate to incorporate recent flow years, depending on availability of records
2. Can the same information be modified today to calculate long term average (LTA) hydro generation (with range of annual results) assuming today’s load of approximately 200 GWh? Approx 5 days (WJSC, CRW) Steps:
2.1 Need monthly load shape for 200GWh annual load 2.2 Re-assess potential generation against new load
3. Given this hydrological information and previous model outputs, what would it take to do a proper model estimate (in terms of time and effort)? Approx 2 days (PMAS, WJSC, CRW)
3.1 Review plant information and hydrologic information 3.2 Provide description of modelling, monitoring, and data requirements
4. What needed to review current hydrological data and monitoring on North Slave system and assess if and when useful improvements could be made? Approx 3 days (PMAS, WJSC) 4.1 Review available hydrometric information 4.2 Highlight and summarize gaps 4.3 Make recommendations on future analysis requirements 5. Can the potential drought relief impact be assessed usefully, based on available information, re: upstream Snare storage options at Ghost Lake and Site 7? Approx 3 days (WJSC, CRW, PMAS, KDG)
5.1 Provide high level assessment of potential operating changes related to drought, or reducing diesel costs depending upon availability of information.
6. Is information available from experts on global climate change & trends in the Snare watershed that may affect hydrology and hydro generation? Is there any information (e.g., tree rings) for this region on hydrology extremes beyond what shown to date by the available water record? Approx 2 days (KAK, PMAS)
6.1 Identify potential sources regarding climate change information for the Snare watershed 6.2 Identify regional considerations for assessing climate change impacts to future water supply
availability and drought risk. 6.3 Provide recommendations on work required to assess potential climate change impacts to
drought
7. Can high level assessment be provided as to Manitoba Hydro study classification level re short list of supply option studies ( hydro, wind, solar, biomass, energy storage, e.g., battery? Approx 0 days (Removed from scope of work)
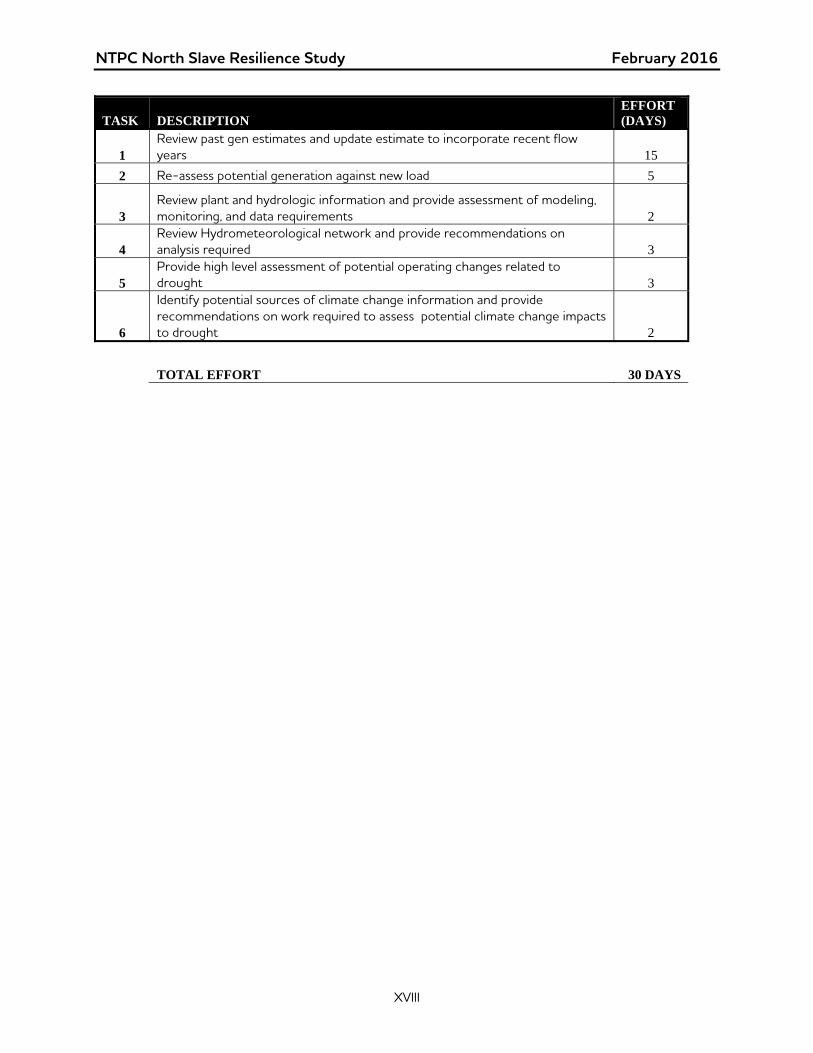
NTPC North Slave Resilience Study February 2016
XVIII
TASK DESCRIPTION EFFORT (DAYS)
1 Review past gen estimates and update estimate to incorporate recent flow years 15
2 Re-assess potential generation against new load 5
3 Review plant and hydrologic information and provide assessment of modeling, monitoring, and data requirements 2
4 Review Hydrometeorological network and provide recommendations on analysis required 3
5 Provide high level assessment of potential operating changes related to drought 3
6
Identify potential sources of climate change information and provide recommendations on work required to assess potential climate change impacts to drought 2
TOTAL EFFORT 30 DAYS

ATTACHMENT 3: INFRASTRUCTURE
OPTIONS BACKGROUND

North Slave Resiliency Study March 2016
Attachment 3: Infrastructure Options Background A3-1
3.0 INFRASTRUCTURE OPTIONS BACKGROUND
This Attachment provides a summary review of available information on infrastructure options, as background for the Study's options assessment. The following are reviewed:
• Criteria for examination of infrastructure options • Overview of existing infrastructure options • Hydro system development options • Other renewable generation options • Fossil fuel generation options • Other resource planning options
3.1 CRITERIA FOR EXAMINATION OF INFRASTRUCTURE OPTIONS
Consistent with the recent Charrette Report and GNWT response, the prime criteria for evaluating infrastructure options for this resiliency study will be "affordability", or the ability of each option to minimize overall costs for GNWT subsidies and community electricity ratepayers. To address costs related to added diesel requirements related to low water conditions, evaluations (where feasible) will assess forecast present value incremental costs (i.e., fuel and new bulk power capital costs) of supplying North Slave generation for ratepayers and government over the full cycle of water conditions. Infrastructure options will be compared to a "base case" that assumes current renewable generation capability and default diesel generation capability (as required to meet capacity planning requirements).
Also consistent with the recent Charrette Report and GNWT response, three other criteria as defined below will also be considered for evaluating infrastructure options, namely: environment, economy (local NWT economy benefits), and energy security.
GNWT Background
In 2014, the GNWT worked with its interdepartmental committee and with consultants to identify performance measures for energy planning that could be used to inform and evaluate the GNWT’s energy investment decision-making process. This work resulted in the following objectives for the GNWT energy planning process:
• Improve energy affordability; • Minimize environmental impacts of energy production and consumption; • Improve energy-related economic benefits; and • Improve energy security.
Each of these objectives is effectively defined and characterized in the Energy Initiative Evaluation Framework presented in the 2014 Energy Charrette report. Definitions and rankings (in order of importance) for each criteria (as outlined in that report) are provided below. The GNWT response
North Slave Resiliency Study March 2016
Attachment 3: Infrastructure Options Background A3-2
to the 2014 Energy Charrette report endorsed the objectives and the ranking for each objective as suggested by the Charrette participants1.
2014 Charrette Report Energy Objectives and Rankings2
1. Affordability: Considered to be the most important objective - Options that o Minimize community energy expenditures; o Minimize GNWT operating costs for government assets; o Reduce requirement for GNWT energy subsidies
2. Environment: Options that o Minimize GHG emissions from energy use and production o Minimize the environmental footprint of energy use and production
3. Economy: Options that o Keep economic benefits in the NWT (includes local labor and materials)
4. Energy security: Options that o Improve electricity system reliability o Reduce community vulnerability to future price escalations.
The above Energy Charrette objectives are similar to the criteria applied by Yukon Energy as part of the assessment of supply options undertaken in its 2011 20-Year Resource Plan.3
Context for Current Resiliency Study
Subject to diesel generation needed for reasons not related to water availability (e.g., outages, maintenance, etc.), current and projected retail power loads on the North Slave are expected to be largely, if not fully met, with the available hydro generation in most years.
The system capacity, including Jackfish diesel plant is also sufficient to meet the current and expected load requirements, and reliability with regard to generation capacity availability is not a critical concern at this time (subject to ongoing replacement of facilities when required due to age or other factors).
However, during years when hydro generation capability is reduced due to low water conditions, a material portion of the load must be supplied via expensive diesel generation. Considering this, the
1 The response notes that “the GNWT also recognizes that to properly use these energy objectives in planning or evaluating future energy projects and initiatives, more work is needed to operationalize the objectives and ensure that existing energy programs, projects and policies are consistent with, and able to meet, these clearly stated objectives and priorities”. 2 The report also notes “a general sentiment that all the objectives were important, and that investments in energy projects or initiatives should strive to satisfy as many objectives as possible.” However, in terms of ranking, the Energy Charrette report notes that overall, “Affordability” was considered the most important objective. This was followed by “Environment”, “Economy” and “Energy security”, which were ranked fairly closely together, being second, third and fourth. 3 The YEC criteria included affordability, environmental responsibility and reliability, as well as flexibility to assess ability to respond to seasonal and annual conditions on the hydro-based isolated grid system. This flexibility objective may also be addressed under “affordability” and “reliability” GNWT criteria.
North Slave Resiliency Study March 2016
Attachment 3: Infrastructure Options Background A3-3
current drought focused resiliency study must assess what, if any, less costly options are available to reduce/displace diesel generation requirements during low water conditions.
Given the above context for the resiliency study, the relative ranking for each objective is maintained (as outlined in the 2014 Charrette Report) with the primary focus on affordability. Specifically:
• Affordability is considered the most important objective (followed by environment, economy and energy security); and
• All the objectives are considered important, and the assessment of energy projects or initiatives should strive to satisfy or balance as many objectives as possible.
3.2 OVERVIEW OF EXISTING INFRASTRUCTURE OPTIONS
A number of infrastructure options have been identified previously by NTPC and the GNWT to provide alternatives for diesel generation and to increase the resiliency of the North Slave system. Available information on these options is summarized below by the following groups:
• Options related to the hydro system developments, including storage options and existing hydro facility improvements;
• Other renewable generation options, including biomass, wind and solar developments, and battery energy storage;
• Fossil fuel generation options, including lower cost and cleaner options to diesel (e.g., LNG); and
• Other options, including demand side management and grid development.
Overall, there are two key factors affecting assessment of available infrastructure options for the purpose of the current North Slave Resiliency Study:
• Level of available information - In most cases, information for each option remains at a preliminary assessment stage such that considerable time and work would be needed to achieve a feasibility level assessment for the option; and
• Level of grid loads - Base Case forecast grid loads for the next 20 years severely constrain the opportunity for affordable new infrastructure development.
o Long-term average (LTA) annual hydro supply availability for existing North Slave system generation remains above forecast loads under the Base Case forecast for the next 20 years, subject to anticipated Bluefish Hydro station upgrades in the near term.4
4 Based on the water record for the last 30 years (1985-2014), the existing North Slave hydro system (before added capability expected with Bluefish Hydro upgrades) can provide more than 250 GW.h/year more than 90% of the time (see Attachment 2, Manitoba Hydro review). As discussed in Attachment 1, total generation for the existing customers on the North Slave system is forecast in the Base Case to remain at approximately 200 GW.h until 2019, and then increase to approximately 215 GW.h in 2020 reflecting the addition of the Giant mine freezing load. After 2020, Base Case load on the North Slave system is forecast to grow conservatively reaching 225 GW.h by 2036. In summary, the North Slave system
North Slave Resiliency Study March 2016
Attachment 3: Infrastructure Options Background A3-4
o Under these conditions, North Slave system Base Case loads would remain low enough that diesel generation requirements at LTA hydro generation may be assumed through to 2036 to relate almost entirely to sporadic winter peaking, generation maintenance, emergency, and/or capital project impacts - with significant added diesel generation requirements occurring only under occasional (i.e., less than 10% of the years) low water conditions.
o Under these conditions, new renewable generation in most of the next 20 years would typically only add to the current surplus renewable capability rather than displace diesel or other fossil fuel generation.
o Opportunities may separately exist to convert diesel fuel generation needed for reliable grid capacity from diesel fuel to lower cost and cleaner fossil fuel options such as LNG, but low levels of expected diesel generation may also constrain the economic feasibility of such conversions.
o Opportunities for added hydro storage may merit consideration to the extent that a cost effective option can be provided to reduce fossil fuel generation requirements during low water conditions.
3.3 HYDRO SYSTEM DEVELOPMENT OPTIONS
NTPC Longer Term Resource Planning and Drought Management document for the North Slave system, dated March 30, 2015 identified hydro system development options for the Snare and Bluefish systems, as well as at Lac La Martre.
Snare System Added Storage
The existing Snare Hydro system has a total installed capacity of approximately 30 MW in four separate hydro plants, with a live storage of approximately 546 million m3 in Big Spruce Lake. This level of live storage relative to the outflow is comparable to the storage to outflow ratio for the Manitoba Hydro Lake Winnipeg storage and the downstream Nelson River hydro facilities.
There have been high level occasional discussions with respect to the storage options in the Upper Snare area with reservoirs constructed at Site 7 (a future development site upstream of all existing facilities, 4 to 5 km downstream of Indin Lake) or the Ghost Lake area (a separate smaller lake upstream of all existing facilities but downstream of Site 7). No detailed or feasibility level assessments are currently available for these options. The concept for considering such added storage in the context of the current resiliency study could be to provide added storage available for use specifically during drought conditions.
Broad understanding of the Ghost Lake storage option is that storage construction at Ghost Lake would be limited to building a top storage (installation of a simple log structure) or bottom storage (gated culvert), which could provide one-time water required in drought years. Potential live
Base Case load is forecast over the next 20 years to continue being significantly below pre 2005/06 levels and the current system LTA hydro capability.
North Slave Resiliency Study March 2016
Attachment 3: Infrastructure Options Background A3-5
storage available from Ghost Lake has been estimated at 175 Mm3 or about 30 GW.h of additional energy with the existing hydro plants5.
Alternatively, construction of storage only at Site 7 with a proper spillway could be considered, while allowing the possibility for adding a 12.5 MW hydro power plant at Site 76, based on 484 million m3, in the future when there is a market demand for the additional power on the North Slave system. However the storage construction cost at Site 7 is expected to be much higher than the storage construction needed at Ghost Lake. A study conducted by SNC-Lavalin in 1997 estimated the dam and spillway construction costs at approximately $9 million, but no updated cost estimates have been conducted since then.
Bluefish Hydro Redevelopment
The first unit installed at the old plant at the existing Bluefish Hydro station (approximate 7 MW total capacity) is nearing end of life, and needs replacement within the next 10 to 15 years.
Preliminary investigations have been undertaken into options to increase peaking capacity and efficiency at the existing Bluefish Hydro station.7 These options include improving penstock routing and efficiency combined with a new generator to replace the original which was installed in 1942. This could increase the peaking capacity of the Bluefish station by approximately 3 MW. It would also involve higher capital costs than the option of simply replacing the existing unit.
NTPC considers that this redevelopment is based on a reliable technology and has the advantage of providing system diversity in times of drought since it operates on a separate watershed and transmission line from the Snare system.
NTPC is planning to initiate a study in 2016 in order to explore several options with respect to the Bluefish facility, including potential for increasing storage, the potential for changing the operating procedure and installing a bigger peaking plant, and the potential for a more conventional approach operating procedures similar to the current one. It is expected that an approved plan for Bluefish upgrades will be required within the next five years.
Building a larger capacity replacement for the end of life Bluefish Plant was considered – however, this would not provide any additional benefit to system resiliency to drought without improved storage.
5 The Ghost Lake storage estimate is based on a Geological Survey of Canada map, with a surface area estimate of 17.5 square miles based on a square mile grid, and assumes a lake level range of 4 meters. 6 Upper Snare Site 7 Hydroelectric Project Feasibility Study Report, NISHI-KHON/SNC-LAVALIN, November 1997, p.1 7 Study on Bluefish Hydro Expansion, NTPC, Nov 2013. This study noted that an added 6MW Bluefish peaking capacity operating at only 25% of capacity would, in combination with existing Snare and Bluefish capacities, accommodate the Yellowknife winter peak - and that the new 6 MW could likely generate at a higher capacity (48%) while existing units would operate at 80% of capacity with existing Bluefish units operating at 80% of capacity. Various possible diversion options were also noted that could improve overall plant capacity utilization. Available information does not indicate LTA added energy from this added capacity, or estimated capital costs for development options, or the likely time needed for further investigations and planning.
North Slave Resiliency Study March 2016
Attachment 3: Infrastructure Options Background A3-6
Lac La Martre Hydro
Planning studies have been undertaken for a potential hydro-electric development at Lac La Martre.
It is estimated the facility could provide up to 13 MW of hydroelectric generation capacity. The site is located approximately 20 km from the community of Wha Ti and could be connected to that community and also interconnected to the existing North Slave transmission grid. The generation station would provide system diversity during times of drought since it is located on a separate watershed from the Snare system.
Given the status of current information on this option, and the Base Case forecast grid loads, there is no basis for further examination of this option as a means to address resiliency to drought.
Snare Hydro Expansion
Many planning studies have been undertaken related to expansion of the Snare hydro system since at least 1970s. The potential hydro development sites investigated included, Burnside River, Camsell River, Emile River, Lockhart River, Snare River and many others.
In particular Site 4 and Site 7, both on Snare River upstream of Big Spruce Lake, have been investigated.
It is estimated Snare hydro expansion could provide up to 20 MW of additional hydroelectric generation capacity.
Given the status of current information on these options, and the Base Case forecast grid loads, there is no basis for further examination of these options as a means to address resiliency to drought.
3.4 OTHER RENEWABLE GENERATION OPTIONS
Non-hydro renewable generation options investigated by NTPC and the GNWT include biomass generation, wind farm development, solar generation, and battery energy storage systems. NTPC in December 2015 issued an Expression of Interest (deadline of January 8, 2016) for between 1 to 10 MW of new wind or solar projects for the North Slave system.
Biomass Generation
NTPC’s March 2015 Resource Planning and Drought Management document notes that a 10 MW biomass plant could be constructed in or near Yellowknife, which would provide firm capacity to the North Slave system, helping to improve the resiliency of the system.
Key factors affecting the economic viability of this option include finding customers for the heat produced by the system to offset the capital costs and securing a long-term fuel supply. Without a secure fuel supply and the ability to generate some revenue from heat sales, this option would likely be more expensive than diesel generation for stand-by service.
North Slave Resiliency Study March 2016
Attachment 3: Infrastructure Options Background A3-7
Wind Farm Development
In 2008 and 2015, Aurora Research Institute conducted studies of potential wind farm locations for the Yellowknife area.
The 2008 study indicated that the wind potential around Yellowknife area was relatively low and would require subsidies to be competitive with diesel. The study also noted that there is a hydro surplus on the North Slave system, so diesel energy would not be displaced by a wind project at present, which continues to be the case today. The 2008 study indicates the size of small scale wind turbines at 300 kW and the size of large scale wind turbines at 1.5 MW. The study estimated capital costs at $5,205/kW (approximately $5.2M/MW) for a small scale wind turbine, and at $3,260/kW (approximately $3.3M/MW) for a large scale wind turbine. At forecast long term average wind speeds the cost of energy from large scale grid-connected wind applications was estimated at $0.28/kW.h (or approximately the same cost of diesel generation at $1/litre fuel price).8
The 2015 study investigated whether Berry Hill or certain sites near Yellowknife would be high enough to reach above the inversion level to provide economically viable winter wind energy on the grid. The study identified Berry Hill and two hill complexes, one near Bluefish Dam area and the other near the Snare River Dams, as good potential sites for wind electricity generation based on their elevation and proximity to the grid. The study noted that Berry Hill could accommodate only one large scale wind turbine, Bluefish Dam hills could accommodate about one dozen large scale wind turbines, and Snare River hill complex could accommodate up to two dozen large scale wind turbines (one specific location of interest near the Snare Rapids Dam could accommodate three or four large scale wind turbines).
The 2015 study investigated whether Berry Bill and other hill sites near Yellowknife would be high enough to reach above the inversion layer to provide economically viable winter wind energy on the grid, e.g., average annual wind speeds of 5.8 to 6.0 m3/s (6.4 to 6.6 m3/s expected for Snare River hill sites). The study recommended the following next steps to be considered for the wind feasibility assessment:
1. Meteorological instruments with heated sensors and a meteoroidal mast of 50m or more should be installed on the sites in order to set up wind monitoring stations on the sites.
2. Once the measurements have been made, an economic assessment should be done to further compare the sites.
As noted above, NTPC has also recently announced an Expression of Interest call for new wind project ideas in the North Slave region.
8 The study states assumed capital costs of $3,360/kW, 8% interest cost and 20 year life (with mortgage style annual payments), operating cost of $150,000/year (about $0.066/kW.h), and harvesting an annual average wind resource of 5.5 m3/s (capacity factor of about 17.2%). The study estimated that an annual average wind resource of 6.0 m3/s would yield a capacity factor of about 20.7% (this would reduce the estimated cost of energy to about $0.24/kW.h).
North Slave Resiliency Study March 2016
Attachment 3: Infrastructure Options Background A3-8
Solar Generation
In 2012, the GNWT developed a Solar Energy Strategy for the 2012-2017 period which targets a significant expansion of solar generation in NWT, of up to 20% of the average annual electricity peak load in each community in order to reduce diesel generation and greenhouse gas emissions.
Presently small scale solar generation has been installed in several communities in the Northwest Territories. NTPC is also implementing a solar generation integration of 135 kW capacity in one of its power plants currently under construction (Colville Lake, an isolated diesel generation community).
The GNWT Solar Energy Strategy document notes that the expected average cost of connecting solar power to the grid would be $12/Watt9 (approximately $12M/MW).
With respect to the North Slave system, there are very few solar generation installations currently in place. As of July 2013, the installed solar generation capacity was approximately 5 kW in Yellowknife and 9.8 kW in Behchoko.10
As noted above, NTPC has also recently announced an Expression of Interest call for new solar project ideas in the North Slave region.
Battery Energy Storage System
NTPC has also taken a pilot initiative of integrating one its power plants (Colville Lake) with battery energy storage system consistent with recent initiatives across North America to address power reliability in isolated systems. The battery system was sized from the average summer load of Colville Lake in order to supply the full community load on the order of 3 hours when it is cloudy and the battery is not being charged from the solar array.
NTPC is also working on the possibility of battery energy storage system integration on the North Slave system for its diesel plant in Yellowknife. The NWT PUB Decision 15-2015 notes that NTPC’s July 9, 2015 application with respect to the Jackfish plant diesel units replacement considered purchasing a battery energy storage system to provide peaking capacity and short duration back-up for outages of primary power from the Snare Hydro system. The application noted that this option would not provide additional firm capacity to the system due to limited energy storage and that its primary purpose would be to improve stability which is not required while running diesel engines. Considering that the price of bulk energy storage is decreasing rapidly, NTPC recommended to delay purchasing batteries for at least a year to achieve maximum benefit.
9 The GNWT Solar Energy Strategy 2012-2017, p.7. 10 See Northland Utilities Net Metering Program application, dated July 31, 2013; NTPC response to the PUB Board Order 1-2014, dated April 1, 2014.
North Slave Resiliency Study March 2016
Attachment 3: Infrastructure Options Background A3-9
3.5 FOSSIL FUEL GENERATION OPTIONS
Diesel generation is currently available on the North Slave at the Jackfish power plant (see below) and at the Behchoko plant (1.7 MW) - the latter facility, however, is not included in the RFC for the North Slave (as it is on the transmission line to the Snare hydro). PUB approved diesel generation costs are currently (from the last NTPC GRA) based on an assumed 3.65 kW.h/litre average engine efficiency and forecast fuel cost of $1.027 per litre. Actual NTPC diesel fuel costs for the North Slave are lower than this approved cost (in range of about $0.79 to $0.88 per litre during the earlier parts of 2015, and about $0.71 per litre later in that year).
Jackfish Diesel Plant
Jackfish plant located in Yellowknife was built in 1969 and expanded a number of times since then, with the current installed capacity of 27.690 MW.11
As discussed in Attachment 1, the North Slave system generation source historical profile can be split into two distinct time periods: (1) the period prior to termination of the Giant and Con mines’ operational activities; and (2) the period after termination of the Giant and Con mines’ operational activities (about 2004/05 fiscal year).
Prior to the termination of the Giant and Con mines’ operational activities diesel generation was required to supply the balance of the required generation, averaging 51.5 GW.h/year and varying from 10.5 GW.h/year to over 138.4 GW.h/year. After the closure of both mines connected to the North Slave grid, the Jackfish plant provided mainly stand-by power to the North Slave system, or augmented hydro supply for peaking purposes. However, during low water conditions, Jackfish plant changes status and becomes a full-time operating power plant with multiple units operating to meet the power supply requirements.
Two of the Jackfish plant’s generating units, each Mirrlees rated at 5.180 MW, are slow speed marine engines that are difficult to maintain and to find parts for due to age. During the review process of NTPC’s 2015 application to the NWT PUB for the replacement of one of the Mirrlees units with modular diesel units, NTPC noted that these Mirrlees units have reached the end of useful life.12 NTPC also noted that the Jackfish plant, based on Required Firm Capacity (RFC), has been marginally below requirements for about 7 years, which was not a significant concern with the flat/stagnant peak load in Yellowknife over the past 5-7 years. However, with low water conditions and de-rating of the units, NTPC noted that the Jackfish plant RFC shortfall poses a larger risk, as the existing genset line-up may not be able to meet the demand in the event of a hydro supply loss in the North Slave system.13 The NTPC application noted that the proposed purchase of modular diesel units would meet RFC with pending retirement of Mirrlees unit(s), provide
11 NWT PUB Decision 15-2015, Table 2 and text at page 2. 12 NWT PUB Decision 15-2015, page 10. 13 NWT PUB Decision 15-2015, p.4
North Slave Resiliency Study March 2016
Attachment 3: Infrastructure Options Background A3-10
immediate cost effective generation consistent with long-term renewable goals (i.e., the units can be redeployed or sold when not required), and provide for flexibility / contingency generation.14
The PUB in Decision 15-2015 approved a project permit for NTPC to purchase and install five 1.15MW modular diesel units at Jackfish plant at a budget estimated cost of $6.2 million to replace the Mirrlees diesel unit and to address capacity concerns arising from low water conditions on the North Slave system. NTPC has proceeded to purchase these units for installation in 2016.
Looking beyond 2016, additional diesel capacity may also be required by various factors, including grid load growth and/or accelerated retirements of other existing diesel units due to long running hours required during the recent drought and hydro unit overhauls (see Attachment 1, Section 1.2.6 and Table A1-2).
Liquefied Natural Gas
NTPC Longer Term Resource Planning and Drought Management document of March 2015 noted that a 10 MW natural gas plant could be constructed in or near Yellowknife. This would provide firm capacity to the North Slave system. This option would require storage for liquefied natural gas (LNG). It was noted that LNG has proved to be a reliable option as part of the generation mix in Inuvik.
The document noted that capital costs for an LNG facility would likely be higher than for an equivalent sized diesel plant. The capital cost of the LNG storage facility in Inuvik, commissioned in 2014, was $6 million. The facility has a capacity to process approximately 250,000 GJ of LNG annually. However given the number of delivery trucks available and delivery logistics NTPC can displace approximately 40% of Inuvik’s electricity demand with LNG generation (about 150,000 GJ).
LNG generation operating fuel costs are forecast to be lower than diesel generation operating costs, which would be a benefit during times when diesel generation would otherwise be required. In the case of Inuvik LNG storage facility, for example, the delivered fuel cost of LNG is estimated at $0.28/kWh as compared to the diesel cost of $0.32/kWh. At the target LNG generation of 40% of the Town’s load, the annual fuel expense savings for Inuvik plant are estimated at approximately $540,000.
NTPC internal assessments in September 2014 noted that a permanent LNG solution in Yellowknife could result in fuel expense savings of 25%, assuming that actual operation of thermal generation is required and fuel cost savings for LNG compared to diesel fuel can be realized. However, as noted in NTPC's March 2015 report, storage costs and storage life of LNG fuel may provide challenges when an LNG unit is only used primarily for stand-by. Factors that might improve the economics of the LNG option were noted to include use of dual fuel units (that can use LNG and diesel or another type of fuel), LNG supply for municipal gas distribution, industrial customer use or heating
14 NWT PUB Decision 15-2015, pages 10-11.
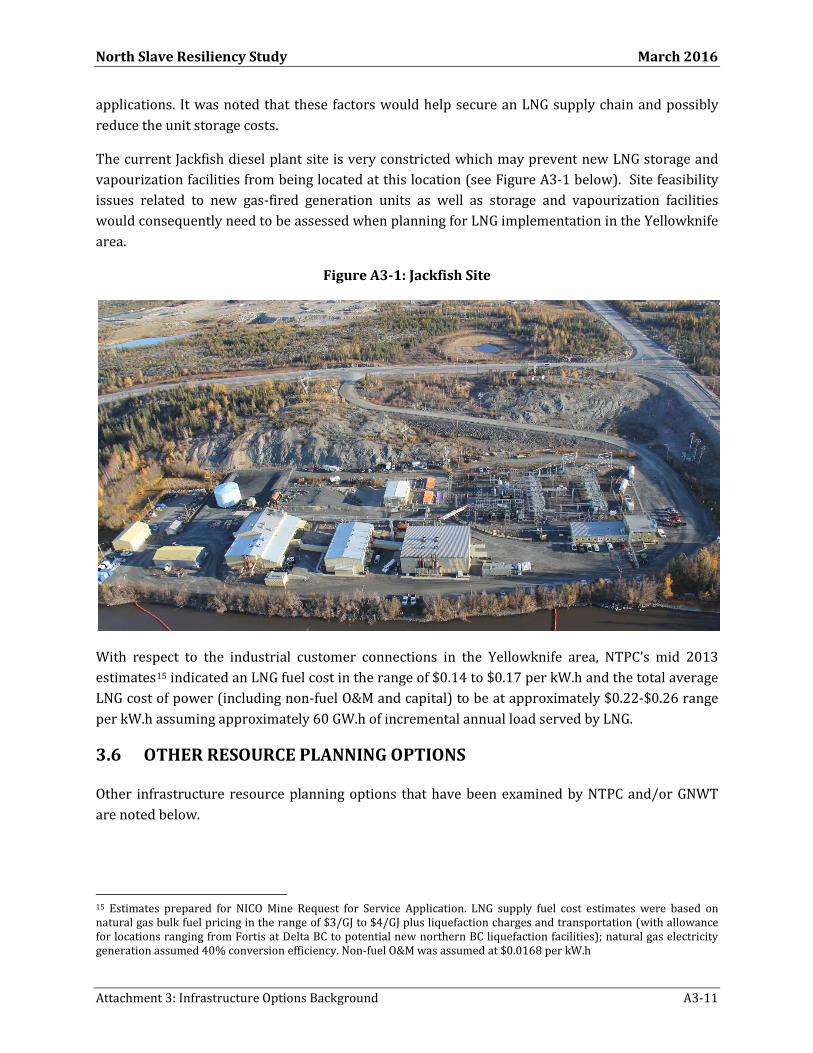
North Slave Resiliency Study March 2016
Attachment 3: Infrastructure Options Background A3-11
applications. It was noted that these factors would help secure an LNG supply chain and possibly reduce the unit storage costs.
The current Jackfish diesel plant site is very constricted which may prevent new LNG storage and vapourization facilities from being located at this location (see Figure A3-1 below). Site feasibility issues related to new gas-fired generation units as well as storage and vapourization facilities would consequently need to be assessed when planning for LNG implementation in the Yellowknife area.
Figure A3-1: Jackfish Site
With respect to the industrial customer connections in the Yellowknife area, NTPC’s mid 2013 estimates15 indicated an LNG fuel cost in the range of $0.14 to $0.17 per kW.h and the total average LNG cost of power (including non-fuel O&M and capital) to be at approximately $0.22-$0.26 range per kW.h assuming approximately 60 GW.h of incremental annual load served by LNG.
3.6 OTHER RESOURCE PLANNING OPTIONS
Other infrastructure resource planning options that have been examined by NTPC and/or GNWT are noted below.
15 Estimates prepared for NICO Mine Request for Service Application. LNG supply fuel cost estimates were based on natural gas bulk fuel pricing in the range of $3/GJ to $4/GJ plus liquefaction charges and transportation (with allowance for locations ranging from Fortis at Delta BC to potential new northern BC liquefaction facilities); natural gas electricity generation assumed 40% conversion efficiency. Non-fuel O&M was assumed at $0.0168 per kW.h
North Slave Resiliency Study March 2016
Attachment 3: Infrastructure Options Background A3-12
Demand Side Management
In the response to the 2014 Energy Charrette Report response, the GNWT provided a summary of GNWT energy initiatives for 2015-16 as part of the NWT Energy Action Plan (page 30 of the response). The GNWT energy initiatives include Energy Conservation and Efficiency programs, comprising:
• Energy Efficiency Incentive Program (EEIP) • Commercial Energy Conservation and Efficiency Program (CECEP) • EnerGuide Program • LED Streetlight Conversion Project • Support to Community Governments for Energy Efficiency Retrofits • Identify Power Plant Residual Heat Projects • Core Funding for the Arctic Energy Alliance (AEA)
Beginning May 1, 2014, the EEIP program is currently in place and provides rebates to residents of the NWT, including hydro communities, for energy efficient product purchases as part of the GNWT’s efforts to increase energy efficiency and help the residents of the Northwest Territories to reduce the high cost of energy.
Since 2010, NUL-Yellowknife has also commenced implementation of a program to convert streetlights in the City to LED bulbs.
These energy efficiency programs are relatively recent and an estimate of their overall impact on the future Base Case load in the NWT is not available for the purposes of the current assessment.16
Grid Expansion Options
The GNWT and NTPC have investigated the possibility of transmission interties between North Slave and Taltson hydro grids and southern jurisdictions. These options would provide necessary system diversity and resiliency during the times of drought. However, the feasibility work on the transmission line expansion revealed the associated capital cost would be well over $1 billion, which the GNWT stated was beyond its financial capacity.17 Such a project would be very capital intensive and require a strong commitment and coordination of efforts between the GNWT, NTPC and mining industry in the Territory. In particular, such a project would need to be able to be provide energy to the mines at competitive price (i.e. at a notably lower cost than diesel), factoring in the risks associated with limited mine life and sensitive commodity market conditions.
Separate from the option of a large transmission grid expansion that connects the north and south hydro systems and a southern jurisdiction, partnership with existing and/or new mines has also been explored to expand load on the North Slave system and provide an opportunity to pursue
16 NTPC estimated the revenue loss from the implementation of the LED streetlights program in 10 communities to date at approximately $0.234 million/year. 17 The GNWT Response to the 2014 NWT Energy Charrette Report, p. 5.

North Slave Resiliency Study March 2016
Attachment 3: Infrastructure Options Background A3-13
larger scale LNG facility development at Yellowknife and/or new renewable generation development. It has been noted that absent such connections to the hydro grid, existing and/or new mines are required to rely almost entirely on diesel generation as the primary source of electric power with its higher costs and GHG emissions.18
18 The GNWT. A Vision for NWT Power System Plan, December 2013. P.36


ATTACHMENT 4: RATE STRUCTURE AND OTHER NON-INFRASTRUCTURE
OPTIONS BACKGROUND

North Slave Resiliency Study March 2016
Attachment 4: Rate Structure and Non-Infrastructure Options Background A4-1
4.0 RATE STRUCTURE AND NON-INFRASTRUCTURE OPTIONS BACKGROUND
This Attachment provides a review of rate related, as well as other non-infrastructure options, as background for the Study's options assessment.
4.1 RATE RELATED OPTIONS IN NWT AND OTHER CANADIAN JURISDICTIONS
4.1.1 NWT Rate Practice Dealing with Low Water Levels
The first time NTPC filed a Low Water Application due to severe low water conditions was on August 8, 1994. In this application NTPC requested the NWT PUB’s (NWT PUB or the Board) approval to implement a temporary rider to recover additional diesel fuel expenses forecast to be incurred during the 1994/95 fiscal year. NTPC application requested a 22% across-the-board increase in rates to all customer classes in the Snare [North Slave] zone for the 12-month period.
During the review proceeding of NTPC’s application, Northland Utilities Yellowknife (NUL-YK) filed a submission with the Board proposing that NTPC’s forecast deficiency be dealt with through the implementation of a Low Water Reserve Fund to be funded from an energy based surcharge.1 NUL-YK proposed that the effect of its proposal would be to reduce the required rate increase to approximately 6%.
A number of interveners also commented on NTPC’s prudency with respect to dealing with potential for low water levels. Mr. Whitford, an MLA for Yellowknife South, questioned why NTPC did not start a reserve fund to cover years with low water immediately after the transfer of the Corporation to the Territorial Government.2 As well, counsel for NUL-YK stated that the occurrence of a severe water year with the associated significant financial impacts on ratepayers was clearly a foreseeable event, and that NTPC acknowledged this during cross-examination, as the past records confirmed that it has happened before.3
The PUB in Decision 12-94 accepted the position of the interveners that NTPC did not act with the prudence that could be reasonably expected of it.4 The Board then directed NTPC to develop a proposal for a low water stabilization fund at the time of its next GRA.
In response to the PUB direction, in the 1995/98 GRA NTPC submitted a proposal for a Rate Stabilization Fund to mitigate adverse impact on rates of unanticipated changes in fuel prices and deviations of hydro conditions from normal. The NTPC’s proposal included surcharges, where customers in the Snare/Yellowknife zone would be charged 0.5 cents/kW.h surcharge, which will be discontinued when the balance in the fund has reached or exceeded a cap of $5 million.5
1 NWT PUB Decision 12-94, p.4 2 NWT PUB Decision 12-94, p.20 3 NWT PUB Decision 12-94, p.19 4 NWT PUB Decision 12-94, p.20 5 NTPC 1995/98 Phase I GRA, p. 9-5
North Slave Resiliency Study March 2016
Attachment 4: Rate Structure and Non-Infrastructure Options Background A4-2
In Decision 1-97 the PUB stated that as part of the Settlement Agreement, the parties agreed to the establishment of stabilization funds but have different parameters for their operation.6 In particular, the parties agreed that there would be no surcharge implemented to build up the funds, contrary to the proposal of NUL-YK at the time of the 1994 Low Water Application review proceeding. The North Slave zone water fund would operate based on negotiated long term average water levels of 177 GW.h of hydro generation with NTPC being able to implement a rider once the range of plus or minus $3 million was exceeded for the water fund. In Decision 1-97, the PUB approved establishment of water and fuel stabilization funds as detailed in the Settlement Agreement.
In practice today, based on a directive from the Territorial government in 2010, there is a single Territory-wide rider, which is generally implemented when the consolidated fund balance reaches +/- $2.5 million and the rider is calculated to target a zero balance generally within a 12 month period (without any distinction between targets for fuel price and targets for water portions of the fund).
In accordance with PUB Decision 16-2010, effective December 2010, all individual NTPC rate stabilization funds (Diesel communities, Normal Wells, Inuvik, Taltson, North Slave Water, and North Slave Fuel) have been consolidated into one NTPC Territory-wide Consolidated Fuel and Water Rate Stabilization Fund (RSF). The RSF addresses a variety of rate stabilization measures (including fuel price stabilization as well as diesel generation stabilization as it is affected by hydro generation variations due to water availability).
In the 20012/14 GRA, NTPC included the forecast cost of 1.2 GW.h of diesel generation in the North Slave zone revenue requirement.7 During the GRA review process, NTPC confirmed that the cost of any diesel generation above the 1.2 GW.h included in rates is proposed to be charged or credited to the RSF. In Decision 1-2013, the PUB stated that in view of NTPC’s proposal that the fund (as applicable to the Snare [North Slave] zone) would capture all diesel cost variances, the PUB considered the reference to LTA hydro generation of 220 GW.h/year to be redundant and approved the following revised wording of the RSF operation as applicable to the Snare zone:8
"For the Snare Zone, the fuel costs for diesel generation built into base rates will not be charged via the fund, but fuel costs for diesel generation which are greater or less than this level are charged or credited to the fund."
In Decision 1-2013, the PUB also stated the following with respect to incentives for NTPC to maximize use of the hydro resource:
"The Board continues to be concerned by an RSF mechanism which allows pass through of all diesel costs as this may not provide the appropriate incentive for NTPC to maximize use of the hydro resource. The Board directs NTPC to address the feasibility of NTPC assuming forecast risk on diesel volume variances for the Snare Zone at the time of the next GRA."
Subsequent to Decision 1-2013, the RSF had no ability to help offset the impact of the recent North Slave drought impacts. NTPC went from a balance of zero in the water stabilization fund in April 2014 to a balance owing from ratepayers of $3.4 million at the end of September 2014 with
6 NWT PUB Decision 1-97, p. 26 7 NTPC 2012/14 Phase I GRA, p. 3-19. 8 NWT PUB Decision 1-2013, p. 94.
North Slave Resiliency Study March 2016
Attachment 4: Rate Structure and Non-Infrastructure Options Background A4-3
reservoir levels near record lows and with the expectation that ongoing drought conditions would greatly increase the balance owing from ratepayers.
To address this situation, NTPC filed a September 3, 2014 application for a two-year stabilization fund Territory wide rate rider (applicable to all firm power customers in the Territory with the exception of NUL-NWT) of 3.69 cents per kW.h to collect a forecast $20 million added cost resulting from over 60 GW.h of additional diesel generation forecast to be needed over two years due to the record low water conditions. NTPC subsequently withdrew its application when the GNWT agreed to fund the additional $20 million fuel costs for 2014-15.
One year later, GNWT provided a commitment for up to a further $28 million in 2015-16 to NTPC to offset the increased cost of electricity due to the additional diesel generation then expected to be required due to continued drought conditions on the North Slave system.
NTPC's March 30, 2015 "Snare System Medium to Longer Term Resource Planning and Drought Management" report noted as follows on financial mechanisms related to drought management:
"The current government elected to provide a contribution to NTPC to cover the cost of fuel for the drought event rather than pass those costs to customers through a rate rider. If a drought occurs again, it is likely that the government of the day will undertake a similar assessment and determine whether some level of government support is appropriate or whether NTPC should follow its standard practice to apply to the PUB for a rate rider to recover its costs. This practice is similar to what is in place in other jurisdictions as described below and it is supported by the fuel and water stabilization fudns that are currently in place. The curren practice avoid collecting funds from customers for events that are difficult to forecast and only in the event of a drought would a surcharge (rider) be applied which provides a better price signal for conservation." (page 11) "NTPC's current mechanism addresses affordability and intergenerational equity in rate setting and no change is recommended at this time. NTPC's stabilization funds have performed well and the mechanics and trigger levels have been developed in consideration of NTPC's unique operating circumstances." (page 19)
4.1.2 Existing rate related Options in Other Canadian Jurisdictions
NTPC's March 2015 report reviewed experience in other jurisdictions, including Yukon, Newfoundland and Labrador, British Columbia, Manitoba and Quebec. NTPC concluded from this review that there are three main types of mechanisms used bu other Crown utilities in Canada to manage drought risk impacts on utility rates:
1. Rate Stabilization Funds (practice noted in Yukon and Newfoundland and Labrador);
2. Retained Earnings Reserve Targets (practice noted in Manitoba); and
3. Government Absorbs Risk of Drought (practice noted in Quebec where distribution utility is effectively insulated from rate increases caused by a major drought).
North Slave Resiliency Study March 2016
Attachment 4: Rate Structure and Non-Infrastructure Options Background A4-4
The study team reviewed the existing options related to dealing with rate instabilities in Canadian jurisdictions and determined that where rate stabilization mechanisms were developed with respect to water variability, they were implemented either through reserve funds funded by ratepayers, or through government subsidies. Other jurisdictions with rate stabilization mechanisms include Yukon (Yukon Energy), Manitoba (Manitoba Hydro), and Newfoundland (Newfoundland Hydro) as summarized below. The Quebec and British Columbia jurisdiction practices were not considered to provide examples that would be helpful to the current review related to NTPC's North Slave system.
4.1.2.1. Yukon
Yukon Energy Corporation (YEC) operates a Diesel Contingency Fund (DCF) to provide rate stabilization from variability in generation costs from approved forecasts due only to fluctuations in available water flows and wind.
Yukon’s system is very similar to NTPC’s North Slave system in the context that YEC operates an isolated hydro grid with no interconnection to other jurisdictions (no ability to purchase power from others in the event of drought and no access to additional revenues from sales of surplus power to other jurisdictions).
The Yukon grids since the late 1980s have experienced a wide range of load conditions that were reflected in the rate stabilization mechanisms adopted and applied from time to time with regard to water availability. Prior to 2012, there were two separate hydro grids in Yukon: the Whitehorse-Aishihik-Faro (WAF) grid and Mayo-Keno grid (which slightly over a decade ago was expanded to become the Mayo-Dawson grid).
1. After the late 1980s, when the United Keno Mine closed, the Mayo-Keno (and subsequent Mayo-Dawson) grid had surplus hydro conditions such that no drought related issues were considered necessary to address.
2. In contrast, when the Faro mine was operating in the 1990s, the WAF grid load was sufficient that changes in hydro generation on the Yukon grid due to changes in water flow availability had a direct, opposite and equal impact on diesel generation – and any change in load from GRA forecasts also was 100% reflected in changes in expected diesel generation under long-term average hydro generation water conditions. The Low Water Reserve Fund (LWRF) and then the DCF were established as a dedicated fund on WAF during this period to reflect the regulatory premise that ratepayers bear the risk (cost or benefit) for all water-related hydro generation changes that cause changes in diesel generation relative to the last GRA approved forecast hydro generation – and the LWRF-DCF mechanisms were kept entirely separate from the Rider F rate stabilization mechanism addressing fluctuation in diesel fuel prices from GRA forecasts.
3. When the Faro mine was not operating in the 1990s, and after it was closed in early 1998, the reduced load resulted in surplus hydro generation on the WAF grid under long term average hydro generation water conditions. Accordingly, DCF operation was suspended under these load conditions except when severe drought conditions in 1999 briefly caused
North Slave Resiliency Study March 2016
Attachment 4: Rate Structure and Non-Infrastructure Options Background A4-5
a need to operate diesel generation. During these conditions GRA approved rates only included diesel generation costs related to winter peaking and maintenance operation requirements, i.e., rates did not include any diesel generation costs that reflected sensitivity to hydro generation water flow availability.
By 2012, interconnection of the WAF and Mayo-Dawson grids combined with load growth resulted in conditions where diesel generation costs were once again sensitive to hydro generation water flow availability. Yukon Utilities Board (YUB) Order 2013-01 directed that 2012-2013 test year GRA rates reflect 100% of diesel generation forecast to be required on the integrated grid under long-term average hydro generation conditions – and Yukon Energy filed for approval to resume operation of the DCF with modifications to reflect current integrated grid conditions (including recognition that, unlike the 1990s when the Faro mine was operating, expected diesel generation under long-term average generation would currently account for less than 100% of any changes in grid loads from the GRA forecast).
Historically, the DCF was to be used only for offsetting baseload diesel generation changes due to the hydro/wind variances from long-term forecasts reflected in rates set in a GRA, and the DCF was only active when YEC diesel was on the margin. The 1996 evidence presumed YEC diesel generation was not on the margin for the WAF system when the Faro mine was closed.
Under the updated approach approved by the YUB Order 2015-01, the Fund has been permanently switched “on” through a formulaic approach that, subject to YUB review at each YEC GRA, automatically adjusts forecast long-term YEC hydro generation and related diesel (or other non-diesel fossil fuel) YEC generation to reflect actual YEC grid generation load. Accordingly, there would no longer be a YEC diesel "on the margin test" for activating the DCF.
The formulaic approach determines annual expected YEC thermal generation, using a simulation model, based on long-term average (LTA) YEC hydro generation at different YEC grid loads (net of expected wind and expected or LTA Fish Lake hydro generation). The currently approved table sets out LTA hydro generation and related diesel generation for relevant grid loads ranging from 390 to 475 GW.h/year.9 The costs related to the difference between actual and expected thermal generation for a given grid load are then charged or refunded to the DCF.
YUB Order 2015-01 set the DCF threshold cap at +/- $8 million as was recommended by YEC. If the cap is exceeded at the end of any fiscal year, YEC will provide an application to the YUB for a rate rider charge or rebate as required to deal with such excess or deficit (including a proposal as to the term for such rider). A Rider E rebate was approved in Order 2015-06 as the Fund by the end of 2014 had exceeded the $8 million cap.
9 The YECSIM simulation model develops expected hydro plant capabilities for each load scenario. It reviews, by week, 28 "water years" of record (1981-2008) and 20 "load years" (each examines a different hypothetical scenario to reflect different sequences of the recorded water years), of which 13 load years (load years 7-19) are used for the final averaging (this deletes cases where starting or ending year volumes can distort results). "Hydro Generation" is long-term average hydro generation as estimated by YECSIM.
North Slave Resiliency Study March 2016
Attachment 4: Rate Structure and Non-Infrastructure Options Background A4-6
4.1.2.2. Manitoba
Drought is a major risk for Manitoba Hydro and planning for drought is a major consideration for Manitoba Hydro and its regulator (Manitoba PUB). However, there are several material differences between Manitoba and NWT electrical systems and rate structures, including:
• Manitoba Hydro has extensive connections to several neighbouring jurisdictions, including interconnection with the US grid - with resulting ability to secure power from other jurisdictions during periods of drought and to sell surplus hydro generation to other jurisdictions when water supplies are well above long term average and/or domestic loads are inadequate to fully utilize long term average hydro generation.
• Manitoba Hydro has no formal rate stabilization fund(s) for water change impacts or fuel price changes from GRA forecasts - and does not do any formal accounting to track such variances.
• Manitoba Hydro uses rate revenues as approved by its regulator to build up equity/retained earnings to fund all of its major risks (including drought).
• Manitoba Hydro is not rate base regulated - in contrast, under the overall ratemaking context for Manitoba Hydro, ratemaking requires consideration of long-term financial targets and projections of 10 to as much as 20 years.
Rate regulation for Manitoba Hydro recognizes the ultimate need for the utility to recover drought related cost impacts from ratepayers and notes the related objective of gradualism and sensitivity to customer impacts (as opposed to seeking rapid recovery of added costs from drought, or rapid rebate of surpluses earned under favourable water conditions).
In order to provide for drought and other major risks, Manitoba Hydro's rate revenue has been approved to build up its equity and reduce its debt to equity ratio (from about 90/10 in the late 1980s to a current target of 75/25) in order that its equity can be sufficient, as a fund, to address drought and other risk events - on the premise that, after such events, rates will be again increased as required to replenish this equity as needed over several years to achieve the target debt/equity ratio. Over the past decade, the PUB has granted rate increases in excess of Manitoba Hydro requested rate increases in order to build retained earnings and manage risks that the PUB considers the utility may be not adequately considering.
In the 2004 GRA proceeding for Manitoba Hydro, a severe drought (and consequent reduced power generation and export potential) from 2002-2004 resulted in losses to Manitoba Hydro in excess of $400 million10 – the highest loss ever experienced by Manitoba Hydro at the time. These losses were recovered in their entirety from ratepayers through a series of rate increases as directed by the PUB in Order 101/04 and Order 143/04. The Manitoba PUB in Order 101/04 noted “the drought’s impact on the Corporation’s retained earnings”, and “a related and increased realization [by the PUB] of the financial and operating risks faced by MH11”, underlined the decision to provide
10 Manitoba PUB Order 101/04, p. 2 11 Manitoba PUB Order 101/04, p. 2
North Slave Resiliency Study March 2016
Attachment 4: Rate Structure and Non-Infrastructure Options Background A4-7
Hydro with a 5% rate increase [effective August 1, 2004 for all customer classes], followed by two conditional rate increases of 2.25% (for each of 2004/05 and 2005/06 upon application of Manitoba Hydro).
Manitoba Hydro has been able to meet its target debt to equity ratio of 75/25 since 2008, except for the last two years, with the ratio being at 76/24, and 79/21, respectively, due to the significant investment in major new generation and transmission capital which is primarily funded through debt financing.12
4.1.2.3. Newfoundland
Newfoundland Hydro operates the Rate Stabilization Plan (RSP), which was established in 1985 and is a complex rate stabilization mechanism with separate funds to manage changes from GRA forecasts with regards to fuel price; changes in fuel volumes compared to forecast, i.e., addresses changes in load compared to forecast; water variability; and rural rates13. In addition to other complexities, fund payments/ withdrawals are assigned according to rate class - and load variation provisions (i.e., changes in load relative to forecast) affecting each rate class add a wide range of issues, which is very different from NTPC’s approach.
There have been many changes that have occurred with regards to the operation of the RSP since its inception in 1985 mostly due to large accumulated balances in the accounts which would cause volatility in rates, instead of eliminating such volatility. The best and most recent example of the special issues for this fund is the load variation component of the RSP [which doesn’t exist in other jurisdictions] which reached about $160 million in 2013 when Newfoundland Hydro owed money to industrial customers due to closure of some industrial customers causing actual industrial load being very low compared to the test year. This balance was several times higher than the then current annual revenues from industrial customers, i.e. Newfoundland Hydro would need to provide energy for free to industrial customers for several years in order to eliminate the negative balance. In 2013, the provincial government issued an Order in Council (OC) to allocate this surplus between industrial and retail non-industrial customers. In accordance with the OC, industrial customers would receive RSP surplus funds of $49 million through the three year phase-in of the new industrial rates.14
4.1.3 Conclusions re: Rate Related Options in other Canadian Jurisdictions
In conclusion it is noted that while each of the above three noted jurisdictions developed specific mechanics for funds or other mechanisms to address rate instability, including those related to water variability, the following core principles are common to all of the jurisdictions reviewed:
1. The risk of cost impacts caused by water variability are ultimately borne by ratepayers, and not by the Crown utility or its shareholder.
12 Manitoba Hydro 2014-15 Annual Report, p. 34 13 Newfoundland and Labrador Hydro Rate Stabilization Plan Report, July 2014, p. 1 14 Newfoundland and Labrador Order in Council (OC) OC2013-089 dated April 4, 2013 as amended by OC2013-207 dated July 16, 2013.
North Slave Resiliency Study March 2016
Attachment 4: Rate Structure and Non-Infrastructure Options Background A4-8
2. Drought is an integral part of hydro system costs and planning, even if its timing is highly uncertain. These costs are appropriately borne, to the extent feasible, as part of ongoing rates in order to provide stability and intergenerational equity in rate setting.
3. Water availability can be assumed to be self-correcting over time and that some form of fund might help to stabilize rates in this regard assuming sufficient threshold for the fund balance accumulation is maintained (rather than mechanisms to move the fund to zero within a set short term period, as is typically the case for thermal rate riders designed to address fluctuation in thermal energy prices that are beyond the control of the utility).
4.1.4 Review Rate Related Options to Limit Rate Instability from Water Variability
Based on review of the existing options in the NWT and other Canadian jurisdictions, it appears that one option for the NWT would be to establish a stabilization fund designed specifically to address water variability, which could follow the Yukon-style DCF fund framework.
The DCF operates in Yukon to smooth customer rate changes and changes in forecast fossil fuel generation costs (including diesel and natural gas) due to variability in existing grid hydro and wind generation. The Fund is only to be used for these purposes and is not to be accessed for other reasons, including government subsidy of rates, without prior YUB approval.
Implementation of a similar rate stabilization fund for the North Slave system would need to consider the following issues:
• The fund mechanics require determining proper LTA hydro generation for the system. The LTA hydro generation would be influenced by the required system load (LTA hydro generation would be higher when system load is higher).
• At the current and expected base case system load forecast, the current estimated LTA hydro generation of 220 GW.h would always be above the system load, meaning that expected diesel generation for the base case forecast load would be zero (excluding provisions of minimal diesel generation for emergencies and winter peaking requirements, as well as requirements related to capital plans). As such, the fund would likely only accumulate charges to it (during low water conditions) without any opposite ability to accumulate surpluses (i.e., there can be no thermal generation savings until it is possible for actual hydro generation to exceed LTA hydro generation).
• The fund mechanics can work if the system load increases significantly, which is possible through new industrial load connections. In this case, the proper LTA hydro generation could be calculated for different system loads to determine expected base thermal generation not related to water variability.
North Slave Resiliency Study March 2016
Attachment 4: Rate Structure and Non-Infrastructure Options Background A4-9
• In considering rate charges related to the fund, it is relevant to assess whether rate riders should continue to apply to all firm rate customers in the Territory other then NUL-NWT (versus apply only to firm customers in the North Slave).
4.2 REVIEW OTHER NON-INFRASTRUCTURE OPTIONS
The cost of diesel generation related to drought must be funded. In this context, it must either be expensed by the utility as a charge against the shareholder, which is not sustainable, or recovered from ratepayers, or paid for by third parties. The option of recovering the drought related costs from ratepayers could be through establishment of a rate stabilization fund as discussed in the preceding section. The third party payment options may include:
1. Government subsidy in response to a drought event, similar to what was done to address the costs related to the current drought on the North Slave system; or
2. Government annual appropriation to sustain and accumulate required funds to a low water reserve fund.
There has been no evidence of any other utility or jurisdiction in Canada purchasing any form of low water cost insurance from third parties. This option is therefore not considered further in this study.