p r cl&p / uc r c emergency preparedness and … review of a cl&p/uconn report concerning...
TRANSCRIPT

Peer review of a CL&P / UConn rePort ConCerning emergenCy PreParedness and resPonse at seLeCtive CritiCaL faCiLities
JanUary 2014
a rePort By
the ConneCtiCUt aCademy of sCienCe
and engineering
for
the ConneCtiCUt dePartment of energy and environmentaL ProteCtion


Peer review of a CL&P / UConn rePort ConCerning emergenCy
PreParedness and resPonse at seLeCtive CritiCaL faCiLities
a rePort By
the ConneCtiCUt aCademy of sCienCe and engineering
Origin Of inquiry: COnneCtiCut Department Of energy anD envirOnmental prOteCtiOn Date inquiry establisheD: OCtOber 1, 2013
Date respOnse releaseD: January 3, 2014
© Copyright, 2014. ConneCtiCut ACAdemy of SCienCe And engineering, inC. All rightS reServed

peer review of a cl&p/uconn report concerning emergency preparedness and response at selective critical facilities
ii connecticut academy of science and engineering
this limited-scope analysis consists of a peer review by an Academy committee of a study concerning emergency preparedness and response at selective critical facilities, conducted by the Connecticut light and power Company, and the uConn School of engineering and uConn School of Business. the content of this report lies within the province of the Academy’s energy production, use and Conservation technical Board. martha Sherman, the Academy’s managing editor, edited the report. the report is hereby released with the consent of the peer review Committee.
richard h. Strauss executive director
peer review of a cl&p/uconn report concerning emergency preparedness and response at selective critical facilities
iii connecticut academy of science and engineering
memBerS of the peer revieW Committee on A Cl&p report ConCerning emergenCy prepAredneSS And reSponSe At
SeleCtive CritiCAl fACilitieS
Michael F. Aherndirector, power Systems Corporate and professional educationWorcester polytechnic institute
Gerry BinghamSenior Coordinator, distributed generation policymassachusetts department of energy resources
Sten Caspersson (Academy Member)Consultant, nuclear power
Arthur DuBois, MD (Academy Member)director emeritus and fellow emeritus, John B. pierce laboratory, inc.; professor emeritus of epidemiology and professor of Cellular and molecular physiologyyale university School of public health
A. George Foyt, ScD (Academy Member)manager of electronics researchunited technologies research Center (ret.)
Joel Gordesprincipalenvironmental energy Solutions Associates, inc.
Matthew S. Mashikian, PhD (Academy Member)emeritus professor of electrical engineeringuniversity of Connecticutpresident and Ceo, imCorp
Joseph McGeevice president, public policy and programsThe Business Council of Fairfield County
Saytha Motupally, PhD (Academy Member)vice president of engineering Clearedge power
Fred L. Robson, PhDCeo & presidentrpm Sustainable technologies, inc.
Ripudaman “Ripi” Singh, PhD (Academy Member)director of research and developmentAlstom power
Jane StahlConsultantdeputy CommissionerCt department of environmental protection (ret.)
Leonard Wyethprincipal, Wyeth Architects llC
RESEARCH TEAM
STUDY MANAGERDavid Pines, PhD
Associate professor, Civil, environmental, and Biomedical engineeringuniversity of hartford
ACADEMY PROJECT STAFFRichard H. Strauss, executive director
Terri Clark, Associate directorAnn G. Bertini, Assistant director for programs

peer review of a cl&p/uconn report concerning emergency preparedness and response at selective critical facilities
iv connecticut academy of science and engineering

peer review of a cl&p/uconn report concerning emergency preparedness and response at selective critical facilities
vconnecticut academy of science and engineering
tABle of ContentS
tABle of ContentS ............................................................................................v
i. StAtement of inquiry: proJeCt intent And BACkground .......1
ii. CASe teChniCAl revieW proCeSS ...........................................................3
iii. SummAry of puBliC ACt 12-148 ................................................................5
iv. prC findingS ...................................................................................................9
v. BeSt prACtiCe SourCeS: reliABle poWer for CritiCAl fACilitieS ...............................................................................................17
iv. poSSiBle funding SourCeS for miCrogrid proJeCtS: StAte And federAl ............................................................................................21
AppendiCeS ..........................................................................................................25
Appendix A: Connecticut light and power Company Analysis of Selective hardening options: introduction and executive Summary to Analysis reports .........................................................................................................25
Appendix B: Cl&p response to questions from Connecticut Academy of Science and engineering............................ ..............................................................................40
Appendix C: prC questions/Comments on Cl&p/uConn reports with mapping of Cl&p/uConn responses ....................................................................................50
Appendix d: navigant research microgrids research Service ..........................70

connecticut academy of science and engineeringvi
peer review of a cl&p/uconn report concerning emergency preparedness and response at selective critical facilities

peer review of a cl&p/uconn report concerning emergency preparedness and response at selective critical facilitiesstatement of inquiry: project intent and background
connecticut academy of science and engineering 1
STATEMENT OF INQUIRY: PROJECT INTENT AND BACkGROUND
on behalf of the Connecticut department of energy and environmental protection (deep) in accordance with Section 7(f) of public Act 12-148: An Act enhancing emergency preparedness and response, the Connecticut Academy of Science and engineering (CASe) performed a peer review of reports prepared for deep by Connecticut light and power Company (Cl&p) and the uConn Schools of engineering and Business on methods of providing reliable electric services to critical facilities.
reports reviewed by the CASe peer review Committee (prC) included the following:
• Analysis of Selective Hardening Options: Introduction and Executive Summary to Analysis Reports by Cl&p, december 11, 2013 (see Appendix A) (note: this version was used for the development of findings by the PRC. The original version of this report, Analysis of Selective Hardening Options: Introduction to Project Reports, dated may 31, 2013, was used by the prC in the development of questions for Cl&p/uConn. it is noted that as a result of the CL&P/UConn Briefing for the PRC, CL&P revised this report to include an executive Summary.)
• Reliability of Selective Hardening Options by the uConn School of engineering (principal Authors: peng Zang, gengfeng li, and peter luh), may 31, 2013
• Life-Cycle Cost Analysis of Selective Hardening Options by the uConn School of engineering (principal Authors: Sung yeul park and Sung min park), may 31, 2013
• Benefit-CostAnalysisofSelectiveHardeningOptionsby the uConn School of Business (principal Authors: michel rakotomavo and Albert tzu-Wen lin), may 31, 2013
Cl&p and uConn School of engineering briefed the prC on the reports and responded to the questions submitted by the prC. the prC submitted additional questions following the briefing. CL&P and the UConn Schools of Engineering and Business responded to the questions and comments submitted by the prC by either modifying their reports or submitting a separate written response to questions raised by the prC (see Appendix B: CL&P Response to Questions from Connecticut Academy of Science and Engineering; and Appendix C: PRC Questions/Comments on CL&P/UConn Reports with Mapping of CL&P/UConn Responses (Appendix B) noted). this additional information was taken into consideration in development of the peer review report.
The PRC provided comments and findings for use in the development of the peer review report. Additionally, at deep’s request, the CASe project management team conducted an initial scan of best practices for providing reliable power to critical facilities and identified possible funding sources for microgrid projects.
The PRC provided comments on the draft peer report, which was finalized on January 3, 2014.
connecticut academy of science and engineering2
peer review of a cl&p/uconn report concerning emergency preparedness and response at selective critical facilities
statement of inquiry: project intent and background
this report includes the following sections:
• CASe technical review process
• Summary of public Act 12-148
• prC findings
• Best practice Sources: reliable power for Critical facilities
• possible funding Sources for microgrid projects: State and federal
• Appendices
peer review of a cl&p/uconn report concerning emergency preparedness and response at selective critical facilitiescase technical review process
connecticut academy of science and engineering 3
CASE TECHNICAL REvIEW PROCESS
• Appointed a peer review Committee (prC) comprising Academy members and other experts to conduct a peer review of the final study report.
• provided study materials to the prC and organized and facilitated committee meetings to discuss and deliberate on the topic.
• Submitted questions to Cl&p and the uConn Schools of engineering and Business for consideration in preparation of report briefing to the PRC.
• PRC received a briefing on the CL&P and UConn Schools of Engineering and Business reports on november 15, 2013.
• facilitated communication between the prC, and Cl&p and uConn Schools of engineering and Business on questions from review of the Cl&p/uConn reports and briefing.
• Briefed the deep, Cl&p, and the uConn Schools of engineering and Business on the CASe prC peer review report.
• Delivered the final peer review report summarizing the PRC’s analysis of the final Cl&p/uConn reports.

connecticut academy of science and engineering4
peer review of a cl&p/uconn report concerning emergency preparedness and response at selective critical facilities

peer review of a cl&p/uconn report concerning emergency preparedness and response at selective critical facilitiessummary of public act 12-148
connecticut academy of science and engineering 5
SUMMARY OF PUBLIC ACT 12-148: AN ACT ENHANCING EMERGENCY PREPAREDNESS AND RESPONSE
to provide a context for the Cl&p/uConn study, the sections of public Act 12-148 that are relevant to improving the reliability of providing electric power to critical facilities are highlighted below, with specific emphasis on text highlighted in “red.” This includes Section 7(f) that specifically calls for a study to evaluate methods for providing reliable electric service to critical facilities. the highlights are:
seCtiOn 3:(a) “. …’emergency’ has the same meaning as provided in section 16-32e of the general statutes,
as amended by this act.”
(b) “The Public Utilities Regulatory Authority [PURA] shall … establish industry specific standards for acceptable performance by each utility in an emergency to protect public health and safety to ensure the reliability of such utility’s services to prevent and minimize the number of service outages or disruptions and to reduce the duration of such outages and disruptions, to facilitate restoration of such services after such outages and disruptions and to identify the most cost-effective level of tree trimming and system hardening, including undergrounding, necessary to achieve the maximum reliability of the system and to minimize service outages.”
“… The authority shall allow, in a future rate proceeding, each utility to recover the reasonable costs incurred by such utility to maintain or improve the resiliency of such utility’s infrastructure necessary to meet the standards established pursuant to this section pursuant to a plan first approved by the authority.”
seCtiOn 5:(a) Restoration of intrastate telecommunications service, as defined in section 16-247(a) of the
general statutes, includes the following:
• telephone companies
• Certified telecommunications providers
• Certified competitive video service providers
• Community antenna television companies
• Holders of a certificate of cable franchise authority
• Voice over internet protocol service providers (Sec 6 (b))
the standards established by purA shall be limited to any portion of an emergency in which the intrastate telecommunications service outage:

connecticut academy of science and engineering6
peer review of a cl&p/uconn report concerning emergency preparedness and response at selective critical facilities
summary of public act 12-148
• Affects more than 10% of the companies supply/access lines
• lasts more than 48 consecutive hours
• Wasn’t caused by internal or competitive willful negligence
(b) paraphrasing further requirements:establishing emergency restoration standards for, and including:
• Communication coordination with the State, municipalities and power distribution companies.
• power distribution company call centers
• Assigned representatives of each power distribution company
• Service restoration & Subscriber safety
seCtiOn 6: (a) As used in this section: ‘emergency’ means any:
1. hurricane
2. tornado
3. Storm
4. flood
5. high water
6. Wind-driven water
7. tidal wave
8. tsunami
9. earthquake
10. volcanic eruption
11. landslide
12. mudslide
13. Snowstorm
14. drought
15. fire explosion
16. Attack or series of attacks by an enemy of the United States…
peer review of a cl&p/uconn report concerning emergency preparedness and response at selective critical facilitiessummary of public act 12-148
connecticut academy of science and engineering 7
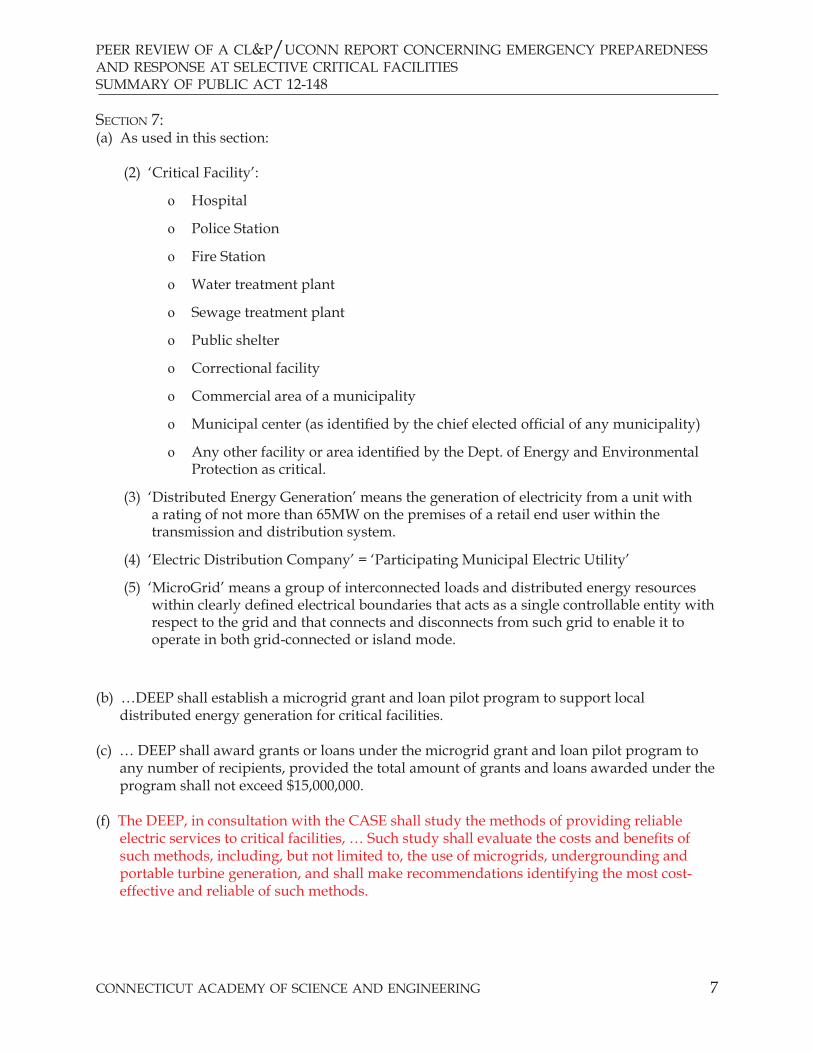
seCtiOn 7:(a) As used in this section:
(2) ‘Critical facility’:
v hospital
v police Station
v fire Station
v Water treatment plant
v Sewage treatment plant
v public shelter
v Correctional facility
v Commercial area of a municipality
v Municipal center (as identified by the chief elected official of any municipality)
v Any other facility or area identified by the Dept. of Energy and Environmental protection as critical.
(3) ‘distributed energy generation’ means the generation of electricity from a unit with a rating of not more than 65MW on the premises of a retail end user within the transmission and distribution system.
(4) ‘electric distribution Company’ = ‘participating municipal electric utility’
(5) ‘microgrid’ means a group of interconnected loads and distributed energy resources within clearly defined electrical boundaries that acts as a single controllable entity with respect to the grid and that connects and disconnects from such grid to enable it to operate in both grid-connected or island mode.
(b) …DEEP shall establish a microgrid grant and loan pilot program to support local distributed energy generation for critical facilities.
(c) … DEEP shall award grants or loans under the microgrid grant and loan pilot program to any number of recipients, provided the total amount of grants and loans awarded under the program shall not exceed $15,000,000.
(f) the deep, in consultation with the CASe shall study the methods of providing reliable electric services to critical facilities, … Such study shall evaluate the costs and benefits of such methods, including, but not limited to, the use of microgrids, undergrounding and portable turbine generation, and shall make recommendations identifying the most cost-effective and reliable of such methods.
connecticut academy of science and engineering8
peer review of a cl&p/uconn report concerning emergency preparedness and response at selective critical facilities
summary of public act 12-148
seCtiOn 10:the Connecticut department of transportation and any municipality shall notify the public utilities regulatory Authority of any pending project involving the construction, alteration, reconstruction, improvement, relocation, widening or changing of the grade of a section of any state highway or any other public highway that is greater than 5 miles long or located in a commercial area. the authority, upon determination that such project may provide an opportunity for any public service company, … to install, replace, upgrade or bury any water, sewer or gas line, electric wire or cable or fiber optics, shall notify such company of such project.

connecticut academy of science and engineering 9
peer review of a cl&p/uconn report concerning emergency preparedness and response at selective critical facilitiesprc findings
PRC FINDINGS The PRC concluded, based on a review of CL&P/UConn reports, that this study is a first step toward quantifying options for storm-related hardening. However, given the self-identified limitations and subsequent limitations identified by the PRC, more comprehensive analysis is required before deciding on both the short-term and long-term approach that should be undertaken by the state to harden electric services to critical facilities. further analyses should include combined heat and power (Chp) and microgrids for an entire municipal center, a critical facility as defined by Public Act 12-148, and thus may yield different results. In their Summary of Conclusions, Cl&p provides additional scenarios that support the need for more detailed analysis and the finding that “there are circumstances where the benefit/cost ratio of microgrids and/or undergrounding could be improved.” For example, “the recent CT department of energy & environmental protection (deep) microgrid grant awards to Wesleyan University, UConn, and the University of Hartford illustrate how campus configurations can be cost effective, reliable, and beneficial projects to the State and society.” In addition, a more holistic, all-hazards framework should be included in the analysis to broaden its applicability. While storms may have a greater frequency, other hazards can inflict as much if not greater damage to the infrastructure for a longer duration of time, extending into months-long outages for certain events.
in selectively hardening town centers or the areas that include critical facilities and services, consideration should be given to implementing changes with a vision of what the electric power grid should look like well into the future. In this context, the “future” means considering converting century-old grid technology to a smart grid system that includes the following functional characteristics (fromSmartGridProgramoftheOfficeofEnergy,U.S.DepartmentofEnergy)
• Self-healing from power disturbance events
• enabling active participation by consumers in demand response
• operating resiliently against physical attack and cyberattack
• providing power quality for 21st century needs
• Accommodating all generation and storage options
• enabling new products, services, and markets
• Optimizing assets and operating efficiently
the hardening upgrades should not be a band-aid approach, but rather an investment in a more reliable and robust electricity transmission and distribution system providing safe, reliable service that is cost effective; non-energy benefits such as health and safety should also be considered. Also, a vulnerability analysis similar to that conducted by rhode island can help to identify the best option for each critical facility as well as ranking the importance for allocation of resources for deployment.1
1 rhode island State hazard mitigation plan: http://www.riema.ri.gov/preparedness/preparenow/prepare_docs/ri_State_hm_plan final.pdf

connecticut academy of science and engineering10
peer review of a cl&p/uconn report concerning emergency preparedness and response at selective critical facilities
prc findings
it is important to note that the Cl&p/uConn study was undertaken prior to and not in response to public Act 12-148. instead, the scope of the study was developed and determined by Cl&p at its sole discretion based on feedback after its performance during the 2011 storms from internal critiques, municipal forums, Witt review, governor’s two-Storm panel review, davies Consulting assessment, liberty Consulting review and legislative hearings of the Connecticut general Assembly. With this in mind, the study still addressed much of Section 7(f) of public Act 12-148. however, further study is recommended to address the issue of ensuring the reliability of utility power & communication distribution services to prevent and minimize the number of service outages or, at the very least, reduce the duration of outages and disruptions. it appears that rather than helping to ensure the reliability of utility power & communication distribution services, the findings of the study shift the responsibility for providing power to critical facilities to the municipalities or private owners.
important issues that were not addressed in the study were:
• ownership, operation, and maintenance of the proposed hardening alternatives and the responsibilities, if any, Cl&p would have in an emergency event. results of the analysis may be different depending on whether the facilities are utility, publicly, or privately owned and whether they are self financed. Also, the study did not discuss how microgrids would be integrated with iSo new england, or that many towns may not want to have a diesel generating facility located in their town center.
• no reliability goals were established for the critical facilities. furthermore, it is important to state that 100% reliability cannot be attained, so that the public will not be led to believe that there will never be an outage. each critical facility will likely have its own acceptable outage duration requirements. for example, instantaneous switch over is needed for a hospital and sewage treatment facility, and in some instances the needs of the critical facility may also require uninterruptible power supply (battery backup) to bridge the lag between an outage and the generator carrying the loads. these also have measurable costs, maintenance and environmental impacts. for other critical facilities, such as a shelter, it may be acceptable to have an outage of a few hours. the vulnerability analysis included in rhode island’s State hazard mitigation plan provides one source of acceptable outages that range from minutes to hours for power restoration in an emergency.
Consideration also should be given to the overall intent of public Act 12-148, which is to prevent and minimize the number of service outages and reduce their duration. for example, the hardening of the overall electric power grid may reduce the requirements or need of some critical facilities while not changing the requirement for others.
the following sections discuss issues related to the electric hardening alternatives analyzed, selection of critical facilities, life cycle cost assumptions, selection of fuel supply, selection of town centers, and general comments on Cl&p’s Analysis of Selective hardening options introduction and executive Summary to Analysis reports.

connecticut academy of science and engineering 11
peer review of a cl&p/uconn report concerning emergency preparedness and response at selective critical facilitiesprc findings
ElEctric HardEning altErnativEs
Cl&p considered many hardening alternatives, but limited the scope of its study to undergrounding distribution lines from the nearest bulk substation to critical facilities, developing electrical microgrid to these facilities with local generation that can “island,” and supplying facilities with emergency backup generation. In an effort to arrive at an “apples to apples” comparison, the simplification of assumptions made, including only consideration of weather-related events, made the results of the study—that emergency generators were the low-cost alternative—predictable. the following are alternatives that should be considered as part of a further analysis, as well as Cl&p’s explanation for why they were not included in this initial analysis.
(1) The study did not include portable generation in the cost-benefit analysis as required by Section 7(f) of public Act 12-148. the authors provided the following explanation for not considering this option.
“Portablegenerationwasnotconsideredasoneoftheinitialthreehardeningtechniques,astherewouldbeatimelagtoprovideemergencypowerandneedforqualifiedresourcesupon[sic]tosupportthedeploymentofportablegeneration.Inaddition,theremaybechallengesin getting the portable resources to the critical facilities immediately after a severe weather event due to impassable roads and site access or a generator may not be available to all town facilitiesintheextremeweathereventsconsidered.Portablegenerationisausefultechniqueinmanagingtherestorationprocess,butwasnotpartofthescopeofthisstudy.”
however, as stated in the proposed next steps of the Cl&p executive Summary, it was recommended that portable generation should be included, as follows:
“However,incertaininstancesitmightnotmakesensetodeploypermanentemergencygeneration,thusasolutionthatincludesportablegenerationisrecommendedasitcanprovidepoweratanyfacilityacrossthestate.Iffundingwereavailable,CL&Precommendstheestablishmentofafleetofportablegeneratorswithpre-establishedconnectionsthroughoutthestate.CL&Pestimatesthatapproximately50generators(500-800kWunits)and100interconnectionsitesin30townscouldhelpcovertheneedsofCL&P’sserviceterritory.Thisoptionwilllikelyrequirethatcertainswitchgearinfrastructurebeinstalledat the critical facilities to allow portable emergency generators to be readily connected at the timeofanoutagetominimizerestorationtime.”
Since portable generation was not part of the analysis, it is uncertain how the number of portable generators and interconnection sites needed, the size of the generators, the locations, and the facilities were determined.
An analysis that includes the potential issues with portable generators should be conducted and compared to fixed emergency generators as well as the other hardening alternatives. this analysis should include identifying the critical facilities where uninterruptible power is not required, positioning portable generators in critical locations that can meet regional needs in anticipation of a storm, and issues with delivery of portable generators and refueling if roads are impassable (same issue with fixed diesel generators).

connecticut academy of science and engineering12
peer review of a cl&p/uconn report concerning emergency preparedness and response at selective critical facilities
prc findings
(2) the study evaluated a microgrid with its only intended purpose being to provide redundancy to the main electric power grid with the goal of increasing electric reliability during severe weather events. Cl&p decided to focus on electric reliability improvements since as an electric distribution company, its primary goal is to provide safe, reliable service that is cost effective. therefore, only an underground electrical infrastructure that would be able to withstand a severe weather event such as a Category 3 hurricane was considered. other options, such as hardening the existing overhead infrastructure, was not included in the analysis because it was determined by Cl&p/uConn that the hardened overhead infrastructure would still be as susceptible to damage as the existing overhead main grid (distribution system). therefore, the hardened overhead infrastructure could have the impact of diverting resources from restoring power to large blocks of customers, thus eliminating one of the key benefits of selective hardening. Finally, only critical facilities as defined in CL&P’s Emergency Response Plan such as police stations, fires stations, town halls, hospitals, nursing homes, and shelters (i.e., schools) were included; none of the other customers along the underground route, including those in the municipal centers and commercial areas, were included in the analysis. the Cl&p/uConn analysis criteria assumption to harden only one to seven critical facilities in each of the selected towns was done to provide as many comparable solutions as possible.
With these constrictive analysis criteria, microgrids are a distant second choice for improving reliability for users of a larger system under abnormal stress. this could give the casual reader the false impression that microgrids have no place in responding to abnormal system stresses and perhaps even a more far-reaching false impression that microgrids are, in general, a high-cost alternative for providing power. the Cl&p/uConn study was not intended to examine consideration of the concept of microgrids and distributed generation, and its recommendations could easily be misunderstood.
In future studies, the cost-benefit analysis for an undergrounding option should consider a microgrid that includes all customers along the proposed underground route.
Also, the scope of this analysis eliminated consideration of some very attractive alternatives that have multiple benefits compared to the single objective of increasing electric reliability at critical facilities to withstand a Category 3 hurricane. for example, the study did not take into account potential benefits to be derived from thermal loads at the critical facilities. By broadening the scope, the advantages of Chp could be incorporated into the design of a microgrid. one scenario would be to have buildings with Chp serve neighboring customers as now allowed by public Act 13-298; Section 39. this could be done with undergrounding or using overhead lines. Both alternatives would increase reliability. undergrounding would provide a greater degree of reliability along with the added expense of burying the lines. it is expected that a microgrid with overhead lines of less than 500 yards in length would also have less of chance of being damaged compared to a circuit, substation, or entire distribution/transmission system that feeds it under severe weather conditions (that is, it has the ability to island from the main electric power grid where a widespread outage can result from one tree branch falling in the wrong place).
connecticut academy of science and engineering 13
peer review of a cl&p/uconn report concerning emergency preparedness and response at selective critical facilitiesprc findings
in this scenario, the customer would pay for the Chp system because of the projected savings versus the microgrid as modeled in the Cl&p/uConn study. the cost would then be limited to detecting equipment and island switchgear for enabling the stand- alone Chp to be upgraded to a microgrid system. this system may be more competitive with the cost of emergency generation and may even be less expensive in certain situations, with the added benefit of reduced greenhouse gas emissions.
it should be noted that Cl&p concurred that applications that can take advantage of thermal energy should be investigated as part of any potential microgrid or Chp project.
(3) CHP should be considered as an alternative to fixed emergency generators for critical facilities. An on-site Chp system could provide increased electricity and heating and cooling reliability, and potentially lower customer costs along with providing significant greenhouse gas reductions.
(4) the Cl&p/uConn study evaluated the alternative of undergrounding distribution lines from the nearest bulk substation to critical facilities because the greatest number of outages and disruptions are directly related to damage to lines and cables mounted on poles. The analysis did not include the benefit of including the customers along the undergrounded distribution line as was the case for the microgrid alternative. the benefit of increased reliability to customers along the route would likely be gained at little additional cost, meet the overall intent of public Act 12-148 of minimizing the number and duration of service outages, provide opportunity to coordinate the effort with other entities to bury and protect communications and data lines (Section 10 of public Act 12-148), and potentially make the undergrounding alternative more competitive in certain situations.
critical FacilitiEs
Critical facilities as defined in Section 7 of Public Act 12-148 include hospitals, police stations, fire stations, water treatment plants, sewage treatment plants, public shelters, correctional facilities, commercial areas of a municipality, municipal centers (as identified by the chief elected official of any municipality), and any other facility or area identified by DEEP as critical. In the study, CL&P/UConn used the critical facility definition from the CL&P Emergency Response Plan, which defines a critical facility as
“a building or structure where the loss of utility service may interrupt functions considered essentialforthedeliveryofvitalservicesandthelifesafetyofthecommunity.Theyusuallyincludeemergencyresponsefacilities(fire,police,rescueandemergencyoperationscenters),hospitals,licensedconvalescenthomes,facilitiesdesignatedasemergencyshelters,watersupply,wastewatertreatment,communicationsfacilities(E911andPublicSafetyAnsweringPoint),andanyotherassetpre-establishedjointlybythemunicipality,DEMHS[currentlyknownastheDivisionofEmergencyManagementandHomelandSecurityoftheDepartmentofEmergencyServicesandPublicProtection],andutilitytobeofcriticalimportancefortheprotectionofthehealthandsafetyofthepopulation.”

connecticut academy of science and engineering14
peer review of a cl&p/uconn report concerning emergency preparedness and response at selective critical facilities
prc findings
“Societal facilities” such as gas stations and grocery stores were not included in this analysis because of the increased complexity it would add to the study, but that these facilities should be considered at the time of actual selective hardening application. the prC agrees that these “societal facilities” defined in Section 7 of Public Act 12-148 should be included in a more detailed analysis. in addition, the best practices from other states such as new york and rhode Island should be consulted in further defining and prioritizing a comprehensive listing of critical facilities.
the Cl&p/uConn study also excluded some critical facilities because of their distance from town centers. this raises the question of whether separate hardening analyses exist or still need to be undertaken for such facilities.
liFE cyclE cost assumptions
Several CL&P/UConn assumptions appear to cause the financial and environmental cost of the emergency generator option to be overestimated. emergency generators will not run 24/7 and they will not need to continuously supply peak load power. more traditional analysis tends to assume operating only in backup mode and often only for designated critical loads within a critical facility. Consequently, the operating costs and pollution estimates are very high. Also, there is no recognition that some critical facilities already have emergency generation capability. it would be informative to conduct a survey to determine which of a town’s critical facilities already have backup generation and how that would impact the selection of electric hardening alternatives.
sElEction oF FuEl supply
Cl&p/uConn assumed that micro-turbines or fuel cells fueled by natural gas would be used for the microgrid and that emergency generators would be powered by diesel fuel because only about 30% of the state has access to natural gas. these simplifying assumptions were made with the recognition that the selection of fuel will be location dependent and based on a number of factors. in general, the selection of fuel supply has important implications, with advantages and disadvantages for both natural gas and diesel fuel. Some issues that need to be addressed are:
• reliability of natural gas supply, which was assumed in the Cl&p/uConn study to be uninterruptible
• extension of natural gas distribution as called for in the governor’s comprehensive energy plan will likely modify the analytics regarding emergency generators; timelines for effectuating changes should be considered and if reasonable, reanalyzed accordingly
• Size of emergency generation fuel storage tanks given the possibility of impassable roads that could inhibit the delivery of fuel
sElEction oF town cEntErs
the criteria for selecting the eight towns, such as density of population, density of facilities (that is, proximity to one another to minimize exposed overhead lines), and distance between bulk substation and critical facilities, should be included in the Cl&p/uConn report. this will inform a needed follow-up discussion regarding critical facilities in other town centers and

connecticut academy of science and engineering 15
peer review of a cl&p/uconn report concerning emergency preparedness and response at selective critical facilitiesprc findings
the identification of regional centers and potential hardening priorities that the state needs to undertake. Also, it would be informative to know if the eight towns that were analyzed represent a spectrum of reliability improvement needs.
gEnEral commEnts
the following are comments on additional information that should be included in the Cl&p/uConn reports:
• The issue of retrofitting/floodproofing existing critical facilities in coastal and other flood-prone areas as a reliability measure should be addressed.
• The tabular summary of the cost-benefit analysis from the UConn School of Business Benefit-Cost Analysis of Selective Hardening Options report (pg. 28) that relates the severity of a weather event to the outage duration and the total percent of reliability benefits should be included in the CL&P Executive Summary.
• representative life cycle costs of hardening the critical facilities as presented in table 1 of the uConn School of engineering life-Cycle Cost Analysis of Selective hardening options report (pg. 4) should be included in the Cl&p executive Summary.
• One-line diagrams depicting the locations/configurations of the critical facilities within each town would be informative.
• transmission system reliability data that was provided in response to the prC questions was very informative.
• The value of reliability should be better articulated, particularly for non-energy benefits which, while more difficult to determine, are fundamental to protecting life and limb, and ensuring public safety and security.

connecticut academy of science and engineering16
peer review of a cl&p/uconn report concerning emergency preparedness and response at selective critical facilities
prc findings
connecticut academy of science and engineering 17
peer review of a cl&p/uconn report concerning emergency preparedness and response at selective critical facilitiesbest practice sources: reliable power for critical facilities
[additional guidance provided at the request of dEEp]
BEST PRACTICE SOURCES: RELIABLE POWER FOR CRITICAL FACILITIES
CASE conducted a preliminary scan of best practices resources with regard to reliable power for critical facilities.ThisincludedabriefinterviewwithJeffreyPillon,DirectorofEnergyAssuranceattheNationalAssociationofStateEnergyOfficials(NASEO),internetsearchesandacursoryreviewofrelatedarticlesandreports.
Best practices for reliable power for critical facilities are not necessarily written about specifically, according to Jeffrey Pillon of NASEO, but are often included in event after-action reports and energy assurance planning reports. the majority of states conducted energy assurance planning with 2008 recovery Act funding and, therefore, a survey of state energy officials on this topic may offer insights for Connecticut. Also, a review of states that have suffered disasters since completion of energy assurance planning would seem to be a good source of information. pillon suggested looking at hurricane Sandy after-action reports2 as a source of lessons learned with regard to critical facilities and he also noted that both new york and new Jersey are implementing major programs to bolster fuel supply and transit systems. following is a short description of those initiatives.
• New York State “Fuel NY” Initiative governor Andrew m. Cuomo signed into law legislation requiring more than half of all gas stations in new york City, long island and Westchester and rockland counties to have backup power in the event of an emergency. the “Fuel NY” initiative provides up to $17 million in funding to help retail gas stations improve their backup power capacity so they can remain open during major storms. gas station owners/operators located downstate within a half-mile of highway exits and evacuation routes can apply for up to $10,000 per station to install a transfer switch that will accept a portable emergency generator, or up to $13,000 per station if they install a permanent backup generator. 3 According to a 2011 Connecticut Office of Legislative Research Report, Florida and louisiana were, at the time, the only states that appeared to require motor fuel facilities to be able to switch to an alternative energy source during a power outage. 4
• New Jersey TransitGrid After New Jersey suffered the devastating effects of Hurricane Sandy, state officials decided to invest in more resiliency, particularly for the state’s transit system for the purposes of evacuation and delivery of services in the event of emergency. With the help of a $1 million dollar federal grant, nJ governor Chris Christie announced plans
2 hurricane Sandy after-action reports: http://www.naseo.org/hurricane-sandy3 nySerdA: http://www.nyserda.ny.gov/Statewide-initiatives/gas-Station-Back-up-power-program.aspx 4 Connecticut General Assembly, Office of Legislative Research report BackUpPowerforServiceStations: http://www.cga.ct.gov/2011/rpt/2011-r-0389.htm
connecticut academy of science and engineering18
peer review of a cl&p/uconn report concerning emergency preparedness and response at selective critical facilities
best practice sources: reliable power for critical facilities
for NJ TransitGrid5, a microgrid spanning rail lines and facilities across New Jersey Transit’s (NJT) busy northeastern corridor between Newark and New York City. 6
Other examples of critical facilities bolstering cited by Pillon are:
• The new earthquake ready Bay Bridge in San Francisco7
• Earthquake Risk Study for Oregon’s Critical Energy Infrastructure Hub8
In addition to the above references, Pillon noted some of his own observations on approaches that recur under the topic of best practices for reliable power to critical facilities and listed the following:
• Backup power testing. Facilities need to test their backup systems regularly to ensureproper functioning in the event of an emergency.
• Examineplansforfuelsupply.Isthereasufficientfuelsupplyforalongeroutage?Aretherecontractsfordeliveryofadditionalfuel?
• Transportation. Knowing alternatives for fuel transport in emergencies.
• Cross-sector and inter-sector interdependencies.
• Infrastructure improvements. Looking at improving energy infrastructure, making itmore robust so that if there is an outage, power companies can move more quickly (notjust hardening but things like smart grids).
Siting & New Builds
• Critical facilities should be resilient and equipped to continue operation in the event ofafuelshortageordisruptionthatmightaffecttheiroperation.Alternativeenergy sources such as natural gas, petroleum products, biomass, wind, solar, hydro should be available to provide a backup energy supply (for heating/cooling and power, as applicabletothefacility)andmaybecoupledwithenergyefficiencyoptionstoreduce energy input requirements. It is noted that this is strategy should also be considered for existing critical facilities.
• Considerfloodingpotentialwhensitingorrelocatingcriticalfacilities.
• Considerlargerundergroundstoragetanksforfuelintheeventofalongeroutage.Afacility can operate off the top half of the fuel tank and have the bottom half availablefor emergencies. (Note: the article referenced below, “After the Storm,” warns of the dangers ofa single fuel oil storage tank.)
5 News Release on NJ TransitGrid: http://www.njtransit.com/tm/tm_servlet.srv?hdnPageAction=PressReleaseTo&PRESS_RELEASE_ID=28846 Other NJ TransitGrid references: http://cleantechnica.com/2013/08/28/doe-and-new-jersey-developing-first-us-transit-system-microgrid/#mBSD17KxcxoMxCvP.99 www.njtransit.com/tm/tm_servlet.srv?hdnPageAction=PressReleaseTo&PRESS_RELEASE_ID=28847 San Francisco Bay Bridge: http://baybridgeinfo.org/ 8 Oregon Earthquake Risk Study: http://www.oregon.gov/energy/docs/Earthquake%20RiskStudyinOregon%E2%80%99sCriticalEnergyInfrastructureHub2013.pdf
connecticut academy of science and engineering 19
peer review of a cl&p/uconn report concerning emergency preparedness and response at selective critical facilitiesbest practice sources: reliable power for critical facilities
• CHPismoreprevalentinpracticeandintheliterature.Manyinstitutions,companies,etc., are turning to CHP. (See, LessonsFromWheretheLightsStayedOnDuringSandy, ForbesOct.2012)9
• Somenewbuildsareexploitingenergyefficiencies(netzerobuildingsand/orhighlyefficientbuildings).
DefiNiNg CritiCal faCilitieS
The RhodeIslandStateHazardMitigationPlan(SHMP,April,2011,RIEmergencyManagementAgency)10definescriticalfacilitiesasfollows:
Facilities that are vital to the health and welfare of the population and that are especially important following disasters. Critical facilities include, but are not limited to, shelters, policeandfireandhospitals.
In the FEMARegion5ShortNotesonPlanning11 available on Wisconsin’s emergency management website, it is noted that since every community is different, there is no exhaustive list of critical facilities. However, the following are offered as a basic list:
• Fire stations
• Police stations
• Sewage treatment plants
• Water treatment plants and pumping stations
• Schools
• Daycarecenters
• Hospitals
• Retirement homes and senior care facilities
• Majorroadsandbridges
• Critical utility sites such as telephone switching stations or electrical transformers
• Hazardousmaterialstorageareas.
TheRI-SHMPoutlinesavulnerabilityscoringsystemforcriticalfacilitiesbasedonthetwofactorsofvulnerabilityandimportance(seepages72-76).PerhapstheRIscoringsystemcouldbe of use to Connecticut.
9 Sandy,WheretheLightsStayedOn: http://www.forbes.com/sites/williampentland/2012/10/31/where-the-lights-stayed-on-during-hurricane-sandy/ 10 RhodeIslandStateHazardMitigationPlan: http://www.riema.ri.gov/preparedness/preparenow/prepare_docs/RI_State_HM_Plan%20Final.pdf 11 FEMARegion5ShortNotesonPlanning: http://emergencymanagement.wi.gov/mitigation/Mitigation_Workshop/Section%209/9.1%20-%20Mitigation%20Short%20Notes.pdf

connecticut academy of science and engineering20
peer review of a cl&p/uconn report concerning emergency preparedness and response at selective critical facilities
best practice sources: reliable power for critical facilities
MiCrogriD iNforMatioN reSourCe
NavigantResearchoffersaMicrogridsResearchServicethatprovidesinformationonmicrogriddevelopmentandtechnologies.AsstatedinNavigant’sinformationalbrochure,“Enablingtechnologies and systems are covered in depth, along with detailed tracking of microgrid deployments and assessments of key industry players.” The Service subscription includes the research reports, the microgrid tracker, and access to Navigant analysts for information on microgridtopics.SeeAppendixDformoredetailedinformationonNavigant’sMicrogridsResearch Service.

connecticut academy of science and engineering 21
peer review of a cl&p/uconn report concerning emergency preparedness and response at selective critical facilitiespossible funding sources for microgrid projects: state and federal
POSSIBLE FUNDING SOURCES FOR MICROGRID PROJECTS: STATE AND FEDERAL
the following provides the results of an initial scan of potential funding sources, both state and federal, for microgrid projects.
in Connecticut, the Clean energy finance and investment Authority (CefiA) has a legislative mandate to invest in projects that are based on a revenue model with a savings to investment ratio greater than one. CefiA uses its funding to leverage private investment in clean energy deployment. Thus, CEFIA was not involved in the first round of funding of Department of energy and environmental protection’s (deep) microgrid grant and loan pilot program, which awarded grants to municipal projects that were not based on a revenue model. According to Ali lieberman, Senior manager, Clean energy finance, CefiA, the organization is working with deep to revise the rfp for the second round of funding for microgrid projects so that CefiA may be able to collaborate.
CEFIA is also a partner in the EnergizeCT initiative with the Connecticut Energy Efficiency fund. energizeCt has a Connecticut property Assessed Clean energy (C-pACe) program that helps commercial, industrial and multi-family property owners access affordable, long-term financing for smart energy upgrades to their buildings. Given its mission, the C-PACE program could serve as a funding opportunity for property owners interested in installing microgrids.12
When not directly involved in funding, CefiA can sometimes act as a matchmaker between private funders and project proposers in Connecticut, though this is not its official role.
in terms of federal funding, there are several potential opportunities for microgrid projects. All federal grant opportunities are listed on www.grants.gov. funding announcements are also posted on the u.S. department of energy (doe) Office of Science site.13 following is a list of federal grant programs that may cover a microgrid project, depending on the nature of the project and its alignment with the goals of the particular program.
USDOEOfficeofEnergyEfficiencyandRenewableEnergy
the uS doe Office of Energy Efficiency and Renewable Energy (EERE)14 leads the federal gov-ernment’s research and development (R&D) efforts in energy efficiency and renewable energy. it invests in clean energy r&d designed to reduce the cost of technologies that enable the ef-ficient use of energy and/or the generation of renewable energy. EERE’s SBIR/STTR efforts are part of an integrated portfolio intended to lead to economic and environmental benefits.
12 CefiA: http://www.ctcleanenergy.com/Home/tabid/36/Default.aspx C-PACE, An EnergizeCT Program, http://www.c-pace.com/ 13 U.S. DOE Office of Science Funding Opportunities, http://science.energy.gov/grants/foas/open/ 14 U.S. DOE Office of Energy Efficiency and Reliability (EERE), http://energy.gov/eere/office-energy-efficiency-renewable-energy

connecticut academy of science and engineering22
peer review of a cl&p/uconn report concerning emergency preparedness and response at selective critical facilities
possible funding sources for microgrid projects: state and federal
The US DOE Solar Energy Technologies Office, which is part of the EERE, focuses on achieving the goals of the SunShot initiative,15 which seeks to make solar energy cost-competitive with other forms of electricity by the end of the decade. Since it was announced in february 2011, the Solar Office has funded more than 150 projects in the following areas:
• photovoltaics (pv)
• Concentrating solar power (CSp)
• Balance of systems costs
• Systems integration
Current grant opportunities from the Sunshot initiative are available here16 and information on submitting unsolicited proposals to the eere is available here.17 this program may offer opportunities for solar-powered components of microgrids.
Federal Emergency Management Agency femA provides state and local governments with preparedness program funding in the form of preparedness non-disaster grants18 to enhance the capacity of state and local emergency responders to prevent, respond to, and recover from a weapons of mass destruction terrorism incident involving chemical, biological, radiological, nuclear, and explosive devices and cyberattacks.
femA also provides hazard mitigation Assistance (hmA) grants19 for eligible mitigation activities that reduce disaster losses and protect life and property from future disaster damages.
The US Department of Housing and Urban Developmentthe Office of Sustainable Communities20 at the uS department of housing and urban development (hud) sometimes offers grants to support activities that improve the quality of development and protect human health and the environment.
the Sustainable Communities regional planning (SCrp) grant program supports locally-led collaborative efforts that bring together diverse interests from the many municipalities in a region to determine how best to target housing, economic and workforce development, and infrastructure investments to create more jobs and regional economic activity.
15 u.S. doe eere SunShot initiative, http://www1.eere.energy.gov/solar/sunshot/about.html 16 SunShot initiative grant opportunities, http://www1.eere.energy.gov/solar/sunshot/current_opportunities.html 17 Submitting unsolicited proposals to the u.S. doe eere, http://www1.eere.energy.gov/financing/unsolicited_proposals.html 18 femA preparedness non-disaster grants, http://www.fema.gov/preparedness-non-disaster-grants 19 femA hazard mitigation grants, http://www.fema.gov/hazard-mitigation-assistance20 u.S. department of housing and urban development Sustainable Communities regional planning grants, http://portal.hud.gov/hudportal/HUD?src=/program_offices/sustainable_housing_communities/sustainable_communities_regional_planning_grants

connecticut academy of science and engineering 23
peer review of a cl&p/uconn report concerning emergency preparedness and response at selective critical facilitiespossible funding sources for microgrid projects: state and federal
the SCrp program is a key initiative of the partnership for Sustainable Communities,21 in which hud works with the uS department of transportation (dot) and the uS environmental protection Agency (epA) to coordinate and leverage programs and investments.
US Department of Commerce, Economic Development Administration According to david ives, economic development Administration (edA), the planning program and local technical Assistance program22 of the edA is open and accepts applications on a rolling basis. Whether or not the program would support a microgrid project would depend on the focus of the project itself. it may be possible to access edA local technical Assistance funding. however, the project would need to be primarily focused on supporting economic development, with the energy aspect an ancillary benefit. Ives suggested the local EDA point of contact to discuss a particular project and gauge whether the edA would consider funding.23
21 partnership for Sustainable Communities, http://www.sustainablecommunities.gov/22 u.S. edA planning program and local technical Assistance program, http://www.grants.gov/view-opportunity.html?oppId=18919323 edA’s point of contact for Connecticut, marguerite mcginley, [email protected]

peer review of a cl&p/uconn report concerning emergency preparedness and response at selective critical facilities
24 connecticut academy of science and engineering

peer review of a cl&p/uconn report concerning emergency preparedness and response at selective critical facilitiesappendices
connecticut academy of science and engineering 25
APPENDIX A
CONNECTICUT LIGHT AND POWER COMPANYANALYSIS OF SELECTIvE HARDENING OPTIONS:INTRODUCTION AND EXECUTIvE SUMMARY TO
ANALYSIS REPORTS
december 11, 2013
note: the original report, Analysis of Selective Hardening Options: Introduction to Project Reports, dated May 31, 2013, was revised by CL&P following the CL&P/UConn Briefing for the
CASe peer review Committee on november 15, 2013, and amended to include an executive Summary of the reports.
connecticut academy of science and engineering26
peer review of a cl&p/uconn report concerning emergency preparedness and response at selective critical facilities
appendices
Connecticut Light & Power A Northeast Utilities Company
Analysis of Selective Hardening Options
Introduction and Executive Summary to Analysis Reports
December 11, 2013

peer review of a cl&p/uconn report concerning emergency preparedness and response at selective critical facilitiesappendices
connecticut academy of science and engineering 27
1
BACKGROUND In 2011, Tropical Storm Irene and the October Nor’easter illustrated the degree of damage severe weather can inflict on the CL&P system and the extent to which customers can be impacted. One of the lessons learned from the 2011 storms was that during catastrophic weather events that cause prolonged power outages, it becomes increasingly important that critical facilities (i.e., emergency response facilities like fire, police, rescue and emergency operations centers, hospitals, licensed convalescent homes, facilities designated as emergency shelters, water supply, waste water treatment, communications facilities - E911 and public safety answering point) as well as other services (i.e., grocery stores, gas stations) either remain powered up or can be powered up quickly. During an even more catastrophic event, such as a category 3 hurricane, when a large portion of the CL&P system is likely to be damaged or fail due to physical damage to infrastructure, the electric supply to critical facilities can be “selectively hardened” to provide much higher levels of power supply security so that they can meet important societal needs across geographical areas and benefit CL&P’s storm restoration efforts. CL&P set an objective to study options to selectively harden town centers or areas that offer critical services and/or societal services during prolonged outages. CL&P identified the following general methods of selectively hardening electric supply to critical regional/town facilities:
1. Undergrounding distribution lines from the nearest bulk substation to critical facilities. 2. Supplying such facilities with reliable emergency back-up generation that can provide alternative
supply for extended periods of time. 3. Developing an electrical microgrid (to these facilities) with local generation that can “island” and
continue to supply the facilities during catastrophic weather events. In April of 2012, CL&P engaged the Schools of Engineering and Business at the University of Connecticut (UCONN) to evaluate the relative cost/benefit of each selective hardening alternative to better understand which options may be worth considering in the future. CL&P’s selective hardening analysis was one of multiple programs the company initiated after the 2011 storms, as illustrated in the figure below. With the implementation of these initiatives, CL&P’s primary objective has been to become a recognized industry leader and trusted partner in emergency preparedness and response.

connecticut academy of science and engineering28
peer review of a cl&p/uconn report concerning emergency preparedness and response at selective critical facilities
appendices
2
ANALYSIS GOALS AND SCOPE The primary goal of the analysis was to identify which selective hardening techniques of the distribution infrastructure can make it less vulnerable to damage from extreme weather events, small and major storms, as well as on a day-to-day improve reliability. The benefits of implementing selective hardening techniques include:
Ensure critical services are not significantly disrupted during a typical weather event and even during major catastrophic storms.
Provide critical facility benefits not only to residents of the towns where critical facilities are located, but of adjacent towns and broader geographical regions.
Allow CL&P to focus its resources on restoring end-use customers as quickly as possible, without the need to focus initial attention on restoring power to critical facilities.
Enable the potential to reduce total outage duration by being able to focus its attention on customer restoration as early as possible in the process.
As with any study of this magnitude, CL&P developed a clearly defined scope of work from the beginning in order to focus UCONN and CL&P’s resources and ensure the study findings were relevant and useful to CL&P and policymakers. The key elements that determined the scope of the study included:
1) Focus on weather related events inclusive of hurricanes, tropical storms, major storms and small storms. As such, the study did not focus on other events such as cyber-attacks, fires, blackouts, generation outages, floods, or other events that could cause disruptions to the distribution system. CL&P believed it was important to focus on weather events, which although unpredictable in terms of magnitude and timing, are nonetheless expected to happen with frequency. In addition, the results from the analysis based on weather events can be used to inform impacts from other events (for example the response time from an emergency back-up generator will not necessarily change if an outage is caused by a wind events or a generation outage). CL&P does believe

peer review of a cl&p/uconn report concerning emergency preparedness and response at selective critical facilitiesappendices
connecticut academy of science and engineering 29
3
future studies that incorporate these elements could provide additional insights.
2) Focus on electric reliability improvements during the identified weather events. CL&P, as an electric distribution company, has as its primary goal to provide safe, reliable service that is cost-effective. As such, the scope of the analysis is limited to reliability specific benefits, so CL&P did not take into account potential benefits to be derived from thermal loads at the critical facilities studied. An initial consideration is that schools, police stations, fire stations, emergency operations centers, and gas stations are typically not configured to accept thermal loads for heating and cooling. In addition, nursing homes and hospitals, which may be reconfigured to accept thermal sources, typically do not have excess electrical generation if a combined heat and power (CHP) application is sized efficiently to capture the excess thermal energy. Therefore, CL&P did not account for the value of thermal energy because a significant amount of additional capital expenditure would be required to size the generation and then connect thermal loads and modify heating and cooling infrastructure. A significant amount of engineering analysis would need to be conducted to determine if each facility or a host site can accommodate a central heating and cooling system. Additionally, access to the site and information regarding heat load information for each site would need to be collected to conduct a CHP evaluation. CL&P has electrical load data readily available and chose to focus on the electrical components of a microgrid. Thermal loading analysis was not part of the scope of this study, as CL&P decided to focus on different configurations for electric reliability benefits, which is core to CL&P’s mission. Finally, studied locations were selected based on predetermined criteria to achieve a diverse group of sites, but were not consulted to obtain such detailed information to allow thermal load analysis. To effectively realize the benefits of the total energy would require a detailed analysis of each microgrid and may require additional changes to public policy. CL&P does agree that applications that can take advantage of thermal energy should clearly being investigated as a part of any potential microgrid or CHP project.
3) Focus on three selective hardening techniques (see Selective Hardening Technique Selection section below).
4) CL&P focused on critical facilities that provide vital products and services to the general public and/or protect special populations. CL&P used the critical facility definition from its Emergency Response Plan which defines a critical facility as “a building or structure where the loss of utility service may interrupt functions considered essential for the delivery of vital services and the life safety of the community. They usually include emergency response facilities (fire, police, rescue and emergency operations centers), hospitals, licensed convalescent homes, facilities designated as emergency shelters, water supply, waste water treatment, communications facilities (E911 and Public Safety Answering Point), and any other asset pre-established jointly by the municipality, DEMHS, and utility to be of critical importance for the protection of the health and safety of the population”. For the purposes of the analysis, CL&P did not include other “societal need” facilities such as grocery stores, gas stations, clinics and pharmacies as it would have increased the complexity of the study. However, CL&P believes that these other facilities can always be considered at the time of actual selective hardening applications. In addition, these other “societal need” facilities do not always require attention from CL&P resources during the early stages of outage

connecticut academy of science and engineering30
peer review of a cl&p/uconn report concerning emergency preparedness and response at selective critical facilities
appendices
4
restoration.
5) Study focused on costs and benefits for each hardening option quantified in dollars. Quantitative representation of costs and benefits helped provide a benefit/cost ratio, which is a unifying metric that allows CL&P to compare options appropriately. A benefit/cost ratio above 1 is considered to be cost effective.
6) Study assumed none of the critical facilities had existing emergency generation in order to provide an analysis that represented real life situations of hardening options where no hardening option is available. Obviously if a facility already has back-up emergency generation, it is already selectively hardened.
7) Study did not focus on specific town needs or a specific town situation. Study captured specific town information in order to provide real life data from a representative sample of towns across CL&P service territory in order to allow for hardening technique comparisons.
8) Study did not focus on hardening the existing overhead system as it was determined that such enhancements will not be able to meet the same reliability and resiliency requirements as the other selective hardening options being considered.
CL&P developed and determined the scope of the study at its sole discretion based on the feedback received after its performance during the 2011 storms which included, among others: internal critiques, municipal forums, legislative hearings, Witt Review, Governor’s Two-Storm panel review, Davies Consulting assessment, Liberty Consulting review and the Connecticut Legislative Session. Later, this feedback was further enhanced by PURA’s decision on CL&P’s storm response performance. Finally, it is worth noting that the selective hardening effort analysis launched by CL&P pre-dates the legislative requirements set in Section 7 of Public Act 12-148. Lastly, to determine the scope and conduct the study, CL&P leveraged its network of internal subject matter experts that have first-hand knowledge of the electrical reliability implications of different selective hardening options. This first hand-knowledge was enhanced by literature research that covered a wide array of topics inclusive of undergrounding options and costs, microgrid deployments in the US and the world, operational characteristics of generation sources, emergency generator use during storms among others. CL&P also leveraged industry knowledge through discussions and interaction with the Electric Power Research Institute (EPRI), the Edison Electric Institute (EEI), and one-on-one discussions with utilities that experienced similar events in the past, such as Florida Power & Light, Hydro Quebec, Oklahoma Gas & Electric, ComEd and Entergy among others. After Super Storm Sandy, CL&P has further expanded its dialogue with other utilities impacted in the Northeast and has held detailed discussions with utilities like PSE&G, National Grid, ConEd, PEPCO and BG&E. CL&P has also maintained close dialogue with United Illuminating to seek consistency in utility approach to hardening across the state specifically as it relates to microgrids. CL&P also leveraged extensive discussions the Company has had with town and state officials to determine and inform the scope of the study. SELECTIVE HARDENING TECHNIQUE SELECTION Based on the research CL&P conducted and the feedback received from numerous panels and reports, CL&P identified three different selective hardening techniques to accomplish the reliability objectives: express underground currents (UG), emergency or back-up generation (EG), and microgrids (MG).
peer review of a cl&p/uconn report concerning emergency preparedness and response at selective critical facilitiesappendices
connecticut academy of science and engineering 31
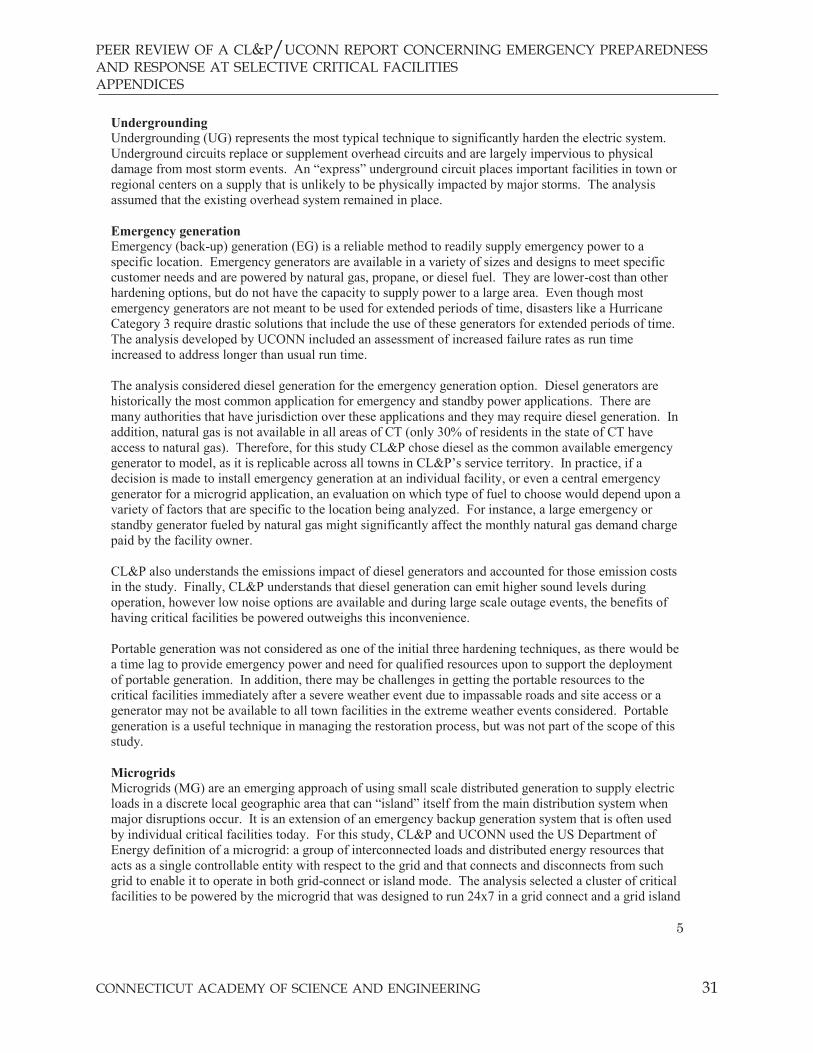
5
Undergrounding Undergrounding (UG) represents the most typical technique to significantly harden the electric system. Underground circuits replace or supplement overhead circuits and are largely impervious to physical damage from most storm events. An “express” underground circuit places important facilities in town or regional centers on a supply that is unlikely to be physically impacted by major storms. The analysis assumed that the existing overhead system remained in place. Emergency generation Emergency (back-up) generation (EG) is a reliable method to readily supply emergency power to a specific location. Emergency generators are available in a variety of sizes and designs to meet specific customer needs and are powered by natural gas, propane, or diesel fuel. They are lower-cost than other hardening options, but do not have the capacity to supply power to a large area. Even though most emergency generators are not meant to be used for extended periods of time, disasters like a Hurricane Category 3 require drastic solutions that include the use of these generators for extended periods of time. The analysis developed by UCONN included an assessment of increased failure rates as run time increased to address longer than usual run time. The analysis considered diesel generation for the emergency generation option. Diesel generators are historically the most common application for emergency and standby power applications. There are many authorities that have jurisdiction over these applications and they may require diesel generation. In addition, natural gas is not available in all areas of CT (only 30% of residents in the state of CT have access to natural gas). Therefore, for this study CL&P chose diesel as the common available emergency generator to model, as it is replicable across all towns in CL&P’s service territory. In practice, if a decision is made to install emergency generation at an individual facility, or even a central emergency generator for a microgrid application, an evaluation on which type of fuel to choose would depend upon a variety of factors that are specific to the location being analyzed. For instance, a large emergency or standby generator fueled by natural gas might significantly affect the monthly natural gas demand charge paid by the facility owner. CL&P also understands the emissions impact of diesel generators and accounted for those emission costs in the study. Finally, CL&P understands that diesel generation can emit higher sound levels during operation, however low noise options are available and during large scale outage events, the benefits of having critical facilities be powered outweighs this inconvenience. Portable generation was not considered as one of the initial three hardening techniques, as there would be a time lag to provide emergency power and need for qualified resources upon to support the deployment of portable generation. In addition, there may be challenges in getting the portable resources to the critical facilities immediately after a severe weather event due to impassable roads and site access or a generator may not be available to all town facilities in the extreme weather events considered. Portable generation is a useful technique in managing the restoration process, but was not part of the scope of this study. Microgrids Microgrids (MG) are an emerging approach of using small scale distributed generation to supply electric loads in a discrete local geographic area that can “island” itself from the main distribution system when major disruptions occur. It is an extension of an emergency backup generation system that is often used by individual critical facilities today. For this study, CL&P and UCONN used the US Department of Energy definition of a microgrid: a group of interconnected loads and distributed energy resources that acts as a single controllable entity with respect to the grid and that connects and disconnects from such grid to enable it to operate in both grid-connect or island mode. The analysis selected a cluster of critical facilities to be powered by the microgrid that was designed to run 24x7 in a grid connect and a grid island
connecticut academy of science and engineering32
peer review of a cl&p/uconn report concerning emergency preparedness and response at selective critical facilities
appendices
6
mode. At the time of the study scope definition, CL&P could not find many examples of microgrids being used for reliability/resiliency purposes in small loads such as the size critical facility clusters represent. Common reliable generation resources include reciprocating engines, gas turbines, microturbines1 and fuel cells, all of which were reviewed by the team. In practice, actual microgrids might include any of these options or a combination of these options, as well as other generation sources in combination with the sources listed above. Since the clusters of buildings in our study were typically less than 2 MW, CL&P eliminated the option of gas turbines. CL&P ultimately selected to compare microturbines (MG-M) and fuel cells (MG-F)2 for the model because of the potential for modular construction and for the fact that they may be more easily sited in a downtown district due to better sound characteristics than a reciprocating engine. Obviously all generation resources would be considered for an actual project, but for the purposes of the study and to simplify the analysis, CL&P focused on fuel cells and microturbines. Many microgrid configurations or concepts envision the leveraging and use of existing electrical distribution infrastructure to interconnect various types of distributed generation to multiple customer loads. In this study, a microgrid was being evaluated as a redundancy to the main grid with the goal of increasing electric reliability during severe weather events. The performance improvement expectation requires a very resilient system that is not easily accomplished with overhead infrastructure. Therefore, CL&P assumed underground electrical infrastructure would be needed for the microgrid to immediately withstand a severe weather event such as a Category 3 hurricane. Another reason CL&P did not consider hardening the existing overhead infrastructure to serve the microgrid as an alternative was due to the fact that during the scenario electric distribution company resources would be needed for restoration of the damaged microgrid infrastructure, which would be as susceptible to damage as the existing overhead main grid, diverting these resources from restoring power to large blocks of customers, eliminating one of the key benefits that selective hardening seeks to accomplish. Finally, for microgrid interconnection infrastructure undergrounding alternative, CL&P assumed 100% express feed configuration, which will include only the critical facilities and not other customers along the undergrounded route. CL&P did not consider multiple scenarios of undergrounding portions of the distribution system and the resulting effects on reliability. CL&P’s assumption was to compare undergrounding electrical infrastructure to underground microgrid scenarios in order to have as many comparable solutions as possible. As mentioned above, there are many configurations of electrical microgrids: campus style, military bases, single buildings with multiples loads, two or more buildings with shared secondary, centralized distributed generators, or multiple generators, CHP versus emergency /standby generation, utility microgrids such as at the feeder level and low voltage versus high voltage. In the process of reviewing and selecting clusters of critical town facilities it was apparent that many of these facilities were at a distance that would make low voltage construction not feasible and difficult to estimate for the analysis. Therefore, to simplify and to duplicate a common microgrid configuration from town to town, CL&P chose a high voltage microgrid interconnection. If the microgrid consists of two adjacent buildings in 1 Microturbines are small electricity generators that burn gaseous and liquid fuels to create high-speed rotation that turns an electrical generator. The size range for microturbines available and in development is from 30 to 250 kilowatts (kW), while conventional gas turbine sizes range from 500 kW to 250 megawatts (MW). Microturbines run at high speeds and, like larger gas turbines, can be used in power-only generation or in combined heat and power (CHP) systems”. (ICF Consulting Technology Characteristic: Microturbines 2008) 2 CL&P did not make any assumptions of ownership for the microgrid options as analysis results do not change under different ownership scenarios.

peer review of a cl&p/uconn report concerning emergency preparedness and response at selective critical facilitiesappendices
connecticut academy of science and engineering 33
7
close proximity, then a secondary interconnection may be a possibility. It should also be noted that most large campus style microgrids, particularly universities, typically use high voltage infrastructure to connect adjacent buildings on campus. ANALYSIS APPROACH To accomplish the goal of evaluating the cost and benefits of three different hardening options for selective locations, CL&P worked in partnership with UCONN’s Engineering and Business Schools. The first phase of the analysis was to select towns for further evaluation. The CL&P team collected data on all towns within their service territory such as demographics, electric and gas data, as well as customer data. This data was then analyzed to identify a selection of viable diverse candidates for a cost benefit analysis. Once the selection of towns was complete, UCONN School of Engineering completed a reliability evaluation of selective hardening options. The reliability evaluation framework consisted of wind storm models, weather-dependent reliability models for system components, models for hardening options, and sequential Monte Carlo simulation algorithms. The UCONN School of Engineering also performed a life-cycle cost (“LCC”) analysis of undergrounding, emergency generation, and microgrids for critical facilities in the chosen towns. The life-cycle cost analysis is generally performed during a facility’s design phase to evaluate the total monetary cost of installing and operating the power system for the life of the project, which includes capital cost, O&M cost, electricity cost, replacement cost, revenue, and energy cost. The UCONN School of Business then utilized the same underlying capital cost and operating cost assumptions in the LCC analysis and evaluated the incremental benefits and costs of implementing selective hardening options to estimate the economic viability of each hardening option at the critical facility level in the eight towns selected. The results from the reliability analysis as well as economic projections and assumptions were utilized to develop and quantify the reliability benefits in nominal dollars. The reliability benefits evaluated two distinct critical facility types; a facility intended to be used as a public shelter (schools/hospitals) and a facility intended to be used as an emergency operations center. Finally, CL&P’s team drew conclusions based on the analyses performed to develop recommendations for next steps that will provide the greatest value to customers and the State. TOWN SELECTION PROCESS In the first phase of the analysis, data was gathered for all towns within CL&P’s service territory including the following:
Demographics (population, square miles, existence of town center and number of critical facilities)
Electric data (miles of line, line density, energy usage, bulk substations) Customer data (customers served, customer density and customers per mile of line) Gas data (existence of gas in town center and number of customers, miles of gas main) Critical facilities data (number and type of critical facilities)

connecticut academy of science and engineering34
peer review of a cl&p/uconn report concerning emergency preparedness and response at selective critical facilities
appendices
8
Based on the data collected, towns that did not have a well-defined town center or clusters of critical facilities were eliminated, as they did not meet the base criteria to allow further analysis3. Then an initial selection of towns was compiled to include towns of varied size in each division of the state to ensure geographical diversity. Average median income per town was also considered to ensure economic diversity, resulting in 23 towns initially identified for possible further analysis. Diversity was important in order to ensure benefits were calculated for a broad array of residents in CT. Past reliability metrics were not considered, as the goal of the analysis was to determine which option could better withstand significant weather events, so the prior performance was not as critical. For the final stage of the selection process, maps were analyzed of the 23 identified towns that included the number and types of clusters of critical facilities, the location and number of substations, and the existence (or lack) of gas lines. Utilizing this information, CL&P’s team selected a representative sample of eight towns4 for a cost benefit analysis of selective hardening options. Critical facilities were pre-defined jointly by the town, Division of Emergency Management and Homeland Security (“DEMHS”) and the utility as facilities that provide vital products and services to the general public and/or protect special populations. They include hospitals, police and fire stations, emergency shelters (inclusive of schools), waste water treatment plants and pump stations, convalescent homes, public water pump stations and treatment plants, airport runway lighting and FAA facilities, and emergency operation centers (“EOC”). The following table highlights the specific critical facilities analyzed in the final eight chosen towns:
3 CL&P’s Account Executives conducted a qualitative assessment to determine whether a town has a town center based on the many years of experience in interacting with towns. 4 Although the initial study scope included the goal of analyzing 10 towns, at later stages during the analysis CL&P and UCONN agreed that due to resource constraints the analysis was still relevant with 8 towns.

peer review of a cl&p/uconn report concerning emergency preparedness and response at selective critical facilitiesappendices
connecticut academy of science and engineering 35
9
Town Critical Facility
Town A
Town A-Nursing Home Town A-Police
Town A-School 1 Town A-Public Works
Town A-School 2 Town A-School 3
Town A-Board of Education
Town B Town B-School Town B-EOC
Town C Town C-Hospital
Town D Town D-Hospital Town D-School
Town E
Town E-Nursing Home 1 Town E-Nursing Home 2
Town E-Police Town E-Town Hall
Town F Town F-Town Hall
Town F-Fire Department
Town G Town G-Hospital Town G-School 1 Town G-School 2
Town H Town H-Low Income Senior Housing
Town H-Hospital Town H-Senior Housing/Nursing Home
Note: Based on the towns selected some types of critical facilities (e.g., water treatment plants, sewage pumping stations, etc.) were not included in the analysis. This is most likely due to the fact that most of these facilities are far from the town centers. OVERVIEW OF REPORTS In conjunction with this introduction and executive summary, the report encompasses three other reports described below. Reliability Evaluation of Selective Hardening Options (UCONN School of Engineering) The Reliability Evaluation of Selective Hardening Options report summarizes the reliability evaluation completed on the selective hardening options for critical facilities in the eight towns selected by CL&P. The first part of the report outlines the models and methodology used to evaluate reliability under various weather conditions. They include a wind storm model, a weather-dependent reliability model for system components, a model for hardening options for enhancing power supply reliability, and the sequential Monte Carlo simulation method.
connecticut academy of science and engineering36
peer review of a cl&p/uconn report concerning emergency preparedness and response at selective critical facilities
appendices
10
The second section of the report summarizes the evaluation findings. Assumptions and input parameters are outlined along with an overview of the reliability results. Finally, conclusions from results analysis based on expected outage duration, expected outage rate, and expected annual outage time are outlined. The appendix includes data sources, details of the bases and formulas utilized in the models, and the reliability indices of critical facilities for each town evaluated. Estimation of Life Cycle Cost of Three Hardening Options for 8 Selected Towns (UCONN Dept. Electrical & Computer Engineering) The Estimation of Life Cycle Cost of Three Hardening Options report summarizes the cost analysis to compare the economics of selective hardening options. At the start of the report, theoretical approaches to determine life cycle cost (“LCC”) are outlined, along with the basic configurations and calculations used analyze each of the hardening options (from the facility’s design phase perspective). The second part of the report provides the LCC analysis for each hardening option for the specific towns evaluated, followed by a summary and conclusions. The appendix contains Monte-Carlo simulation results for LCC considering six different weather conditions for each of the towns analyzed. Benefit-Cost Analysis of Selective Hardening Options (UCONN School of Business) The Benefit-Cost Analysis of Selective Hardening Options report evaluates the incremental benefits and costs of implementing selective hardening options for critical facilities in eight towns chosen by CL&P. An executive summary is included at the start of the report, followed by the framework of the model used and assumptions for discount and growth rate, reliability and energy production benefits, capacity value, environmental benefits, and costs. The second part of the report contains Average Estimates tables for each of the towns studied. Benefits, costs, and benefit-cost ratios are outlined for each selective hardening option. The final portion of the report provides a discussion page summarizing the hardening option with the highest net benefit for each town under various weather conditions, followed by a detailed analysis of each of the selective hardening options.

peer review of a cl&p/uconn report concerning emergency preparedness and response at selective critical facilitiesappendices
connecticut academy of science and engineering 37
11
SUMMARY OF CONCLUSIONS The analysis conducted by CL&P and UCONN indicates that all of the selective hardening techniques provide significant improvements in reliability and resiliency. The study demonstrated that outage duration, outage time and outage rates all significantly improve by the implementation any of the selective hardening techniques. As a consequence, the quantification of reliability benefits for each of the selected options provides similar answers and similar rankings. Reliability benefit variations by town are driven by the specific failure rate characteristics of each of the selected hardening options. The relative benefit/cost comparison then hinges primarily on the costs of each alternative. The analysis conducted was specific at the town level so specific characteristics were considered such as spacing between critical facilities which determined undergrounding costs for the microgrids and undergrounding options, along with an interconnection cost analysis for each technology and facility option. In addition, UCONN followed a rigorous and comprehensive cost analysis that allows proper comparison of options. Ultimately, the analysis indicates that emergency generation is the most cost effective solution under any scenario as shown by the benefit cost ratios by town and option below. Microgrids and undergrounding are competitive with each other depending on the supply considerations, but generally less cost effective than emergency generation.
CL&P does highlight that there are circumstances where the benefit/cost ratio of microgrids and/or undergrounding could be improved, if additional considerations were to be incorporated into the analysis. For example, a more detailed analysis of microgrid configurations that includes the benefits of using the thermal load could show that in certain circumstances, microgrids could be cost effective. In addition, benefits provided by enhancing the state’s economic development goals by further encouraging the use of fuel cells could also play a factor in decisions made by the State and other stakeholders. Finally, different microgrid configurations and applications can help lower costs and still provide the same reliability

connecticut academy of science and engineering38
peer review of a cl&p/uconn report concerning emergency preparedness and response at selective critical facilities
appendices
12
benefits analyzed as part of the study. The recent CT Department of Energy & Environmental Protection (DEEP) microgrid grant awards to Wesleyan University, University of Connecticut, and the University of Hartford illustrate how campus configurations can be cost effective, reliable, and beneficial projects to the State and society. Undergrounding economics could also improve if an electrical undergrounding project can be conducted at the same time as other undergrounding projects take place, such as the expansion of a gas main or the replacement of water infrastructure. A detailed cost and benefit analyses need to be conducted for each particular location in order to determine the most appropriate hardening option. However, the selective hardening analysis conducted by CL&P and UCONN does indicate that emergency generation or portable emergency generation should merit a careful review as the State considers the most appropriate set of next steps. PROPOSED NEXT STEPS Based on the analysis results, CL&P has identified additional infrastructure hardening opportunities that could be pursued if Federal or State funding were to be available. CL&P’s six recommendations are summarized in the chart below. Two of CL&P’s six recommendations are based on the selective hardening analysis conducted with UCONN.
As it relates to the two selective hardening options identified, CL&P has proposed to DEEP and other key governmental stakeholders to leverage any federal funding to: 1) Review the list of federal, state and municipal critical facilities and consider the installation of
permanent back-up generation at facilities that do not have emergency generation as of today.
peer review of a cl&p/uconn report concerning emergency preparedness and response at selective critical facilitiesappendices
connecticut academy of science and engineering 39
13
2) Establish a “beacons of light” concept by implementing a combination of selective hardening techniques to power critical facilities and town centers. As the conclusion of the UCONN’s analysis points, emergency generation is the most cost effective option to selectively harden critical facilities in town centers. However, in certain instances it might not make sense to deploy permanent emergency generation, thus a solution that includes portable generation is recommended as it can provide power at any facility across the state. If funding were available, CL&P recommends the establishment of a fleet of portable generators with pre-established connections throughout the state. CL&P estimates that approximately 50 generators (500-800 kW units) and 100 interconnection sites in 30 towns could help cover the needs of CL&P’s service territory. This option will likely require that certain switchgear infrastructure be installed at the critical facilities to allow portable emergency generators to be readily connected at the time of an outage to minimize restoration time. CL&P believes that undergrounding can be useful in certain targeted situations. CL&P recommends that if funding were available, it could target hardening backbone circuits to town centers with multiple critical facilities that are close to a bulk substation. CL&P continues to closely support DEEP and its microgrid team in advancing the state’s goals around microgrids. CL&P has advised DEEP in the development of the microgrid program as it relates to technical configurations, standards and solutions to the technical and operational complexities of microgrids. CL&P has also performed technical feasibility evaluations for submitted Project Feasibility Applications (PFA), assisted in the development of the program Request for Proposals (RFP), processed interconnection applications for RFP projects submitted to the utility and performed technical evaluation for submitted RFP projects. Finally, CL&P will develop a microgrid operating agreement to ensure safe, reliable and coordinated microgrid operation. At this stage, CL&P believes that it is important to wait and see the results of DEEP’s microgrid program, and in the future leverage the results to determine appropriate next steps as it relates to the use of microgrids in hardening situations.

connecticut academy of science and engineering40
peer review of a cl&p/uconn report concerning emergency preparedness and response at selective critical facilities
appendices
APPENDIX B
CONNECTICUT LIGHT AND POWER COMPANYANALYSIS OF SELECTIvE HARDENING OPTIONS
RESPONSE TO QUESTIONS FROM
CONNECTICUT ACADEMY OF SCIENCE AND ENGINEERING
December 6, 2013

peer review of a cl&p/uconn report concerning emergency preparedness and response at selective critical facilitiesappendices
connecticut academy of science and engineering 41
Connecticut Light & Power A Northeast Utilities Company
Analysis of Selective Hardening Options
Response to Questions from Connecticut Academy
of Science and Engineering
December 6, 2013

connecticut academy of science and engineering42
peer review of a cl&p/uconn report concerning emergency preparedness and response at selective critical facilities
appendices
1
1. What is the microgrid definition used in the study? (Answers questions: 4.1, 6.4)
For this study CL&P and UCONN used the US Department of Energy definition of a microgrid: a group of interconnected loads and distributed energy resources that acts as a single controllable entity with respect to the grid and that connects and disconnects from such grid to enable it to operate in both grid-connect or island mode. The analysis selected a cluster of critical facilities to be powered by the microgrid that was designed to run 24x7 in a grid connect and a grid island mode.
2. Why did the microgrid configurations assumed underground wiring? (Answers questions: 3.13, 4.10)
Many microgrid configurations or concepts envision the leveraging and use of existing electrical distribution infrastructure to interconnect various types of distributed generation to multiple customer loads. In this study a microgrid is being evaluated as an alternative to the main grid with the goal of increasing electric reliability during severe weather events. The performance improvement expectation requires a very resilient system that is not easily accomplished with overhead infrastructure. Therefore CL&P assumed underground electrical infrastructure would be needed for the microgrid to immediately withstand a severe weather event such as a Category 3 hurricane. Another reason CL&P did not assume hardening the existing overhead infrastructure as an alternative was due to the fact that during that scenario electric distribution company resources would be needed for restoration of the damaged microgrid infrastructure, which would be as susceptible to damage as the existing overhead main grid, diverting these resources from restoring power to end customers, eliminating one of the key benefits that selective hardening seeks to accomplish. Finally, for the undergrounding alternative CL&P assumed 100% express feed undergrounding, which will include only the critical facilities and not other customers along the undergrounded route. CL&P did not consider multiple scenarios of undergrounding portions of the distribution system and the resulting effects on reliability. CL&P’s assumption was to compare undergrounding electrical infrastructure to underground microgrid scenarios in order to have as comparable solutions as possible.
3. What is the difference between high vs. low voltage microgrids? Why did the study focus on high
voltage microgrids? (Answers questions: 3.18, 3.37)
As mentioned above there are many configurations of electrical microgrids: campus style, military bases, single buildings with multiples loads, two or more buildings with shared secondary, centralized distributed generators, or multiple generators, CHP versus emergency /standby generation, utility microgrids such as at the feeder level and low voltage versus high voltage. In the process of reviewing and selecting clusters of critical town facilities it was apparent that many of these facilities were at a distance that would make low voltage construction not feasible and difficult to estimate for the analysis. Therefore to simplify and to duplicate a common microgrid configuration from town to town, CL&P chose a high voltage microgrid interconnection. Obviously if the microgrid consists of two adjacent buildings in close proximity then a secondary connection may be a possibility. It should also be noted that most large campus style microgrids, particularly universities, typically use high voltage infrastructure to connect adjacent buildings on campus.

peer review of a cl&p/uconn report concerning emergency preparedness and response at selective critical facilitiesappendices
connecticut academy of science and engineering 43
2
4. Why did the study focus on the use of fuel cell and microturbines for microgrids and not other options? (Answers questions: 1.45, 2.13, 2.14, 4.1, 4.4)
Common reliable generation resources include reciprocating engines, gas turbines, microturbines1 and fuel cells, the team reviewed all of these resources. In practice actual microgrids might include any of these options or a combination of these options as well as other generation sources in combination with the sources listed above. Since the clusters of buildings were typically less than 2 MW, CL&P eliminated the options of gas turbines. CL&P ultimately selected to compare microturbines and fuel cells for the model because of the potential for modular construction and for the fact that they may be more easily sited in a downtown district due to better sound characteristics than a reciprocating engine. Obviously all generation resources would be considered for an actual project, but for the purposes of the study and to simply the analysis, CL&P focused on fuel cells and microturbines.
5. Why did the study not take into account thermal loads and their use?
(Answers questions: 2.24, 3.3, 3.15, 3.22, 3.27, 3.28, 5.1)
Schools, police stations, fire stations, emergency operations centers, and gas stations are typically not configured to accept thermal loads for heating and cooling. In addition nursing homes and hospital, which may be reconfigured to accept thermal sources, typically do not have excess electrical generation if a CHP application is sized efficiently to capture the excess thermal energy. Therefore CL&P did not account for the value of thermal energy because a significant amount of additional capital expenditure would be required to size the generation and then connect thermal loads and modify heating and cooling infrastructure. A significant amount of engineering analysis would need to be conducted to determine if each facility or a host site can accommodate a central heating and cooling system. In addition access to the site and information regarding heat load information for each site should be collected to conduct CHP evaluation. CL&P has electrical load data readily available and choose to focus on the electrical components of a microgrid. Thermal loading analysis was not part of the scope of this study, as CL&P decided to focus on electric reliability benefits of different configurations as electric reliability is core to CL&P’s mission. Finally studied locations were selected based on predetermined criteria to achieve diverse group of sites, but not consulted with for such detailed information. To effectively realize the benefits of the total energy would require a detailed analysis of each microgrid and may require additional changes to public policy. CL&P does agree that applications that can take advantages of thermal energy should clearly being investigated as a part of any potential microgrid project.
6. Why did the study focus on diesel emergency generation and not gas or other options? (Answers questions: 5.11)
Diesel generators have historically the most common application for emergency and standby power applications. There are many authorities that have jurisdiction over these applications and they may require diesel generation. In addition, the availability of natural gas is not common to all areas of CT (only 30% of residents in the state of CT have access to natural gas). Therefore for this study CL&P chose diesel as the
1 Microturbines are small electricity generators that burn gaseous and liquid fuels to create high-speed rotation that turns an electrical generator. The size range for microturbines available and in development is from 30 to 250 kilowatts (kW), while conventional gas turbine sizes range from 500 kW to 250 megawatts (MW). Microturbines run at high speeds and, like larger gas turbines, can be used in power-only generation or in combined heat and power (CHP) systems”. (ICF Consulting Technology Characteristic: Microturbines 2008)

connecticut academy of science and engineering44
peer review of a cl&p/uconn report concerning emergency preparedness and response at selective critical facilities
appendices
3
common available emergency generator to model as it is replicable across all towns in CL&P’s service territory. In practice if the decision to install emergency generation at an individual facility or even a central emergency generator for a microgrid application an evaluation on which type of fuel to choose would depend upon a variety of factors that are specific to the location being analyzed. For instance, a large emergency or standby generator fueled by natural gas might significantly affect the monthly natural gas demand charge paid by the facility owner. Finally it is worth re-emphasizing that the selective hardening analysis conducted by CL&P and UCONN did not seek to analyze the solutions to specific towns situations. The purpose of the study was to use town data to determine common applications across the service territory so the results can be more easily extrapolated. 7. Why did emergency generators consider a single cost and why were the microgrid options varying
in initial cost? Where was the emergency generator expected to be installed (which facility would host) where there were multiple facilities? (Answers questions: 1.4, 1.20, 1.30, 3.17, 3.2, 3.8)
For the analysis the following fixed costs per kW were assumed: microturbine: $2,400/kW; fuel Cell $5,000 per kW and Emergency Generator: $1,200 per kW. The emergency generator options were assumed to be sized for each individual facility, not at a central location. The microgrids costs varied depending on the quantity of generation needed at each site and the variation of the amount of electrical infrastructure needed to connect the facilities. The study also did not analyze plug-in emergency generation as it does not provide the same level of reliability as the other options selected as there is an inherent time lag between and outage and a portable generation unit being deployed. CL&P does believe this is another option that can be considered to compliment the emergency generation. 8. The one-line diagram depicts “DG” interconnected on the utility side of the meter. Was that the
mode of interconnect for all microgrid examples/towns? If so, why? (Answers questions: 4.25)
Yes, to simplify and control the many variables associated with customer side connection; CL&P assumed that the microgrid generator at a central location would interconnect directly to the high voltage distribution system. As discussed above there are many permutations of microgrid configurations and if a host can be secured with a thermal load, that would be optimal condition, but not one that is consistent across all towns. 9. Why did the study use three different MonteCarlo simulations?
(Answers questions: 2.7, 3.6, 4.28, 5.8)
In the UCONN study, the Monte Carlo computations for reliability evaluation, life cycle cost estimation and reliability benefit analysis were conducted in series. This is necessary because of the following reasons.
Reliability analysis provides probabilistic indices normally on an annual basis (by running the simulation for thousands of years along the timeline). However, the economic analysis deals with NPV analysis for a time horizon that evaluates the life cycle of a project. For the reliability analysis, UCONN developed a robust and accurate Sequential Monte Carlo software package for estimating the probability distributions of reliability performance metrics such as outage duration and outage rate. For life cycle cost and reliability benefit analyses, commercial tools such as Crystal Ball have been adapted because these are widely accepted tools in financial analysis.

peer review of a cl&p/uconn report concerning emergency preparedness and response at selective critical facilitiesappendices
connecticut academy of science and engineering 45
4
By running the reliability analysis tool, UCONN provided probabilistic distributions for all reliability
indices that were sampled in the Monte Carlo economic analyses by using Crystal Ball. Therefore, the economic analyses results are accurate because they have taken into account the correct and complete information of the system reliability behavior.
Calculating reliability results and economic results in one Monte Carlo process is technically
challenging. By definition, the NPV economic analysis will need the annual probabilistic reliability information which cannot be obtained until the whole Sequential Monte Carlo simulation for reliability analysis is completed. Therefore, UCONN believes the practice used in the analysis is reasonable and technically viable.
10. What was the basis for the weather assumptions, and did they assume a “new normal” in terms of
increased frequency and severity for weather events? (Answers questions: 4.12, 4.14, 5.4. 5.6, 5.7)
UCONN’s wind storm model was built based on historical data but is not a simple repetition of the history. The weather events were sampled from the models randomly and emulated the future weather changes along the timeline. In this sense, the UCONN model can be viewed as a simplified weather forecast model that is suitable for reliability analysis. A detailed forecast of the future weather and climate would better reflect the potential ‘new normal’ and thus would be helpful for improving the precision of the reliability evaluation. It is actually a potential future research topic for UCONN but it was out of the scope of this study. UCONN would like to emphasize that any weather forecast model is, by default, going to be based on historical data. In this study, it is important to find the relative reliability performance among different hardening options so that a fair ranking can be carried out. For this purpose, UCONN’s storm model provided a reasonably accurate weather estimation that has been applied to all hardening options, which has ensured a fair comparison. The reliability results obtained from the storm model also provided valuable insights about the frequency and magnitude of the impact of wind storms on CL&P’s distribution infrastructures. 11. What were the transmissions, natural gas, and diesel outage rates assumed in the study?
(Answers questions: 1.17, 2.3, 3.5, 3.40, 4.9, 5.18)
Transmission system reliability parameters were provided by NU, as shown in Table 1 based on data gathered in the 2007 to 2011 time period.

connecticut academy of science and engineering46
peer review of a cl&p/uconn report concerning emergency preparedness and response at selective critical facilities
appendices
5
Table 1 Transmission system reliability data
Failure rate
Occurrences/year per substation Repair time per occurrence
Normal weather - all sustained transmission line outages due to all causes except lightning and weather
1.88 occurrences/year per substation 11 hours per occurrence
Major storms - all sustained transmission line outages caused by lightning and weather except for Irene & Alfred
1.05 occurrences/year per substation 12 hours per occurrence
Category 1 - all sustained transmission line outages caused by Irene or Alfred
0.69 occurrences/year per substation 58 hours per occurrence
Category 2 - extrapolated TFREQ - 1.06 trips/year in CL&P - assuming 45% result in S/S impact - 0.50 occurrences/year per S/S
120 hours per occurrence
Category 3 - extrapolated TFREQ - 0.71 trips/year in CL&P - assuming 60% result in S/S impact - 0.42 occurrences/year per S/S
180 hours per occurrence
Key assumptions underlying the data include: Occurrences are assumed to be a totally de-energized substation resulting in a significant number of
customer outages. Category 1 storms were only Irene and Alfred in the in the 2007 thru 2011 period. Most line outages due not result in a de-energized substation due to the reliable transmission system
network design:; conservatively high percentages were chosen - 5% for normal, 15% for major and 33% for super major .
The parameters for natural gas system are assumed to be 50% of the corresponding parameters for transmission system. The estimate is based on engineering judgment because it is difficult to obtain the reliability data for gas delivery systems. Gas systems include gas pipelines and associated mechanical subsystems and are often laid underground or on the ground, which makes them less vulnerable to extreme weather and other hazards than transmission facilities. For this reason, a 50% estimate is adopted in the study. Same assumption is applied for availability of diesel supply. 12. What was the statistical evaluation used to validate results for the reliability analysis?
(Answers questions: 2.8, 4.8, 4.23)
In this study, the accuracy of the statistical models is ensured by using maximum likelihood estimation and is validated by using historical statistics. The statistical models are established based on distribution fitting. Wind storms are rare events; thus, each data point has its unique contribution to the statistical modeling (e.g. all Sustained Surface Wind Speeds (SSWSs) of wind storms determines the wind storm intensity). In order
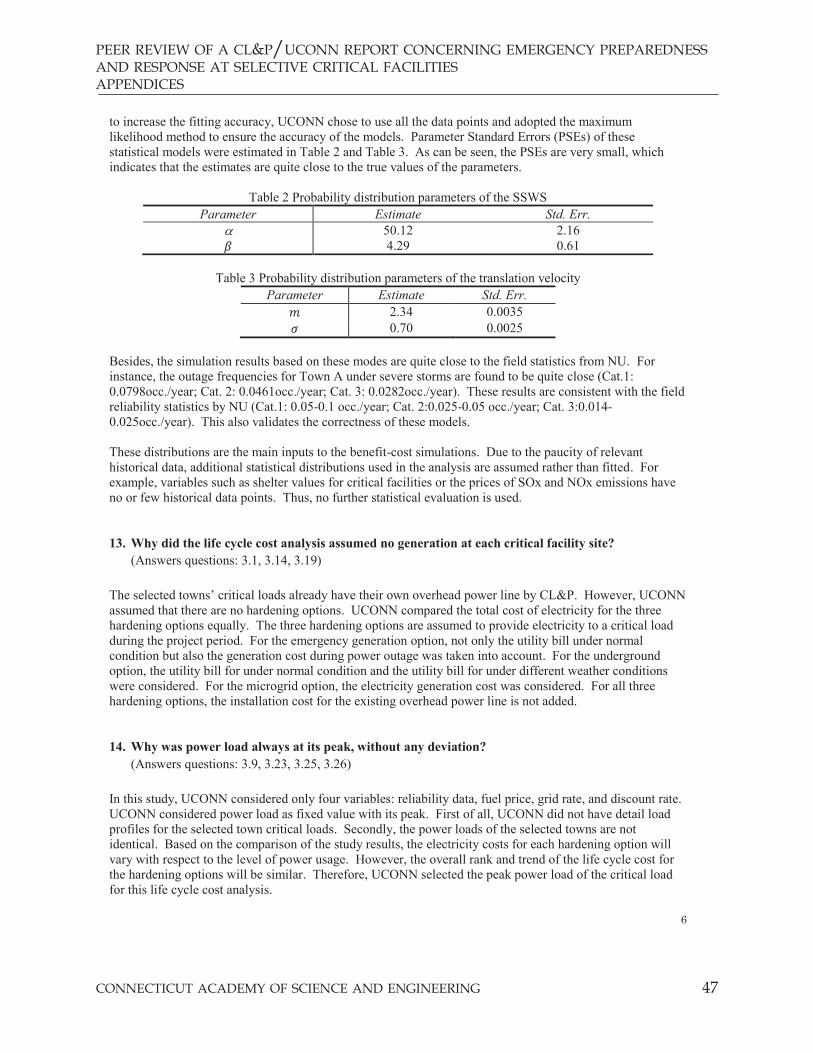
peer review of a cl&p/uconn report concerning emergency preparedness and response at selective critical facilitiesappendices
connecticut academy of science and engineering 47
6
to increase the fitting accuracy, UCONN chose to use all the data points and adopted the maximum likelihood method to ensure the accuracy of the models. Parameter Standard Errors (PSEs) of these statistical models were estimated in Table 2 and Table 3. As can be seen, the PSEs are very small, which indicates that the estimates are quite close to the true values of the parameters.
Table 2 Probability distribution parameters of the SSWS Parameter Estimate Std. Err.
50.12 2.16 4.29 0.61
Table 3 Probability distribution parameters of the translation velocity
Parameter Estimate Std. Err. 2.34 0.0035 0.70 0.0025
Besides, the simulation results based on these modes are quite close to the field statistics from NU. For instance, the outage frequencies for Town A under severe storms are found to be quite close (Cat.1: 0.0798occ./year; Cat. 2: 0.0461occ./year; Cat. 3: 0.0282occ./year). These results are consistent with the field reliability statistics by NU (Cat.1: 0.05-0.1 occ./year; Cat. 2:0.025-0.05 occ./year; Cat. 3:0.014-0.025occ./year). This also validates the correctness of these models. These distributions are the main inputs to the benefit-cost simulations. Due to the paucity of relevant historical data, additional statistical distributions used in the analysis are assumed rather than fitted. For example, variables such as shelter values for critical facilities or the prices of SOx and NOx emissions have no or few historical data points. Thus, no further statistical evaluation is used. 13. Why did the life cycle cost analysis assumed no generation at each critical facility site?
(Answers questions: 3.1, 3.14, 3.19)
The selected towns’ critical loads already have their own overhead power line by CL&P. However, UCONN assumed that there are no hardening options. UCONN compared the total cost of electricity for the three hardening options equally. The three hardening options are assumed to provide electricity to a critical load during the project period. For the emergency generation option, not only the utility bill under normal condition but also the generation cost during power outage was taken into account. For the underground option, the utility bill for under normal condition and the utility bill for under different weather conditions were considered. For the microgrid option, the electricity generation cost was considered. For all three hardening options, the installation cost for the existing overhead power line is not added. 14. Why was power load always at its peak, without any deviation?
(Answers questions: 3.9, 3.23, 3.25, 3.26)
In this study, UCONN considered only four variables: reliability data, fuel price, grid rate, and discount rate. UCONN considered power load as fixed value with its peak. First of all, UCONN did not have detail load profiles for the selected town critical loads. Secondly, the power loads of the selected towns are not identical. Based on the comparison of the study results, the electricity costs for each hardening option will vary with respect to the level of power usage. However, the overall rank and trend of the life cycle cost for the hardening options will be similar. Therefore, UCONN selected the peak power load of the critical load for this life cycle cost analysis.

connecticut academy of science and engineering48
peer review of a cl&p/uconn report concerning emergency preparedness and response at selective critical facilities
appendices
7
15. What are the differences between the costs used in the life cycle cost analysis and the cost/benefit
analysis used by the School of Business? (Answers questions: 3.17, 4.28)
The life cycle cost analysis and cost/benefit analysis offer two different, but complementary perspectives on the technology cost options. Each analysis uses the same underlying assumptions for capital costs and operating costs. The primary cost difference between the two approaches is driven by how the facility’s electricity costs are characterized in each analysis. The School of Business cost/benefit analysis focuses on the incremental costs associated with running each technology option during an outage event. These costs are projected into perpetuity and would include capital costs, replacement costs, maintenance costs, environmental costs and fuel costs. The fuel costs embedded in the School of Business cost/benefit analysis are only incurred when the generation units are operating. So, for a diesel generator, this may be only for a few hours per year while a fuel cell microgrid is assumed to operate 8,760 hours per year. The Life Cycle Cost Analysis (LCC) is traditionally used by government agencies to evaluate the total cost (not incremental) of several energy technologies or energy efficiency options during a facility’s design phase. The analysis provides the lowest total cost energy technology option for providing continuous energy service to the facility over a discrete time period. The School of Engineering performed the LCC on each of the hardening options assuming each critical facility was in the design phase and did not have any electrical infrastructure. The LCC analysis included the same assumptions for capital costs and operating costs used in the cost/benefit analysis, but also included the annual fuel costs for 8,760 hours of operation for each technology. In the LCC analysis, the fuel costs for a diesel generator and a fuel cell microgrid would both be based on 8,760 hours of operation and the underground option would have included the projected grid cost of electricity (for 8,760 hours), since no generation source was on-site. The LCC analysis will generally result in higher total costs for the diesel generation and undergrounding options compared with the cost benefit analysis. The two analyses will also slightly differ in the replacement cost and annual operating costs categories since the cost benefit analysis projects these costs into perpetuity, while the LCC analysis is performed over a discrete period. 16. What are the differences in the life span of the analysis?
(Answers questions: 3.24, 6.1.3)
Life Cycle Approach: The estimated life time of the underground wire option is 40 years. The other options will effectively operate for 20 years. It is important to note that the replacement cost of underground wire option is the largest portion of its overall cost. Therefore, UCONN decided that the project period is 40 years so that replacement costs of the other hardening options are needed to be considered in order to properly evaluate one option against the other. Net Present Value (NPV) Approach for the cost-benefit analysis: The NPV analysis estimates the total net financial worth of each hardening alternative. Thus, the assumption of perpetuity is made for each option, for both comprehensive and comparable results.

peer review of a cl&p/uconn report concerning emergency preparedness and response at selective critical facilitiesappendices
connecticut academy of science and engineering 49
8
17. What is the basis for the discount rate used in the analysis? (Answers questions: 2.20, 5.3)
Within the framework of Net Present Value (NPV) analysis, this variable is a long-term average financial rate of return commensurate with the systematic/non-diversifiable risk borne by the financial stakeholders of the project under examination. Accordingly, both the NU (regulated) cost of capital and the social discount rate are used as benchmarks. To the best of UCONN’s knowledge, there are no other relevant benchmark rates of return that would measure risk for the selective hardening options. Since both benchmarks are officially-determined rates, there is no uncertainty about their values at the time of the analysis. A small variation of the discount rate does not generally yield any change in the rankings provided by NPV analysis. 18. What was the emissions data used in the study and the basis for it?
(Answers questions: 5.10, 5.15)
Study used a CO2 emission per kWh number derived as follows: For generators, 0.000785 tons/kWh
(http://www.eia.gov/oiaf/1605/coefficients.html#tbl2) For microgrid (fuel cell), 1,050 lbs/MWh
(UTC document: Introducing a new generation of fuel cell technology: The PureCell® Model 400 Energy Solution.)
For microgrid microturbines, 777 g/MWh, (Canova et al., 2008. “Emission characterization and evaluation of natural gas-fueled cogeneration microturbines and internal combustion engines”, Energy Conversion and Management, Vol. 49, pp. 2900–2909)
In addition, study assumed Sox and NOx emissions for the diesel emergency generators and the information was derived as follows:
SOx emission (generators, in tons) = Annual diesel fuel consumption (gal) * (39.7 lbs SO2/1,000 gal fuel) x (1 ton/2,000 lbs)
NOx emission (generators, in tons) = Annual diesel fuel consumption (gal) * (604 lbs NOx/1,000 gal of fuel) x (1 ton/2,000 lbs)
SOx NOx data source = • EPA - AP-42, Compilation of Air Pollutant Emission Factors • Department of Environmental Quality, Potential To Emit • Diesel Fired Generator Calculation Worksheet, State of Michigan
connecticut academy of science and engineering50
peer review of a cl&p/uconn report concerning emergency preparedness and response at selective critical facilities
appendices
APPENDIX C
PRC QUESTIONS/COMMENTS ON CL&P/UCONN REPORTS WITH MAPPING OF CL&P/UCONN RESPONSES
QuestionsorcommentsthatdonotappeartohavebeenansweredbyCL&Pshouldnotbetakenasalackofresponsivenessfromtheauthors;rather,theyindicateareasforfurtherstudyorconsideration. Introduction the prC developed questions based on their review of the Cl&p and uConn Schools of engineering and Business reports. these questions were submitted to the authors in advance of the November 15, 2013 Briefing. Additional questions were forwarded to CL&P following the briefing. CL&P responded to PRC questions on December 6, 2013 (see Appendix B: CL&P response to questions from Connecticut Academy of Science and engineering)
the questions and responses are arranged in the six tables that follow. each question in each table has a unique number assigned. For example, the 1.1 in the “PRC QUESTION” column references table 1, question 1.
1. uConn SCope of Work And generAl queStionS2. AnAlySiS of SeleCtive hArdening optionS: introduCtion to proJeCt
reportS, Cl&p (note: questions in this table are based on the original version of this report dated may 31, 2013)
3. life-CyCle CoSt AnAlySiS, uConn SChool of engineering4. reliABility evAluAtion, uConn SChool of engineering5. Benefit-CoSt AnAlySiS, uConn SChool of BuSineSS6. AdditionAl prC queStionS - poSt 11-15-13 Briefing
Notes: 1. Cl&p grouped their response to the prC questions (see Appendix B) by 18 themes. for
each theme, the table(s) and the question number(s) are referenced in their response. 2. following each question in each table in which a response was provided by Cl&p, a
“RESPONSE” row has been inserted. The response to each question answered by CL&P is referenced in the reSponSe row by Cl&p theme number and page number (see AppendiX B). the reSponSe and related prC queStion are shaded in gray with text in red. if there is not a reSponSe row following a question, Cl&p did not respond to the question.
3. Questions in each table were grouped into focus areas and/or identified by report sections and page number(s). the foCuS/pAge column provides these references, if applicable.
4. italics that appear in some questions indicate that the prC repeated wording from the specific report related to the question.
5. When bolded words appear in questions, the words were bolded by the prC when the question was submitted.

peer review of a cl&p/uconn report concerning emergency preparedness and response at selective critical facilitiesappendices
connecticut academy of science and engineering 51
GENERAL QUESTIONS AND SCOPE OF WORK PRC
QUESTION FOCUS/PAGE QUESTIONS
1.1 Broad Scope Questions
Who are all the parties involved in the potential decision process, implementation, and “use” of any hardening option? (e.g., CL&P, state agencies, local government, what does the affected public do?)
1.2 Broad Scope Questions
CHP systems have a substantial appeal, for both efficiency and reliability. Please comment.
1.3 Broad Scope Questions
What is the time requirement for backup power generation to be in place? Minutes, hours, days?
1.4 Broad Scope Questions Does the capability presently exist to “plug in” mobile power generation?
RESPONSE See Appendix B - CL&P Response #7
1.5 Broad Scope Questions
The major conclusions of this study seem intuitively obvious. Were there any surprises from this study?
1.6 Broad in Scope Questions
I was greatly confused as to the specifics of the systems discussed and analyzed in each study. For example, I was unclear as to the details of the wiring and interconnections. In particular, I was interested in which options included underground wiring. Such wiring arrangements could be compatible with CHP systems. Also, I was unclear as to what other new hardware was needed, as compared to the existing hardware.
1.7 Broad Scope Questions
To the extent that the several analyses are for different implementations, our Committee job may be more difficult. A discussion of the similarities and differences for the three analyses would be useful and helpful.
1.8 Broad Scope Questions
Did the UCONN/CL&P study team involve anyone involved in the design, construction and/or the operation of the UConn’s combined heat and power (CHP) facility and any subsequent system additions/improvements to gain insight on practical/hands-on, first-person experience? Such real world information and direct input might [have] prove[d] invaluable and provide[d] added credibility. What discount rate was used in the UConn facility’s benefit/cost analysis? How was this selected?
1.9 Broad Scope Questions
Through what process were the “hardening” techniques developed? What sources were consulted for best practices? Were only UConn and CL&P personnel used or did they go outside for inputs? Conduct design charettes? Talk with Connecticut’s abundant insurance industry? Meet with actual town officials to understand their needs and security desires? Look at microgrid plans by the military who have taken a leading role in their proliferation and usage? Conduct a more extensive literature search including Brittle Power, Small is Profitable and Reinventing Fire by Amory Lovins et al that detail energy and non-energy benefits of resilient systems that might like to be included in such analyses?
1.10 Broad Scope Questions
“Cost” should not be the principal criterion (e.g., hospitals, nursing homes, airports, pump stations, data centers…).
1.11 Broad Scope Questions
The New England region is becoming increasingly dependent on natural gas for both space heating and electricity generation. Should these studies evaluate the benefit-cost ratios for “loss of natural gas supply” as a causal event? Alternatively, should fuel diversity be mentioned as a qualitative benefit for diesel fuel oil based systems?
1.12 Broad Scope Questions Can CL&P isolate areas from ISO New England?
1.13 Microgrid What is a typical cost just to put a microgrid in place, within an existing grid?
1.14 Microgrid Could backup generation for town center A be used to put on the grid for town center X? That is, could power be transferred between microgrids?

connecticut academy of science and engineering52
peer review of a cl&p/uconn report concerning emergency preparedness and response at selective critical facilities
appendices
1.15 Microgrid What is the maximum / peak expected KWE microgrid requirement? [the LCC data tables show a range of 0.2 to 4.5 MW]
1.16 Microgrid How do microgrids interface with ISO NE?
1.17 Microgrid Would microgrids rely on natural gas supply? What is the supply reliability? Is CT dependent on natural gas for critical facilities?
RESPONSE See Appendix B - CL&P Response #11 1.18 CASE Deleted Question
1.19 Reliability
Define “Reliable.” What is the base reliability presently for any example town or facility? Is reliability expressed as a probability (10-X) or just as outage days? How has reliability increased from a known base value for any example town or facility as a result of enhancements since the base date to today?
1.20 Reliability Suggestion to consider: Put in place regional, portable / mobile emergency generation facilities and equipment; for example truck-mounted generators, to run on natural gas or diesel. Is this a possibility?
RESPONSE See Appendix B - CL&P Response #7
1.21 Reliability
The current study appears to deal only with selected health and safety issues in what appears to be short term—say several days—outages. If the outages were extended to include those experienced recently—5 to 10 days—I would think that the attractiveness of emergency generators would decline and microgrids would become the more attractive. These longer outages, especially if widespread, would lead to disruption in personal transport and food supply at a minimum. Please comment.
1.22 Reliability For “expected reliability performance improvement”, what is the base, starting point, current reliability? What is an acceptable minimum reliability?
1.23 Reliability What is / are the reliability goals? 1.24 Reliability I expected to see the term “reliability and redundancy.” Please comment.
1.25 Reliability With regard to “Critical Facilities,” is there an existing reliability database (i.e., a reference base case)?
1.26 Reliability Do the eight selected locations represent a spectrum of reliability improvement needs? That is, are there existing low / very low reliability areas? Are there very high reliability areas?
1.27 Reliability
The sequential Monte-Carlo simulation seems a very good method to be used as a basis for the reliability evaluation of the various proposed methods. How would you translate the benefit of applying the hardening methods to critical facilities to the overall benefits to the people of Connecticut during massive power outages?
1.28 Critical Facilities Can CL&P monitor critical facilities?
1.29 Critical Facilities I expected to see gasoline service stations and communication centers included as critical facilities. Please comment.
1.30 Critical Facilities
The studies assume that the emergency generators are bought for each town. Should Connecticut also evaluate an approach where these critical facilities only build the switchgear infrastructure to allow portable emergency generators to be readily connected and then rent the access to portable generation? Alternatively, the CT National Guard could buy some of these generators and be trained to use them.
RESPONSE See Appendix B - CL&P Response #7
1.31 Storm Focus This study seems to be storm focused. What about fires, truck hits transformer, major generating station outage, blackouts, plane crash, etc.?
1.32 Storm Focus
Why is this study aimed solely at responses to storms like Irene, the October Nor’easter, Sandy and Category I to III Hurricanes? Isn’t it important that the study look at grid threats in a holistic way that takes an all-hazards approach? Doesn’t placing scarce funding into rectifying conditions to treat only one set of threats actually lead to possibly exacerbating conditions brought on by different ones that may prove even more challenging? While it is human nature (the “availability heuristic” by Kahneman, Tversky, et al.) to address the most recent type of threats (i.e. storms in this case), the study team may wish to add another

peer review of a cl&p/uconn report concerning emergency preparedness and response at selective critical facilitiesappendices
connecticut academy of science and engineering 53
dimension to the analyses as to how each option performs under different threat scenarios-CME, cyber attack, etc.
1.33 Storm Focus Is this study of severe weather events the first of a series of studies on reliable electric services to critical facilities?
1.34 Best Practice What are other states doing or have done regarding this issue? Can CT interface with neighboring states regarding this?
1.35 Scope of Work Was the model of a Combined Heat and Power System ever considered in any of the studies? Such an option was noted under Phase 2 (iv) of the Statement of Work. However, I could not find any mention of such an option in the studies.
1.36 Scope of Work, p.1
CL&P has identified at least three different “selective hardening” techniques to accomplish such goal: 1) undergrounding, 2) emergency or backup generation and 3) microgrids. Did the authors consider other hardening techniques? Which were considered but dismissed and why?
1.39 Scope of Work, p. 1
It is expected that the specific selective hardening approach (undergrounding, backup generation or microgrids) for each town center or critical facility will depend in (sic) many factors such as location, state of the distribution network, distance to bulk substation, availability of gas, and many other factors. In order to properly select the approach for each town center or critical facility, CL&P recommends that an examination of costs and benefits is required.
How did the authors identify the factors (location, state of the distribution network, distance to bulk substation, availability of gas)?
What “many other factors” were identified by the authors?
1.40 Scope of Work, pp. 1-2
Goal is expressed as “harden town centers or areas which offer critical services.” • How was this converted to critical facilities? • How were “areas” defined/determined?
1.41 Scope of Work Note: Not all of the items in the SOW are in the reports (e.g., Phase 2 (iv)(c)(d)) 1.42 CASE Deleted Question
1.43 Scope of Work, Phase 1, p. 2
(i) Select 10 locations within 10 different towns to focus of the evaluation. Within each of the 10 selected locations, define a list of critical facilities (i.e., fire, hospital, pump station, etc.) and list of “social need” facilities (i.e., gas station, grocery store, food establishments).
What criteria was used to select the 10 towns? What criteria was used to define the list of critical facilities?
1.44 Scope of Work, Phase 2
A number of “critical facilities” were identified, but this reviewer lacks the proper knowledge to judge how the facilities selected are critical to their communities. Explain to what extent the hardening of the power supply in the facilities selected would alleviate the loss of power supply situation in the towns/communities covered.
1.45 Scope of Work, Phase 2, p. 2
(iv) Define and evaluate technical issues for microgrid options a. Define feasible microgrid option (i.e., fuel cells, combined heat and power, microturbine, diesel, backup only vs. normal load supplying, etc.) b. Select feasible microgrid system design based on CL&P’s design options c. Evaluate islanding/load following capabilities of selected generation types d. For each of the 10 locations selected identify and quantify key technical issues: i. Determine fault contribution by generator type connected ii. Determine interface location selection iii. Identify and assess protective issues iv. Define sync/synch check requirements
What criteria were used to determine which various distribution generation (DG) technologies would be analyzed?
Did the authors consider more than one model for microgrid deployment: - Serving one customer with single structure on customer side of meter; - Serving one customer with multiple structures (campus or hospital complex)

connecticut academy of science and engineering54
peer review of a cl&p/uconn report concerning emergency preparedness and response at selective critical facilities
appendices
on customer side of multiple meters; - Serving multiple customers on customer side of one nearby customer’s meter; - Serving multiple customers on utility side of meters; - Utilizing multiple technologies; - Utilizing intermittent distributed resources with storage; - All of the above configurations with utility vs. Customer owned.
For those models above that are not included, were they considered? Why not included?
RESPONSE See Appendix B - CL&P Response #4
1.46 Scope of Work, Phase 2, p. 2
The generation options selected appear to be used as sole sources of power without mention of their being used in combinations. Has the study team considered using them in combination (say a microturbine and a fuel cell) as is often considered in microgrid design best practices to provide not only redundancy but also diversity of prime movers and even fuel sources? Even consideration of photovoltaics for microgrid peaking needs is not an inconceivable option (PV output is naturally load following) and may even be cost effective if a peak rate is the proxy it is compared to rather than a bulk rate.) The new, proposed UConn Microgrid uses a fuel cell and a PV system.
1.47 Scope of Work, Phase 2, p. 2
What was the process and substance of going from Phase II (iv)a. microgrid options including fuel cells, CHP, microturbines, diesel, backup only, to (iv)b., feasible microgrid options as only fuel cells and microturbines? • Note also, Life-Cycle Cost Analysis p. 3 and certain BCA
computations/charts discuss 4 microgrid options (high and low voltage for each of FC and MT). When are high and low voltage differentiations relevant and why?
1.48 Scope of Work, Phase 2 (iv)(d)(i) Define “Fault contribution by generator type connected”
1.49 Scope of Work, Phase 2(iv)(d)(iv) Define “Sync / Synch check requirements”
1.50 Scope of Work, Phase 3
(v) Evaluate costs for each of the undergrounding, back-up generation and microgrids alternatives for each of the 10 locations selected a. Capital costs b. Operational costs c. Maintenance costs d. Environmental costs e. Energy costs f. Other
Are the cost elements broken out? What resources were utilized to estimate the cost elements?
1.51 Scope of Work, Phase 4, p. 3
Determine the expected reliability performance improvement (UConn and CL&P co-lead) (vi) Determine the expected reliability performance improvement (major storms, “normal” storms and day to day basis) for each of the 10 selected locations from: a. Undergrounding option(s) b. Backup generation c. Microgrid option(s)
Was the resulting continuous power from each option considered an improvement in reliability?
1.52 Scope of Work, Phase 5, p. 3
Phase 5 – Assess benefits of each identified option (UConn lead) (vii) Quantify the monetary benefits for each of the undergrounding, backup generation and microgrid alternatives for each of the 10 locations selected a. Reliability benefits (major storm, “normal” storm and day to day) – i.e., what is the value to society of reduced number of days of interruption b. Energy production benefits c. Peak load reduction benefits d. Environmental benefits e. Other
What “Other” benefits were included and why?
In circumstances where participating host customer derived savings from reduced purchases of electricity (from power generation to serve load during
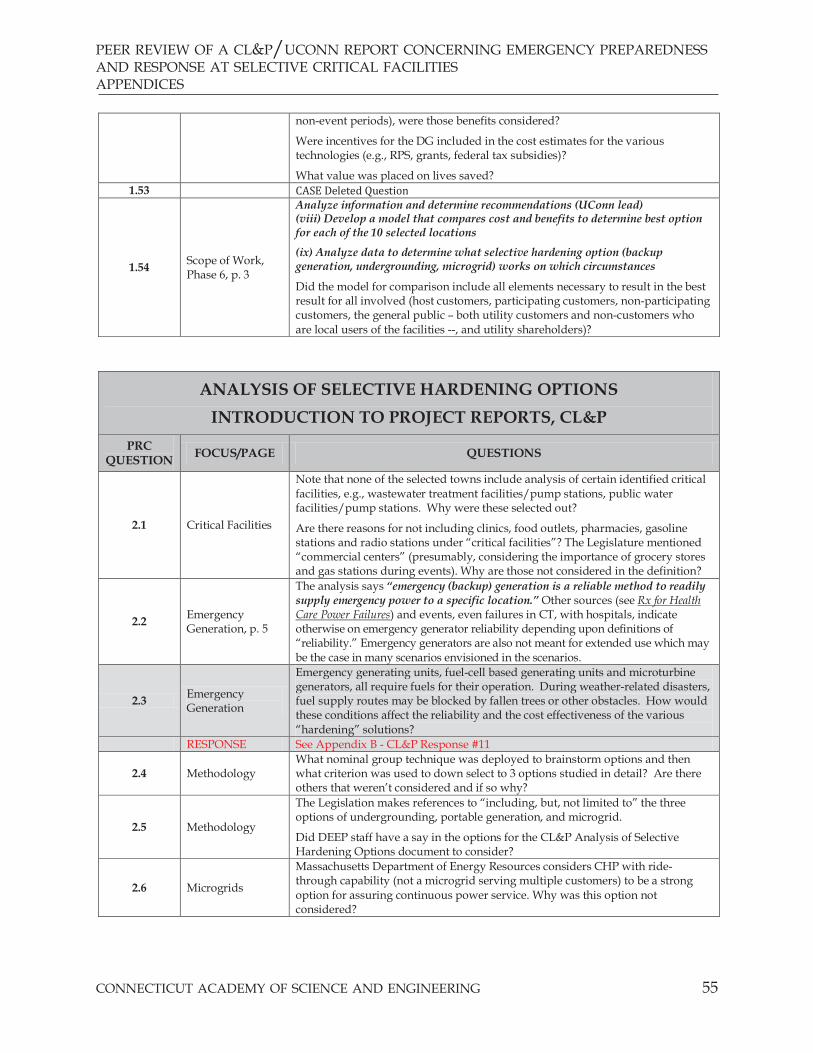
peer review of a cl&p/uconn report concerning emergency preparedness and response at selective critical facilitiesappendices
connecticut academy of science and engineering 55
non-event periods), were those benefits considered?
Were incentives for the DG included in the cost estimates for the various technologies (e.g., RPS, grants, federal tax subsidies)?
What value was placed on lives saved? 1.53 CASE Deleted Question
1.54 Scope of Work, Phase 6, p. 3
Analyze information and determine recommendations (UConn lead) (viii) Develop a model that compares cost and benefits to determine best option for each of the 10 selected locations
(ix) Analyze data to determine what selective hardening option (backup generation, undergrounding, microgrid) works on which circumstances
Did the model for comparison include all elements necessary to result in the best result for all involved (host customers, participating customers, non-participating customers, the general public – both utility customers and non-customers who are local users of the facilities --, and utility shareholders)?
ANALYSIS OF SELECTIVE HARDENING OPTIONS INTRODUCTION TO PROJECT REPORTS, CL&P
PRC QUESTION FOCUS/PAGE QUESTIONS
2.1 Critical Facilities
Note that none of the selected towns include analysis of certain identified critical facilities, e.g., wastewater treatment facilities/pump stations, public water facilities/pump stations. Why were these selected out?
Are there reasons for not including clinics, food outlets, pharmacies, gasoline stations and radio stations under “critical facilities”? The Legislature mentioned “commercial centers” (presumably, considering the importance of grocery stores and gas stations during events). Why are those not considered in the definition?
2.2 Emergency Generation, p. 5
The analysis says “emergency (backup) generation is a reliable method to readily supply emergency power to a specific location.” Other sources (see Rx for Health Care Power Failures) and events, even failures in CT, with hospitals, indicate otherwise on emergency generator reliability depending upon definitions of “reliability.” Emergency generators are also not meant for extended use which may be the case in many scenarios envisioned in the scenarios.
2.3 Emergency Generation
Emergency generating units, fuel-cell based generating units and microturbine generators, all require fuels for their operation. During weather-related disasters, fuel supply routes may be blocked by fallen trees or other obstacles. How would these conditions affect the reliability and the cost effectiveness of the various “hardening” solutions?
RESPONSE See Appendix B - CL&P Response #11
2.4 Methodology What nominal group technique was deployed to brainstorm options and then what criterion was used to down select to 3 options studied in detail? Are there others that weren’t considered and if so why?
2.5 Methodology
The Legislation makes references to “including, but, not limited to” the three options of undergrounding, portable generation, and microgrid.
Did DEEP staff have a say in the options for the CL&P Analysis of Selective Hardening Options document to consider?
2.6 Microgrids
Massachusetts Department of Energy Resources considers CHP with ride-through capability (not a microgrid serving multiple customers) to be a strong option for assuring continuous power service. Why was this option not considered?
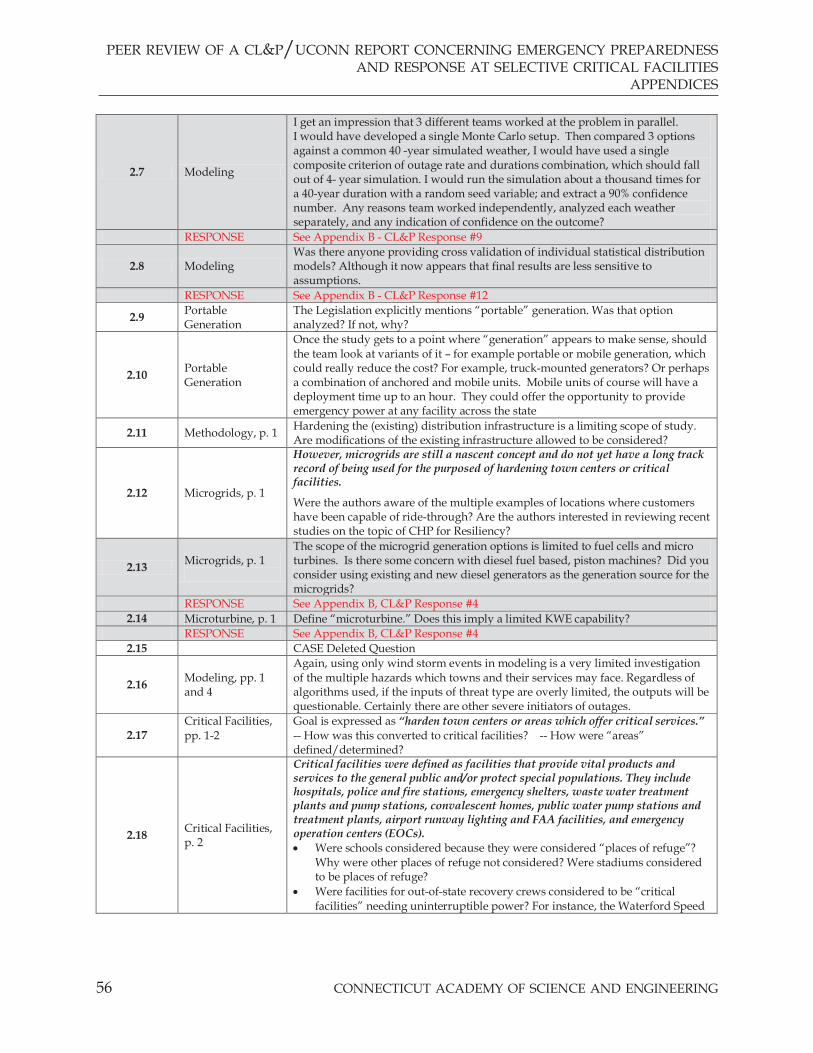
connecticut academy of science and engineering56
peer review of a cl&p/uconn report concerning emergency preparedness and response at selective critical facilities
appendices
2.7 Modeling
I get an impression that 3 different teams worked at the problem in parallel. I would have developed a single Monte Carlo setup. Then compared 3 options against a common 40 -year simulated weather, I would have used a single composite criterion of outage rate and durations combination, which should fall out of 4- year simulation. I would run the simulation about a thousand times for a 40-year duration with a random seed variable; and extract a 90% confidence number. Any reasons team worked independently, analyzed each weather separately, and any indication of confidence on the outcome?
RESPONSE See Appendix B - CL&P Response #9
2.8 Modeling Was there anyone providing cross validation of individual statistical distribution models? Although it now appears that final results are less sensitive to assumptions.
RESPONSE See Appendix B - CL&P Response #12
2.9 Portable Generation
The Legislation explicitly mentions “portable” generation. Was that option analyzed? If not, why?
2.10 Portable Generation
Once the study gets to a point where “generation” appears to make sense, should the team look at variants of it – for example portable or mobile generation, which could really reduce the cost? For example, truck-mounted generators? Or perhaps a combination of anchored and mobile units. Mobile units of course will have a deployment time up to an hour. They could offer the opportunity to provide emergency power at any facility across the state
2.11 Methodology, p. 1 Hardening the (existing) distribution infrastructure is a limiting scope of study. Are modifications of the existing infrastructure allowed to be considered?
2.12 Microgrids, p. 1
However, microgrids are still a nascent concept and do not yet have a long track record of being used for the purposed of hardening town centers or critical facilities.
Were the authors aware of the multiple examples of locations where customers have been capable of ride-through? Are the authors interested in reviewing recent studies on the topic of CHP for Resiliency?
2.13 Microgrids, p. 1
The scope of the microgrid generation options is limited to fuel cells and micro turbines. Is there some concern with diesel fuel based, piston machines? Did you consider using existing and new diesel generators as the generation source for the microgrids?
RESPONSE See Appendix B, CL&P Response #4 2.14 Microturbine, p. 1 Define “microturbine.” Does this imply a limited KWE capability?
RESPONSE See Appendix B, CL&P Response #4 2.15 CASE Deleted Question
2.16 Modeling, pp. 1 and 4
Again, using only wind storm events in modeling is a very limited investigation of the multiple hazards which towns and their services may face. Regardless of algorithms used, if the inputs of threat type are overly limited, the outputs will be questionable. Certainly there are other severe initiators of outages.
2.17 Critical Facilities, pp. 1-2
Goal is expressed as “harden town centers or areas which offer critical services.” -- How was this converted to critical facilities? -- How were “areas” defined/determined?
2.18 Critical Facilities, p. 2
Critical facilities were defined as facilities that provide vital products and services to the general public and/or protect special populations. They include hospitals, police and fire stations, emergency shelters, waste water treatment plants and pump stations, convalescent homes, public water pump stations and treatment plants, airport runway lighting and FAA facilities, and emergency operation centers (EOCs). • Were schools considered because they were considered “places of refuge”?
Why were other places of refuge not considered? Were stadiums considered to be places of refuge?
• Were facilities for out-of-state recovery crews considered to be “critical facilities” needing uninterruptible power? For instance, the Waterford Speed

peer review of a cl&p/uconn report concerning emergency preparedness and response at selective critical facilitiesappendices
connecticut academy of science and engineering 57
Bowl was used by thousands of such crews in the aftermath of Irene (personal observation).
• Were communication infrastructure facilities dedicated to Town Centers considered critical facilities?
• How did the team prioritize the various types of critical facilities?
2.19 Critical Facilities, p. 2
Critical facilities: • In subsequent sections schools figure prominently. Is that because they are
emergency shelters? Are other facilities that serve in that regard comparably considered (community centers, libraries)?
• Why aren’t gas stations, grocery stores, banks identified as critical facilities? Per above, are they assumed integrated in “town centers”? If so, by what criteria, e.g., distance to other facilities, electric connectivity?
2.20 Discount Rate, p. 2
Selection of a relatively high discount rate, closer to a utility weighted average of cost capital (like the 8.6% shown in places), provides a more favorable treatment of the EG option in spite of it having a higher fuel consumption, higher emissions and probably higher maintenance cost than more robust options meant for steady, long term operations. If more than one discount rate was used it might provide useful information since more efficient or renewable sources are penalized with this single, relatively high, discount rate which minimizes fuel cost and its externalities over time.
Has the team reviewed the annual update of discount rate issued by by NIST titled Energy Price Indices and Discount Factors for Life-Cycle Cost Analysis – 2013, Annual Supplement to NIST Handbook 135 and NBS Special Publication 709 (at pages 1-2)? This provides discount rates in the 3% range which might be more appropriate for this study.
RESPONSE See Appendix B - CL&P Response #17
2.21 Methodology (data), p. 2
Electric data (miles of line, line density, energy usage, bulk substations) • Was that data shared with DEEP staff for input on selection? • Is that data available for review by the peer reviewers?
2.22 Methodology (towns), p. 2
Utilizing this information, the CL&P team selected a representative sample of eight towns for cost benefit analysis of selective hardening options. • Why not 10 towns as directed by the Legislature? • Why were the towns selected by CL&P and not DEEP? Did they have input
on this selection?
2.23 Methodology (towns), p. 2
Please provide more detail re: criteria used to select study towns. What would constitute a cohesive “town center”
2.24 Reliability Benefit, p. 2
Does the “reliability benefit” provide other than energy production benefits, some of which are included in standard avoided cost calculations (i.e. transmission deferral or avoidance costs)? For determining a more comprehensive benefit/cost ratio shouldn’t domestic hot water production as a byproduct from fuel cells or microturbines also be considered on the benefit side of the equation? While some of these are mentioned on the last page (like environmental), in addition to these, what are termed Non-Energy Benefits (NEBs) such as reductions of losses such as spoiled food and even health and safety savings may need to be better internalized.
RESPONSE See Appendix B - CL&P Response #5
2.25 Reliability Benefit, p. 2, paragraph 3
“… greatest value …”? What about maximum reliability or reliability improvement of ∆X?
2.26 Critical Facilities, p. 3
The list of critical facilities includes many hospitals and some nursing homes. Do any of these (or the other facilities) already have backup generation?
2.27 Methodology (data), pp. 1-2
This data was then analyzed to identify a diverse selection of viable candidates for a cost-benefit analysis. (p. 1) Then an initial selection of towns was compiled to include towns of varied size in each division of the state to ensure geographical diversity. (p. 2) • Why was diversity considered the primary selection criteria?

connecticut academy of science and engineering58
peer review of a cl&p/uconn report concerning emergency preparedness and response at selective critical facilities
appendices
• Did the team/authors consider other criteria, such as outage data, system planning, susceptibility, proximity to systems most needing upgrades, preponderance of critical facilities by circuit, size of critical facilities (for instance, the state’s largest hospitals)? If not, why not?
2.28 Methodology, (towns), p. 3 Please provide a demographic description of each of Towns A through H.
LIFE-CYCLE COST ANALYSIS, UCONN SCHOOL OF ENGINEERING PRC
QUESTION FOCUS/PAGE QUESTIONS
3.1 Assumptions
The critical facilities selected by CL&P already have an existing power supply system. Yet, the UConn School of Engineering study assumes that “no previous power system exists.” Please explain how these two contradictory premises could be reconciled?
RESPONSE See Appendix B - CL&P Response #13
3.2 Assumptions
In each analysis an emergency generator (singular) was considered at a consistent cost of $1500/kW. Why were the MT options varying in initial cost from $4000-$10,000/kW?
Where was the emergency generator expected to be installed (which facility would host) where there were multiple facilities?
RESPONSE See Appendix B - CL&P Response #7
3.3 Assumptions
Using the MT option is the waste heat utilized while it is “always operating”? Or is it dumped?
Was such wasting of heat considered in modeling the environmental cost/benefit?
RESPONSE See Appendix B - CL&P Response #5
3.4 Assumptions Do any of the authors acknowledge the significant cost and climate savings that can be derived from CHP and/or renewable energy options that include storage?
3.5 Emergency Generation Fuel
Emergency generating units, fuel-cell based generating units and microturbine generators, all require fuels for their operation. During weather-related disasters, fuel supply routes may be blocked by fallen trees or other obstacles. In view of possible changes in fuel cost and availability during emergencies, how would the results of the LCC study be impacted? Should a sensitivity analysis be performed?
RESPONSE See Appendix B - CL&P Response #11
3.6 Modeling Was it at all possible to do LCC with the same Monte Carlo setup as used for reliability analysis?
RESPONSE See Appendix B - CL&P Response #9
3.7 Modeling I would have enjoyed seeing the 40 years LCC for a composite of weather with 90% confidence.
3.8 Portable Generation
It appears that portable generators were not considered for the study. Why is this the case?
In the opinion of the various team members (CL&P, UConn, DEEP, CASE staff), would that be a good option worthy of future analysis?
RESPONSE See Appendix B - CL&P Response #7
3.9 Executive Summary, p. 3, Paragraph 3
Clarify: “microgrid DG services are running all the time …“For 40 years? At peak capacity?
RESPONSE See Appendix B - CL&P Response #14

peer review of a cl&p/uconn report concerning emergency preparedness and response at selective critical facilitiesappendices
connecticut academy of science and engineering 59
3.10 Executive Summary, p. 3, Paragraph 3
Would microgrids potentially reduce the need for new generation facilities?
3.11 Executive Summary, p. 3, Paragraph 3
What was the high / low assumed cost of natural gas and diesel?
3.12 Executive Summary, p. 3
Is it assumed that the Microgrid portion of the total system can be isolated from the rest? If so, fine. However, I would imagine that such a feature might be a challenge for many applications.
3.13 Executive Summary, p. 3
Is it assumed here that all of the distribution will be done with existing wiring for all of the options? That is, except for the underground option.
RESPONSE See Appendix B - CL&P Response #2
3.14 Executive Summary, p. 3
The UCONN School of Engineering performed the LCC analysis under the assumption that no current power system exists.
Why? Was there no consideration for Critical Facilities with CHP already installed, but, not yet equipped to be capable of ride-through? Did the team consider that the addition of CHP, when properly sized for a facility, could lead to significant savings during normal operation that could “sponsor” the additional cost of equipment required for islanding?
Why was such an approach not analyzed? In the opinion of the various team members (NU, UConn, DEEP, CASE staff), would that be a good option worthy of future analysis?
RESPONSE See Appendix B - CL&P Response #13
3.15 Executive Summary, p. 3
1) only electric loads are considered Why were heat loads not considered when “microgrid DG sources are [considered] running all the time”?
RESPONSE See Appendix B - CL&P Response #5
3.16 Executive Summary, p. 3
HMs and LMs can be alternative solutions among other microgrid distributed generation options because their capital cost and operating cost are reasonable when compared to PV, wind turbine, and fuel cells. Were the costs of PV and wind considered in this study? If so, were incentives, subsidies, and the absence of fuel costs included in the analysis?
3.17 Executive Summary, p. 3
For the Emergency Generator option, does the power also go through the existing distribution system? This would seem to be the case. However, if so, I find such a configuration very unusual, and not one that I would expect. Also, if this were the case, I am surprised that the costs for this option are so large. My impression is that diesel generators are not very expensive.
RESPONSE See Appendix B - CL&P Response #7 and #15
3.18 Executive Summary, p. 3
First mention of 4 microgrid options. Why relevant here and not otherwise? Alternatively, why are they not identified otherwise?
RESPONSE See Appendix B - CL&P Response #3
3.19 Existing Power System, pp. 3 & 16
In the last paragraph, the statement reads “...under the assumption that no current power system exists.” Yet, on page 16, the diagram clearly states that the Microgrid system depends on an Existing Overhead Line. I am confused.
RESPONSE See Appendix B - CL&P Response #13
3.20 Table 1, p. 4 Based on the numbers in this table Town G - EG should be (2) and HM should be (1). Please confirm.
3.21 Annual Operating Cost, pp. 4, and 11-12
The National Institute of Building Sciences (NBS)/NIST LCC methodology (originally developed by Marshall & Ruegg) with which this reviewer has been familiar has not used electricity cost as an input to this reviewer’s knowledge. The UCONN/CL&P document states, “The annual operating cost of the hardening options includes the electricity cost to feed local loads, …” This reviewer assumes this only applies in a microgrid failure mode when electricity is sold from the grid (Case 2, below) to the microgrid ---this would be understandable. Can you confirm if this is the correct interpretation?
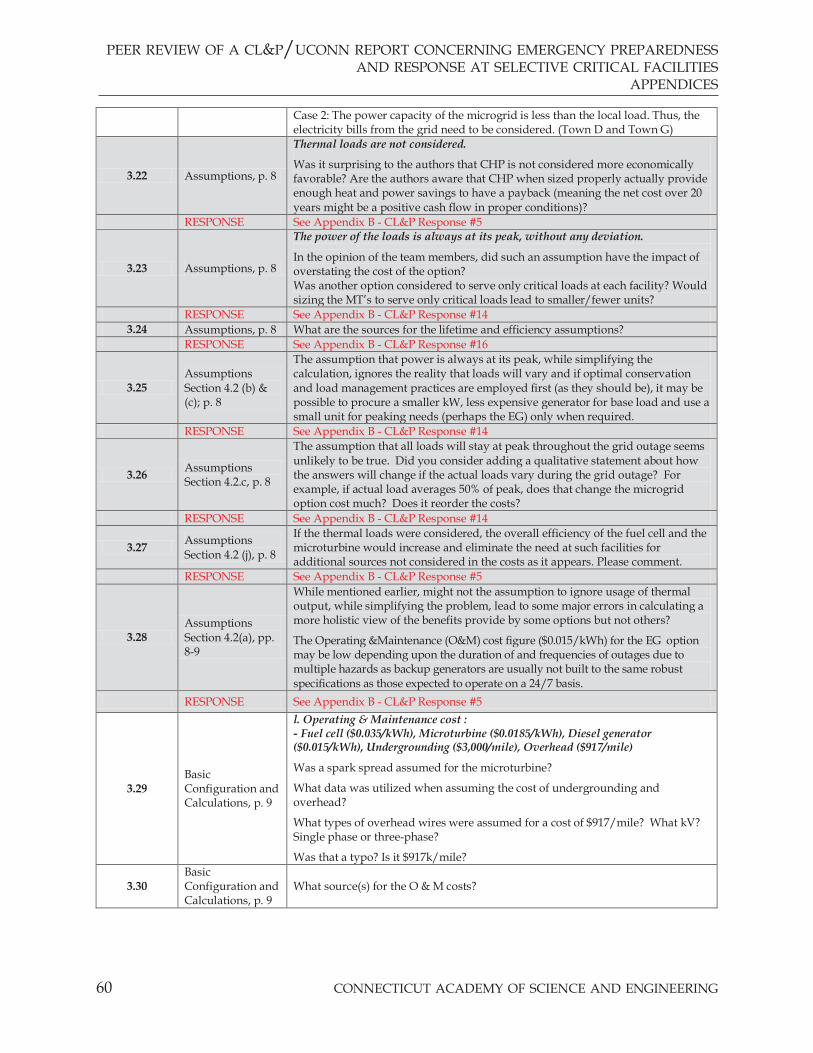
connecticut academy of science and engineering60
peer review of a cl&p/uconn report concerning emergency preparedness and response at selective critical facilities
appendices
Case 2: The power capacity of the microgrid is less than the local load. Thus, the electricity bills from the grid need to be considered. (Town D and Town G)
3.22 Assumptions, p. 8
Thermal loads are not considered.
Was it surprising to the authors that CHP is not considered more economically favorable? Are the authors aware that CHP when sized properly actually provide enough heat and power savings to have a payback (meaning the net cost over 20 years might be a positive cash flow in proper conditions)?
RESPONSE See Appendix B - CL&P Response #5
3.23 Assumptions, p. 8
The power of the loads is always at its peak, without any deviation.
In the opinion of the team members, did such an assumption have the impact of overstating the cost of the option? Was another option considered to serve only critical loads at each facility? Would sizing the MT’s to serve only critical loads lead to smaller/fewer units?
RESPONSE See Appendix B - CL&P Response #14 3.24 Assumptions, p. 8 What are the sources for the lifetime and efficiency assumptions?
RESPONSE See Appendix B - CL&P Response #16
3.25 Assumptions Section 4.2 (b) & (c); p. 8
The assumption that power is always at its peak, while simplifying the calculation, ignores the reality that loads will vary and if optimal conservation and load management practices are employed first (as they should be), it may be possible to procure a smaller kW, less expensive generator for base load and use a small unit for peaking needs (perhaps the EG) only when required.
RESPONSE See Appendix B - CL&P Response #14
3.26 Assumptions Section 4.2.c, p. 8
The assumption that all loads will stay at peak throughout the grid outage seems unlikely to be true. Did you consider adding a qualitative statement about how the answers will change if the actual loads vary during the grid outage? For example, if actual load averages 50% of peak, does that change the microgrid option cost much? Does it reorder the costs?
RESPONSE See Appendix B - CL&P Response #14
3.27 Assumptions Section 4.2 (j), p. 8
If the thermal loads were considered, the overall efficiency of the fuel cell and the microturbine would increase and eliminate the need at such facilities for additional sources not considered in the costs as it appears. Please comment.
RESPONSE See Appendix B - CL&P Response #5
3.28 Assumptions Section 4.2(a), pp. 8-9
While mentioned earlier, might not the assumption to ignore usage of thermal output, while simplifying the problem, lead to some major errors in calculating a more holistic view of the benefits provide by some options but not others?
The Operating &Maintenance (O&M) cost figure ($0.015/kWh) for the EG option may be low depending upon the duration of and frequencies of outages due to multiple hazards as backup generators are usually not built to the same robust specifications as those expected to operate on a 24/7 basis.
RESPONSE See Appendix B - CL&P Response #5
3.29 Basic Configuration and Calculations, p. 9
l. Operating & Maintenance cost : - Fuel cell ($0.035/kWh), Microturbine ($0.0185/kWh), Diesel generator ($0.015/kWh), Undergrounding ($3,000/mile), Overhead ($917/mile)
Was a spark spread assumed for the microturbine?
What data was utilized when assuming the cost of undergrounding and overhead?
What types of overhead wires were assumed for a cost of $917/mile? What kV? Single phase or three-phase?
Was that a typo? Is it $917k/mile?
3.30 Basic Configuration and Calculations, p. 9
What source(s) for the O & M costs?

peer review of a cl&p/uconn report concerning emergency preparedness and response at selective critical facilitiesappendices
connecticut academy of science and engineering 61
3.31
Basic Configuration and Calculations Item 4.2L, p. 9
I thought tree trimming was a major O&M cost. Are you sure the O&M cost per mile is lower for overhead than for underground? Does it matter or is the overhead system assumed to stay in service for all scenarios?
3.32
Basic Configuration and Calculations Item 5.1, p. 9
The assumed layout for underground shows that it is the only supply from the grid to the microgrid. The same scenario in the Reliability Study (p. 20) shows it as an additional supply path. Did you mean to show it this way or did you intend to leave the existing overhead supply in service and supplement it with the new, underground source?
3.33 Microgrid, p. 11
5.3. Microgrid There are three cases for different microgrid configurations: Case 1: The power capacity of the microgrid is higher than the local load. Thus, the revenue from sending power back to the grid needs to be considered. (Town A, Town B, Town F and Town H)
Why was it assumed that a microturbine would be installed at a size so large there would be export? Is this so, even assuming the power loads at the facilities are always at their peak?
Is this considered realistic by all of the authors and team members?
What are the circumstances in each of the four Towns that lead to such microturbine sizing?
Can the authors consider adding significantly more information describing the town’s facilities, including the sizes of the load for each, the distance of each from the substation and from each other, the location of the DG considered, and the facility that would host the DG? [Recognizing it would help to include in either the CL&P Selected Hardening Options or some or all of the reports.
3.34 Microgrid Case 2, p. 12
Case 2: The power capacity of the microgrid is less than the local load. Thus, the electricity bills from the grid need to be considered. (Town D and Town G)
If the microgrid served some of the customer load some of the time, was the reduction in electric bills considered?
3.35 Town A, p. 16
Town A: For the first time descriptions of Town A provide enough detail to ascertain that the “DG” is actually on the 23 kW line and it is not clear whether it is located on a customer site. Is that the case?
Who is considered the owner of the DG in this example? And other examples (towns)?
3.36 Town A, p. 16 Town A: The reviewer assumes the figure for the police should be 100 kW rather than 100 W.
3.37 Town E, p. 32 Town E: Why was a low voltage fuel cell considered, but a MT listed, but then not estimated?
RESPONSE See Appendix B - CL&P Response #3 3.38 Town H, p. 44 Town H: Why 22X200 kW? Why not several large MT’s at the hospital?
3.39 Summary Table, p. 48
In the summary table under Summary and Conclusion, should not Town G have the HM rated as #1 instead of the EG??
Also, on the same page, immediately under the summary table, it lists the HF option and being both “competitive” and also as “less attractive”. While this reviewer supposes that this summation might be correct, is what was actually meant?
3.40 Summary and Conclusions, pp. 48-50
The summary and conclusions seem a little thin on narrative. Would the authors consider adding more?
Regarding the Monte-Carlo assumptions for establishing reliability, how was the idea of fuel shortages included in the impact on emergency generation?
What assumptions were applied regarding the capacity of gallons of diesel storage for each Town relative to assumed run-hours for the emergency generation?
RESPONSE See Appendix B - CL&P Response #11
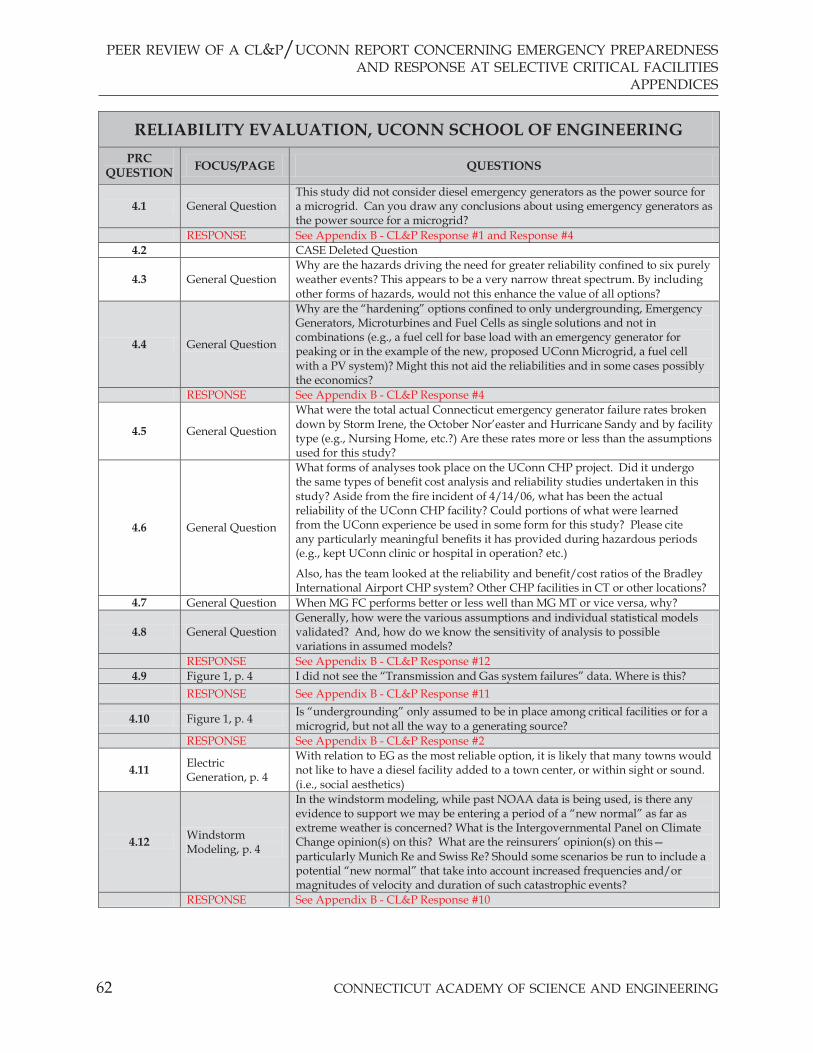
connecticut academy of science and engineering62
peer review of a cl&p/uconn report concerning emergency preparedness and response at selective critical facilities
appendices
RELIABILITY EVALUATION, UCONN SCHOOL OF ENGINEERING PRC
QUESTION FOCUS/PAGE QUESTIONS
4.1 General Question This study did not consider diesel emergency generators as the power source for a microgrid. Can you draw any conclusions about using emergency generators as the power source for a microgrid?
RESPONSE See Appendix B - CL&P Response #1 and Response #4 4.2 CASE Deleted Question
4.3 General Question Why are the hazards driving the need for greater reliability confined to six purely weather events? This appears to be a very narrow threat spectrum. By including other forms of hazards, would not this enhance the value of all options?
4.4 General Question
Why are the “hardening” options confined to only undergrounding, Emergency Generators, Microturbines and Fuel Cells as single solutions and not in combinations (e.g., a fuel cell for base load with an emergency generator for peaking or in the example of the new, proposed UConn Microgrid, a fuel cell with a PV system)? Might this not aid the reliabilities and in some cases possibly the economics?
RESPONSE See Appendix B - CL&P Response #4
4.5 General Question
What were the total actual Connecticut emergency generator failure rates broken down by Storm Irene, the October Nor’easter and Hurricane Sandy and by facility type (e.g., Nursing Home, etc.?) Are these rates more or less than the assumptions used for this study?
4.6 General Question
What forms of analyses took place on the UConn CHP project. Did it undergo the same types of benefit cost analysis and reliability studies undertaken in this study? Aside from the fire incident of 4/14/06, what has been the actual reliability of the UConn CHP facility? Could portions of what were learned from the UConn experience be used in some form for this study? Please cite any particularly meaningful benefits it has provided during hazardous periods (e.g., kept UConn clinic or hospital in operation? etc.)
Also, has the team looked at the reliability and benefit/cost ratios of the Bradley International Airport CHP system? Other CHP facilities in CT or other locations?
4.7 General Question When MG FC performs better or less well than MG MT or vice versa, why?
4.8 General Question Generally, how were the various assumptions and individual statistical models validated? And, how do we know the sensitivity of analysis to possible variations in assumed models?
RESPONSE See Appendix B - CL&P Response #12 4.9 Figure 1, p. 4 I did not see the “Transmission and Gas system failures” data. Where is this?
RESPONSE See Appendix B - CL&P Response #11
4.10 Figure 1, p. 4 Is “undergrounding” only assumed to be in place among critical facilities or for a microgrid, but not all the way to a generating source?
RESPONSE See Appendix B - CL&P Response #2
4.11 Electric Generation, p. 4
With relation to EG as the most reliable option, it is likely that many towns would not like to have a diesel facility added to a town center, or within sight or sound. (i.e., social aesthetics)
4.12 Windstorm Modeling, p. 4
In the windstorm modeling, while past NOAA data is being used, is there any evidence to support we may be entering a period of a “new normal” as far as extreme weather is concerned? What is the Intergovernmental Panel on Climate Change opinion(s) on this? What are the reinsurers’ opinion(s) on this—particularly Munich Re and Swiss Re? Should some scenarios be run to include a potential “new normal” that take into account increased frequencies and/or magnitudes of velocity and duration of such catastrophic events?
RESPONSE See Appendix B - CL&P Response #10

peer review of a cl&p/uconn report concerning emergency preparedness and response at selective critical facilitiesappendices
connecticut academy of science and engineering 63
4.13 Sec. 2.1, p. 5
Weather-dependent failure rate model is a suspect. The force varies with square of wind speed. The failure would depend upon force vs strength of the cable/tree (which has its own probability distribution). Winds beyond a certain speed would kill 100%, and winds below a certain speed would kill nothing. It is more of a zero-something-100% model. However, I suspect that final answer will not change the conclusion, given significant separation disparity amongst options.
4.14 Table 1 and 2, p. 7
Can you describe Weather Category “Normal”? Where did the authors get the failure rates for the various options under Normal Weather Category conditions? What repairs were assumed to estimate repair times? Were the failure rates for the microgrids in the other weather categories assuming anticipated failure rates while operating in islanded mode? How were those rates estimated? What previous data was utilized for such estimates?
RESPONSE See Appendix B - CL&P Response #10
4.15 Table 1, p. 7 Does Table 1 indicate that major storm failure rates are higher than tropical storm or categorical storms? If so, do we understand why? Is there a preparation differential we need to consider?
4.16 2) Overview, p. 8
Annual outage time I am glad that we looked at 3 load-point indices. 24 outages of 1 hour does not equal to 1 outage of 24 hours. The true indicator of reliability is probably a composite that Monte Carlo should bring out, once defined. I do not know what that is as of yet.
4.17 Outage Duration, p. 9
For instance, a microgrid option could rank better than emergency generator in terms of annual outage time, but may rank lower in terms [sic] outage duration. Decision makers will need to dig into different aspects of reliability indices to make an optimized and proper decision.
Specifically what town example is being referred to (please provide Town and page #)?
On the other hand, microgrids could be more competitive and economically advantageous than emergency generators on a larger system level where multiple microgrids may be used to serve larger communities and more population.
Is there anything evidenced in the evaluation that demonstrates the higher value from perhaps considering microturbines in a CHP mode for larger customers (rather than only large number of users). Such as hospitals and/or schools?
Would the consideration of CHP serving thermal loads year round have led to demonstrating greater economic value?
4.18 Outage Duration, p. 9
“Reliability indices….reflect only the performance of a specific option at a specific critical facility. It may be inappropriate to generalize the conclusions for a critical facility to the whole distribution grid level.”
Please explain and consider: • If, as may be presumed, several critical facilities together constitute a town
center, how does this qualification affect the validity of summary findings re subsequent costs/benefits?
• Are there still general “truths”/lessons to take away as generally applicable? • must analyses be repeated for each and every hardening decision?
4.19 Item 3, p. 10
The emergency generator option has the minimum expected outage duration among the four options under all weather conditions. As illustrated by Fig. 6 in the appendix, when a fault occurs in the existing overhead system, an emergency generator can start to operate quickly (the switching time is 0.1 hour in this study). This is the reason why the emergency generator option implies a short outage duration.
If the microgrid with microturbines operating fulltime were configured to island and ride-through an event without interrupting power supply, would the outage durations have been different for that option?
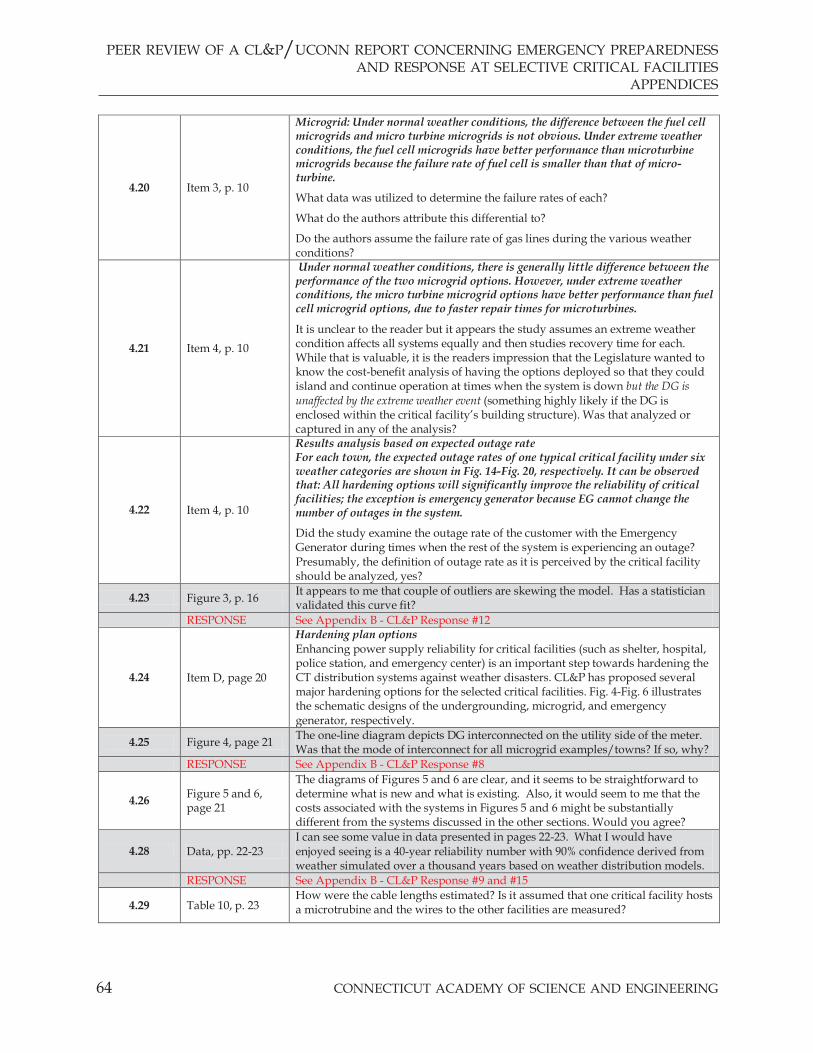
connecticut academy of science and engineering64
peer review of a cl&p/uconn report concerning emergency preparedness and response at selective critical facilities
appendices
4.20 Item 3, p. 10
Microgrid: Under normal weather conditions, the difference between the fuel cell microgrids and micro turbine microgrids is not obvious. Under extreme weather conditions, the fuel cell microgrids have better performance than microturbine microgrids because the failure rate of fuel cell is smaller than that of micro- turbine.
What data was utilized to determine the failure rates of each?
What do the authors attribute this differential to?
Do the authors assume the failure rate of gas lines during the various weather conditions?
4.21 Item 4, p. 10
Under normal weather conditions, there is generally little difference between the performance of the two microgrid options. However, under extreme weather conditions, the micro turbine microgrid options have better performance than fuel cell microgrid options, due to faster repair times for microturbines.
It is unclear to the reader but it appears the study assumes an extreme weather condition affects all systems equally and then studies recovery time for each. While that is valuable, it is the readers impression that the Legislature wanted to know the cost-benefit analysis of having the options deployed so that they could island and continue operation at times when the system is down but the DG is unaffected by the extreme weather event (something highly likely if the DG is enclosed within the critical facility’s building structure). Was that analyzed or captured in any of the analysis?
4.22 Item 4, p. 10
Results analysis based on expected outage rate For each town, the expected outage rates of one typical critical facility under six weather categories are shown in Fig. 14-Fig. 20, respectively. It can be observed that: All hardening options will significantly improve the reliability of critical facilities; the exception is emergency generator because EG cannot change the number of outages in the system.
Did the study examine the outage rate of the customer with the Emergency Generator during times when the rest of the system is experiencing an outage? Presumably, the definition of outage rate as it is perceived by the critical facility should be analyzed, yes?
4.23 Figure 3, p. 16 It appears to me that couple of outliers are skewing the model. Has a statistician validated this curve fit?
RESPONSE See Appendix B - CL&P Response #12
4.24 Item D, page 20
Hardening plan options Enhancing power supply reliability for critical facilities (such as shelter, hospital, police station, and emergency center) is an important step towards hardening the CT distribution systems against weather disasters. CL&P has proposed several major hardening options for the selected critical facilities. Fig. 4-Fig. 6 illustrates the schematic designs of the undergrounding, microgrid, and emergency generator, respectively.
4.25 Figure 4, page 21 The one-line diagram depicts DG interconnected on the utility side of the meter. Was that the mode of interconnect for all microgrid examples/towns? If so, why?
RESPONSE See Appendix B - CL&P Response #8
4.26 Figure 5 and 6, page 21
The diagrams of Figures 5 and 6 are clear, and it seems to be straightforward to determine what is new and what is existing. Also, it would seem to me that the costs associated with the systems in Figures 5 and 6 might be substantially different from the systems discussed in the other sections. Would you agree?
4.28 Data, pp. 22-23 I can see some value in data presented in pages 22-23. What I would have enjoyed seeing is a 40-year reliability number with 90% confidence derived from weather simulated over a thousand years based on weather distribution models.
RESPONSE See Appendix B - CL&P Response #9 and #15
4.29 Table 10, p. 23 How were the cable lengths estimated? Is it assumed that one critical facility hosts a microtrubine and the wires to the other facilities are measured?
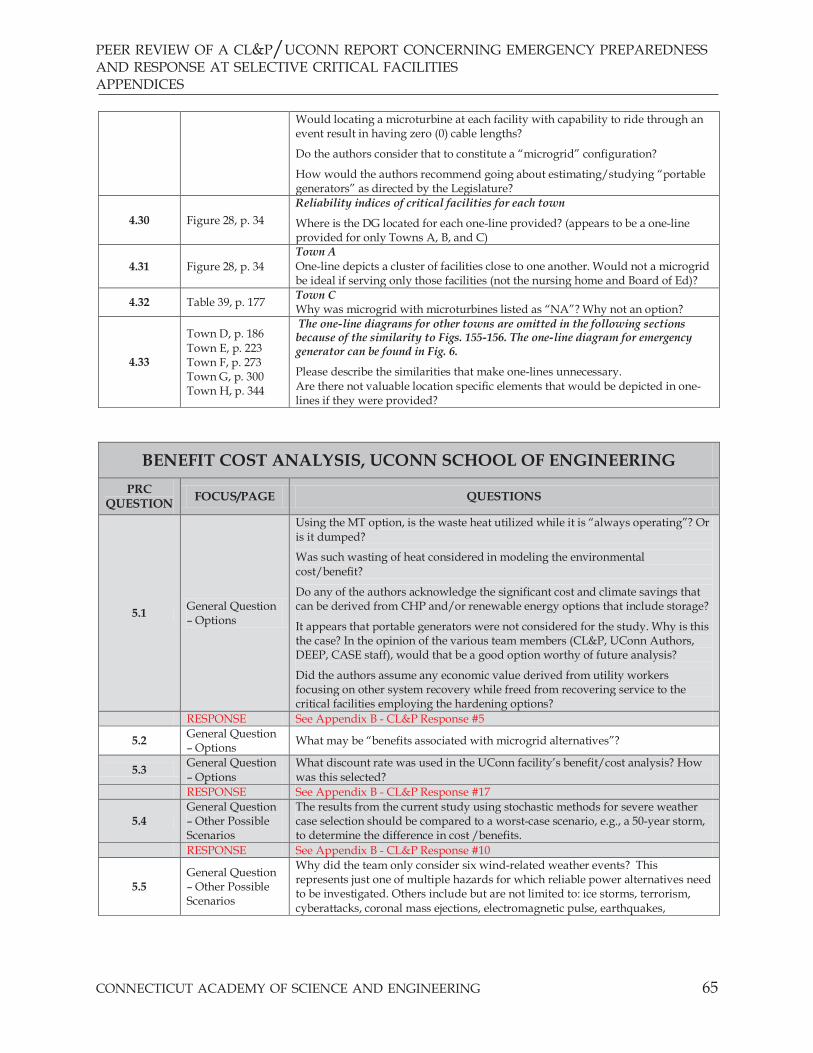
peer review of a cl&p/uconn report concerning emergency preparedness and response at selective critical facilitiesappendices
connecticut academy of science and engineering 65
Would locating a microturbine at each facility with capability to ride through an event result in having zero (0) cable lengths?
Do the authors consider that to constitute a “microgrid” configuration?
How would the authors recommend going about estimating/studying “portable generators” as directed by the Legislature?
4.30 Figure 28, p. 34 Reliability indices of critical facilities for each town
Where is the DG located for each one-line provided? (appears to be a one-line provided for only Towns A, B, and C)
4.31 Figure 28, p. 34 Town A One-line depicts a cluster of facilities close to one another. Would not a microgrid be ideal if serving only those facilities (not the nursing home and Board of Ed)?
4.32 Table 39, p. 177 Town C Why was microgrid with microturbines listed as “NA”? Why not an option?
4.33
Town D, p. 186 Town E, p. 223 Town F, p. 273 Town G, p. 300 Town H, p. 344
The one-line diagrams for other towns are omitted in the following sections because of the similarity to Figs. 155-156. The one-line diagram for emergency generator can be found in Fig. 6.
Please describe the similarities that make one-lines unnecessary. Are there not valuable location specific elements that would be depicted in one-lines if they were provided?
BENEFIT COST ANALYSIS, UCONN SCHOOL OF ENGINEERING PRC
QUESTION FOCUS/PAGE QUESTIONS
5.1 General Question – Options
Using the MT option, is the waste heat utilized while it is “always operating”? Or is it dumped?
Was such wasting of heat considered in modeling the environmental cost/benefit?
Do any of the authors acknowledge the significant cost and climate savings that can be derived from CHP and/or renewable energy options that include storage?
It appears that portable generators were not considered for the study. Why is this the case? In the opinion of the various team members (CL&P, UConn Authors, DEEP, CASE staff), would that be a good option worthy of future analysis?
Did the authors assume any economic value derived from utility workers focusing on other system recovery while freed from recovering service to the critical facilities employing the hardening options?
RESPONSE See Appendix B - CL&P Response #5
5.2 General Question – Options What may be “benefits associated with microgrid alternatives”?
5.3 General Question – Options
What discount rate was used in the UConn facility’s benefit/cost analysis? How was this selected?
RESPONSE See Appendix B - CL&P Response #17
5.4 General Question – Other Possible Scenarios
The results from the current study using stochastic methods for severe weather case selection should be compared to a worst-case scenario, e.g., a 50-year storm, to determine the difference in cost /benefits.
RESPONSE See Appendix B - CL&P Response #10
5.5 General Question – Other Possible Scenarios
Why did the team only consider six wind-related weather events? This represents just one of multiple hazards for which reliable power alternatives need to be investigated. Others include but are not limited to: ice storms, terrorism, cyberattacks, coronal mass ejections, electromagnetic pulse, earthquakes,

connecticut academy of science and engineering66
peer review of a cl&p/uconn report concerning emergency preparedness and response at selective critical facilities
appendices
droughts, forest fires and combinations of the aforementioned. While some are classified as low frequency/high impact events, they also have the ability to add value by producing power in instances when it may be most required.
5.6 General Question – Other Possible Scenarios
How were the frequencies of the six types of weather events determined? If one were to run a retrospective analysis of the frequency of the two storms in 2011 and Hurricane/Storm Sandy in 2012, would these conform to these frequency figures supplied?
RESPONSE See Appendix B - CL&P Response #10
5.7 General Question – Other Possible Scenarios
Also on frequencies, is there any evidence to support we may be entering a period of a “new normal” as far as extreme weather is concerned. What is the IPCC opinion(s) on this? What are the reinsurers opinion(s) on this—particularly Munich Re and Swiss Re? Should some scenarios be run to include a potential “new normal” that take into account increased frequencies of such catastrophic events?
RESPONSE See Appendix B - CL&P Response #10
5.8 General Question – Other Possible Scenarios
I wish the simulation were tied right into the reliability analysis so the cost benefits estimation could be for the same weather distribution as reliability analysis for a 40-year span. A confidence bound would have been good as well. Should this be considered?
RESPONSE See Appendix B - CL&P Response #9
5.9 General Question – Other Scenarios
• In the UConn School of Business study, the critical facilities are considered for (a) their regular function and (b) as shelters. Has the comparative cost study included the cost of converting these facilities into shelters, and has it considered environmental and health issues associated with such usage?
• The School of Business study uses a basis of cost/benefit similar to “catastrophic Insurance Modeling.” Please clarify how such a basis could apply to “critical” public facilities?
5.10 Executive Summary, p. 5
Overall, the emergency-generator alternative dominates the other options. Specifically, it tends to be less costly while providing comparable benefits. However, the additional costs from diesel fuel instability and storage are not considered. Also, there may be benefits associated with the microgrid alternatives that are not included. Thus, this study’s results are only preliminary.
What assumptions were applied regarding the capacity of gallons of diesel storage for each Town relative to run-hours for the emergency generation?
Were emissions from diesel considered as a component in estimating the environmental benefit?
What value was placed on greenhouse gas (GHG) reductions ($/ton of GHG equivalent)?
RESPONSE See Appendix B - CL&P Response #18
5.11 Executive Summary, p. 5, Bottom of page
Why only diesel? Was natural gas assumed also?
RESPONSE See Appendix B - CL&P Response #6
5.12 Executive Summary, p. 6
I am confused about the details of the wiring, what is new and what is not, and the details of the new hardware. Perhaps simple diagrams would help.
5.13 Executive Summary, p. 8
Is there a way to incorporate non-weather related reliability benefits, i.e., other disruptions, and would it be informative/make a difference?
5.14 Reliability Benefits, p. 10
Is it presumed that microgrid electricity will cost less than from ISO NE? I believe it could cost more, dependent on fuel price. Please comment.
5.15 Environmental Benefits, p. 12
CO2 emission per kWh = For generators, 0.000785 tons/kWh For microgrid (fuel cell), 1,050 lbs/MWh For microgrid microturbines, 777 g/MWh,
Microgrid should be 777kg/MWH

peer review of a cl&p/uconn report concerning emergency preparedness and response at selective critical facilitiesappendices
connecticut academy of science and engineering 67
Consistent units Generators – 1570 lb/MW/h Fuel Cells - 1050 lb/MWh Microturbines – 1709 lb/MWh
NOTE: the microturbine emissions are high. Should be in the 1375-1400 lb/MWh. Please comment
RESPONSE See Appendix B - CL&P Response #18
5.16
Capital Cost, O and M, Energy Cost and Replacement, p. 15
The p/mile O&M cost for undergrounding is used. Does this mean the existing overhead system is assumed to remain in service for all the scenarios?
5.17 Table and Discussion, p. 28
Consider putting a summary of these cost benefit conclusions in the Executive Summary. Do not bury them in the report. Would you agree?
5.18 pp. 28, 48, 68, 84, 104, 124, 144, 164
About 98% of the reliability benefits are generated by avoiding the longest outage duration events (2-5 weeks) which only occur once every 10-60 years.
Thus, avoiding these long but rare outages by using emergency generators is worth more to society than their costs.
Was it assumed that the emergency generators would have an unlimited supply of stored fuel for such a conclusion to be valid?
What was the anticipated reliability of natural gas service for the microgrid equipment (FC or MT) during each of the event types?
Would DG installed in or near the building load and configured to island and operate continuously in all weather conditions be considered more valuable than the DG that might be less reliable because it is located at the end of many feet or miles of exposed wires?
RESPONSE See Appendix B - CL&P Response #11
5.19
Town A, p. 18 Town B, p. 48 Town C, p. 68 Town D, p. 84 Town E, p. 104 Town F, p. 124 Town G, p. 144 Town H, p. 164
Towns A thru D, G & H “xx% of the reliability benefits are generated by avoiding the longest outage duration events (2 – 5 weeks) which only occur once every 10 – 60 years”; Towns E &F frequency “15 – 40 years”.
Is this a typo or other differentiation? In either case, what happens to the CBA ratios if outage events occur more frequently?
ADDITIONAL PRC QUESTIONS – POST 11 15 13 BRIEFING
PRC QUESTION
FOCUS/ PAGE
QUESTIONS
6.1 Please provide a list of the criteria/assumptions applied to the CL&P/UConn reports, which the committee suggests should be included in the report.
6.1.1 Who was involved in the development of the study’s scope of work, i.e. was the scope of work developed in collaboration/ discussions with DEEP and CL&P? CL&P and UConn? DEEP, CL&P and UConn? Other?
ACTION See CL&P Analysis of Selective Hardening Options: Introduction and Executive Summary to Analysis Reports (December 11, 2013)
6.1.2 What process was used to select the three hardening options that were analyzed in the reports?
ACTION See CL&P Analysis of Selective Hardening Options: Introduction and Executive Summary to Analysis Reports (December 11, 2013)

connecticut academy of science and engineering68
peer review of a cl&p/uconn report concerning emergency preparedness and response at selective critical facilities
appendices
6.1.3
Microgrids, as defined by Public Act 12-148, §7: • Microgrid: Means a group of interconnected loads and distributed energy
resources within clearly defined electrical boundaries that acts as a single controllable entity with respect to the grid and that connects and disconnects from such grid to enable it to operate in both grid-connected or Island Mode.
Microgrids to be considered for the Connecticut Department of Energy and Environmental Protection’s Microgrid Grant and Loan Pilot Program are further required to: • Be local distributed energy generation for critical facilities during times of
larger electricity grid outages • Be able to continuously operate for a minimum of four weeks with combined
generation resources. o and should include access to uninterruptible fuel resources either on site
or delivered for a minimum of two weeks, with a plan to secure additional fuel resources beyond two weeks as part of storm preparation and management.
• Have minimum generation capacity of no less than 120% of critical facility load.
• Operation of the microgrid must not be degraded by loss of communications with EDC/MEU Supervisory Control and Data Acquisition (SCADA). Microgrid control equipment must use industry-standard protocols to ensure interoperability with EDC/MEU SCADA. Microgrid must be able to be operated in local and EDC/MEU control mode.
Is your definition of microgrid used for this study the same as described above? If not, would you define microgrid as used in this report? Please explain why 40-years rather than 5-years, or some other time frame, was used for the life cycle analysis?
RESPONSE See Appendix B - CL&P Response #16
6.2 Who would own, operate and maintain the hardening options for towns that are being proposed?
6.3
It would be most helpful and useful for the report to include an executive summary that provides a synthesis/overview of the results, conclusions and recommendations of all of the reports included in the study. If so, then provide a copy of the executive summary for CASE Peer Review Committee review.
ACTION
See CL&P added an Executive Summary to its original “Analysis of Selective Hardening Options: Introduction to Project Reports (May 31, 2013; Revised as Analysis of Selective Hardening Options: Introduction and Executive Summary to Analysis Reports (December 11, 2013)
6.4
Microgrids, as defined by Public Act 12-148, §7: • Microgrid: Means a group of interconnected loads and distributed energy
resources within clearly defined electrical boundaries that acts as a single controllable entity with respect to the grid and that connects and disconnects from such grid to enable it to operate in both grid-connected or Island Mode.
Microgrids to be considered for the Connecticut Department of Energy and Environmental Protection’s Microgrid Grant and Loan Pilot Program are further required to: • Be local distributed energy generation for critical facilities during times of
larger electricity grid outages • Be able to continuously operate for a minimum of four weeks with combined
generation resources. o and should include access to uninterruptible fuel resources either on site
or delivered for a minimum of two weeks, with a plan to secure additional fuel resources beyond two weeks as part of storm preparation and management.
• Have minimum generation capacity of no less than 120% of critical facility load.
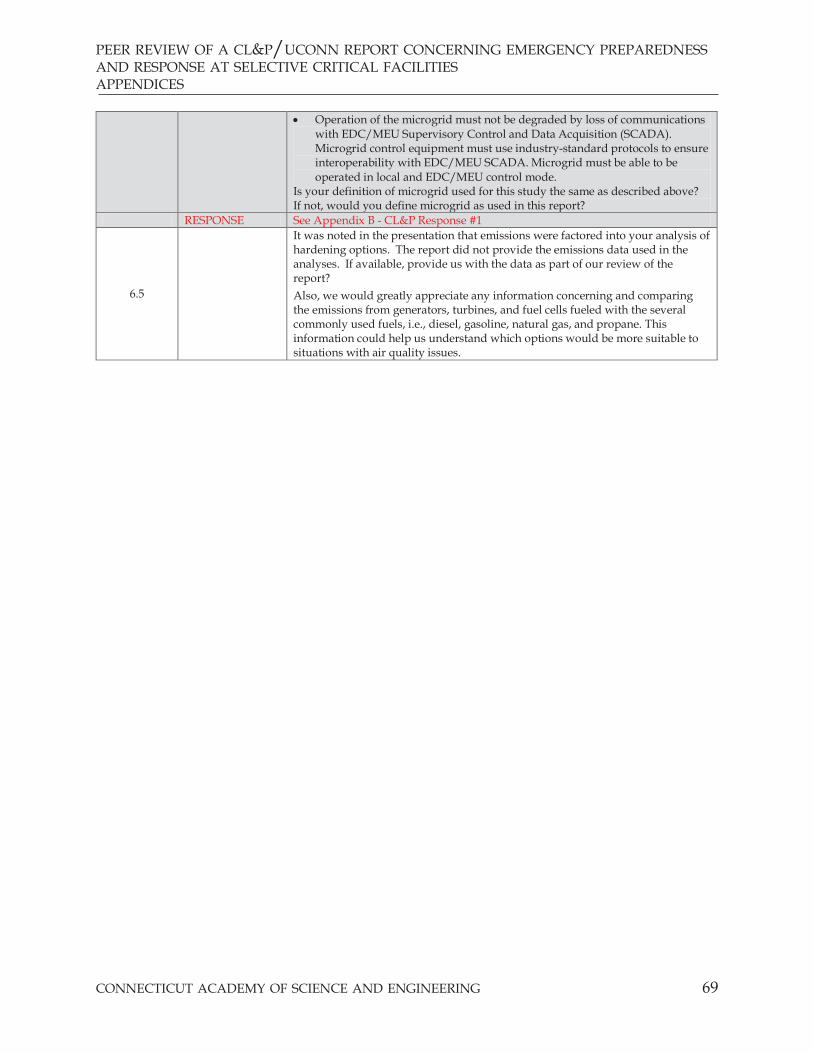
peer review of a cl&p/uconn report concerning emergency preparedness and response at selective critical facilitiesappendices
connecticut academy of science and engineering 69
• Operation of the microgrid must not be degraded by loss of communications with EDC/MEU Supervisory Control and Data Acquisition (SCADA). Microgrid control equipment must use industry-standard protocols to ensure interoperability with EDC/MEU SCADA. Microgrid must be able to be operated in local and EDC/MEU control mode.
Is your definition of microgrid used for this study the same as described above? If not, would you define microgrid as used in this report?
RESPONSE See Appendix B - CL&P Response #1
6.5
It was noted in the presentation that emissions were factored into your analysis of hardening options. The report did not provide the emissions data used in the analyses. If available, provide us with the data as part of our review of the report?
Also, we would greatly appreciate any information concerning and comparing the emissions from generators, turbines, and fuel cells fueled with the several commonly used fuels, i.e., diesel, gasoline, natural gas, and propane. This information could help us understand which options would be more suitable to situations with air quality issues.

connecticut academy of science and engineering70
peer review of a cl&p/uconn report concerning emergency preparedness and response at selective critical facilities
appendices
APPENDIX D
NAvIGANT RESEARCH
MICROGRIDS RESEARCH SERvICE
overview

peer review of a cl&p/uconn report concerning emergency preparedness and response at selective critical facilitiesappendices
connecticut academy of science and engineering 71
Research ReportsResearch Reports provide timely and actionable insights, covering specific technology as well as overall market conditions and trends. These in-depth reports, typically 50-100 pages in length, blend both qualitative and quantitative market analysis from Navigant Research’s industry experts to provide a comprehensive assessment of business models, market drivers and inhibitors, technology issues, policy and regulatory factors, the competitive landscape, and market sizing, segmentation, and forecasting.
Analyst InquirySubscribers to the Microgrids Research Service gain unlimited inquiry access to Navigant Research’s industry analysts. Analyst Inquiry may be utilized in one-hour blocks and is defined as ad hoc analyst commentary or analysis that provides clarification or interpretation based on existing research. Using Analyst Inquiry, clients may leverage analysts as a strategic sounding board for smart energy initiatives, or may call on the analysts for small information needs or market insights. Requests that require new research and analysis, as opposed to drawing from our body of existing research, may be quoted as a custom research project.
Topics Covered » Institutional/Campus Microgrids » Military Microgrids » Remote Off-Grid Microgrids » Microgrid Enabling Technologies » Microgrid Deployment Tracking » Virtual Power Plants
Microgrids Research Service
Navigant Research’s Microgrids Research Service concentrates on distributed sections of the electrical grid that can be safely islanded from the utility grid for purposes of adding resilience, redundancy, and security to the electrical distribution system. Our research focuses on various applications and deployment scenarios including institutional/campus microgrids, military microgrids, and remote off-grid microgrids. Enabling technologies and systems are covered in depth, along with detailed tracking of microgrid deployments and assessments of key industry players.
Service Components » Approximately 8 Microgrids research reports published per
year » Back catalog of all published Microgrids research reports » Microgrid Tracker, updated twice per year » Unlimited Analyst Inquiry access for special requests on
Microgrids topics » Input into Navigant Research’s prioritization and scheduling
of research projects

connecticut academy of science and engineering72
peer review of a cl&p/uconn report concerning emergency preparedness and response at selective critical facilities
appendices
Published Research ReportsClick on a report to go straight to its page at navigantresearch.com
©2013 Navigant Consulting, Inc. All rights reserved.Navigant Consulting is not a certified public accounting firm and does not provide audit, attest, or public accounting services, or legal or other professional advice.See navigant.com/licensing for a complete listing of private investigator licenses.
Contact UsFor more information on reports, annual subscriptions and other queries, contact Navigant Research.
Phone: +1.303.997.7609 Email: [email protected] Web: navigantresearch.com
Navigant Research 1320 Pearl Street, Suite 300 Boulder, CO 80302 USA
Future Reports*Topics subject to change
4Q13 Energy Storage for Microgrids4Q13 Microgrid Deployment Tracker 4Q134Q13 Microgrids
1Q14 Microgrid Enabling Technologies2Q14 Microgrid Deployment Tracker 2Q14
Remote Microgrids – 3Q13 Commodity Extraction, Physical Island, Village Electrification, and Remote Military Microgrids: Global Market Analysis and Forecasts
Direct Current Distribution Networks – 2Q13 Remote and Grid-Tied Systems for Data Center Microgrids, Telecom/Village Power, Commercial Buildings, and Military Applications: Global Market Analysis and Forecasts
Microgrid Deployment Tracker 2Q13 – 2Q13 Commercial/Industrial, Community/Utility, Institutional/Campus, Military, and Remote Microgrids: Operating, Planned, and Proposed Projects
Market Data: Microgrids – 1Q13 Forecasts for Commercial/Industrial, Community/Utility, Campus/Institutional, Military, and Remote Microgrids: 2013-2020
Virtual Power Plants – 1Q13 Demand Response, Supply-Side, Mixed Asset, and Wholesale Auction Smart Grid Aggregation and Optimization Networks
Smart Energy: Five Metatrends to Watch in 2013 and Beyond – 1Q13 White Paper
Military Microgrids – 4Q12 Stationary Base, Forward Operating Base, and Mobile Smart Grid Networks for Renewables Integration, Demand Response, and Mission-Critical Security
Microgrid Deployment Tracker – 4Q12 Campus, Military, Remote, Commercial/Industrial and Community/Utility Microgrid Segments: Project Tracking and Capacity Growth
Microgrid Enabling Technologies – 4Q12 Distributed Generation, Advanced Energy Storage, Smart Islanding Inverters, Automated Demand Response, Electric Vehicle Charging, and Microgrid Software Controls: Global Market Analysis and Forecasts
Utility Distribution Microgrids – 3Q12 Private, Public Power, and Remote Utility Networks for Renewable Energy Integration, Grid Reliability, and Load Reduction: Global Market Analysis and Forecasts
Microgrid Deployment Tracker – 2Q12 Institutional/Campus, Community/Utility, Commercial/ Industrial, Military, and Remote Systems: Active Microgrid Projects by World Region
Smart Grid: Ten Trends to Watch in 2012 and Beyond – 1Q11 White Paper
Microgrids – 1Q12 Distributed Energy Systems for Campus, Military, Remote, Community, and Commercial & Industrial Power Applications: Market Analysis and Forecasts
Remote Microgrids – 1Q12 Village Power Systems, Weak Grid Island Systems, Industrial Remote Mine Systems, and Mobile Military Microgrids: Market Analysis and Forecasts
Microgrids for Campus Environments – 3Q11 Distributed Power Systems for Commercial, Education, Government, Healthcare, Industrial, and Research Campuses: Market Analysis and Forecasts

peer review of a cl&p/uconn report concerning emergency preparedness and response at selective critical facilitiesappendices
connecticut academy of science and engineering 73

ConneCtiCut ACAdemy of SCienCe And engineering805 Brook Street, Building 4-CERC, Rocky Hill, CT 06067-3405
Phone: 860-571-7143 • e-mail: [email protected] web: www.ctcase.org
MajoR STudiES of THE aCadEMy
2013• AnalyzingtheEconomicImpactsofTransportation
Projects
• HealthImpactAssessmentsStudy
• ConnecticutDisparityStudy:Phase1
• ConnecticutStemCellResearchProgramAccomplishments
2012• StrategiesforEvaluatingtheEffectiveness
ofProgramsandResourcesforAssuringConnecticut’sSkilledWorkforceMeetstheNeedsofBusinessandIndustryTodayandintheFuture
• BenchmarkingConnecticut’sTransportationInfrastructureCapitalProgramwithOtherStates
• AlternativeMethodsforSafetyAnalysisandInterventionforContractingCommercialVehiclesandDriversinConnecticut
2011• AdvancesinNuclearPowerTechnology• GuidelinesfortheDevelopmentofaStrategicPlan
forAccessibilitytoandAdoptionofBroadbandServicesinConnecticut
2010• EnvironmentalMitigationAlternativesfor
TransportationProjectsinConecticut• TheDesign-BuildContractingMethodologyfor
TransportationProjects:AReviewofPracticeandEvaluationforConnecticutApplications
• PeerReviewofanEvaluationoftheHealthandEnvironmentalImpactsAssociatedwithSyntheticTurfPlayingFields
2009• AStudyoftheFeasibilityofUtilizingWaste
HeatfromCentralElectricPowerGeneratingStationsandPotentialApplications
• IndependentMonitorReport:ImplementationoftheUCHCStudyRecommendations
2008• PreparingforConnecticut’sEnergyFuture• ApplyingTransportationAsset
ManagementinConnecticut• AStudyofWeighandInspectionStation
Technologies
• ANeeds-BasedAnalysisoftheUniversityofConnecticutHealthCenterFacilitiesPlan
2007• AStudyoftheFeasibilityofUtilizingFuelCellsto
GeneratePowerfortheNewHavenRailLine• GuidelinesforDevelopingaStrategicPlanfor
Connecticut’sStemCellResearchProgram
2006• EnergyAlternativesandConservation• EvaluatingtheImpactofSupplementaryScience,
Technology,EngineeringandMathematicsEducationalPrograms
• AdvancedCommunicationsTechnologies• PreparingfortheHydrogenEconomy:
Transportation• ImprovingWinterHighwayMaintenance:Case
StudiesforConnecticut’sConsideration• InformationTechnologySystemsforUseinIncident
ManagementandWorkZones• AnEvaluationoftheGeotechnicalEngineeringand
LimitedEnvironmentalAssessmentoftheBeverlyHillsDevelopment,NewHaven,Connecticut
2005• AssessmentofaConnecticutTechnologySeed
CapitalFund/Program• DemonstrationandEvaluationofHybridDiesel-
ElectricTransitBuses• AnEvaluationofAsbestosExposuresinOccupied
Spaces

ConneCtiCut ACAdemy of SCienCe And engineering
The Connecticut Academy is a non-profit institution patterned after the National Academy of Sciences to identify and study issues and technological advancements that are or should be of concern to the state of Connecticut. It was founded in 1976 by Special Act of the Connecticut General Assembly.
ViSion
The Connecticut Academy will foster an environment in Connecticut where scientific and technological creativity can thrive and contribute to Connecticut becoming a leading place in the country to live, work and produce for all its citizens, who will continue to enjoy economic well- being and a high quality of life.
miSSion StAtement
The Connecticut Academy will provide expert guidance on science and technology to the people and to the State of Connecticut, and promote its application to human welfare and economic well-being.
goAlS
• Provide information and advice on science and technology to the government, industry and people of Connecticut.
• Initiate activities that foster science and engineering education of the highest quality, and promote interest in science and engineering on the part of the public, especially young people.
• Provide opportunities for both specialized and interdisciplinary discourse among its own members, members of the broader technical community, and the community at large.
ConneCtiCut ACAdemy of SCienCe And engineering805 Brook Street, Building 4-CERC, Rocky Hill, CT 06067-3405
Phone: 860-571-7143 • e-mail: [email protected] web: www.ctcase.org