sisa 2016 coutts talent - sports science institute of ... related to initial sport selection 2. ......
TRANSCRIPT
20/02/2016
1
ProfessorAaronCouttsPhDUniversityofTechnologySydney,Australia
FactorsAffectingTalentIdentification&AthleticDevelopmentinYouthSports
@aaronjcoutts
@tomlovell26
TomLovell
Overview
• Model for talent identification (TID) and development (TDE)
• Relative‐age effects in team sports
• Studies examining TID and TDE in lower level youth sport1. Factors related to initial sport selection2. Factors related to team selection (within age groups)3. Factors related to position in a team4. What influences technical / tactical performance in match play5. Factors influencing performance trajectories during youth
• Discuss how these may affect development
Older, Early Maturer
Younger, Late Maturer12 months
TalentIdentification
WORSTCASEOUTCOME!
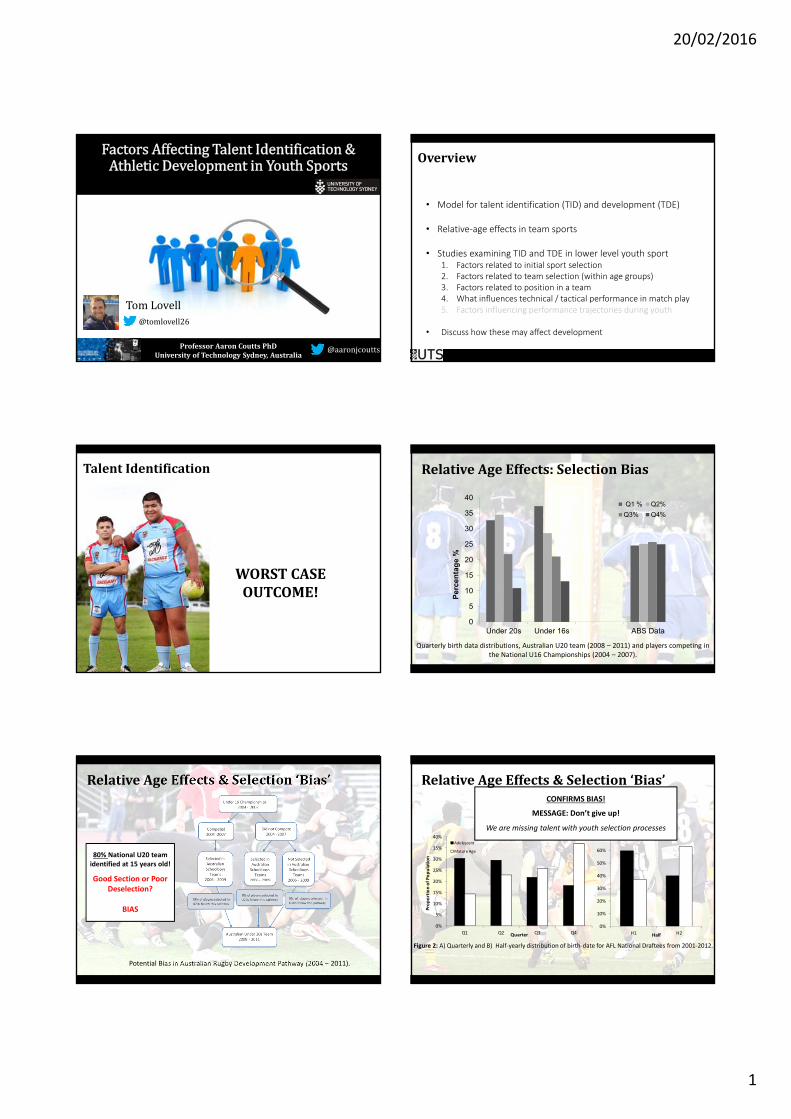
Quarterly birth data distributions, Australian U20 team (2008 – 2011) and players competing in the National U16 Championships (2004 – 2007).
0
5
10
15
20
25
30
35
40
Under 20s Under 16s ABS Data
Per
cen
tag
e %
Q1 % Q2%
Q3% Q4%
RelativeAgeEffects:SelectionBias
Potential Bias in Australian Rugby Development Pathway (2004 – 2011).
RelativeAgeEffects&Selection‘Bias’
80% National U20 team identified at 15 years old!
Good Section or Poor Deselection?
BIAS
Figure 2: A) Quarterly and B) Half‐yearly distribution of birth‐date for AFL National Draftees from 2001‐2012.
0%
5%
10%
15%
20%
25%
30%
35%
40%
Q1 Q2 Q3 Q4
Proportion of Po
pulation
Quarter
Adolescent
Mature Age
0%
10%
20%
30%
40%
50%
60%
70%
H1 H2Half
CONFIRMS BIAS!
MESSAGE: Don’t give up!
We are missing talent with youth selection processes
RelativeAgeEffects&Selection‘Bias’
20/02/2016
2
TalentIdentificationIssues
• Relatively older, more mature individuals are more frequently selected into elite youth team sports [Cobley et al. 2009]
• Physical characteristics differentiate young players between playing levels in youth team sports [Vaeyens et al. 2006, Till et al., 2014]
• Relative age effects appear strong mediators of selection bias ‐ this persists through the talent pathway
• Where & why does this bias start?
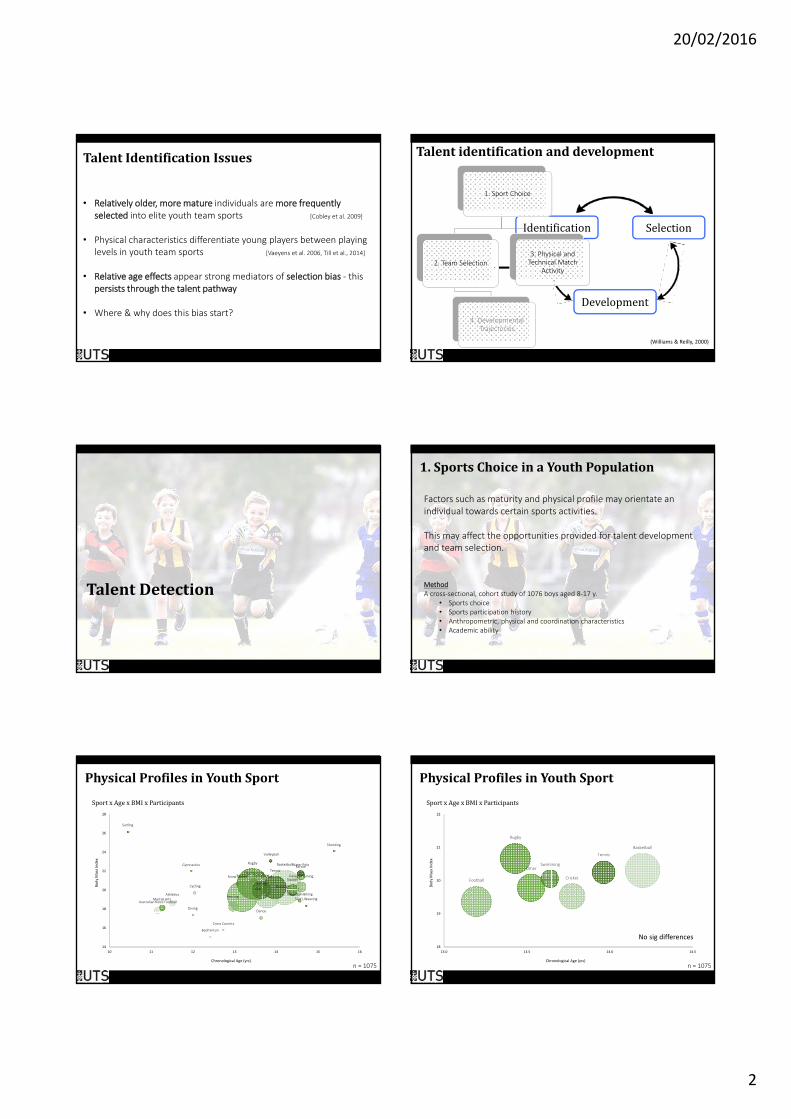
Talentidentificationanddevelopment
Identification Selection
Development
Detection
(Williams & Reilly, 2000)
1. Sport Choice
2. Team Selection
4. Developmental Trajectories
3. Physical and Technical Match
Activity
TalentDetection
1.SportsChoiceinaYouthPopulation
Factors such as maturity and physical profile may orientate an individual towards certain sports activities.
This may affect the opportunities provided for talent development and team selection.
MethodA cross‐sectional, cohort study of 1076 boys aged 8‐17 y.
• Sports choice• Sports participation history• Anthropometric, physical and coordination characteristics• Academic ability
Athletics
Australian Rules Football
Badminton
Baseball
Basketball
Cricket
Cross Country
Cycling
DanceDiving
Fencing
Fitness TrainingFootball
Golf
Gymnastics Karate
Martial Arts
Mountain Biking
Orienteering
Rugby
Sailing
Shooting
Snow SportsSquash
Surf Lifesaving
Surfing
Swimming
Tennis
Volleyball
Water Polo
14
16
18
20
22
24
26
28
10 11 12 13 14 15 16
Body Mass Index
Chronological Age (yrs)
SportxAgexBMIxParticipants
PhysicalProfilesinYouthSport
n = 1075
Basketball
CricketFootball
Other
Rugby
Swimming
Tennis
18
19
20
21
22
13.0 13.5 14.0 14.5
Body Mass Index
Chronological Age (yrs)
SportxAgexBMIxParticipants
PhysicalProfilesinYouthSport
n = 1075
No sig differences
20/02/2016
3
Basketball
Cricket
Football
Other Rugby
Swimming
Tennis
156
158
160
162
164
166
168
170
172
48 50 52 54 56 58 60
Heigh
t (cm)
Body Mass (kg)
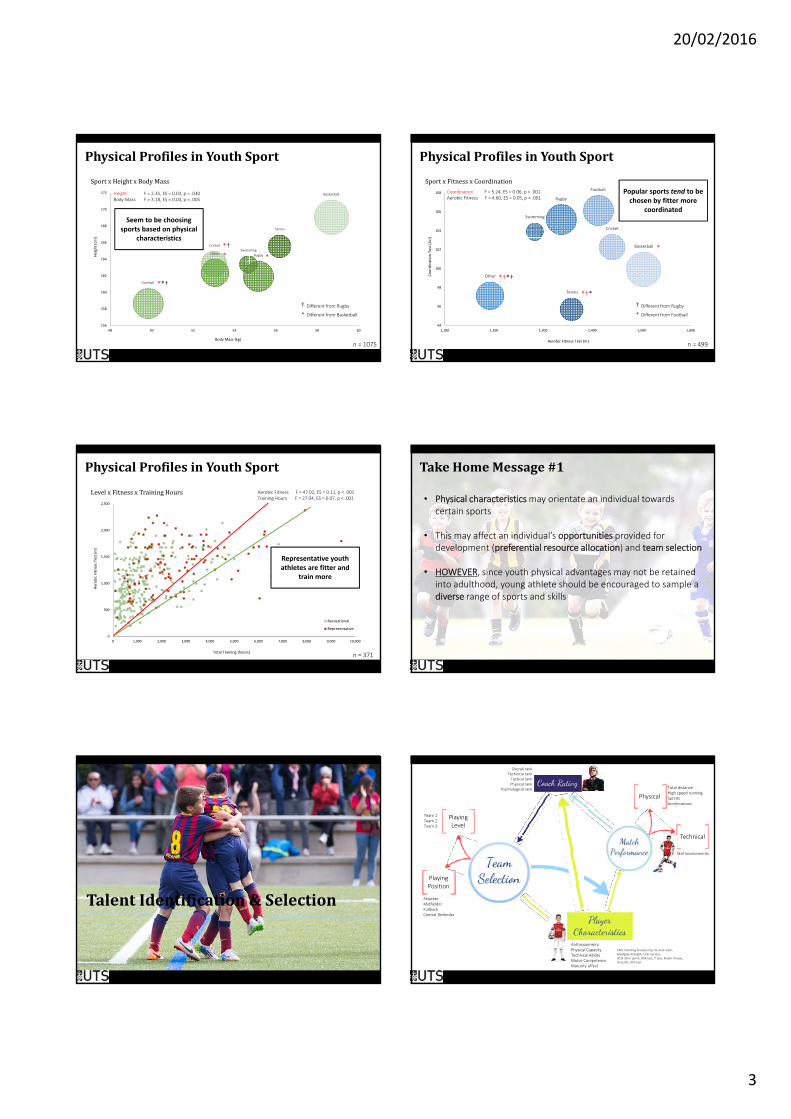
SportxHeightxBodyMass
PhysicalProfilesinYouthSport
n = 1075
Height F = 2.35, ES = 0.03, p = .030Body Mass F = 3.18, ES = 0.04, p = .005
**†
*†
* *
† Different from Rugby
* Different from Basketball
Seem to be choosing sports based on physical
characteristicsBasketball
Cricket
Football
Other
Rugby
Swimming
Tennis
94
96
98
100
102
104
106
108
1,100 1,200 1,300 1,400 1,500 1,600
Coordination Test (AU)
Aerobic Fitness Test (m)
SportxFitnessxCoordination
PhysicalProfilesinYouthSport
n = 499
Coordination F = 5.24, ES = 0.06, p < .001Aerobic Fitness F = 4.60, ES = 0.05, p < .001
*†*†
*†*
† Different from Rugby
* Different from Football
*
Popular sports tend to be chosen by fitter more
coordinated
0
500
1,000
1,500
2,000
2,500
0 1,000 2,000 3,000 4,000 5,000 6,000 7,000 8,000 9,000 10,000
Aerobic Fitness Test (m)
Total Training (hours)
LevelxFitnessxTrainingHours
Recreational
Representative
PhysicalProfilesinYouthSport
Aerobic Fitness F = 47.02, ES = 0.11, p < .001Training Hours F = 27.04, ES = 0.07, p < .001
n = 371
Representative youth athletes are fitter and
train more
TakeHomeMessage#1
• Physical characteristics may orientate an individual towards certain sports
• This may affect an individual’s opportunities provided for development (preferential resource allocation) and team selection
• HOWEVER, since youth physical advantages may not be retained into adulthood, young athlete should be encouraged to sample a diverse range of sports and skills
TalentIdentification&Selection
PlayingPosition
PlayingLevel
Anthropometry Physical CapacityTechnical AbilityMotor Competence Maturity offset
Physical
Technical
Total distanceHigh speed runningSprintsAccelerations
Skill Involvements
AttackerMidfielderFullbackCentral Defender
Team 1Team 2Team 3
Overall rankTechnical rankTactical rankPhysical rank
Psychological rank
CMJ, Standing broad jump, Sit‐and‐reach, Handgrip strength, Chin‐up test, 20 & 30‐m sprint, RSA test, T‐test, Power throws, YoYo IR1, KTK test

20/02/2016
4
2.TeamSelectioninaSchoolProgram
When identifying talent for team selection, relative age, maturity and physical characteristics may all influence a coach’s perception of performance and “potential”.
While this has been shown at an elite level, it is likely this phenomenon originates as the grassroots level.
MethodA cross‐sectional, cohort study of 180 soccer players aged 10‐18 y.
• Playing level and playing position selection• Anthropometric, physical and coordination characteristics• Coach rating of player ability
PlayingPosition
PlayingLevel
AnthropometryPhysical CapacityTechnical AbilityMotor Competence
Physical
Technical
Total distanceHigh speed runningSprintsAccelerations
Skill Involvements
AttackerMidfielderFullbackCentral Defender
Team 1Team 2Team 3
Overall rankTechnical rankTactical rankPhysical rank
Psychological rank
FactorsaffectingteamselectionPhysical‐ &coordination‐relatedfactors
‐1.0
‐0.5
0.0
0.5
1.0
Maturity Offset
Height
Body Mass
Sit and Reach
Vertical Jump
30 m Sprint
T‐Test
YoYo IR1
Dribble Test
KTK
Team 1
Team 2
Team 3
Difference between playing levels
*
*
**
**
**
‐1.0
‐0.5
0.0
0.5
1.0
Maturity Offset
Height
Body Mass
Sit and Reach
Vertical Jump
30 m Sprint
T‐Test
YoYo IR1
Dribble Test
KTK
Attackers
Midfielders
Fullbacks
Central Defenders
FactorsaffectingpositionselectionPhysical‐ &coordination‐relatedfactors
Difference between playing positions
*
*
*
**
Playing Position ANOVA
Attackers Midfielders Fullbacks Central Defenders Effect size F p
Team 1 n = 25 n = 16 n = 16 n = 18
Overall Rank 5.0 ±3.2 3.2 ±2.8 7.0 ±3.7 4.8 ±2.5 0.15 4.296 0.008 *
Tactical Rank 4.8 ±3.8 2.9 ±2.5 7.3 ±3.3 4.8 ±2.6 0.19 5.486 0.002 *
Technical Rank 5.4 ±3.5 2.9 ±2.2 6.8 ±3.4 5.6 ±2.7 0.17 4.875 0.004 *
Physical Rank 5.0 ±3.2 4.3 ±3.7 6.8 ±2.7 3.7 ±2.5 0.11 2.897 0.041 *
Psychological Rank 5.5 ±3.2 3.4 ±3.0 5.3 ±3.1 3.7 ±2.4 0.09 2.310 0.084
Team 2 & 3 n = 44 n = 43 n = 26 n = 26
Overall Rank 4.9 ±3.6 5.6 ±3.6 5.5 ±4.7 5.9 ±3.9 0.01 0.380 0.767
Tactical Rank 5.2 ±3.5 4.6 ±3.6 6.0 ±4.7 5.7 ±4.1 0.02 0.756 0.521
Technical Rank 5.3 ±3.2 4.7 ±3.7 5.1 ±3.3 6.2 ±4.1 0.02 1.008 0.391
Physical Rank 4.7 ±3.6 6.2 ±3.9 6.0 ±3.3 5.1 ±4.3 0.03 1.381 0.251
Psychological Rank 5.9 ±4.2 5.4 ±4.3 5.2 ±4.9 4.7 ±4.4 0.01 0.434 0.729
Data are means ± standard deviations; * = p < .05; ** = p < .001
Selected; Team 1 players, Non‐Selected; Team 2/3 players, Rank; subjective coach rating expressed as within‐team rank
FactorsaffectingpositionselectionCoachRatingsinTeam1players
Difference between playing positions
%Predicted
%Improve
%
Team 1 36.5 72.4 35.9
Team 2 37.1 50.8 13.7
Team 3 26.4 73.8 47.4
Total 33.3 64.8 31.5
FactorsaffectingteamselectionPhysical‐ &coordination‐relatedfactors
Discriminating between playing levels
• Technical ability• Aerobic Fitness• Sprint Speed• Coordination• Agility

20/02/2016
5
TakeHomeMessage#2
• Physical skills, technical ability and coordination play vital roles in determining playing level in youth soccer
• Maturation and anthropometry seem to guide young players towards particular playing positions
• While the coach’s selection processes are often performance‐oriented, this may impact the developmental opportunitiesprovided to young players
PlayingPosition
PlayingLevel
AnthropometryPhysical CapacityTechnical AbilityMotor Competence
Physical
Technical
Total distanceHigh speed runningSprintsAccelerations
Skill Involvements
AttackerMidfielderFullbackCentral Defender
Team 1Team 2Team 3
Overall rankTechnical rankTactical rankPhysical rank
Psychological rank
3.Physical&TechnicalMatchActivity
Both individual (fitness) and contextual factors (playing level and position) may influence match activity profiles in youth soccer.
It is therefore important to understand what factors may influence match performance and development opportunities in youth soccer.
MethodA cross‐sectional, cohort study of 180 soccer players aged 10‐18 y.
• Mixed‐model approach• Various match‐related and individual player factors• Physical and technical match activity
MatchActivityProfilesAccountingforContextualFactors
Table 1: Covariates included in model specification.
Level of Data Factors Type Classification
Level 3 Cluster of clusters (random factor) Team
Level 2 Cluster of units (random factor) Player
Covariates Aerobic fitness Continuous YoYo IR1 distance (m)
Sprint speed Continuous 30 m sprint (s)
Total distance (Model 3) Continuous m∙min‐1
Level 1 Unit of analysis Individual match sample
Dependent variables Total distance (Model 1) Continuous m∙min‐1
High‐speed distance (Model 2) Continuous m∙min‐1
Skill involvements (Model 3) Continuous inv∙min‐1
Covariate Position Categorical ATT, MF, FB, CD
‐5.6%
‐7.6%
‐13.6%
7.0%
1.7%
‐0.8 ‐0.6 ‐0.4 ‐0.2 0.0 0.2 0.4 0.6
Effect Size
TotalDistance
MatchActivityProfilesAccountingforContextualFactors
Attacker
Fullback
Central Defender
Aerobic Fitness
Sprint Speed
Attacker
Sprint Speed
Central Defender
Aerobic Fitness
98.8 m/min 17.5 m/min
11.3%
‐22.2%
26.0%
5.2%
‐0.6 ‐0.4 ‐0.2 0.0 0.2 0.4 0.6 0.8
Effect Size
HSRDistance
• Both fitness and playing position influence match running in youth soccer
‐25.4%
‐21.8%
‐27.3%
0.8%
‐0.8 ‐0.6 ‐0.4 ‐0.2 0.0 0.2 0.4 0.6
Effect Size
SkillInvolvements
MatchActivityProfilesAccountingforContextualFactors
Attacker
Fullback
Central Defender
Distance (m∙min‐1)
0.37 inv/min
• Both playing position and match running influence skill involvements in youth soccer

20/02/2016
6
TakeHomeMessage#3
• A variety of individual (fitness) and contextual (position) factors influence match activity profiles in youth soccer
• These variations in match activity should not be confused with soccer performance
• Position selection may have considerable implications for developmental opportunities provided in youth soccer TalentDevelopment
4.Developmenttrajectoriesinyouthsoccer
Factors such as growth, development and training, make one‐off, long‐term predictions of future performance unreliable.
It is therefore important to observe the rate of improvement in performance skills, as well as current performance.
MethodA three‐year longitudinal, follow‐up study of a cohort study of 226 soccer players aged 10‐18 y.
• Mixed‐model approach• Various individual and contextual factors• Development of performance characteristic
@tomlovell26
TomLovell
Conclusions
1. Physical characteristics may guide young individuals towards certain sports, playing levels and playing positions in youth sport
2. These could have considerable implications for developmental opportunities throughout adolescence
3. Young individuals should be provided the chance to sample a wide range of sports and positions through their development to maximise learning opportunities
FutureConsiderations
1. Delay selecting into ranked teams?• Prevents deselection• Prevents early specialisation
2. Biological vs. Chronological ‘age groups • Biobanding training and competition
3. Continue with systematic benchmarking• Multi‐dimensional approach
4. Develop ‘smarter‘ (de)selection tools
5. Maximize participation through to complete maturation
Thankyou!