sustainable energy: the solar strategy enough to drive steam turbines to produce electric power. ......
TRANSCRIPT

Sustainable Energy Science and Engineering Center
Sustainable Energy:
The Solar Strategy

Sustainable Energy Science and Engineering Center
Summary
The renewed look at the Sustainable Energy results from two irrefutable reasons:
1. The supplies of fossil and mineral resources are limited.
2. The process in which these resources are used in energy servicesdamage and even destroy those limited planetary resources on which our lives depend: water, land and atmosphere.
Concerns about adverse environmental and social consequences of fossil fuel use and about finite nature of supplies have been voiced intermittently for several decades -
“Within a few generations at most, some other energy than that of combustion of fuel must be relied upon to do a fair share of the work of the civilized world.” - Robert H. Thurston -1901 in the Smithsonian Institution annual report.

Sustainable Energy Science and Engineering Center
Energy and Power
Energy (in joules) = Force (in newtons) x Distance (in meters)
Power (in watt) = Rate at which energy is converted from one form to the other ( in joules per second)
Example: 100 watt light bulb is converting 100 joules of energy into light each second
Power used in a given period is generally used as a measure of energy - kWh
1 kWh = 1000 x 3600 = 3.6 x 10⁶ Joules (i.e. 3.6 MJ)
1 Million tonnes of oil equivalent (Mtoe) = 41.9 x 10¹⁵ Joules (i.e. 41.9 PJ)
Exa - 1018; Peta - 1015; Tera - 1012; Giga - 109; Mega - 106
1 TW = 31.54 EJ/year

Sustainable Energy Science and Engineering Center
World Sources and Uses Of Energy
Electricity Liquid FuelsSpace Heating

Sustainable Energy Science and Engineering Center
Primary Energy Consumption per Capita
Electricity
Heat
Transport
One Tone of Oil Equivalent = 11,639 kWh

Sustainable Energy Science and Engineering Center
Growth in Electricity Demand
2001 2010 2015 2020 20250
2,000
4,000
6,000
8,000
10,000
12,000B
illion
Kil o
wat
thou
rsIndustrialized EE/FSU Developing
History Projections
Total:~ 14 TWh 24 TWh
Typical home electricity use in USA = 9000 kWh/year

Sustainable Energy Science and Engineering Center
Sustainable Energy Vision
Source: Sustainable energy vision 2050, Gunnar Boye Olesen, INFORSE-Europe coordinator, Gl. Kirkevej 56, DK
8530 Hjortshoej, Denmark, email [email protected]. Rio 2002

Sustainable Energy Science and Engineering Center
Sustainable Energy Source:
One that is not substantially depleted by continuous use
Does not entail significant pollutant emissions or other environmental problems
Does not involve the perpetuation of substantial health hazards or social injustices
Only a few energy sources come close to this ideal
Renewable Energy Sources:
Generally more sustainable than fossil or nuclear fuels
Essentially inexhaustible
Their use entails lower emissions of greenhouse gases or other pollutants
Fewer health hazards
Sustainable Energy Source
Principal source of renewable energy is solar radiation

Sustainable Energy Science and Engineering Center
Origin of Renewable Energy FlowsSolar radiation (incoming short
wavelength):
5.44 x 10⁶ EJ/year
Short wavelength radiation direct reflection to space: ~ 30%
Energy cycle without anthropogenic interference. The energy flows are in TW
1 TW = 31.54 EJ/yearSource: Renewable energy, Brent Sorensen,
Elsevier, 2004, p123
Closed cycle

Sustainable Energy Science and Engineering Center
Direction conversion to heat in air, earth and oceans: 2.55 x 10⁶ EJ/year
Biomass energy: 4.3 x 10³ EJ/year
Wind, waves convection and currents: 11.7 x 10³ EJ/year
Convection in volcanoes and hot springs: 9.36 EJ/year
Ocean tides: 93.6 EJ/year
Possible Sources of Energy Conversion
0.7
We should pay attention to those areas of energy cycle which have not yet been utilized for which energy conversion methods have been in place.
~ 4.7 x 10⁻⁵ of the solar radiation
Maximum relative change during the past 500K years has been 10-3
12
in TW
0.7
air
water
soil

Sustainable Energy Science and Engineering Center
Solar Electricity
Solar-thermally generated electricity:
Complex collectors to gather solar radiation to produce temperatures high enough to drive steam turbines to produce electric power. For example, a turbine fed from parabolic trough collectors might take steam at 750 K and eject heat into atmosphere at 300 K will have a ideal thermal (Carnot) efficiency of about 60%. Realistic overall conversion (system) efficiency of about 35% is feasible.
Solar Photovoltaic energy:
The direct conversion of sun’s rays to electricity.The efficiency (the ratio of the maximum power output and the incident radiation flux) of the best single-junction silicon solar cells has now reached 24% in laboratory test conditions. The best silicon commercially available PV modules have an efficiency of over 17%.

Sustainable Energy Science and Engineering Center
Solar-thermal Power Systems
In 1914, Frank Shuman of Philadelphia was planning to build 50,000 km2 of collectors in Sahara dissert. With present technology, such a plant can generate 2500 GW of electricity.

Sustainable Energy Science and Engineering Center
Solar thermal
1980 1990 2000 2010 2020
70605040302010
Levelized cents/kWh in constant $20001C
OE
cen
ts/k
Wh
Solar Thermal

Sustainable Energy Science and Engineering Center
PV Costs
Photoelectrochemistry, an area of confluence between solar cell technology and battery or fuel cell technology, is playing role in the development of organic solar cells.
First generation (I): Crystalline PV
Second generation (II): Thin Film PV
Third generation (III): Based on nanotechnology using collections of atoms of semiconducting material. Films containing nanocrystalline structures and nanostructured conducting polymers are designed to absorb much of the solar spectrum. This technology will lead to PV cells made from thinly stacked plastic sheets converting solar energy to electricity with very high efficiency and at very low cost.

Sustainable Energy Science and Engineering Center
Solar Cell Power Conversion η

Sustainable Energy Science and Engineering Center
Photovoltaics
1980 1990 2000 2010 2020
100
80
60
40
20
Levelized cents/kWh in constant $20001C
OE
cen
ts/k
Wh
Photovoltaics
*

Sustainable Energy Science and Engineering Center
Cost of Photovoltaic Modules
Source: Photovoltaics Guide book for Decision makers by Bubenzer and Luther; Springer, 2003

Sustainable Energy Science and Engineering Center
Source: Photovoltaics Guide book for Decision makers by Bubenzer and Luther; Springer, 2003
Renewable Electricity Generation

Sustainable Energy Science and Engineering Center
6 Boxes at 3.3 TW Each = 20 TW
Solar Cell Land Area Required
Source: Smalley, 2003
Sustainable Energy Science and Engineering Center
The solar technology is still in its infancy, comparable with the automobile of 1920’s.
The future solar cells will be made of flexible materials capable of converting the entire solar radiation spectrum into electricity.
Cost reductions will result in massive use of solar electricity in a not too distant future.
Summary
Source: Smalley, 2003

Sustainable Energy Science and Engineering Center
Sustainable Energy:
The Solar Strategy(Continued from Lecture 4)

Sustainable Energy Science and Engineering Center
Home workDue on September 20, 2005
1. Compare the total purchase costs of a nominally 2.5 kW (peak) photovoltaic system for the following three choices of solar modules:
a) First generation crystalline silicon modules of 15% energy conversion efficiency at a projected cost of $240/m2;
b) Second generation thin film modules of 12% conversion efficiency at a projected cost of $60/m2;
c) Third generation polymer modules of 50% conversion efficiency at a projected cost of $80/m2.
Assume balance of system components, include everything in a photovoltaic system other than the photovoltaic modules, is about 60% of the total module cost.
(Solar modules are normally given a rating under “peak” sunlight, corresponding to 1 kW/m2 intensity)

Sustainable Energy Science and Engineering Center
Home work
2. Estimate the cost of electricity ($/kWh) produced by two 1 kW BWC XL-1 turbines:
The total cost of the system is $15,000;
Depending on the wind resource, 160-400 kWh per month is produced;
12 hours to one week of back-up power is provided using battery storage.

Sustainable Energy Science and Engineering Center
Wind Power
GE WIND1.5 MW
GE WIND3.6 MW

Sustainable Energy Science and Engineering Center
Boeing 747-200
GE 3.6 MW
Large Scale Wind Turbine

Sustainable Energy Science and Engineering Center
Levelized cents/kWh in constant $20001
1980 1990 2000 2010 2020
CO
E c
ents
/kW
h45
30
15
Wind Energy Costs Trends
Source: NREL Energy Analysis Office1These graphs are reflections of historical cost trends NOT precise annual historical data.Updated: June 2002

Sustainable Energy Science and Engineering Center
World Total: 47,317 MW
2004 Installations: 7,976 MW
Growth rate: 20%
2020 Prediction: 1,245,000 MW*
12% of world electricity generation
* According to Wind Force 12
Global Wind Energy
1.6764China
1.8874Japan
1.9888United Kingdom
2.31,078Netherlands
2.41,125Italy
6.33,000India
6.63,117Denmark
14.26,740United States
17.58,263Spain
35.116,629Germany
% of total2004 MWCountry

Sustainable Energy Science and Engineering Center
States with most wind energy installed, by capacity (MW)
1 California - 2,096 MW 2 Texas - 1,293 MW 3 Minnesota - 615 MW 4 Iowa - 632 MW 5 Wyoming - 285 MW
US Wind Energy Installations
Largest wind farms operating the U.S. (MW)
1 Stateline, Oregon-Washington - 300 MW 2 King Mountain, Texas - 278 MW 3 New Mexico Wind Energy Center, New Mexico - 204 MW 4 Storm Lake, Iowa - 193 MW 5 Colorado Green, Colorado - 162 MW 6 High Winds, California - 162 MW

Sustainable Energy Science and Engineering Center
Biomass
1980 1990 2000 2010 2020
12
9
6
3
0
Levelized cents/kWh in constant $20001
CO
E c
ents
/kW
hBiomass

Sustainable Energy Science and Engineering Center
Power Cost

Sustainable Energy Science and Engineering Center
Electricity Generation Costs - 2004
Combined cycle gas turbine 3-5
Wind 4-7
Biomass gasification 7-9
Remote diesel generation 20-40
Solar PV central station 20-30
Solar PV distributed 20-50
¢/kWh

Sustainable Energy Science and Engineering Center
Non-solar Renewable Energy
Tidal energy:
The power of the tides is harnessed by building a low dam or barrage in which the rising waters are captured and allowed to flow back through electricity generating turbines.
Geothermal energy:
Heat from within the earth is the source. Hot rocks near the surface can heat water in underground aquifers to provide hot water or steam.

Sustainable Energy Science and Engineering Center
Source: Photovoltaics Guide book for Decision makers by Bubenzer and Luther; Springer, 2003
Renewable Energy Technologies

Sustainable Energy Science and Engineering Center
Quadrillion Btu1 Btu = 1,055.0559 joule
1 Quadrillion = 1015
Solar Heating
Domestic active solar heating:
Space heating - Cost effective to invest in home insulation. District heating - distributing heat from waste heat from power generating plants.
Water heating: passive solar thermal systems
Source: Annual Energy outlook - 2004, Energy Information Administration

Sustainable Energy Science and Engineering Center
Transportation Energy Consumption
Quadrillion Btu
Source: Annual Energy outlook - 2004, Energy Information Administration

Sustainable Energy Science and Engineering Center
Light Duty Vehicles by Fuel Type
Thousands of Vehicles sold
Source: Annual Energy outlook - 2004, Energy Information Administration

Sustainable Energy Science and Engineering Center
Transportation Fuel Efficiency

Sustainable Energy Science and Engineering Center
Performance

Sustainable Energy Science and Engineering Center
Vehicle Life Time Energy Consumption

Sustainable Energy Science and Engineering Center
Vehicle Total Energy Use

Sustainable Energy Science and Engineering Center
Wind Turbine
PV Array
Short-term Energy Storage
BalancerLoad
Heat Recovery
Electric line
H2 piping
Heat stream
Legend
Off-siteLoads
Hydrogen StorageH2
FuelingElectrolyzer
LocalLoads
Fuel Cells and Engines
Renewable H2 Energy System

Sustainable Energy Science and Engineering Center
US CO2 Emissions in 2000

Sustainable Energy Science and Engineering Center
Large
Small
Fossil-Fueled Renewable-Fueled
Hybrids
• Diesels• Microturbines• Fuel Cells
• Coal-fired Boilers
• Coal-fired Fluid Bed
• Combined Cycle
• Combustion Turbine
• Solar Central Receiver
• Wind Farms• Solar Trough
• Biomass• Wind Machines
• Solar Dish• Photovoltaics
• Energy Efficiency
Storage
Source: Mervin Brown, NREL
Fossil and Renewable Energy Domains

Sustainable Energy Science and Engineering Center
MicropowerA
vg. G
ener
atio
n C
ost,
$/M
W
1990 1980
50 200 600 1,000
1930
1950
1970
Optimal generation plant size for a single plant based on cost per megawatt [MW], 1930-1990
Source: Charles E. Bayless, “Less is More: Why Gas Turbines Will Transform Electric Utilities.” Public Utilities Fortnightly 12/1/94
Plant Size (MW)
Source: Mervin Brown, NREL

Sustainable Energy Science and Engineering Center
3840
42
44
46
48
30
40
50
2001 2002 2003 2004 2005 2006
DeregulationQuality/reliability power demand
Environment concernsDistribution constraints
Flexibility to add capacity
Siting and Permitting processLack of interconnection standardsBack-up tariffsNear term cost
DG Market Worldwide
(GW/Yr)
Global Distribution Generation
Source: John Cassidy, United Technologies Corp.
Sustainable Energy Science and Engineering Center
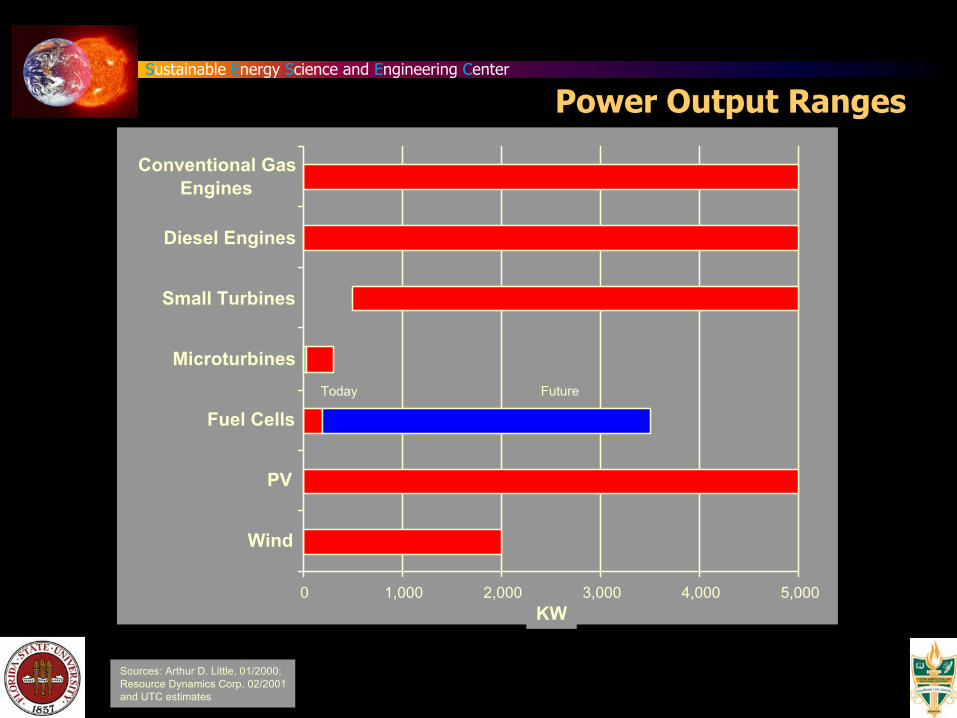
0 1,000 2,000 3,000 4,000 5,000
Wind
PV
Fuel Cells
Microturbines
Small Turbines
Diesel Engines
Conventional GasEngines
KW
FutureToday
Sources: Arthur D. Little, 01/2000;Resource Dynamics Corp. 02/2001and UTC estimates
Power Output Ranges

Sustainable Energy Science and Engineering Center
Centralized Power System Distributed Power System
Future Power System

Sustainable Energy Science and Engineering Center
1.2
0.6
24.89
1.2
0.6
Average U.S. fossil fuel plant
Combined cyclegas turbine
Microturbine
(Pounds of emissions per 1000 kWh NOx, CO, SOx, Hydrocarbon, Particulates)
Fuel cell
0.5
1.0
0
1.5
20
25
Emissions

Sustainable Energy Science and Engineering Center
0
1000
2000
3000
Average U.S.fossil fuel plant
Microturbine Fuel cell Combinedcycle gasturbine
Fuel cell(with co-
generation)
(Pounds of CO2 per 1000 kWh)
Source: UTC estimates
CO2 Emissions

Sustainable Energy Science and Engineering Center
Water
Oxygen
Electrolysis
Energy Hydrogen
CO2
ConventionalFuels
Biomass
HydrogenStorage
Hydrogen
FuelProcessor
Oxygen (air)
Water
Fuel CellEnergy
HydrogenStorage
Hydrogen Economy

Sustainable Energy Science and Engineering Center
Summary
Edison anticipated a highly dispersed electricity system, with individual businesses generating their own power - Renewable energy is ideally suited to realize this goal.
The cost gap between wind and conventional power continues to close.
New business models will evolve around renewable and micropower technologies.

Sustainable Energy Science and Engineering Center
Physical Assault Targets
Electronic Assault Targets
20,000 PCs460 LANs
1.45 terabytes
National security is energy security.National security is energy security.
Energy & Security
Source: Mervin Brown, NREL