table of contents - walch is the median of the data set used to create the box plot below? a. 5.5 b....
TRANSCRIPT

CCSS Descriptive Statistics for Algebra I/Mathematics I © Walch Educationiii
Introduction. . . . . . . . . . . . . . . . . . . . . . . . . . . . . . . . . . . . . . . . . . . . . . . . . . . . . . . . . . . . . . . . . . . . . . . . . . . .vStructure.of.the.Book. . . . . . . . . . . . . . . . . . . . . . . . . . . . . . . . . . . . . . . . . . . . . . . . . . . . . . . . . . . . . . . . . . . viiStandards.Correlations. . . . . . . . . . . . . . . . . . . . . . . . . . . . . . . . . . . . . . . . . . . . . . . . . . . . . . . . . . . . . . . . . . xiStation.Activities.Guide . . . . . . . . . . . . . . . . . . . . . . . . . . . . . . . . . . . . . . . . . . . . . . . . . . . . . . . . . . . . . . . .xiii
Lesson 1: Working with a Single Measurement Variable . . . . . . . . . . . . . . . . . . . . . . . . . . . . . . . . 1Lesson 2: Working with Two Categorical and Quantitative Variables . . . . . . . . . . . . . . . . . . . 73Lesson 3: Interpreting Linear Models . . . . . . . . . . . . . . . . . . . . . . . . . . . . . . . . . . . . . . . . . . . . . . 173Unit Assessment . . . . . . . . . . . . . . . . . . . . . . . . . . . . . . . . . . . . . . . . . . . . . . . . . . . . . . . . . . . . . . . . 246Answer Key . . . . . . . . . . . . . . . . . . . . . . . . . . . . . . . . . . . . . . . . . . . . . . . . . . . . . . . . . . . . . . . . . . . . 253Station Activities
Set 1: Displaying and Interpreting Data . . . . . . . . . . . . . . . . . . . . . . . . . . . . . . . . . . . . . . . . 265Set 2: Line of Best Fit . . . . . . . . . . . . . . . . . . . . . . . . . . . . . . . . . . . . . . . . . . . . . . . . . . . . . . . . . 281
Table of Contents
CCSS Descriptive Statistics for Algebra I/Mathematics I© Walch Educationvii
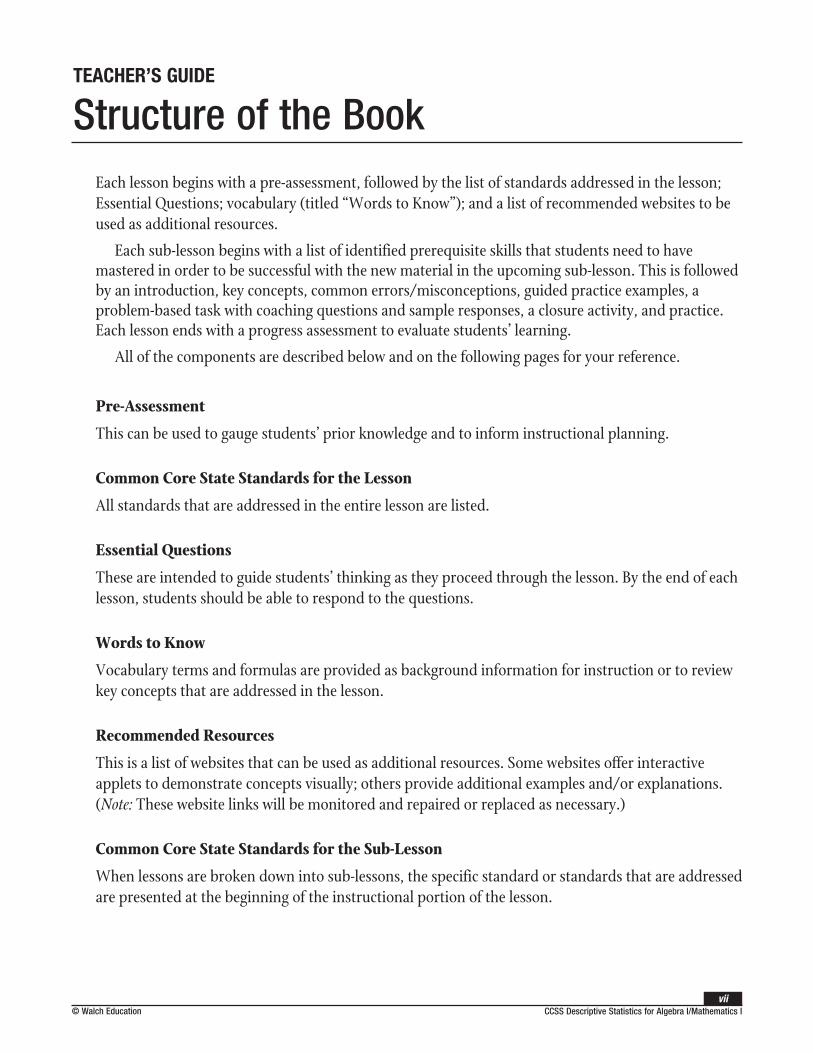
Each lesson begins with a pre-assessment, followed by the list of standards addressed in the lesson; Essential Questions; vocabulary (titled “Words to Know”); and a list of recommended websites to be used as additional resources.
Each sub-lesson begins with a list of identified prerequisite skills that students need to have mastered in order to be successful with the new material in the upcoming sub-lesson. This is followed by an introduction, key concepts, common errors/misconceptions, guided practice examples, a problem-based task with coaching questions and sample responses, a closure activity, and practice. Each lesson ends with a progress assessment to evaluate students’ learning.
All of the components are described below and on the following pages for your reference.
Pre-Assessment
This can be used to gauge students’ prior knowledge and to inform instructional planning.
Common Core State Standards for the Lesson
All standards that are addressed in the entire lesson are listed.
Essential Questions
These are intended to guide students’ thinking as they proceed through the lesson. By the end of each lesson, students should be able to respond to the questions.
Words to Know
Vocabulary terms and formulas are provided as background information for instruction or to review key concepts that are addressed in the lesson.
Recommended Resources
This is a list of websites that can be used as additional resources. Some websites offer interactive applets to demonstrate concepts visually; others provide additional examples and/or explanations. (Note: These website links will be monitored and repaired or replaced as necessary.)
Common Core State Standards for the Sub-Lesson
When lessons are broken down into sub-lessons, the specific standard or standards that are addressed are presented at the beginning of the instructional portion of the lesson.
Structure of the BookTEACHER’S GUIDE

CCSS Descriptive Statistics for Algebra I/Mathematics Iviii
© Walch Education
Warm-Up
Each warm-up takes approximately 5 minutes and addresses either prerequisite and critical-thinking skills or previously taught math concepts.
Warm-Up Debrief
Each debrief provides the answers to the warm-up questions, and offers suggestions for situations in which students might have difficulties. A section titled Connection to the Lesson is also included in the debrief to help answer students’ questions about the relevance of the particular warm-up activity to the upcoming instruction.
Identified Prerequisite Skills
Presented at the beginning of each sub-lesson, this list cites the skills necessary to be successful with the new material.
Introduction
This brief paragraph gives a description of the concepts about to be presented and often contains some Words to Know.
Key Concepts
Provided in bulleted form, this instruction highlights the important ideas and/or processes for meeting the standard.
Common Errors/Misconceptions
This is a list of the common errors students make when applying Key Concepts. This list suggests what to watch for when students arrive at an incorrect answer or are struggling with solving the problems.
Guided Practice
This section provides step-by-step examples of applying the Key Concepts.
Problem-Based Task
This activity can be used to walk students through the application of the standard, prior to traditional instruction or at the end of instruction. The task makes use of critical-thinking skills.
Problem-Based Task Coaching Questions
These questions scaffold the task and guide students to solving the problem(s) presented in the task.
TEACHER’S GUIDEStructure of the Book

CCSS Descriptive Statistics for Algebra I/Mathematics I© Walch Educationix
Problem-Based Task Coaching Questions Sample Responses
These are the answers and suggested appropriate responses to the coaching questions. In some cases answers may vary, but a sample answer is given for each question.
Recommended Closure Activity
Students are given the opportunity to synthesize and reflect on the lesson through a journal entry or discussion of one or more of the Essential Questions.
Practice
Each sub-lesson includes practice problems to support students’ achievement of the learning objectives. These sheets are written for the student. They can be used in any combination of teacher-led instruction, cooperative learning, or independent application of knowledge.
Progress Assessment
Each lesson ends with 10 multiple-choice questions, as well as one extended-response question that incorporates critical thinking and writing components. This can be used to document the extent to which students grasp the concepts and skills addressed during instruction.
Unit Assessment
This cumulative assessment has 12 multiple-choice questions and three extended-response questions that incorporate critical thinking and writing components. This can be used to document the extent to which students grasped the concepts and skills of each lesson.
Answer Key
Answers for all of the Warm-Ups, Assessments, and Practice problems are provided following the Unit Assessment.
Station Activities
There are two sets hands-on activities that correspond to instructional topics. These activities can be used to introduce new concepts or to culminate a sequence of instructional experiences.
Graphing Calculators
Step-by-step instructions for using a TI-Nspire and a TI-83/84 are provided whenever graphing calculators are referenced.
TEACHER’S GUIDEStructure of the Book
CCSS Descriptive Statistics for Algebra I/Mathematics I © Walch Educationxi
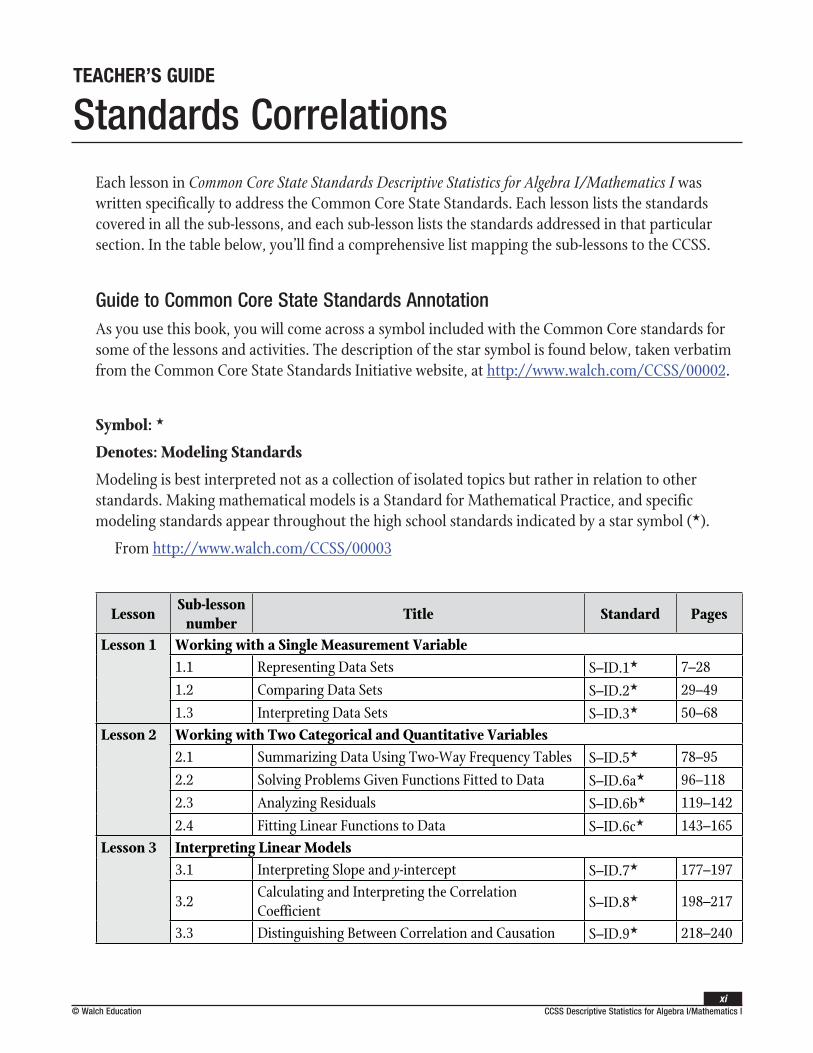
Each lesson in Common.Core.State.Standards.Descriptive.Statistics.for.Algebra.I/Mathematics.I was written specifically to address the Common Core State Standards. Each lesson lists the standards covered in all the sub-lessons, and each sub-lesson lists the standards addressed in that particular section. In the table below, you’ll find a comprehensive list mapping the sub-lessons to the CCSS.
Guide to Common Core State Standards AnnotationAs you use this book, you will come across a symbol included with the Common Core standards for some of the lessons and activities. The description of the star symbol is found below, taken verbatim from the Common Core State Standards Initiative website, at http://www.walch.com/CCSS/00002.
Symbol: ★
Denotes: Modeling Standards
Modeling is best interpreted not as a collection of isolated topics but rather in relation to other standards. Making mathematical models is a Standard for Mathematical Practice, and specific modeling standards appear throughout the high school standards indicated by a star symbol (★).
From http://www.walch.com/CCSS/00003
LessonSub-lesson
numberTitle Standard Pages
Lesson 1 Working with a Single Measurement Variable1.1 Representing Data Sets S–ID.1★ 7–281.2 Comparing Data Sets S–ID.2★ 29–491.3 Interpreting Data Sets S–ID.3★ 50–68
Lesson 2 Working with Two Categorical and Quantitative Variables 2.1 Summarizing Data Using Two-Way Frequency Tables S–ID.5★ 78–952.2 Solving Problems Given Functions Fitted to Data S–ID.6a★ 96–1182.3 Analyzing Residuals S–ID.6b★ 119–1422.4 Fitting Linear Functions to Data S–ID.6c★ 143–165
Lesson 3 Interpreting Linear Models3.1 Interpreting Slope and y-intercept S–ID.7★ 177–197
3.2Calculating and Interpreting the Correlation Coefficient S–ID.8★ 198–217
3.3 Distinguishing Between Correlation and Causation S–ID.9★ 218–240
Standards CorrelationsTEACHER’S GUIDE

DESCRIpTIvE STATISTICSLesson 1: Working with a Single Measurement Variable
NAME:
Assessment
CCSS Descriptive Statistics for Algebra I/Mathematics I© Walch Education1
Pre-AssessmentCircle the letter of the best answer.
1. What is the median of the data set used to create the box plot below?
a. 5.5
b. 6.5
c. 7
d. 8.5
2. What is the interquartile range of the data below?
18 21 22 23 26 27 28 29
a. 3
b. 6
c. 7
d. 21.5
3. Look at the data presented in the histograms below. Which comparison is true?
Data Set 1 Data Set 2
a. Data Set 1: greater mean; Data Set 1: greater variation
b. Data Set 1: greater mean; Data Set 2: greater variation
c. Data Set 2: greater mean; Data Set 2: greater variation
d. Data Set 2: greater mean; Data Set 1: greater variation continued

DESCRIpTIvE STATISTICSLesson 1: Working with a Single Measurement Variable
NAME:
Assessment
CCSS Descriptive Statistics for Algebra I/Mathematics I2
© Walch Education
4. The dot plot below represents which data set?
a. Data Set 1: 10, 14, 16, 18, 18, 20, 20, 20, 20, 20, 22
b. Data Set 2: 10, 14, 16, 16, 16, 20, 20, 20, 20, 20, 22, 22, 24
c. Data Set 3: 10, 14, 14, 16, 16, 16, 18, 18, 18, 18, 18, 18, 22, 22, 24
d. Data Set 4: 10, 14, 16, 16, 16, 16, 18, 18, 18, 18, 18, 22, 22, 24
5. Which value in the data set below appears to be an outlier?
41 51 27 48 45 46 39 45 38 39
a. 27
b. 41
c. 46
d. 48

Lesson 1: Working with a Single Measurement Variable
DESCRIpTIvE STATISTICS
Instruction
CCSS Descriptive Statistics for Algebra I/Mathematics I© Walch Education3
Common Core State Standards
S–ID.1 Represent data with plots on the real number line (dot plots, histograms, and box plots).★
S–ID.2 Use statistics appropriate to the shape of the data distribution to compare center (median, mean) and spread (interquartile range, standard deviation) of two or more different data sets.★
S–ID.3 Interpret differences in shape, center, and spread in the context of the data sets, accounting for possible effects of extreme data points (outliers).★
Essential Questions
1. What do measures of spread describe about a data set?
2. What can be learned about a data set by looking at a frequency plot?
3. How can two data sets be compared quantitatively?
4. How do outliers influence measures of center?
WORDS TO KNOW
box plot a plot showing the minimum, maximum, first quartile, median, and third quartile of a data set; the middle 50% of the data is indicated by a box. Example:
dot plot a frequency plot that shows the number of times a response occurred in a data set, where each data value is represented by a dot. Example:

DESCRIpTIvE STATISTICSLesson 1: Working with a Single Measurement Variable
Instruction
CCSS Descriptive Statistics for Algebra I/Mathematics I4
© Walch Education
first quartile the value that identifies the lower 25% of the data; the median of the lower half of the data set; written as Q
1
histogram a frequency plot that shows the number of times a response or range of responses occurred in a data set. Example:
interquartile range the difference between the third and first quartiles; 50% of the data is contained within this range
mean the average value of a data set, found by summing all values and dividing by the number of data points
mean absolute deviation the average absolute value of the difference between each data point and the mean; found by summing the absolute value of the difference between each data point and the mean, then dividing this sum by the total number of data points
measures of center values that describe expected and repeated data values in a data set; the mean and median are two measures of center
measures of spread a measure that describes the variance of data values, and identifies the diversity of values in a data set
median the middle-most value of a data set; 50% of the data is less than this value, and 50% is greater than it
outlier a data value that is much greater than or much less than the rest of the data in a data set; mathematically, any data less than Q
1 – 1.5(IQR) or
greater than Q 3 + 1.5(IQR) is an outlier

DESCRIpTIvE STATISTICSLesson 1: Working with a Single Measurement Variable
Instruction
CCSS Descriptive Statistics for Algebra I/Mathematics I© Walch Education5
skewed to the left data concentrated on the higher values in the data set, which has a tail to the left. Example:
20 24 28 32 36 40
skewed to the right data concentrated on the lower values in the data set, which has a tail to the right. Example:
20 24 28 32 36 40
symmetric situation in which data is concentrated toward the middle of the range of data; data values are distributed in the same way above and below the middle of the sample. Example:
20 24 28 32 36 40
third quartile value that identifies the upper 25% of the data; the median of the upper half of the data set; 75% of all data is less than this value; written as Q
3

DESCRIpTIvE STATISTICSLesson 1: Working with a Single Measurement Variable
Instruction
CCSS Descriptive Statistics for Algebra I/Mathematics I6
© Walch Education
Recommended Resources• Braining Camp. “Box Plots—Questions.”
http://walch.com/rr/CAU4L1BoxPlotQuestions
This site provides an interactive quiz with 10 multiple-choice questions about box plots. The computer scores the results.
• Khan Academy. “Box-and-whisker Plot.”
http://walch.com/rr/CAU4L1BoxPlotVideo
This video demonstrates how to create a box plot (also known as a box-and-whisker plot) given a data set. Available for free.
• Math Is Fun! “Histograms.”
http://walch.com/rr/CAU4L1Histograms
This site gives an overview of what histograms are and aren’t. Users can answer questions about histograms, and the computer scores the results.
• Onlinestatbook.com. “Dot Plots.”
http://walch.com/rr/CAU4L1DotPlots
This site describes four different types of dot plots and then asks questions about interpreting the dot plots.

DESCRIpTIvE STATISTICSLesson 1: Working with a Single Measurement Variable
NAME:
CCSS Descriptive Statistics for Algebra I/Mathematics I© Walch Education7
Lesson 1.1: Representing Data Sets
Warm-Up 1.1There are 10 ninth-grade classrooms. The number of students in each classroom is in the table below. Use the table to answer the questions about the number of students.
Classroom Number of students1 252 323 304 305 296 357 258 359 29
10 26
1. What is the median?
2. What is the first quartile?
3. What is the third quartile?
4. Which classroom has the least number of students?
5. Which classroom has the greatest number of students?
6. Are there any striking deviations in the data? Explain.

DESCRIpTIvE STATISTICSLesson 1: Working with a Single Measurement Variable
Instruction
CCSS Descriptive Statistics for Algebra I/Mathematics I8
© Walch Education
Lesson 1.1: Representing Data SetsCommon Core State Standard
S–ID.1 Represent data with plots on the real number line (dot plots, histograms, and box plots).★
Warm-Up 1.1 DebriefThere are 10 ninth-grade classrooms. The number of students in each classroom is in the table below. Use the table to answer the questions about the number of students.
Classroom Number of students1 252 323 304 305 296 357 258 359 29
10 26
1. What is the median?
Order the data (the number of students in each classroom) from least to greatest.
Classroom Number of students1 257 25
10 265 299 293 304 302 326 358 35
The median is the middle-most value of the data set. If there is an odd number of data values, find the middle-most value. If there is an even number of data values, find the average of the

DESCRIpTIvE STATISTICSLesson 1: Working with a Single Measurement Variable
Instruction
CCSS Descriptive Statistics for Algebra I/Mathematics I© Walch Education9
two middle-most values. The median number of students is the average of the fifth and sixth values, 29 and 30.
29 30
229.5
+=
2. What is the first quartile?
The median divides the data into two halves. The lower half of this data set is the first five data values: 25, 25, 26, 29, and 29. The first quartile is the middle-most value of the lower half of the data. The middle-most value of the lower half of the data is the third data value, 26.
3. What is the third quartile?
The upper half of this data set is the last five data values: 30, 30, 32, 35, and 35. The third quartile is the middle-most value of the upper half of the data. The middle-most value of the upper half of the data is the third value, 32.
4. Which classroom has the least number of students?
There are two classrooms with the least number of students. Both classrooms 1 and 7 have 25 students.
5. Which classroom has the greatest number of students?
There are two classrooms with the greatest number of students. Both classrooms 6 and 8 have 35 students.
6. Are there any striking deviations in the data? Explain.
Think about the typical number of students in a classroom. This can vary widely from school to school. In this data set though, the interquartile range is 6:
Q 3 – Q
1 = 32 – 26 = 6
Comparing the interquartile range and the median of 29.5 to the lowest data value, 25, the lowest data value is not far away from the mean in terms of the interquartile range. The lowest data value is not a striking deviation.
Now compare median and the interquartile range, 6. The highest data value, 35, is not far away from the mean in terms of the interquartile range. The highest data is not a striking deviation.
Connection to the Lesson
• In this lesson, students will plot data on the real number line using dot plots, histograms, and box plots.
• To create box plots from a given data set, students will need to determine the least data value, or minimum; the greatest data value, or maximum; the first quartile; the median; and the third quartile.
DESCRIpTIvE STATISTICSLesson 1: Working with a Single Measurement Variable
Instruction
CCSS Descriptive Statistics for Algebra I/Mathematics I10
© Walch Education
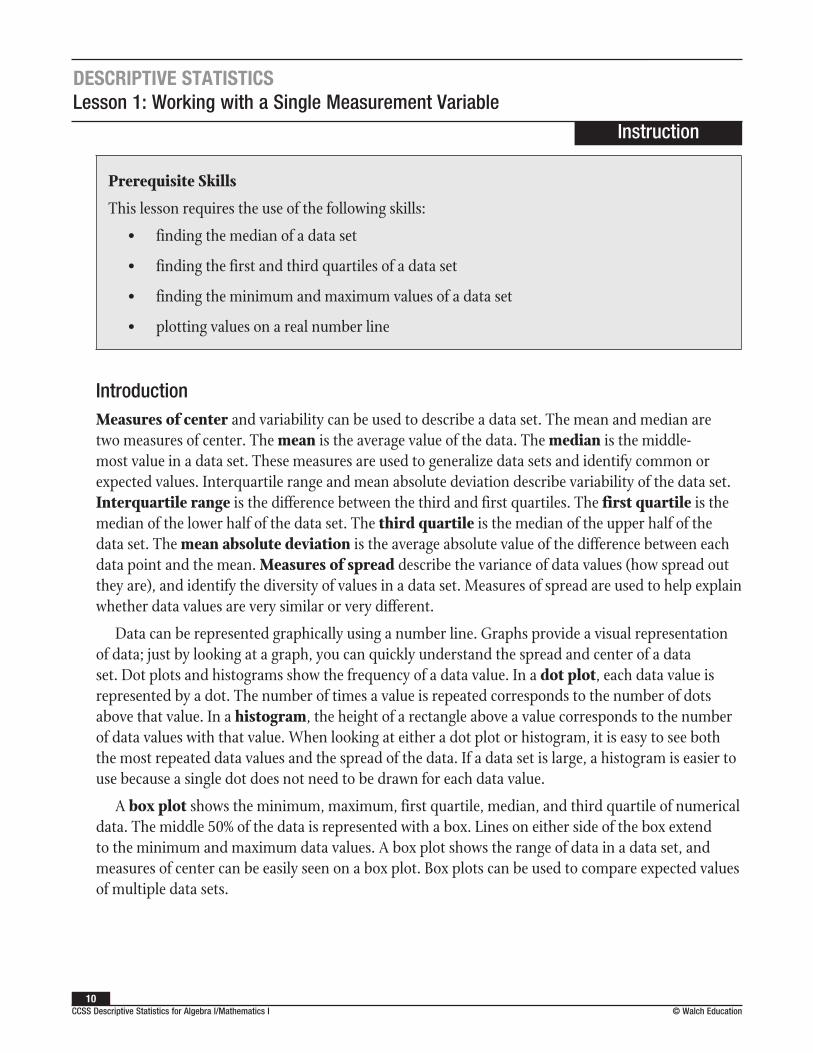
Prerequisite Skills
This lesson requires the use of the following skills:
• finding the median of a data set
• finding the first and third quartiles of a data set
• finding the minimum and maximum values of a data set
• plotting values on a real number line
IntroductionMeasures of center and variability can be used to describe a data set. The mean and median are two measures of center. The mean is the average value of the data. The median is the middle-most value in a data set. These measures are used to generalize data sets and identify common or expected values. Interquartile range and mean absolute deviation describe variability of the data set. Interquartile range is the difference between the third and first quartiles. The first quartile is the median of the lower half of the data set. The third quartile is the median of the upper half of the data set. The mean absolute deviation is the average absolute value of the difference between each data point and the mean. Measures of spread describe the variance of data values (how spread out they are), and identify the diversity of values in a data set. Measures of spread are used to help explain whether data values are very similar or very different.
Data can be represented graphically using a number line. Graphs provide a visual representation of data; just by looking at a graph, you can quickly understand the spread and center of a data set. Dot plots and histograms show the frequency of a data value. In a dot plot, each data value is represented by a dot. The number of times a value is repeated corresponds to the number of dots above that value. In a histogram, the height of a rectangle above a value corresponds to the number of data values with that value. When looking at either a dot plot or histogram, it is easy to see both the most repeated data values and the spread of the data. If a data set is large, a histogram is easier to use because a single dot does not need to be drawn for each data value.
A box plot shows the minimum, maximum, first quartile, median, and third quartile of numerical data. The middle 50% of the data is represented with a box. Lines on either side of the box extend to the minimum and maximum data values. A box plot shows the range of data in a data set, and measures of center can be easily seen on a box plot. Box plots can be used to compare expected values of multiple data sets.
DESCRIpTIvE STATISTICSLesson 1: Working with a Single Measurement Variable
Instruction
CCSS Descriptive Statistics for Algebra I/Mathematics I© Walch Education11
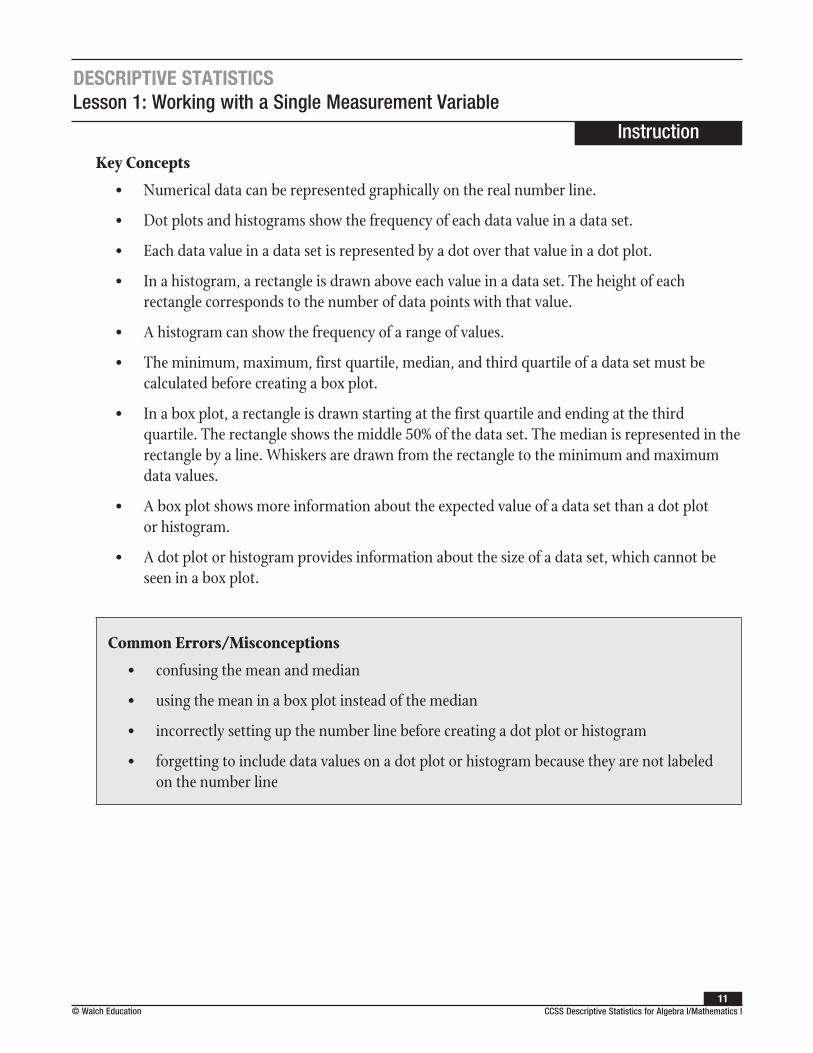
Key Concepts
• Numerical data can be represented graphically on the real number line.
• Dot plots and histograms show the frequency of each data value in a data set.
• Each data value in a data set is represented by a dot over that value in a dot plot.
• In a histogram, a rectangle is drawn above each value in a data set. The height of each rectangle corresponds to the number of data points with that value.
• A histogram can show the frequency of a range of values.
• The minimum, maximum, first quartile, median, and third quartile of a data set must be calculated before creating a box plot.
• In a box plot, a rectangle is drawn starting at the first quartile and ending at the third quartile. The rectangle shows the middle 50% of the data set. The median is represented in the rectangle by a line. Whiskers are drawn from the rectangle to the minimum and maximum data values.
• A box plot shows more information about the expected value of a data set than a dot plot or histogram.
• A dot plot or histogram provides information about the size of a data set, which cannot be seen in a box plot.
Common Errors/Misconceptions
• confusing the mean and median
• using the mean in a box plot instead of the median
• incorrectly setting up the number line before creating a dot plot or histogram
• forgetting to include data values on a dot plot or histogram because they are not labeled on the number line

DESCRIpTIvE STATISTICSLesson 1: Working with a Single Measurement Variable
Instruction
CCSS Descriptive Statistics for Algebra I/Mathematics I12
© Walch Education
Guided Practice 1.1Example 1
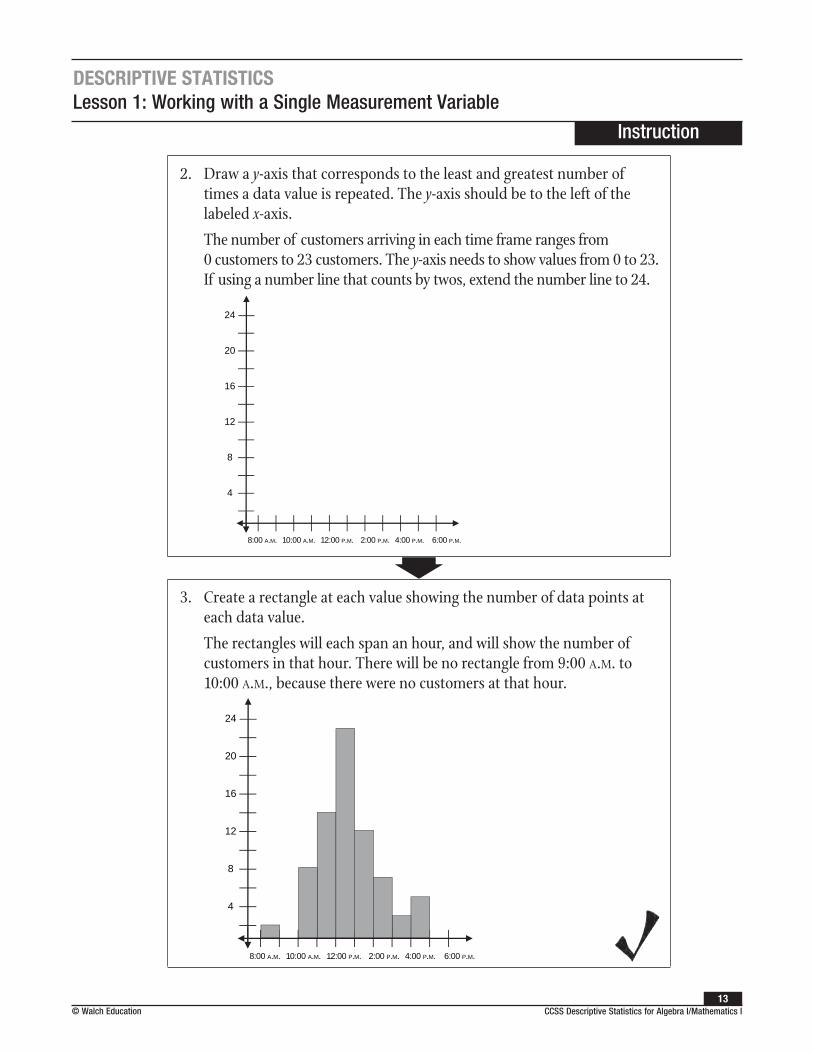
A pharmacy records the number of customers each hour that the pharmacy is open. The staff is using the information to determine how many people need to be working at the pharmacy at each time of day. The number of customers is in the table below. Use the table to create a histogram to help the pharmacy staff understand how many customers are in the pharmacy at each time of day.
Time frame Number of customers8:00 a.m.–9:00 a.m. 2
9:00 a.m.–10:00 a.m. 010:00 a.m.–11:00 a.m. 811:00 a.m.–12:00 p.m. 1412:00 p.m.–1:00 p.m. 231:00 p.m.–2:00 p.m. 122:00 p.m.–3:00 p.m. 73:00 p.m.–4:00 p.m. 34:00 p.m.–5:00 p.m. 5
1. Draw a number line on an x-axis that corresponds to the range of the data.
The x-axis for this data will show the times the customers were counted. The number line for the pharmacy must include the times from 8:00 a.m. until 5:00 p.m. If using a number line that counts by twos, extend the number line to 6:00 p.m.
8:00 A.M. 10:00 A.M. 12:00 P.M. 2:00 P.M. 4:00 P.M. 6:00 P.M.
DESCRIpTIvE STATISTICSLesson 1: Working with a Single Measurement Variable
Instruction
CCSS Descriptive Statistics for Algebra I/Mathematics I© Walch Education13
2. Draw a y-axis that corresponds to the least and greatest number of times a data value is repeated. The y-axis should be to the left of the labeled x-axis.
The number of customers arriving in each time frame ranges from 0 customers to 23 customers. The y-axis needs to show values from 0 to 23. If using a number line that counts by twos, extend the number line to 24.
24
20
16
12
8
4
8:00 A.M. 10:00 A.M. 12:00 P.M. 2:00 P.M. 4:00 P.M. 6:00 P.M.
3. Create a rectangle at each value showing the number of data points at each data value.
The rectangles will each span an hour, and will show the number of customers in that hour. There will be no rectangle from 9:00 a.m. to 10:00 a.m., because there were no customers at that hour.
24
20
16
12
8
4
8:00 A.M. 10:00 A.M. 12:00 P.M. 2:00 P.M. 4:00 P.M. 6:00 P.M.

DESCRIpTIvE STATISTICSLesson 1: Working with a Single Measurement Variable
Instruction
CCSS Descriptive Statistics for Algebra I/Mathematics I14
© Walch Education
Example 2
Anna and Ethan watch 20 thirty-minute shows during the month of June. They record the number of commercials that air during each show in the table below. Create a dot plot to display the number of commercials that aired during the 20 shows.
Television show Number of commercialsA 17B 17C 15D 17E 14F 17G 15H 19I 15J 16K 12L 14M 15N 17O 18P 18Q 18R 18S 13T 14
DESCRIpTIvE STATISTICS
Answer Key
CCSS Descriptive Statistics for Algebra I/Mathematics I© Walch Education253
Lesson 1: Working with a Single Measurement Variable
Pre-Assessment, pp. 1–21. c 2. b3. d
4. b5. a6. b
Warm-Up 1.1, p. 71. 29.5 2. 263. 324. Classrooms 1 and 7 both have the least number of students.5. Classrooms 6 and 8 both have the greatest number of
students.
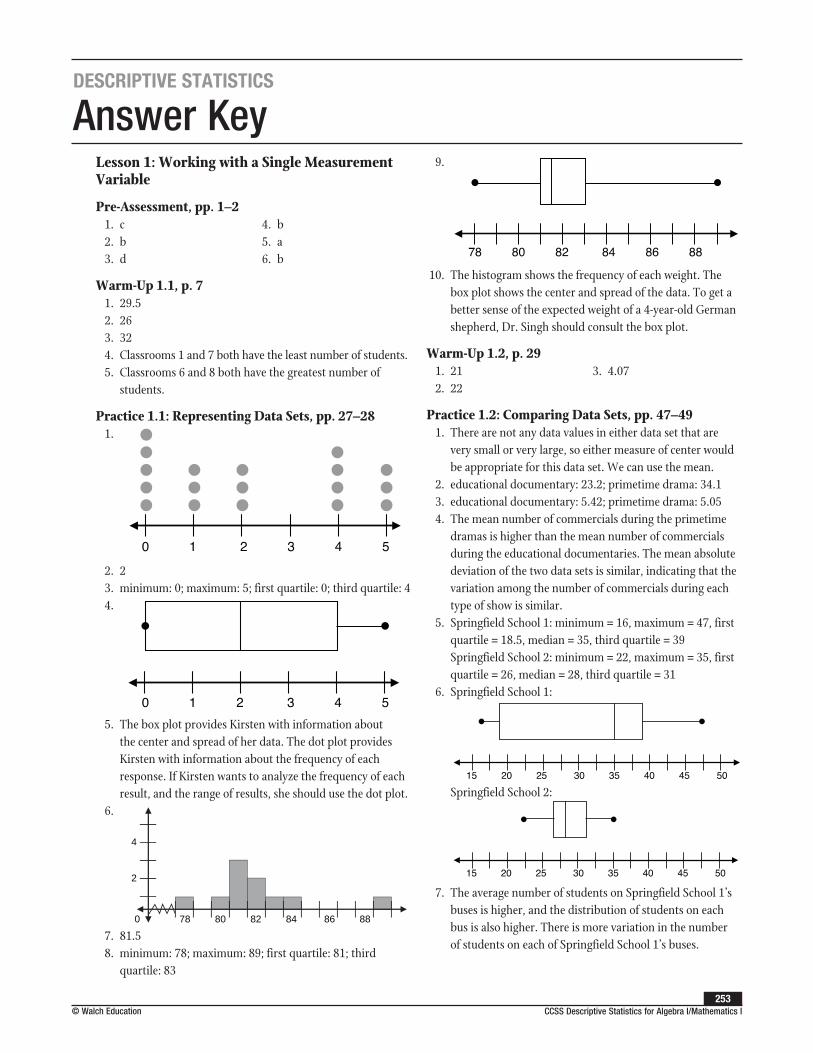
Practice 1.1: Representing Data Sets, pp. 27–281.
2. 23. minimum: 0; maximum: 5; first quartile: 0; third quartile: 44.
5. The box plot provides Kirsten with information about the center and spread of her data. The dot plot provides Kirsten with information about the frequency of each response. If Kirsten wants to analyze the frequency of each result, and the range of results, she should use the dot plot.
6.
78 80 82 84 86 88
4
2
0
7. 81.58. minimum: 78; maximum: 89; first quartile: 81; third
quartile: 83
9.
10. The histogram shows the frequency of each weight. The box plot shows the center and spread of the data. To get a better sense of the expected weight of a 4-year-old German shepherd, Dr. Singh should consult the box plot.
Warm-Up 1.2, p. 291. 21 2. 22
3. 4.07
Practice 1.2: Comparing Data Sets, pp. 47–491. There are not any data values in either data set that are
very small or very large, so either measure of center would be appropriate for this data set. We can use the mean.
2. educational documentary: 23.2; primetime drama: 34.13. educational documentary: 5.42; primetime drama: 5.054. The mean number of commercials during the primetime
dramas is higher than the mean number of commercials during the educational documentaries. The mean absolute deviation of the two data sets is similar, indicating that the variation among the number of commercials during each type of show is similar.
5. Springfield School 1: minimum = 16, maximum = 47, first quartile = 18.5, median = 35, third quartile = 39 Springfield School 2: minimum = 22, maximum = 35, first quartile = 26, median = 28, third quartile = 31
6. Springfield School 1:
Springfield School 2:
7. The average number of students on Springfield School 1’s buses is higher, and the distribution of students on each bus is also higher. There is more variation in the number of students on each of Springfield School 1’s buses.