the elasticsearch-kibana plugin for fuel...
TRANSCRIPT
The Elasticsearch-Kibana plugin forFuel Documentation
Release 0.8-0.8.1-1
Mirantis Inc.
April 20, 2016

CONTENTS
1 User documentation 11.1 Overview . . . . . . . . . . . . . . . . . . . . . . . . . . . . . . . . . . . . . . . . . . . . . . . . . 11.2 Release Notes . . . . . . . . . . . . . . . . . . . . . . . . . . . . . . . . . . . . . . . . . . . . . . 21.3 Installation Guide . . . . . . . . . . . . . . . . . . . . . . . . . . . . . . . . . . . . . . . . . . . . 31.4 User Guide . . . . . . . . . . . . . . . . . . . . . . . . . . . . . . . . . . . . . . . . . . . . . . . . 41.5 Licenses . . . . . . . . . . . . . . . . . . . . . . . . . . . . . . . . . . . . . . . . . . . . . . . . . 121.6 Appendix . . . . . . . . . . . . . . . . . . . . . . . . . . . . . . . . . . . . . . . . . . . . . . . . . 12
2 Indices and Tables 13
i
CHAPTER
ONE
USER DOCUMENTATION
1.1 Overview
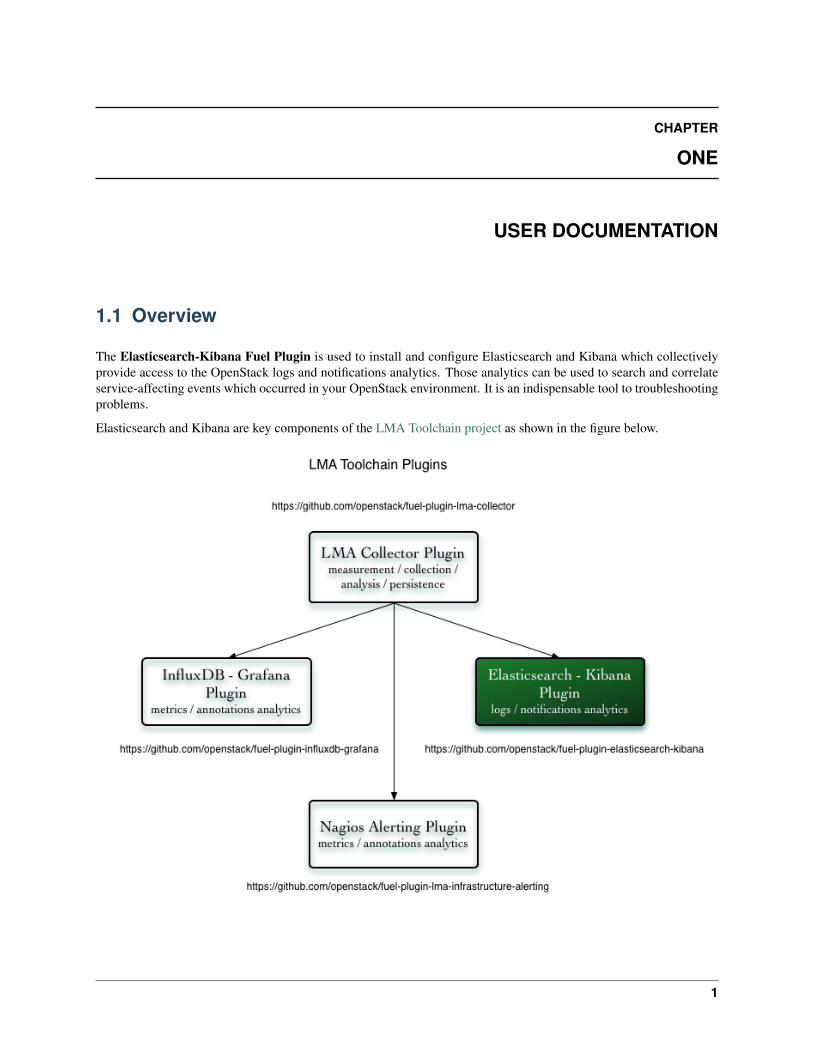
The Elasticsearch-Kibana Fuel Plugin is used to install and configure Elasticsearch and Kibana which collectivelyprovide access to the OpenStack logs and notifications analytics. Those analytics can be used to search and correlateservice-affecting events which occurred in your OpenStack environment. It is an indispensable tool to troubleshootingproblems.
Elasticsearch and Kibana are key components of the LMA Toolchain project as shown in the figure below.
1
The Elasticsearch-Kibana plugin for Fuel Documentation, Release 0.8-0.8.1-1
1.1.1 Requirements
Requirement Version/CommentDisk space At least 55GBFuel Mirantis OpenStack 7.0Hardware configuration The hardware configuration (RAM, CPU, disk) required
by this plugin depends on the size of your cloud andother parameters like the log level being used.A typical setup would at least require a quad-core serverwith 8GB of RAM and fast disks (ideally, SSDs).It is also highly recommended to use dedicated disk(s)for your data storage. Otherwise, Elasticsearch will usethe root filesystem by default.
1.1.2 Limitations
A current limitation of this plugin is that it not possible to display in the Fuel web UI the URL where the Kibanainterface can be reached when the deployment has completed. Instructions are provided in the User Guide about howyou can obtain this URL using the fuel command line.
1.1.3 Key terms, acronyms and abbreviations
Terms & acronyms DefinitionLMA Collector Logging, Monitoring and Alerting (LMA) Collector. A
service running on each node which collects all the logsand the OpenStak notifications.
Elasticsearch An open source (Apache Licensed) application basedon the Lucene™ search engine that makes data like logmessages easy to explore and correlate.Elasticsearch is written in Java and uses Lucene inter-nally for all of its indexing and searching, but it aims tomake full-text search easy by hiding the complexities ofLucene behind a simple, coherent, RESTful API.
Kibana An open source (Apache Licensed), browser based ana-lytics and search dashboard for Elasticsearch. Kibana iseasy to setup and start using.
1.2 Release Notes
1.2.1 Version 0.8.1
• Bug fixes
– Fix the cron job running Elastic Curator (#1535435).
– Specify explicitly one data.path for Elasticsearch (#1559126):
1.2. Release Notes 2

The Elasticsearch-Kibana plugin for Fuel Documentation, Release 0.8-0.8.1-1
1.2.2 Version 0.8.0
• Add support for the “elasticsearch_kibana” Fuel Plugin role instead of the “base-os” role which had severallimitations.
• Add support for retention policy configuration with Elastic Curator.
• Upgrade to Elasticsearch 1.4.5.
1.2.3 Version 0.7.0
• Initial release of the plugin. This is a beta version.
1.3 Installation Guide
1.3.1 Elasticsearch-Kibana Fuel Plugin install using the RPM file of the Fuel PluginsCatalog
To install the Elasticsearch-Kibana Fuel Plugin using the RPM file of the Fuel Plugins Catalog, you need to followthese steps:
1. Download the RPM file from the Fuel Plugins Catalog.
2. Copy the RPM file to the Fuel Master node:
[root@home ~]# scp elasticsearch_kibana-0.8-0.8.0-0.noarch.rpm \root@<Fuel Master node IP address>:
3. Install the plugin using the Fuel CLI:
[root@fuel ~]# fuel plugins --install elasticsearch_kibana-0.8-0.8.0-0.noarch.rpm
4. Verify that the plugin is installed correctly:
[root@fuel ~]# fuel plugins --listid | name | version | package_version---|----------------------|---------|----------------1 | elasticsearch_kibana | 0.8.0 | 3.0.0
1.3.2 Elasticsearch-Kibana Fuel Plugin install from source
Alternatively, you may want to build the RPM file of the plugin from source if, for example, you want to test thelatest features, modify some built-in configuration or implement your own customization. But note that running a Fuelplugin that you have built yourself is at your own risk.
To install Elasticsearch-Kibana Plugin from source, you first need to prepare an environment to build the RPM file.The recommended approach is to build the RPM file directly onto the Fuel Master node so that you won’t have to copythat file later on.
Prepare an environment for building the plugin on the Fuel Master Node
1. Install the standard Linux development tools:
[root@home ~] yum install createrepo rpm rpm-build dpkg-devel
1.3. Installation Guide 3
The Elasticsearch-Kibana plugin for Fuel Documentation, Release 0.8-0.8.1-1
2. Install the Fuel Plugin Builder. To do that, you should first get pip:
[root@home ~] easy_install pip
3. Then install the Fuel Plugin Builder (the fpb command line) with pip:
[root@home ~] pip install fuel-plugin-builder
Note: You may also need to build the Fuel Plugin Builder if the package version of the plugin is higher than packageversion supported by the Fuel Plugin Builder you get from pypi. In this case, please refer to the section “Preparing anenvironment for plugin development” of the Fuel Plugins wiki if you need further instructions about how to build theFuel Plugin Builder.
4. Clone the plugin git repository:
[root@home ~] git clone \[email protected]:openstack/fuel-plugin-elasticsearch-kibana.git
5. Check that the plugin is valid:
[root@home ~] fpb --check ./fuel-plugin-elasticsearch-kibana
6. And finally, build the plugin:
[root@home ~] fpb --build ./fuel-plugin-elasticsearch-kibana
7. Now that you have created the RPM file, you can install the plugin using the fuel plugins –install command:
[root@fuel ~] fuel plugins --install \./fuel-plugin-elasticsearch-kibana/*.noarch.rpm
1.3.3 Elasticsearch-Kibana Fuel Plugin software components
List of software components installed by the plugin
Components VersionElasticsearch v1.4.5 for Ubuntu (64-bit)Kibana v3.1.2Nginx Version coming by default with the Ubuntu distribution
1.4 User Guide
1.4.1 Plugin configuration
To configure your plugin, you need to follow these steps:
1. Create a new environment with the Fuel web user interface.
2. Click on the Settings tab of the Fuel web UI.
3. Scroll down the page and select the Elasticsearch-Kibana Plugin in the left column. The Elasticsearch-KibanaPlugin settings screen should appear as shown below.
1.4. User Guide 4

The Elasticsearch-Kibana plugin for Fuel Documentation, Release 0.8-0.8.1-1
4. Select the Elasticsearch-Kibana Plugin checkbox and fill-in the required fields.
1. Specify the data retention period in number of days.
2. Specify the JVM heap size for Elastisearch. See configuration recommendations below.
Note: By default, 1GB of heap memory is allocated to the Elasticsearch process. This value is too small to runElasticsearch for anything else than local testing. To run Elasticsearch in production you need to allocate at least 4 GBof memory but it is recommended to allocate 50% of the available memory up to 32 GB maximum.
If you set a value that is greater than the memory size, Elasticsearch won’t start. Keep in mind also to reserve enoughmemory for the operating system and the other services.
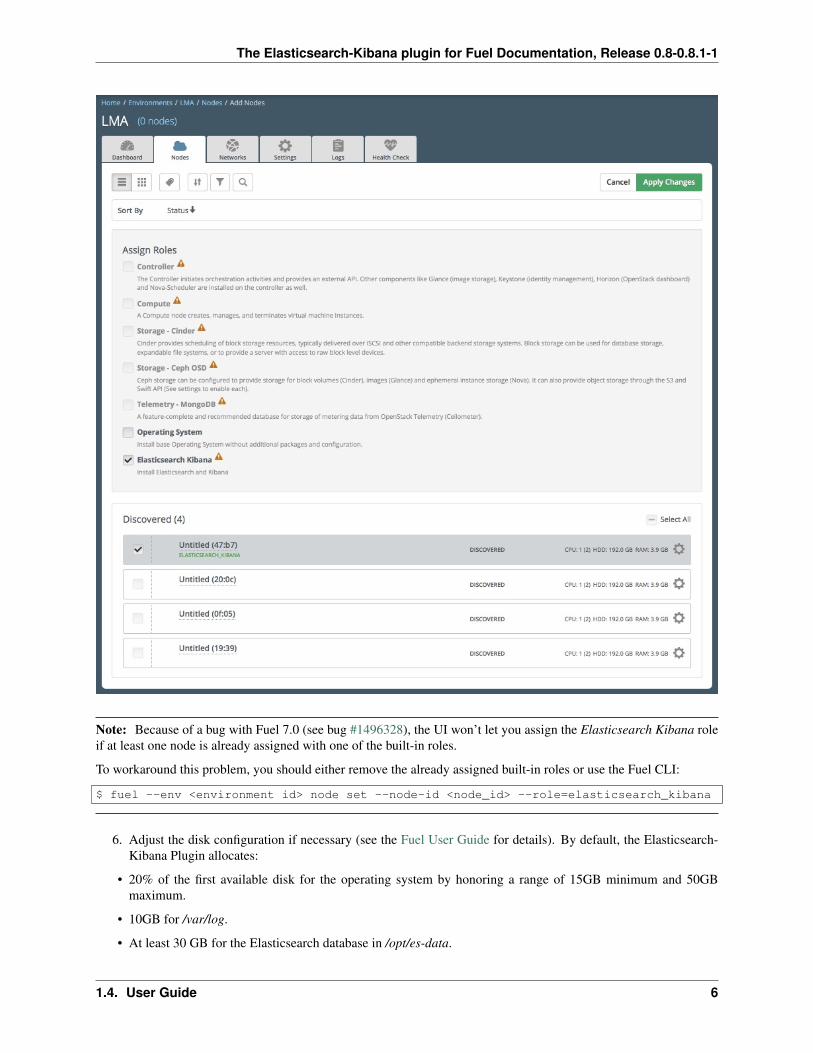
5. Assign the Elasticsearch Kibana role to a node as shown in the figure below.
1.4. User Guide 5
The Elasticsearch-Kibana plugin for Fuel Documentation, Release 0.8-0.8.1-1
Note: Because of a bug with Fuel 7.0 (see bug #1496328), the UI won’t let you assign the Elasticsearch Kibana roleif at least one node is already assigned with one of the built-in roles.
To workaround this problem, you should either remove the already assigned built-in roles or use the Fuel CLI:
$ fuel --env <environment id> node set --node-id <node_id> --role=elasticsearch_kibana
6. Adjust the disk configuration if necessary (see the Fuel User Guide for details). By default, the Elasticsearch-Kibana Plugin allocates:
• 20% of the first available disk for the operating system by honoring a range of 15GB minimum and 50GBmaximum.
• 10GB for /var/log.
• At least 30 GB for the Elasticsearch database in /opt/es-data.
1.4. User Guide 6
The Elasticsearch-Kibana plugin for Fuel Documentation, Release 0.8-0.8.1-1
7. Configure your environment as needed.
8. Verify the networks on the Networks tab of the Fuel web UI.
9. Deploy your changes.
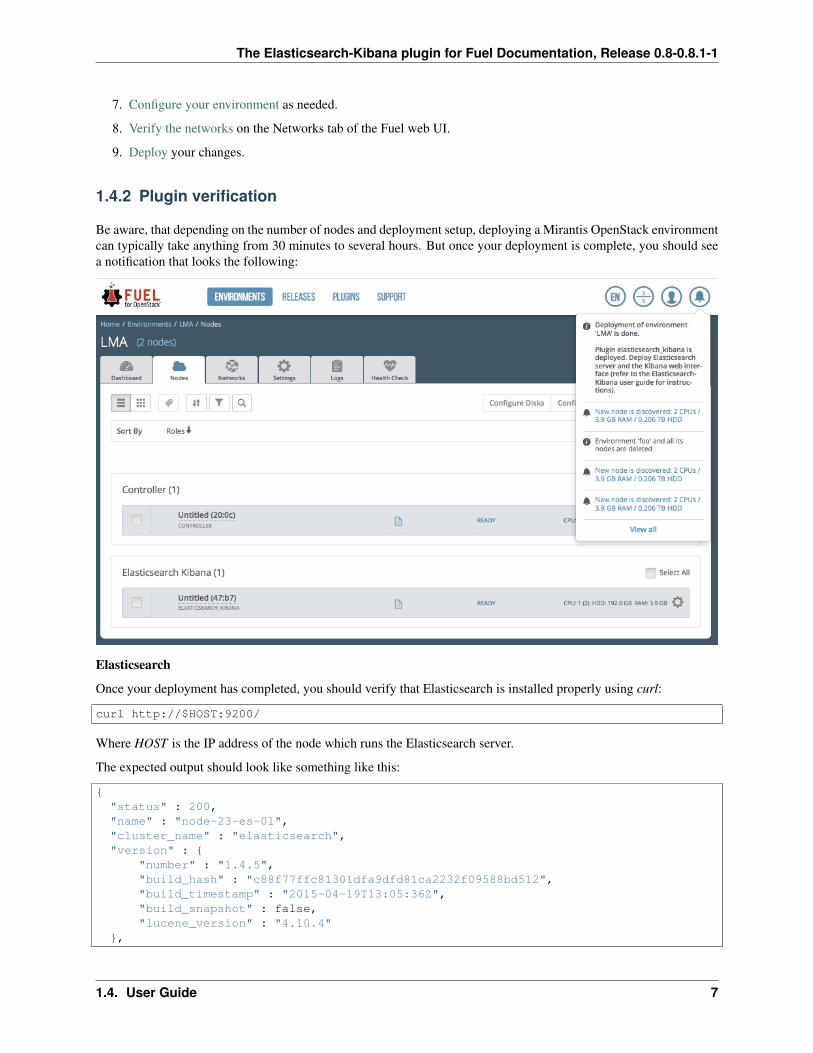
1.4.2 Plugin verification
Be aware, that depending on the number of nodes and deployment setup, deploying a Mirantis OpenStack environmentcan typically take anything from 30 minutes to several hours. But once your deployment is complete, you should seea notification that looks the following:
Elasticsearch
Once your deployment has completed, you should verify that Elasticsearch is installed properly using curl:
curl http://$HOST:9200/
Where HOST is the IP address of the node which runs the Elasticsearch server.
The expected output should look like something like this:
{"status" : 200,"name" : "node-23-es-01","cluster_name" : "elasticsearch","version" : {
"number" : "1.4.5","build_hash" : "c88f77ffc81301dfa9dfd81ca2232f09588bd512","build_timestamp" : "2015-04-19T13:05:36Z","build_snapshot" : false,"lucene_version" : "4.10.4"
},
1.4. User Guide 7
The Elasticsearch-Kibana plugin for Fuel Documentation, Release 0.8-0.8.1-1
"tagline" : "You Know, for Search"}
Note: You can retrieve the IP address where Elasticsearch-Kibana is installed using the fuel command line:
[root@fuel ~]# fuel nodesid | status | name | cluster | ip | ... | roles | ...---|----------|----------------|-----------|-----|----------------------|----14 | ready | ctrl | 8 | 10.20.0.8 | ... | controller | ...13 | ready | lma | 8 | 10.20.0.4 | ... | elasticsearch_kibana | ...
Kibana
Kibana is installed with two dashboards. One for the logs and one for the OpenStack notifications.
Each dashboard provides a single pane of glass and search capabilities for all the logs and all the notifications. Notethat in the LMA Collector settings, it is possible to tag the logs by environment name so that you can distiguish whichlogs (and notifications) where created by environment name.
As for Elasticsearch, you should verify that Kibana is properly installed through checking its URL:
http://$HOST:80/
Where HOST is the IP address of the node where Kibana has been installed. By default, you will be redirected to theLogs Dashboard.
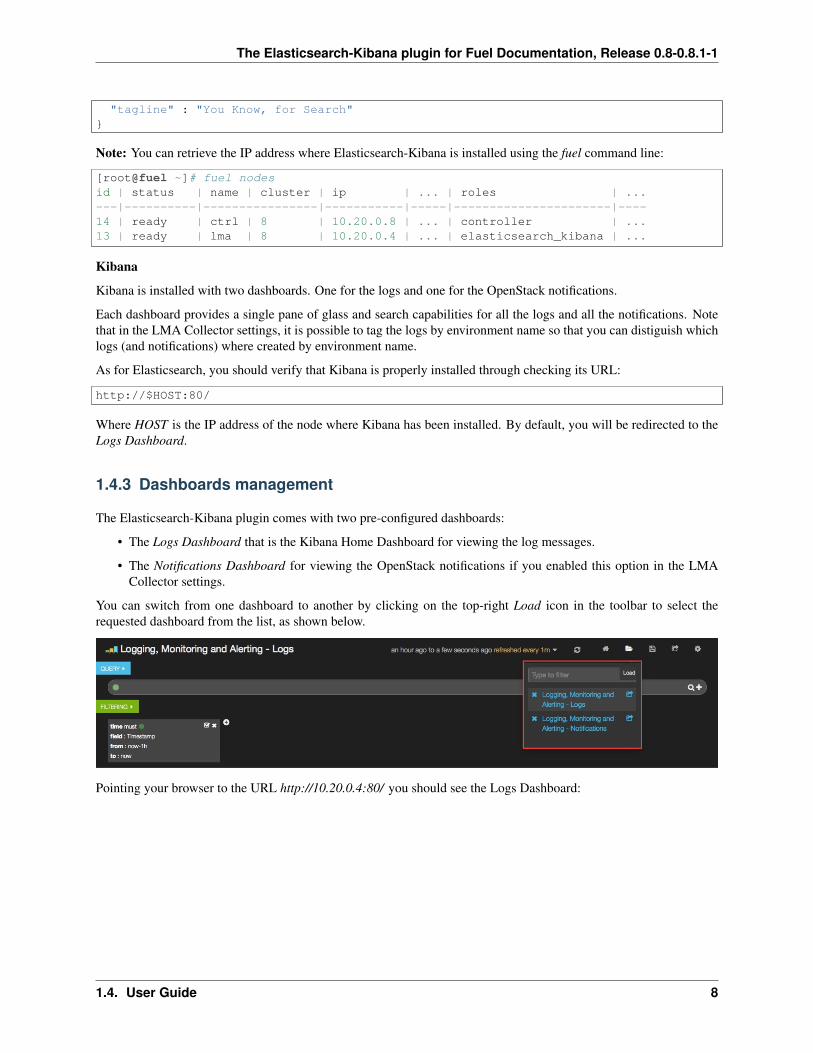
1.4.3 Dashboards management
The Elasticsearch-Kibana plugin comes with two pre-configured dashboards:
• The Logs Dashboard that is the Kibana Home Dashboard for viewing the log messages.
• The Notifications Dashboard for viewing the OpenStack notifications if you enabled this option in the LMACollector settings.
You can switch from one dashboard to another by clicking on the top-right Load icon in the toolbar to select therequested dashboard from the list, as shown below.
Pointing your browser to the URL http://10.20.0.4:80/ you should see the Logs Dashboard:
1.4. User Guide 8
The Elasticsearch-Kibana plugin for Fuel Documentation, Release 0.8-0.8.1-1
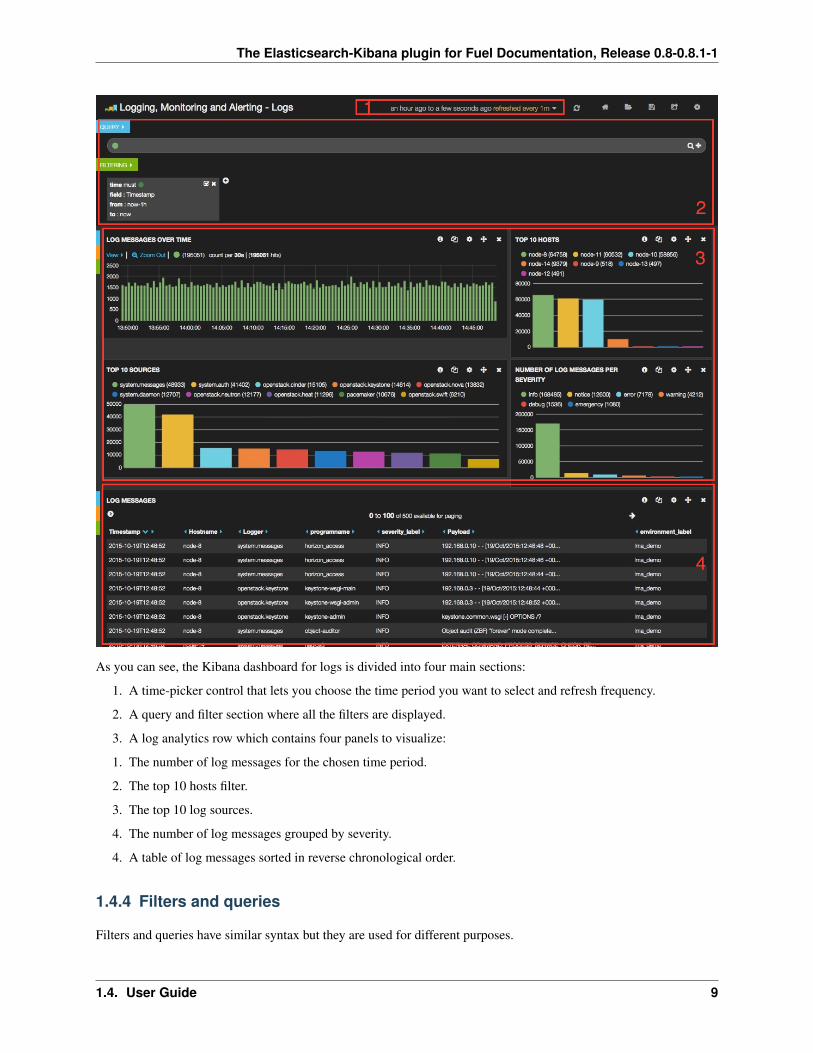
As you can see, the Kibana dashboard for logs is divided into four main sections:
1. A time-picker control that lets you choose the time period you want to select and refresh frequency.
2. A query and filter section where all the filters are displayed.
3. A log analytics row which contains four panels to visualize:
1. The number of log messages for the chosen time period.
2. The top 10 hosts filter.
3. The top 10 log sources.
4. The number of log messages grouped by severity.
4. A table of log messages sorted in reverse chronological order.
1.4.4 Filters and queries
Filters and queries have similar syntax but they are used for different purposes.
1.4. User Guide 9

The Elasticsearch-Kibana plugin for Fuel Documentation, Release 0.8-0.8.1-1
• The filters are used to restrict what is displayed in the dashboard.
• The queries are used for free-text search.
You can also combine multiple queries and compare their results. To further filter the log messages based, for example,on the deployment_id, you need to expand a log entry and then select the deployment_id field by clicking on themagnifying glass icon as shown below.
This will apply a new filter in the dashboard.
Filtering will work for any field that has been indexed for the log entries that are displayed in the dashboard.
Filters and queries can also use wildcards wich can be conbined with field names like in:
programname: <name>*
For example, to display only the Nova logs you could enter:
programname:nova*
in the query textbox like shown below.
1.4. User Guide 10

The Elasticsearch-Kibana plugin for Fuel Documentation, Release 0.8-0.8.1-1
You can also specify multiple queries to compare different data sets.
To add a new query, click on the + sign at the right-end of the query textbox and enter a new search query.
The resulting filtering should appear comparing those logs that are in ERROR versus those that are not as shown below.
1.4.5 Troubleshooting
If you get no data in the Kibana dashboards, follow these troubleshoot tips.
1.4. User Guide 11
The Elasticsearch-Kibana plugin for Fuel Documentation, Release 0.8-0.8.1-1
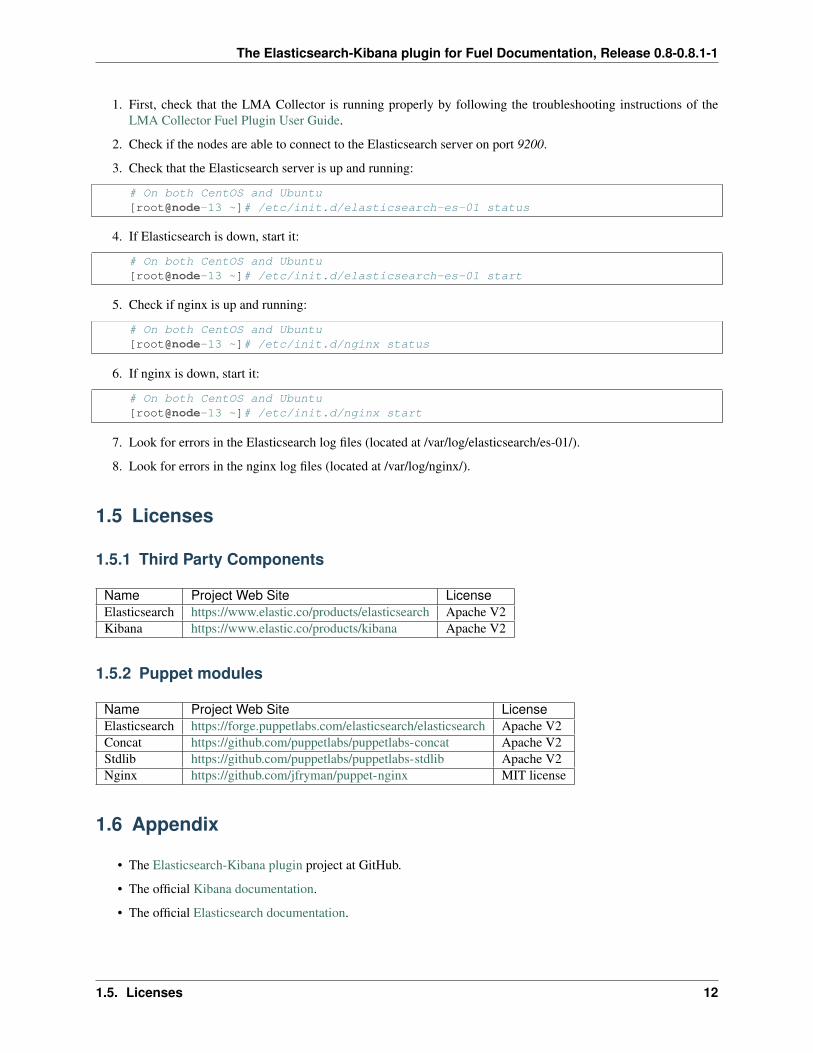
1. First, check that the LMA Collector is running properly by following the troubleshooting instructions of theLMA Collector Fuel Plugin User Guide.
2. Check if the nodes are able to connect to the Elasticsearch server on port 9200.
3. Check that the Elasticsearch server is up and running:
# On both CentOS and Ubuntu[root@node-13 ~]# /etc/init.d/elasticsearch-es-01 status
4. If Elasticsearch is down, start it:
# On both CentOS and Ubuntu[root@node-13 ~]# /etc/init.d/elasticsearch-es-01 start
5. Check if nginx is up and running:
# On both CentOS and Ubuntu[root@node-13 ~]# /etc/init.d/nginx status
6. If nginx is down, start it:
# On both CentOS and Ubuntu[root@node-13 ~]# /etc/init.d/nginx start
7. Look for errors in the Elasticsearch log files (located at /var/log/elasticsearch/es-01/).
8. Look for errors in the nginx log files (located at /var/log/nginx/).
1.5 Licenses
1.5.1 Third Party Components
Name Project Web Site LicenseElasticsearch https://www.elastic.co/products/elasticsearch Apache V2Kibana https://www.elastic.co/products/kibana Apache V2
1.5.2 Puppet modules
Name Project Web Site LicenseElasticsearch https://forge.puppetlabs.com/elasticsearch/elasticsearch Apache V2Concat https://github.com/puppetlabs/puppetlabs-concat Apache V2Stdlib https://github.com/puppetlabs/puppetlabs-stdlib Apache V2Nginx https://github.com/jfryman/puppet-nginx MIT license
1.6 Appendix
• The Elasticsearch-Kibana plugin project at GitHub.
• The official Kibana documentation.
• The official Elasticsearch documentation.
1.5. Licenses 12

CHAPTER
TWO
INDICES AND TABLES
• search
13