the financial system of the eu 25 - finance...
TRANSCRIPT
1
The Financial System of the EU 25 Franklin Allen* Laura Bartiloro Oskar Kowalewski Finance Department The Wharton School University of Pennsylvania e-mail: [email protected]
Research Department Banca d’Italia e-mail: [email protected]
Finance Department Leon Kozminski Academy of Entrepreneurship and Management e-mail: [email protected]
Abstract
We present an overview of the financial structure of the enlarged European Union
with 25 countries. We start by describing the financial system development in all
member states since 1995, and then compare the structure between the old and new
countries. Using financial measures we document the prevailing substantial
differences in the financial structure between new and old member states after the
enlargement in 2004. Finally, we compare the financial structures of an enlarged EU
with those of the United States and Japan.
*Corresponding author: Finance Department, Wharton School, University of Pennsylvania, Philadelphia, Pa 19104. Phone: 215-898-3629, fax:215-573-2007, e-mail: [email protected]. We would like to thank Luc Laeven and Philipp Hartmann for useful comments.
2
1. INTRODUCTION
Despite the political and economic convergence in the European Union (EU-25), the
financial structures of different members remain diverse. This paper compares the
development of EU-25 countries’ financial structures from 1995-2004. We stress that
the enlargement of the EU in May 2004, by changing the institutional setting, has
reduced some divergences across Europe, but increased others. However, it has not
significantly altered the structure of the European financial system. There is
significant inertia with regard to financial structure: important and persistent
transformations of financial systems can take more than a decade. On the other hand
convergence in the financial systems of EU-25 countries is important, in particular for
the future prospects of an eventual enlargement of the European Monetary Union
because a common monetary policy may be hard to implement when the financial
structures of member states are diverse.
We start our analysis in section 2, by outlining the economic background of
the enlarged European Union (EU-25) and the main characteristics of its financial
system. In section 3 we describe the banking system, while in section 4 we focus on
the development of capital markets. In section 5 we present other important players in
the financial system, such as the insurance industry and pension and investment funds.
Finally, section 6 concludes by summarizing and making a comparison of the EU-25
financial system with that in the US and Japan.
2. THE BACKGROUND
The New Member States (NMS), except Cyprus and Malta, have been engaged in a
transition process involving institutional and structural changes that have turned
former planned economies into market economies. The main economic indicators still
show that significant differences exist between NMS and Old Member States (OMS).
The level of financial development, understood as the size and efficiency of the
sector, may strongly affect the pace of future economic growth1.
1 For a survey of the theory and empirical research on finance and growth, see Levine (1997).
3
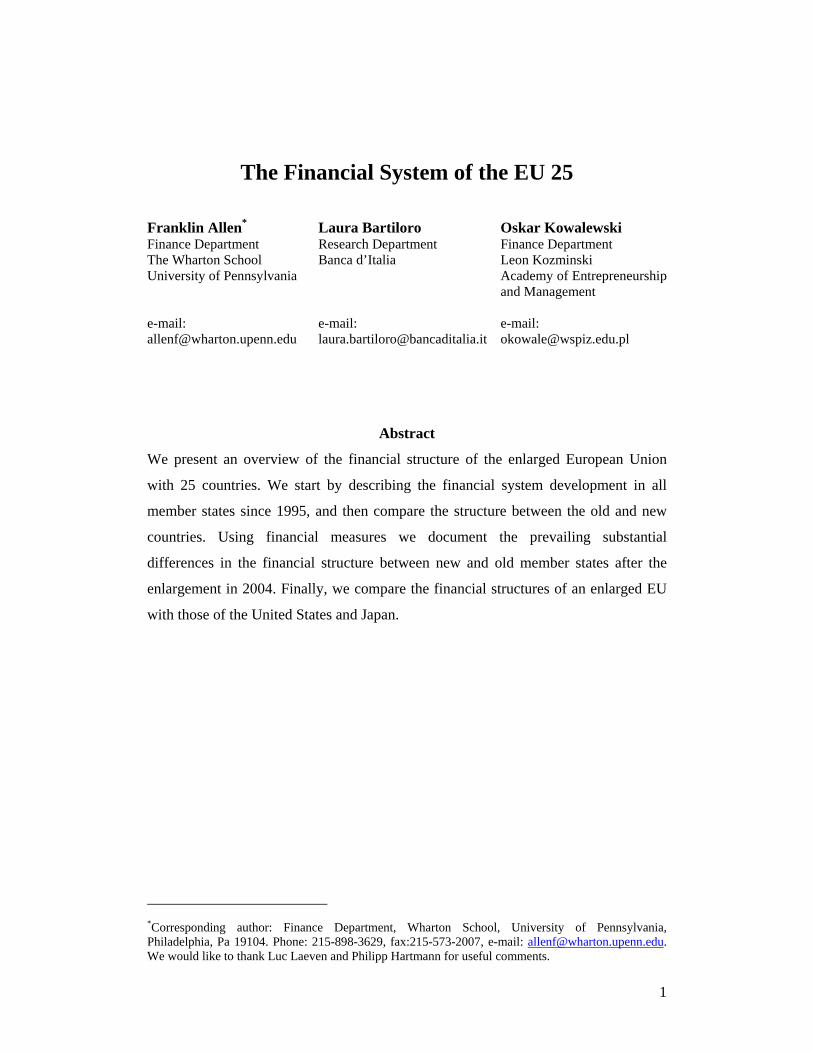
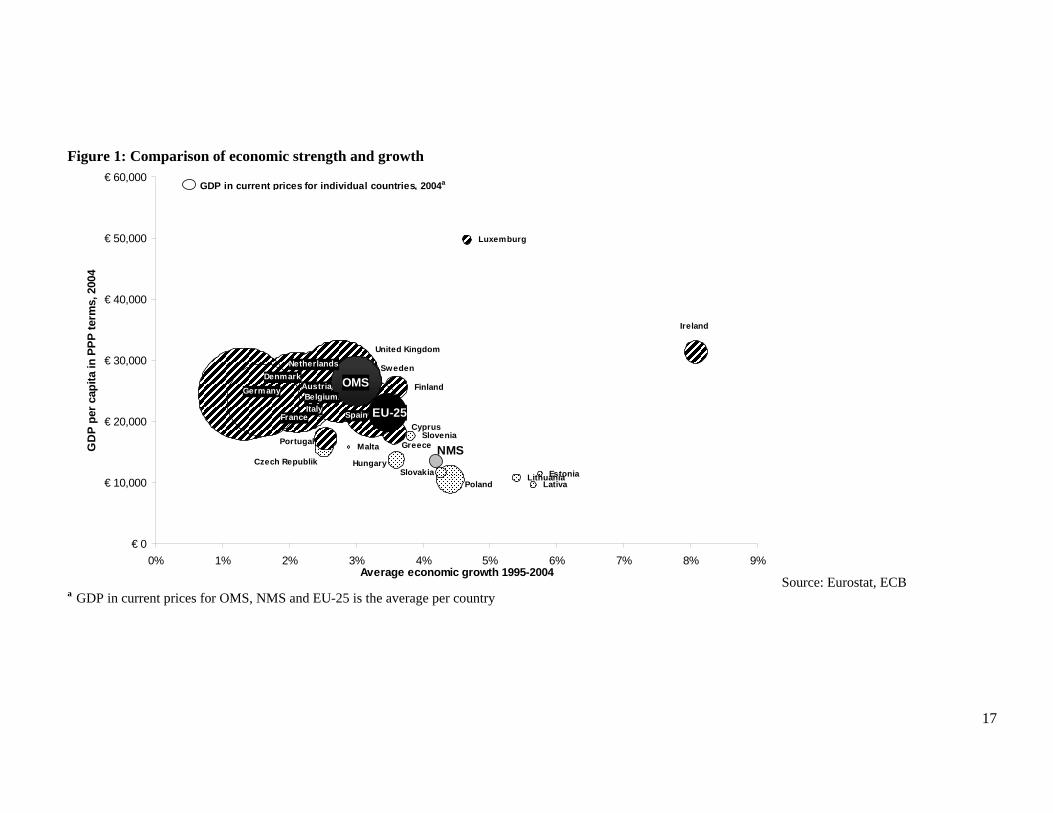
In terms of GDP the NMS are rather small compared to the OMS. At the end
of 2004 the GDP at current exchange rates of the NMS was €441 billion or only 5 per
cent of the value of that of OMS countries with €9,307 billion in 2004 (Figure 1).
The average growth rate has been higher in the NMS than in the OMS over the
years 1995-2004. As a result the NMS have made substantial progress catching up in
real terms and have reached 54 per cent of the EU-25 average purchasing power per
capita income in 2004. An exception is the Czech Republic, which had the lowest
growth rate among the NMS. The country underwent a severe financial crisis caused
by bad loan problems in 1996 (Bonin and Wachtel, 2004). The case of the Czech
Republic, however, confirms the theoretical prediction that countries’ economic
growth and financial system development are closely linked. Thus, we believe that the
financial system development of the EU-25 is essential for economic growth and for
further convergence of the market structures within the EU-25.
The structure of the European financial system has changed significantly in
the last few years. This change can mainly be attributed to the liberalization of
international capital movements in order to create a common regulatory framework
for the provision of financial services as part of the European Internal Market.
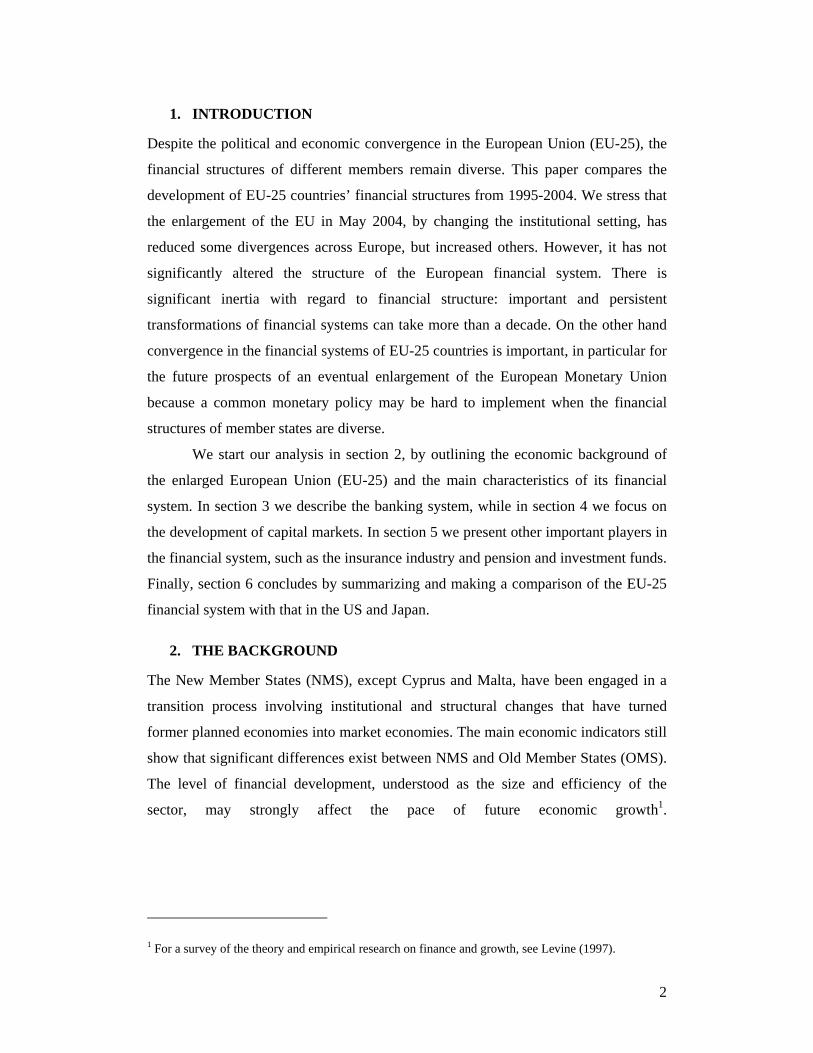
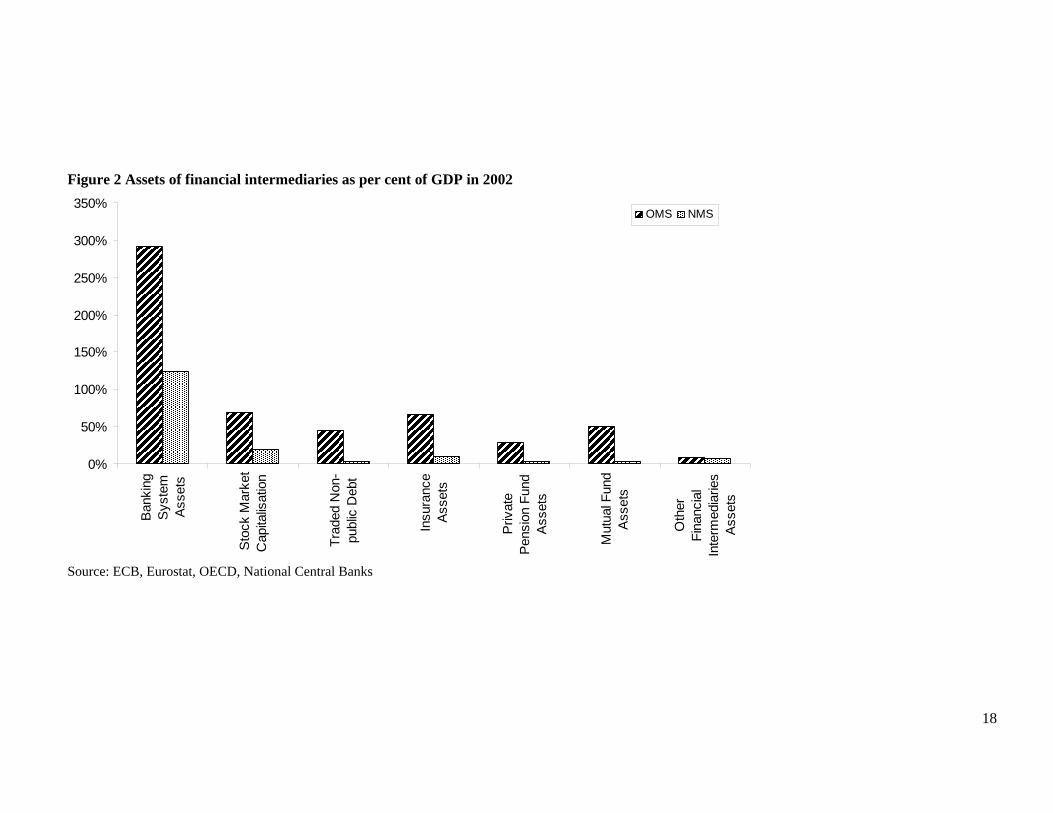
In comparison with the NMS, the OMS have a relatively deep and broad
financial services industry, with total assets amounting to 558 per cent of GDP in
2002, while in the NMS it was only 170 per cent (Figure 2).
Credit institutions lead the EU-25 financial system, with a relative share in
total assets of 52 per cent in the OMS and 73 per cent in the NMS. Apparently, the
EU-25 financial structure is mainly bank based, yet in some member states capital
markets are also quite important. In the OMS other financial intermediaries have been
gaining in importance in the last decade, but their position compared to credit
institutions is still relatively small in terms of assets to GDP. Although the dominance
of credit institutions has been declining in the NMS too, the role of insurance
companies, investment funds and pension funds is still underdeveloped in comparison
to the OMS. Therefore, credit institutions followed by capital markets are the main
elements of the European financial system. Hence, in the next two sections we will
focus on the banking system and the capital markets in the EU-25.
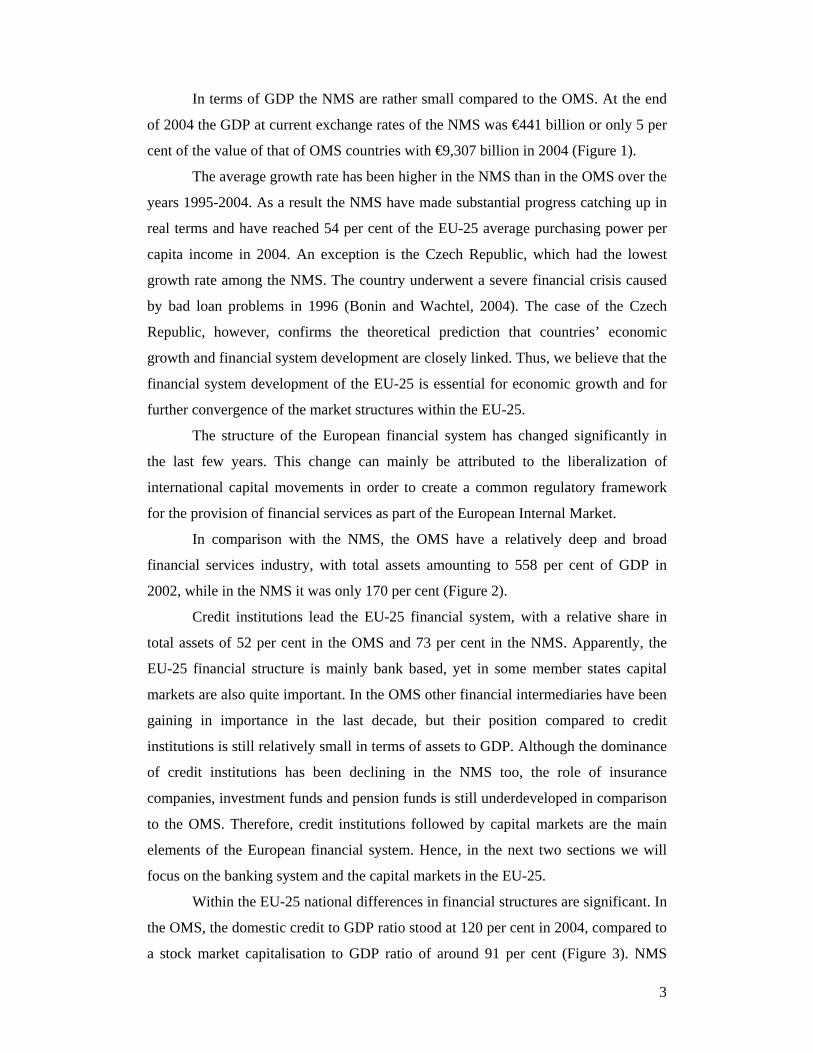
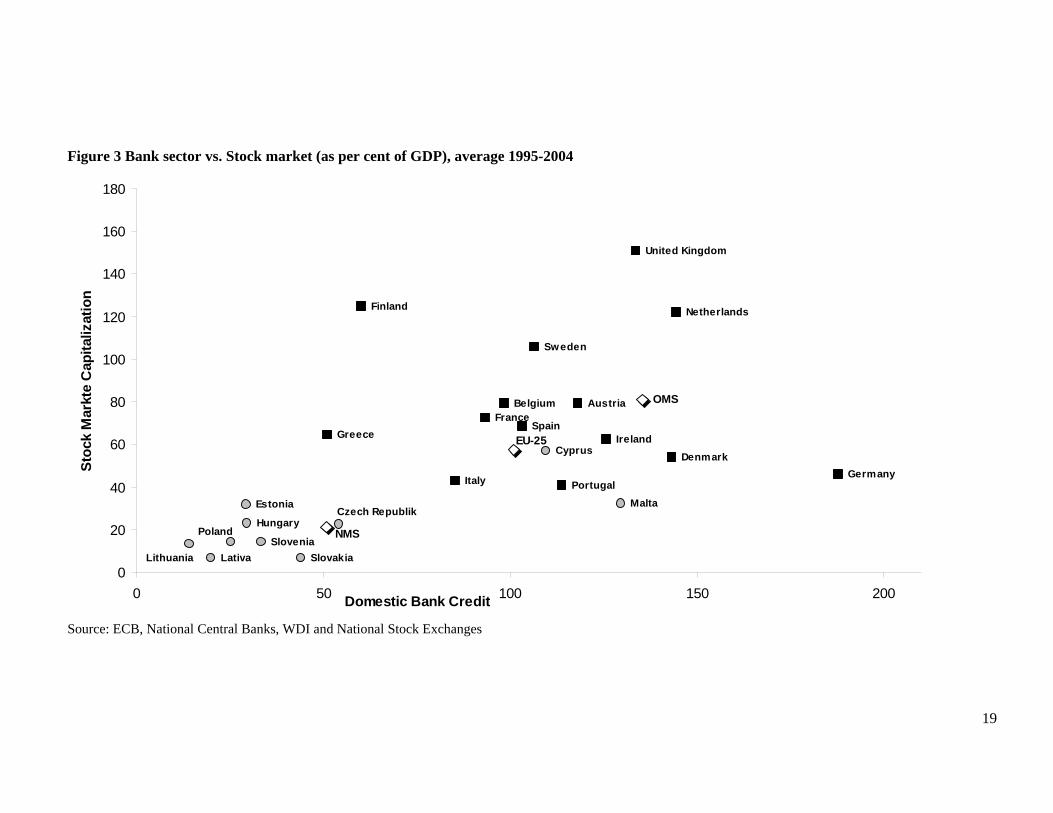
Within the EU-25 national differences in financial structures are significant. In
the OMS, the domestic credit to GDP ratio stood at 120 per cent in 2004, compared to
a stock market capitalisation to GDP ratio of around 91 per cent (Figure 3). NMS
4
have significantly smaller credit to GDP and stock market capitalisation ratios. Bank
based financial structures remain predominant within the EU-25, the exceptions being
the United Kingdom and since recently Finland, Sweden and the Netherlands, which
have moved towards market based financial systems.
Rajan and Zingales (2003) analyzed European financial system characteristics
over the last two decades. Based on their findings they came to the conclusion that in
the last two decades the EU-25 financial system moved away from a bank based
towards a market based financial system. They identified the process of monetary and
financial integration as the underlying cause of these changes. Rajan and Zingales
(2003) argue therefore that the ongoing process will likely result in the evolution of a
more market based system over time.
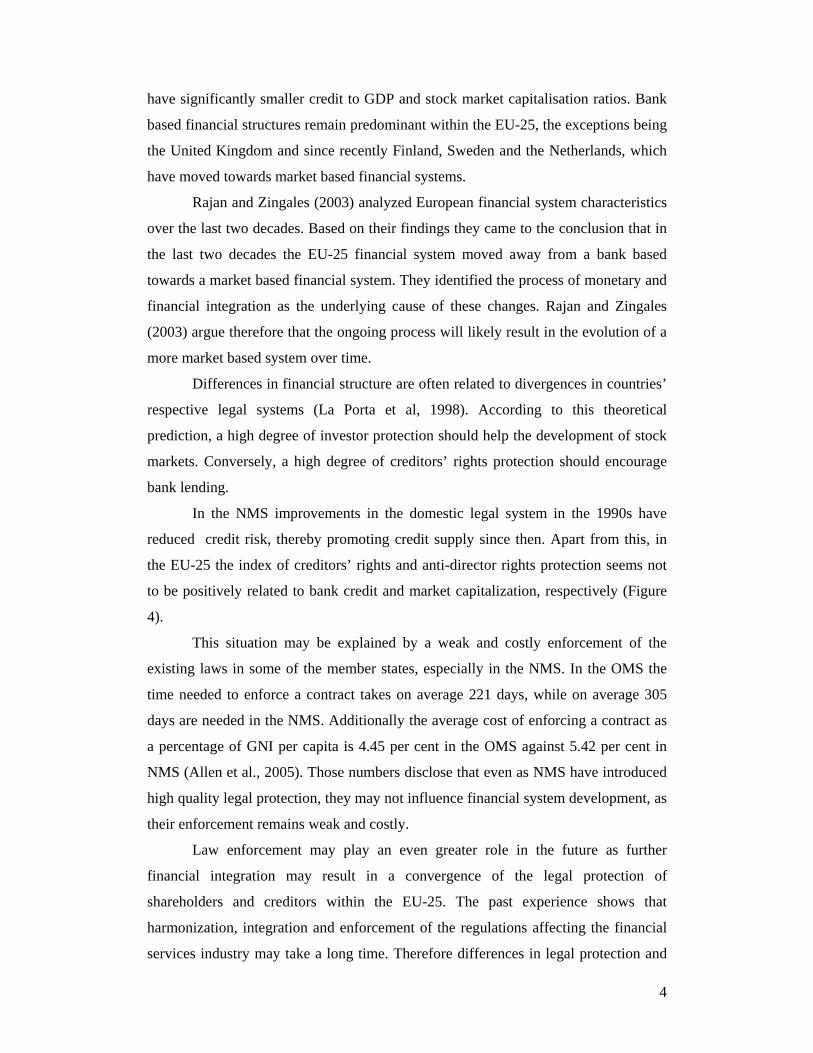
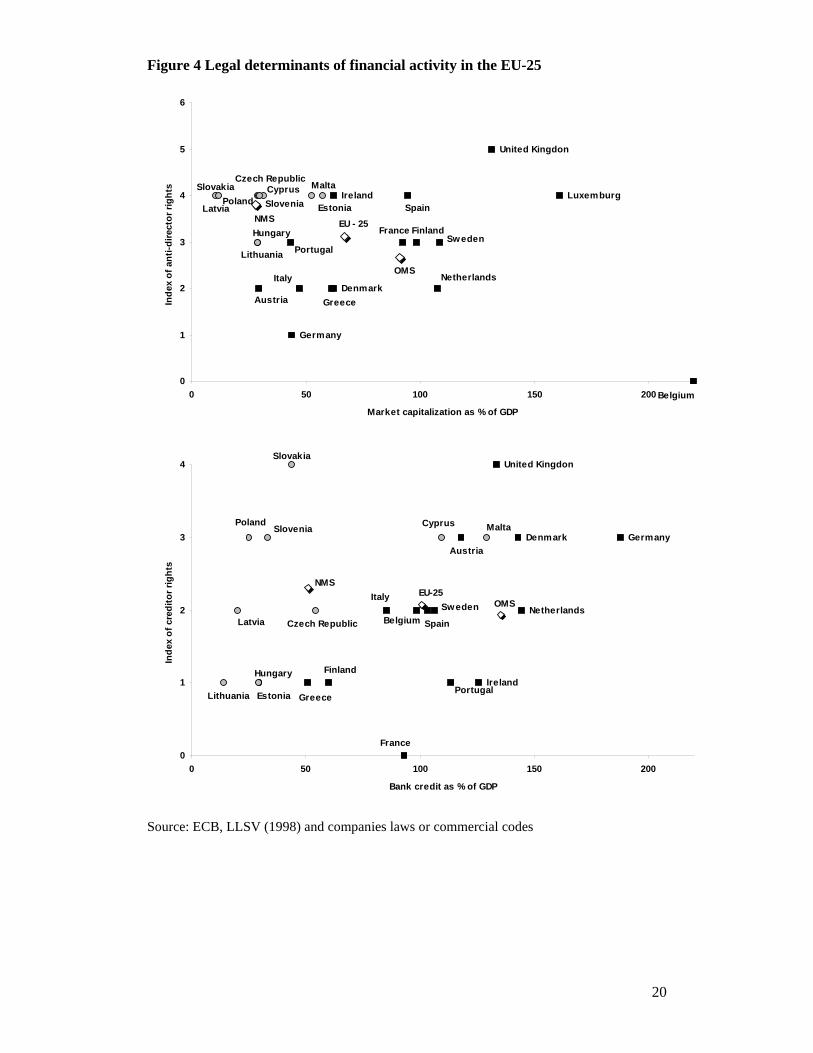
Differences in financial structure are often related to divergences in countries’
respective legal systems (La Porta et al, 1998). According to this theoretical
prediction, a high degree of investor protection should help the development of stock
markets. Conversely, a high degree of creditors’ rights protection should encourage
bank lending.
In the NMS improvements in the domestic legal system in the 1990s have
reduced credit risk, thereby promoting credit supply since then. Apart from this, in
the EU-25 the index of creditors’ rights and anti-director rights protection seems not
to be positively related to bank credit and market capitalization, respectively (Figure
4).
This situation may be explained by a weak and costly enforcement of the
existing laws in some of the member states, especially in the NMS. In the OMS the
time needed to enforce a contract takes on average 221 days, while on average 305
days are needed in the NMS. Additionally the average cost of enforcing a contract as
a percentage of GNI per capita is 4.45 per cent in the OMS against 5.42 per cent in
NMS (Allen et al., 2005). Those numbers disclose that even as NMS have introduced
high quality legal protection, they may not influence financial system development, as
their enforcement remains weak and costly.
Law enforcement may play an even greater role in the future as further
financial integration may result in a convergence of the legal protection of
shareholders and creditors within the EU-25. The past experience shows that
harmonization, integration and enforcement of the regulations affecting the financial
services industry may take a long time. Therefore differences in legal protection and
5
as a consequence in financial structures may prevail for some time in the EU-25, yet
we may expect a further integration of laws and financial structures in the long run.
3. THE BANKING SYSTEM
As already shown, the financial system of the EU-25 is mainly bank based, due to the
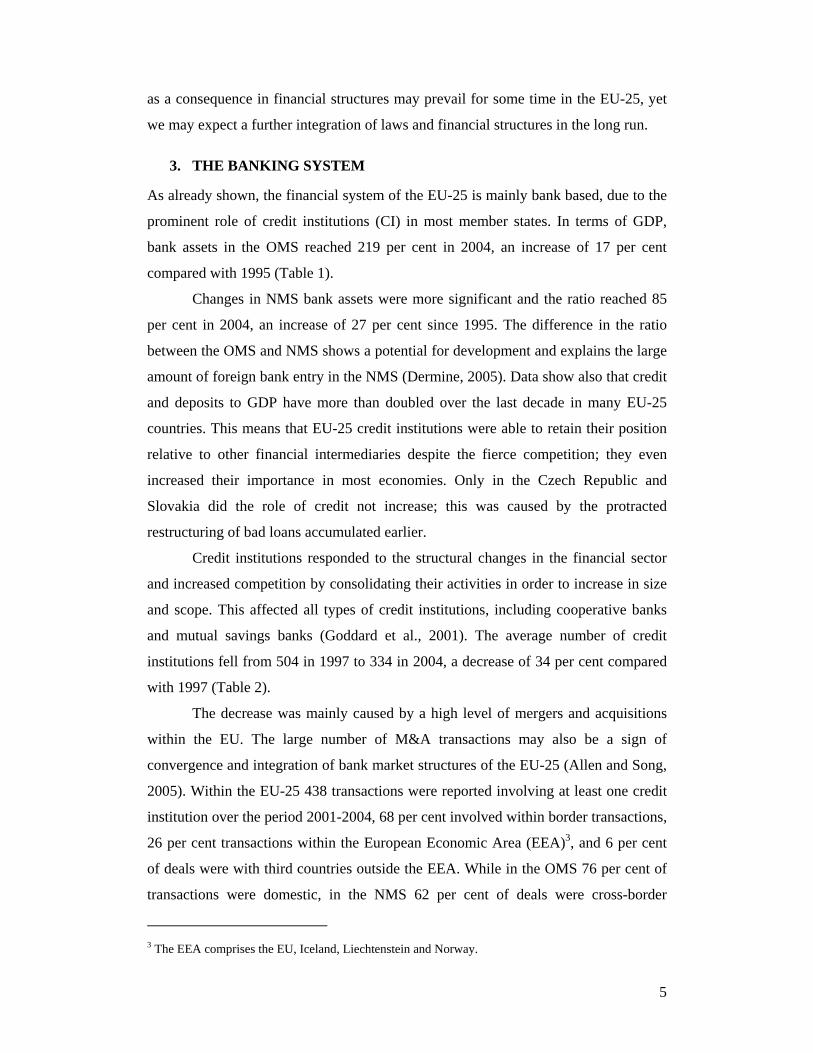
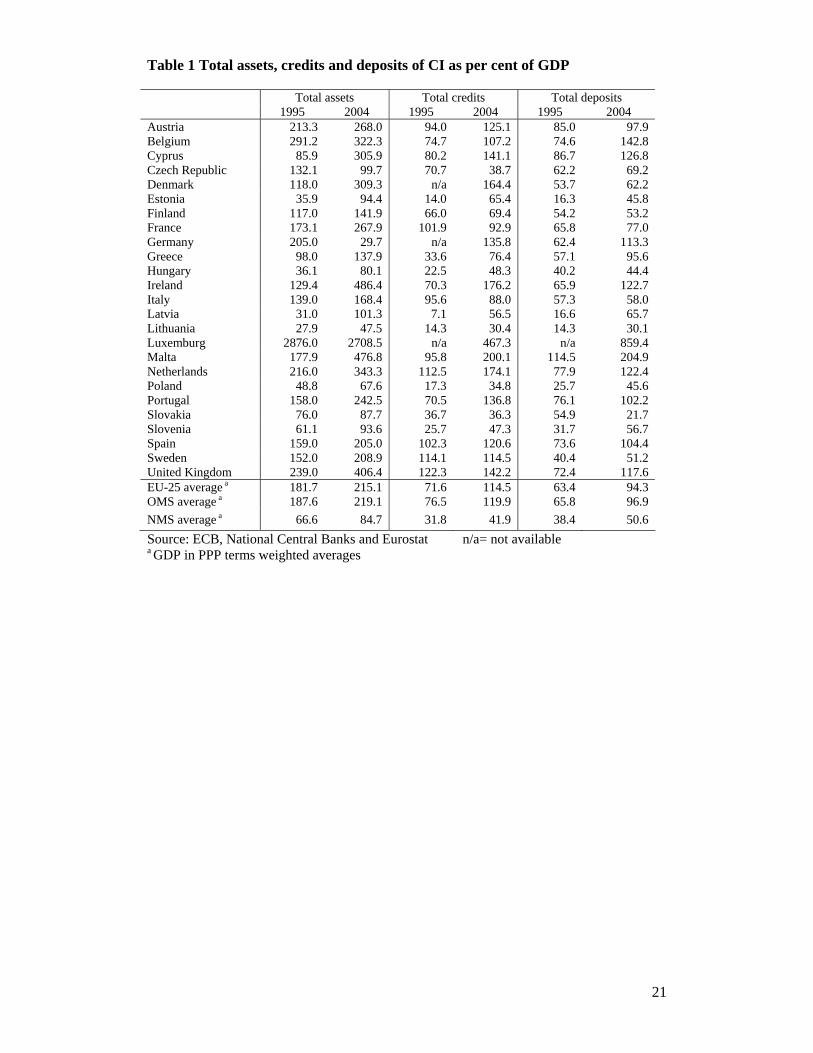
prominent role of credit institutions (CI) in most member states. In terms of GDP,
bank assets in the OMS reached 219 per cent in 2004, an increase of 17 per cent
compared with 1995 (Table 1).
Changes in NMS bank assets were more significant and the ratio reached 85
per cent in 2004, an increase of 27 per cent since 1995. The difference in the ratio
between the OMS and NMS shows a potential for development and explains the large
amount of foreign bank entry in the NMS (Dermine, 2005). Data show also that credit
and deposits to GDP have more than doubled over the last decade in many EU-25
countries. This means that EU-25 credit institutions were able to retain their position
relative to other financial intermediaries despite the fierce competition; they even
increased their importance in most economies. Only in the Czech Republic and
Slovakia did the role of credit not increase; this was caused by the protracted
restructuring of bad loans accumulated earlier.
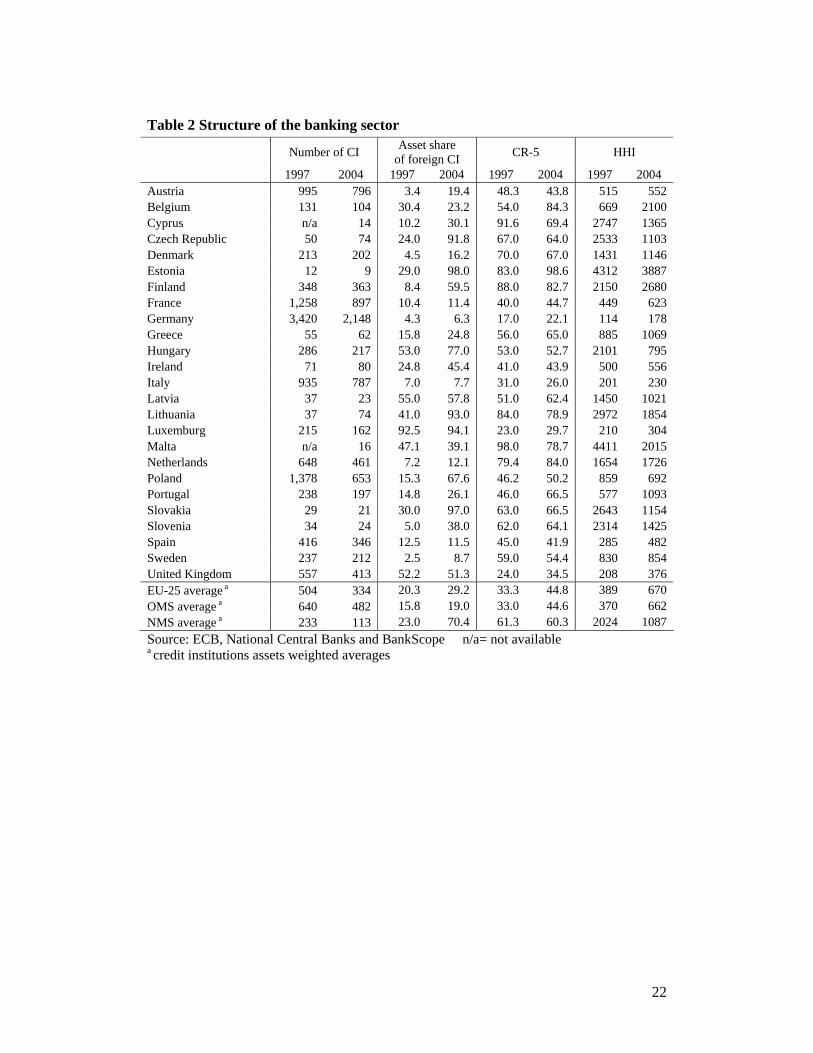
Credit institutions responded to the structural changes in the financial sector
and increased competition by consolidating their activities in order to increase in size
and scope. This affected all types of credit institutions, including cooperative banks
and mutual savings banks (Goddard et al., 2001). The average number of credit
institutions fell from 504 in 1997 to 334 in 2004, a decrease of 34 per cent compared
with 1997 (Table 2).
The decrease was mainly caused by a high level of mergers and acquisitions
within the EU. The large number of M&A transactions may also be a sign of
convergence and integration of bank market structures of the EU-25 (Allen and Song,
2005). Within the EU-25 438 transactions were reported involving at least one credit
institution over the period 2001-2004, 68 per cent involved within border transactions,
26 per cent transactions within the European Economic Area (EEA)3, and 6 per cent
of deals were with third countries outside the EEA. While in the OMS 76 per cent of
transactions were domestic, in the NMS 62 per cent of deals were cross-border
3 The EEA comprises the EU, Iceland, Liechtenstein and Norway.
6
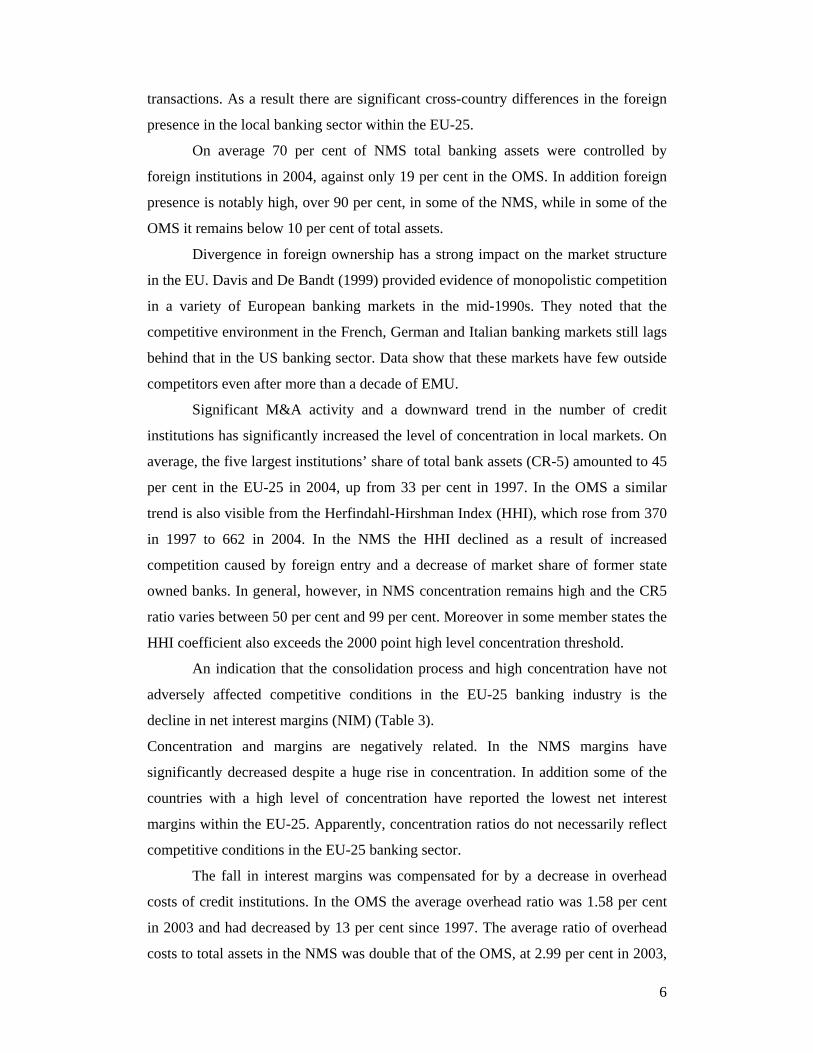
transactions. As a result there are significant cross-country differences in the foreign
presence in the local banking sector within the EU-25.
On average 70 per cent of NMS total banking assets were controlled by
foreign institutions in 2004, against only 19 per cent in the OMS. In addition foreign
presence is notably high, over 90 per cent, in some of the NMS, while in some of the
OMS it remains below 10 per cent of total assets.
Divergence in foreign ownership has a strong impact on the market structure
in the EU. Davis and De Bandt (1999) provided evidence of monopolistic competition
in a variety of European banking markets in the mid-1990s. They noted that the
competitive environment in the French, German and Italian banking markets still lags
behind that in the US banking sector. Data show that these markets have few outside
competitors even after more than a decade of EMU.
Significant M&A activity and a downward trend in the number of credit
institutions has significantly increased the level of concentration in local markets. On
average, the five largest institutions’ share of total bank assets (CR-5) amounted to 45
per cent in the EU-25 in 2004, up from 33 per cent in 1997. In the OMS a similar
trend is also visible from the Herfindahl-Hirshman Index (HHI), which rose from 370
in 1997 to 662 in 2004. In the NMS the HHI declined as a result of increased
competition caused by foreign entry and a decrease of market share of former state
owned banks. In general, however, in NMS concentration remains high and the CR5
ratio varies between 50 per cent and 99 per cent. Moreover in some member states the
HHI coefficient also exceeds the 2000 point high level concentration threshold.
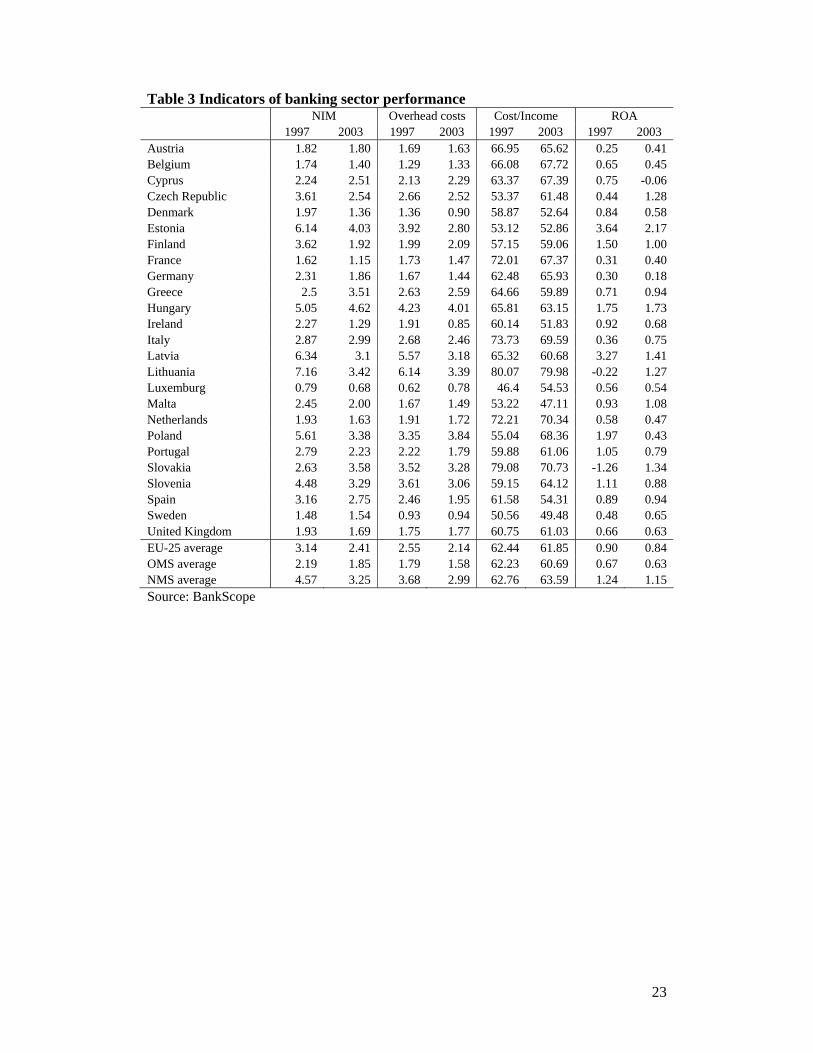
An indication that the consolidation process and high concentration have not
adversely affected competitive conditions in the EU-25 banking industry is the
decline in net interest margins (NIM) (Table 3).
Concentration and margins are negatively related. In the NMS margins have
significantly decreased despite a huge rise in concentration. In addition some of the
countries with a high level of concentration have reported the lowest net interest
margins within the EU-25. Apparently, concentration ratios do not necessarily reflect
competitive conditions in the EU-25 banking sector.
The fall in interest margins was compensated for by a decrease in overhead
costs of credit institutions. In the OMS the average overhead ratio was 1.58 per cent
in 2003 and had decreased by 13 per cent since 1997. The average ratio of overhead
costs to total assets in the NMS was double that of the OMS, at 2.99 per cent in 2003,
7
yet it had decreased already by 19 per cent since 1997. These differences suggest
considerable scale inefficiencies and large potential for future improvement in the
NMS banking industry.
The deterioration of interest margins and high overhead costs was responsible
for the fact that the average cost-to-income ratio in the NMS, at 63.59 per cent,
exceeded that of OMS. While in the NMS the average cost-to-income ratio slightly
increased, in the OMS there has been an increase in efficiency. In the OMS the
average cost-to-income ratio fell from 62.23 per cent in 1997 to 60.69 per cent in
2003.
The trends in income and costs are reflected in the data for profitability.
However, the results for return on assets (ROA) present a quite mixed picture within
the EU. The overall ROA in the EU-25 decreased moderately, to 0.84 per cent in 2003
from 0.90 per cent in 1997. On average there was, both in the OMS and NMS, a
downward trend in profitability. Given that the level of return in NMS countries was
quite high the decline is understandable, while in the OMS the decrease may be
related to the worsening of macroeconomic conditions. The downward trend in bank
performance also reflects increased competition in the financial sector despite the
overall fall in the number of credit institutions. However, the ratio shows a significant
cross-country variability within the EU-25.
Concluding, even if the European financial system is mainly bank based, there
are significant cross-country differences, especially between the OMS and NMS. In
the OMS the number of credit institutions is larger and thus the level of concentration
is lower than in the NMS despite the continuing consolidation trend. In the last decade
in the NMS most of the M&A transactions were cross-border, while in the OMS they
were mainly domestic. As a consequence the level of foreign ownership in the NMS
is significant, while in the OMS it remains moderately low. In general, foreign
ownership had a positive impact on the risk management and performance of
domestic credit institutions, as well as on the stability of the NMS financial systems.
Trends in the structure of the banking industry are reflected in the performance
of credit institutions. While interest margins remained higher in the NMS over the
period 1997-2003, the overhead costs were significantly lower in the OMS. Trends in
performance of credit institutions suggest that the structural changes described above
have not dampened competition. Differences in the credit institutions’ performance
reflect the persisting potential for development in the NMS, which has attracted
8
foreign banks in the past. However, in the long term foreign banks’ expectations
about local bank profitability may be too high, which could induce them to compete
aggressively on the local market (Dermine, 2005). Besides a shift from subsidiaries
into branches may present quite a challenge for local and host supervisors. A foreign
branch may have systemic importance in the host country even though it often
represents only a modest share of a foreign credit institution’s total operations. As a
consequence potential conflicts may emerge as far as country controls in supervision
and responsibility in safeguarding financial stability are concerned. While, we expect
a convergence in performance and later on also of the structures of the EU-25 banking
industry, we stress that enhanced coordination, regulation and information-sharing
within the integrated financial system are needed in order to prevent eventual cross-
border spillovers due to bank failures.
4. THE CAPITAL MARKETS
In transition economies the privatization of former state-owned companies has
induced the development of equity markets: that’s how the first stock exchanges
appeared in the Czech Republic, Slovakia and Poland in 1991. The further
development of stock markets was strongly influenced by the privatization strategies
of the government in individual countries. A strategy of mass privatization schemes
was employed in the Czech Republic, Slovakia and Lithuania. In these countries the
stock markets quickly comprised a large number of companies. However, the extent
of the equity markets restrained their liquidity. In addition the widespread ownership
limited transparency and the enforcement of corporate governance mechanisms. Thus,
few companies were traded and most companies were later delisted. As an example in
the Czech Republic 81 per cent of companies were delisted between 1995 and 1997
and the number of listed companies declined from 1,716 in 1995 to 55 in 2004.
A different strategy to privatization and stock market development was
adopted in Estonia, Hungary, Latvia, Poland and Slovenia. In these countries the
government decided to privatize only financially sound and recognized companies via
the stock market. In addition minority stakes in the privatized companies were often
sold prior to the initial public offering to a foreign strategic investor. This provided
additional security for the government for the success for the planned public offer and
guaranteed also a higher price for the remaining shares. As a result, the equity markets
in those countries have been growing gradually and provided adequate liquidity for
9
the listed companies. In Poland, in contrast to the Czech Republic, the number of
listed companies grew steadily from 9 at the end of 1991 to 250 in 2004. However,
many of those companies are currently closely held by strategic investors and
therefore their equity is not always liquid. Thus, even if some market development
has emerged, stock exchanges are still not very developed in Central and Eastern
European countries. In fact, when we look at the average size of the stock exchange in
NMS it amounts to a third of that of OMS.
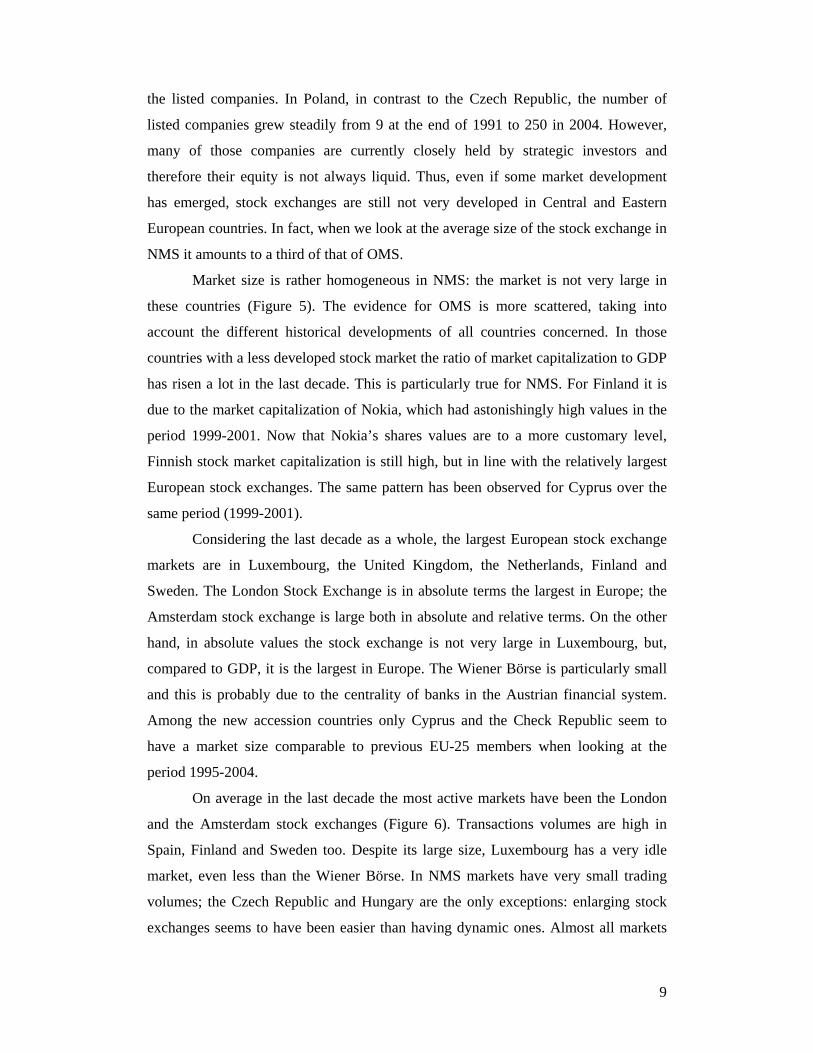
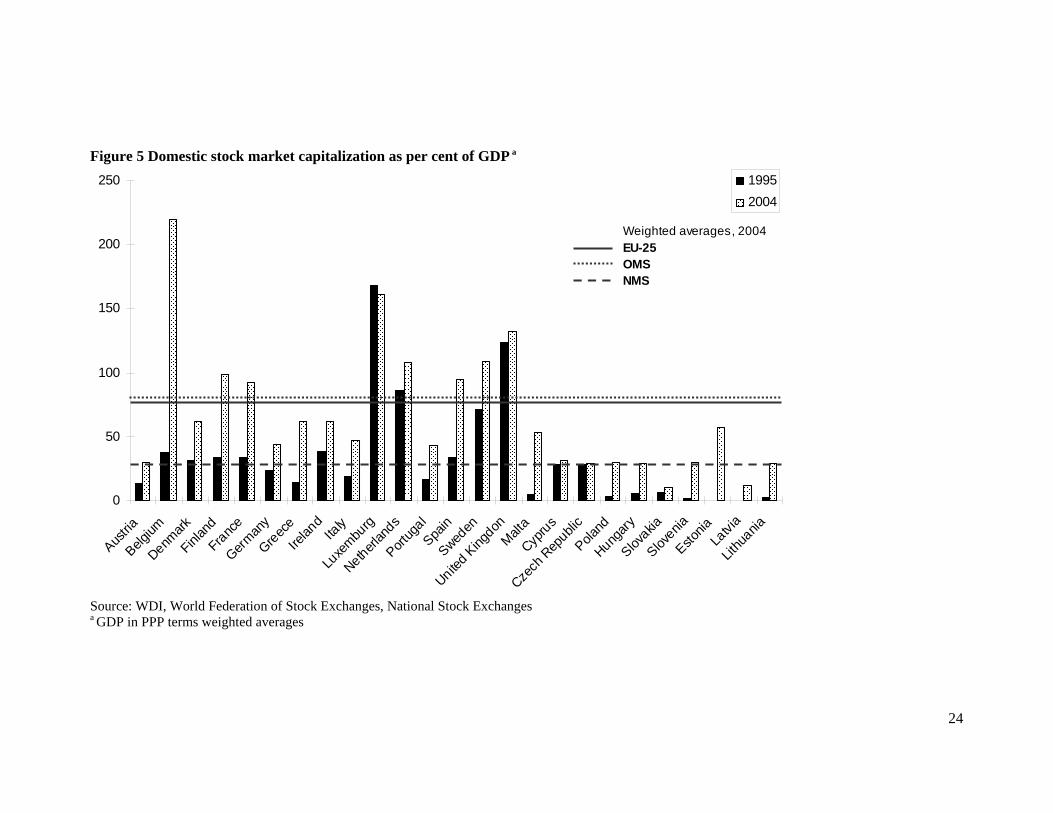
Market size is rather homogeneous in NMS: the market is not very large in
these countries (Figure 5). The evidence for OMS is more scattered, taking into
account the different historical developments of all countries concerned. In those
countries with a less developed stock market the ratio of market capitalization to GDP
has risen a lot in the last decade. This is particularly true for NMS. For Finland it is
due to the market capitalization of Nokia, which had astonishingly high values in the
period 1999-2001. Now that Nokia’s shares values are to a more customary level,
Finnish stock market capitalization is still high, but in line with the relatively largest
European stock exchanges. The same pattern has been observed for Cyprus over the
same period (1999-2001).
Considering the last decade as a whole, the largest European stock exchange
markets are in Luxembourg, the United Kingdom, the Netherlands, Finland and
Sweden. The London Stock Exchange is in absolute terms the largest in Europe; the
Amsterdam stock exchange is large both in absolute and relative terms. On the other
hand, in absolute values the stock exchange is not very large in Luxembourg, but,
compared to GDP, it is the largest in Europe. The Wiener Börse is particularly small
and this is probably due to the centrality of banks in the Austrian financial system.
Among the new accession countries only Cyprus and the Check Republic seem to
have a market size comparable to previous EU-25 members when looking at the
period 1995-2004.
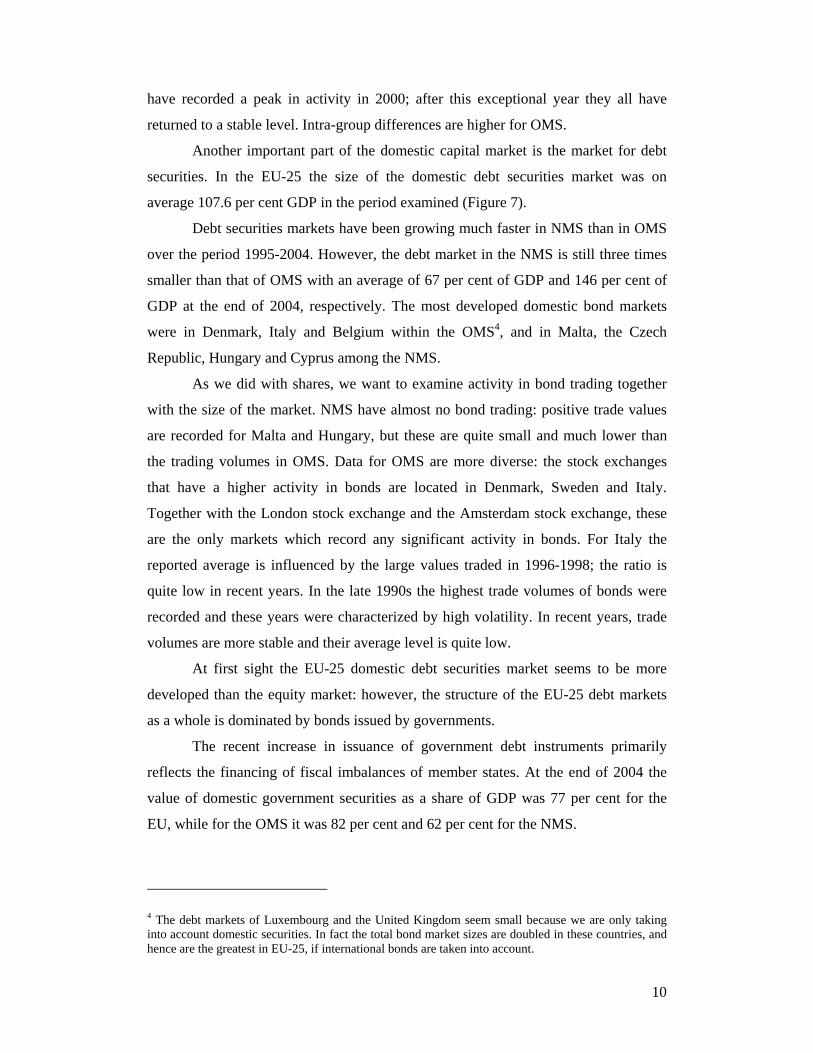
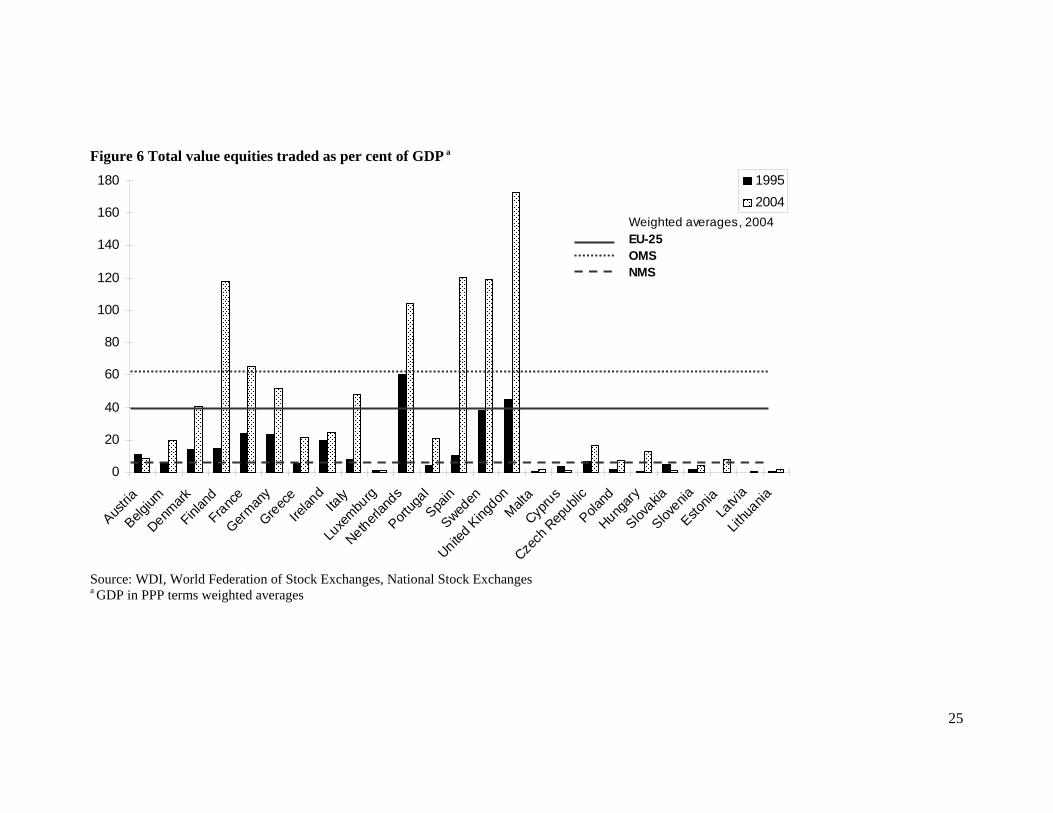
On average in the last decade the most active markets have been the London
and the Amsterdam stock exchanges (Figure 6). Transactions volumes are high in
Spain, Finland and Sweden too. Despite its large size, Luxembourg has a very idle
market, even less than the Wiener Börse. In NMS markets have very small trading
volumes; the Czech Republic and Hungary are the only exceptions: enlarging stock
exchanges seems to have been easier than having dynamic ones. Almost all markets
10
have recorded a peak in activity in 2000; after this exceptional year they all have
returned to a stable level. Intra-group differences are higher for OMS.
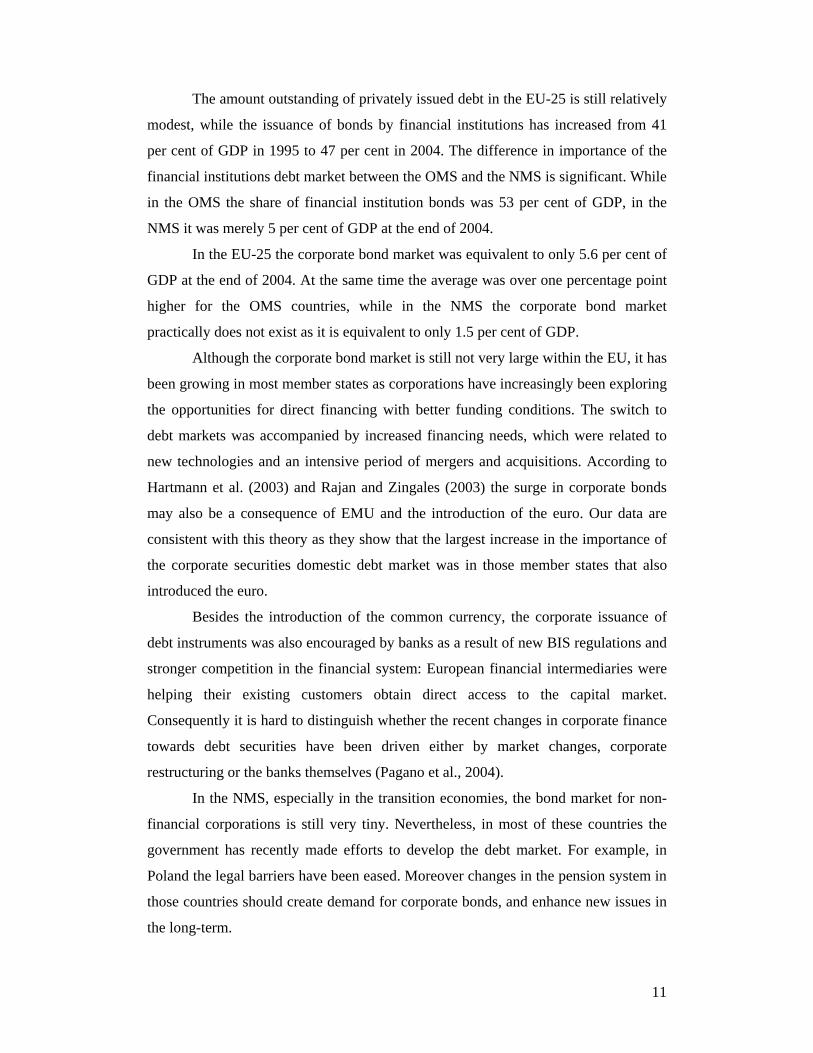
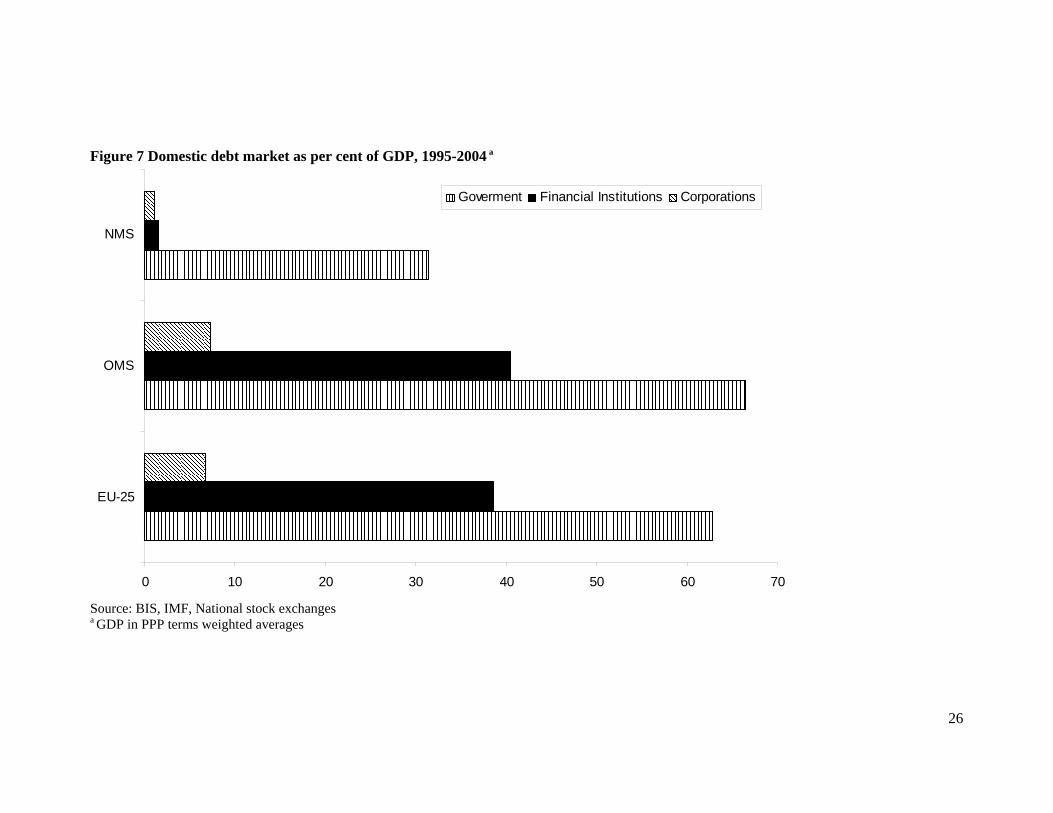
Another important part of the domestic capital market is the market for debt
securities. In the EU-25 the size of the domestic debt securities market was on
average 107.6 per cent GDP in the period examined (Figure 7).
Debt securities markets have been growing much faster in NMS than in OMS
over the period 1995-2004. However, the debt market in the NMS is still three times
smaller than that of OMS with an average of 67 per cent of GDP and 146 per cent of
GDP at the end of 2004, respectively. The most developed domestic bond markets
were in Denmark, Italy and Belgium within the OMS4, and in Malta, the Czech
Republic, Hungary and Cyprus among the NMS.
As we did with shares, we want to examine activity in bond trading together
with the size of the market. NMS have almost no bond trading: positive trade values
are recorded for Malta and Hungary, but these are quite small and much lower than
the trading volumes in OMS. Data for OMS are more diverse: the stock exchanges
that have a higher activity in bonds are located in Denmark, Sweden and Italy.
Together with the London stock exchange and the Amsterdam stock exchange, these
are the only markets which record any significant activity in bonds. For Italy the
reported average is influenced by the large values traded in 1996-1998; the ratio is
quite low in recent years. In the late 1990s the highest trade volumes of bonds were
recorded and these years were characterized by high volatility. In recent years, trade
volumes are more stable and their average level is quite low.
At first sight the EU-25 domestic debt securities market seems to be more
developed than the equity market: however, the structure of the EU-25 debt markets
as a whole is dominated by bonds issued by governments.
The recent increase in issuance of government debt instruments primarily
reflects the financing of fiscal imbalances of member states. At the end of 2004 the
value of domestic government securities as a share of GDP was 77 per cent for the
EU, while for the OMS it was 82 per cent and 62 per cent for the NMS.
4 The debt markets of Luxembourg and the United Kingdom seem small because we are only taking into account domestic securities. In fact the total bond market sizes are doubled in these countries, and hence are the greatest in EU-25, if international bonds are taken into account.
11
The amount outstanding of privately issued debt in the EU-25 is still relatively
modest, while the issuance of bonds by financial institutions has increased from 41
per cent of GDP in 1995 to 47 per cent in 2004. The difference in importance of the
financial institutions debt market between the OMS and the NMS is significant. While
in the OMS the share of financial institution bonds was 53 per cent of GDP, in the
NMS it was merely 5 per cent of GDP at the end of 2004.
In the EU-25 the corporate bond market was equivalent to only 5.6 per cent of
GDP at the end of 2004. At the same time the average was over one percentage point
higher for the OMS countries, while in the NMS the corporate bond market
practically does not exist as it is equivalent to only 1.5 per cent of GDP.
Although the corporate bond market is still not very large within the EU, it has
been growing in most member states as corporations have increasingly been exploring
the opportunities for direct financing with better funding conditions. The switch to
debt markets was accompanied by increased financing needs, which were related to
new technologies and an intensive period of mergers and acquisitions. According to
Hartmann et al. (2003) and Rajan and Zingales (2003) the surge in corporate bonds
may also be a consequence of EMU and the introduction of the euro. Our data are
consistent with this theory as they show that the largest increase in the importance of
the corporate securities domestic debt market was in those member states that also
introduced the euro.
Besides the introduction of the common currency, the corporate issuance of
debt instruments was also encouraged by banks as a result of new BIS regulations and
stronger competition in the financial system: European financial intermediaries were
helping their existing customers obtain direct access to the capital market.
Consequently it is hard to distinguish whether the recent changes in corporate finance
towards debt securities have been driven either by market changes, corporate
restructuring or the banks themselves (Pagano et al., 2004).
In the NMS, especially in the transition economies, the bond market for non-
financial corporations is still very tiny. Nevertheless, in most of these countries the
government has recently made efforts to develop the debt market. For example, in
Poland the legal barriers have been eased. Moreover changes in the pension system in
those countries should create demand for corporate bonds, and enhance new issues in
the long-term.
12
A recent trend in European capital markets is the creation of stock exchange
networks. A very large European market is forming: its main components are
Euronext, connecting the Amsterdam, Paris, Brussels and Lisbon stock exchanges,
and the Nordic and Baltic stock exchange, which combines the markets of Sweden,
Finland, Estonia, Latvia, Lithuania and Denmark. Stock exchange networks satisfy
the needs of companies seeking to broaden their shareholders’ base and raise capital
beyond local markets. Together with the need of setting up a new or renewed stock
exchange, this is what has probably induced the small countries of Estonia, Latvia,
and Lithuania to join the Nordic and Baltic alliance. It may be the only way they
could avoid an almost sure decline of the local market, undermined by the migration
of the best companies through cross-listing in international markets5.
Another characteristic of stock exchange networks is their higher efficiency,
granted by extended trading hours, the possibility of remote membership, lower
transaction costs and greater information. All in all, an integrated European stock
exchange market should lead to greater efficiency. In the future network externalities
may contribute significantly to increasing EU-25 capital markets size and activity.
5. OTHER FINANCIAL INTERMEDIARIES
The enlargement of the EU-25 accelerated the process of financial integration and is
already evident in the banking industry and capital markets. The developments in
each of these main areas have been summarized above emphasizing that the extent of
integration across markets is not uniform. The variation is also visible in the case of
other financial intermediaries, as mentioned in Section 2.
Insurance companies, investment funds and pension funds are notable features of
OMS financial system, while in the NMS these financial institutions have only
marginal importance. In part this is due to the breadth of activities and the historically
strong position of universal banks. The development of these financial intermediaries
is strongly connected with the problem of aging of the population and ongoing
pension system reforms.
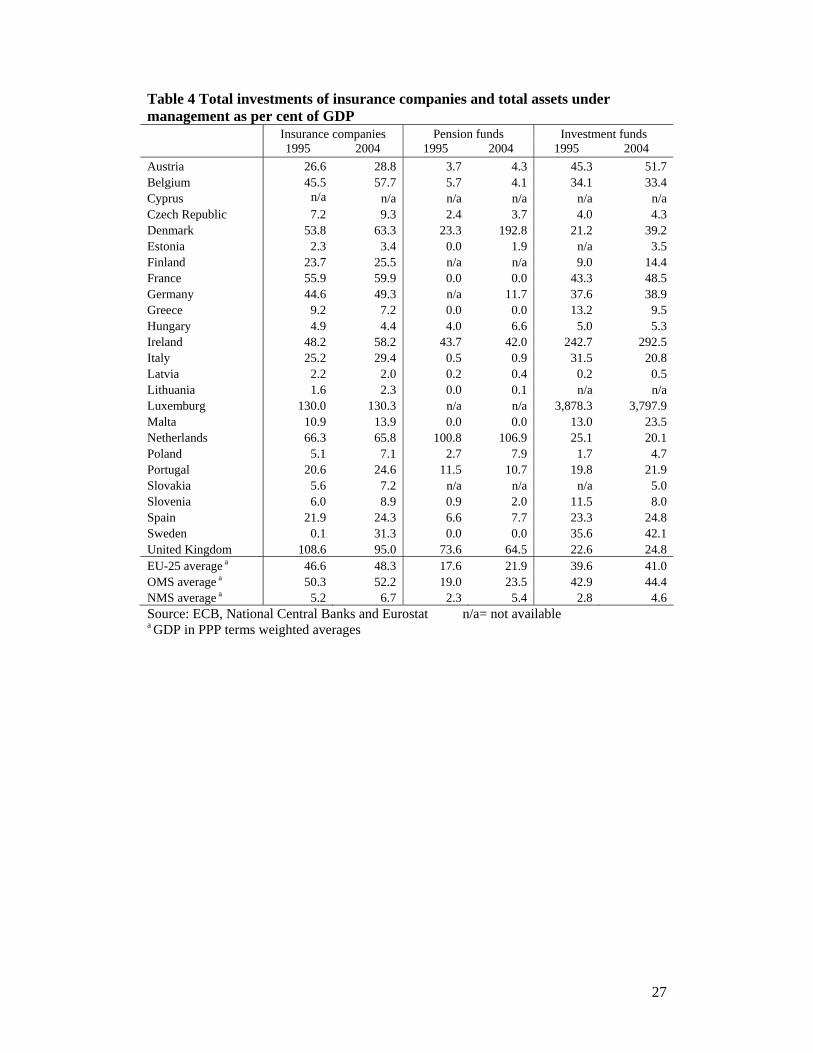
Within the EU-25 the total investments of insurance companies represented 48
per cent of GDP in 2004, an increase of almost 10 percent since 2001 (Table 4). In the
5 In the last decade, before the emergence of the European stock exchange networks, cross listing on US stock exchanges was very popular among export-oriented and high tech European companies.
13
NMS the increase was especially significant: total investments of insurance
companies increased almost 30 per cent over the years 2001-2004, mainly because of
an increase in spending on life insurance. The per capita life insurance premiums have
increased by 37 per cent since 1996 and were equal to €776 in 2003, yet there is a lot
of cross-country variation in the average life insurance spending in the EU-25 (Swiss
Re, 2000; 2004).
Also investment and pension funds have become a powerful factor in the
financial services industry as a result of changes in saving patterns caused by
demographic changes and decreasing yields on bank deposits and other traditional
financial instruments.
Owing to favorable tax treatment the assets under management by investment
and pensions funds are already comparable in some countries to those of the banking
industry. The growth of investment and pensions funds was encouraged also by credit
institutions and insurance companies as asset management makes up an important
share of their non-interest income. Nevertheless, there is still significant potential for
growth as weighted average assets managed within the EU-25 without Ireland and
Luxembourg amount only to 29 per cent of GDP in 2004 compared to 70 per cent in
the US.
6. CONCLUSIONS
In drawing our conclusions about the characteristics of the European financial system,
we will briefly compare it to the financial structures in the US and in Japan.
Our first conclusion, in line with related work on financial structures (Allen et
al., 2004; Hartmann et al., 2003; Allen and Gale, 2000), is that the European financial
system is bank based: in the US, on the contrary, the capital markets (including the
bond markets) play the larger role in the financial system. The importance of banks in
the US economy is lower than in Japan and even smaller than that of NMS. Thus, the
US financial structure may be described as market based. The Japanese financial
structure can be described as bank based, even if the size of the stock market is larger
than that of the banking system: in fact the capital market is still underdeveloped, if
we exclude public bonds.
Also considering the results of previous studies, we conclude that the main
characteristics of the financial structure of the EU-25 have not changed in spite of the
enlargement. In addition our results show that the existing differences in financial
14
structures across the most important economic regions and countries have not been
affected in the last decades.
Among the characteristics of the banking system, we have observed a high
level of concentration, in particular in NMS. This has led to an increase in the
European average, that is higher than the value of the concentration index for the US
and Japan, probably because of a low level of integration and low foreign bank
penetration in OMS. The recent wave of European cross-border mergers and
acquisitions may lead to a decrease in the concentration of the banking sector in the
long term.
Regardless of this high concentration, the European banking sector, in
particular in OMS, is more efficient than that of the US. The factors behind the high
inefficiency of the banking sector in the NMS and US are quite different: in the NMS
the ratios were driven mainly by the transition economies, because of high interest
rates, due to bad loans, and high overheads costs, caused by excessive employment
and low application of modern technology6. In the US the high overhead costs are
mainly due to a still large number of small banks despite the merger boom of the last
decade. The significant difference in net margins between the US and other countries
reflects divergences in bank activity, rather than in efficiency or competition. In the
US banks are more focused on short-term and consumer financing, while in Europe
and Japan they are more commercially based and long-term oriented.
In Japan the degree of concentration in the banking sector is between the level
observed in the US and the EU-25. However, the efficiency of Japanese banks is close
to that of the OMS. The Japanese banks have the lowest overhead costs, while net
margins are comparable to the lowest in the OMS. Thus, we may deduce that the level
of banks efficiency is affected by the degree of financial development.
As anticipated, the stock and debt market in the US is more active and
efficient than that in the EU-25 or Japan. The Japanese stock market is larger than the
European one, but smaller, less active and efficient than the average stock market in
the OMS. Moreover, the structure of the debt market varies significantly across
countries: in Japan and EU-25 it is dominated by government bonds, while in the US
6 Recent studies present evidence that the efficiency of banks has been increasing in transition economies in recent years see Bonin et al. (2005) and Fries and Tacit (2005).
15
the larger role is played by financial bonds. The European corporate debt market is
the smallest when compared to the US and Japan.
We conclude the comparison examining insurance corporations and pension
funds, both of which have grown in recent years in all countries. Nonetheless,
insurance corporations are more important in Japan and, to a lesser extent, in the US.
In the EU-25 insurance corporations and pension funds still don’t play a significant
role, particularly in the NMS, due to the importance of public pension schemes.
Summing up, financial systems differ a lot among countries; divergences are
higher when comparing European countries with the US and Japan. Differences
emerge also between OMS and NMS. The important differences between the OMS
and the NMS need to be taken account of by policymakers going forward. For
example, prior to the enlargement foreign banks played an important role in very few
countries. Thus policies such as supervision by a bank’s home regulator could be
readily justified. Now, however, with foreign banks important in so many countries
this is not so clear. On the other hand, as NMS catch up and converge, differences in
financial systems may decline. On the other hand they may not. We strongly believe
that more research on European financial integration is needed in order to understand
the structural changes in the financial system caused by the accession of new member
states.
16
LITERATURE
Allen, Franklin, Laura Bartiloro and Oskar Kowalewski (2005), ‘The financial system of the EU 25’, WFIC Working Paper 05-44, Wharton Financial Institution Center, University of Pennsylvania. Allen, Franklin and Wei-Ling Song (2005), ‘Financial Integration and EMU’, European Financial Management, 11 (1), 7-24. Allen, Franklin, Michael K. F. Chui and Angela Maddaloni (2004), ‘Financial systems in Europe, the USA, and Asia’, Oxford Review of Economic Policy, 20 (4), 490-508. Allen, Franklin and Douglas Gale (2000), Comparing financial systems, Cambridge, MA: The MIT Press. Bonin, John P. and Paul Wachtel (2004), ‘Dealing with financial fragility in transition economies’, BOFIT Discussion Paper 22, Bank of Finland. Bonin, John P., Iftekhar Hasan and Paul Wachtel (2005), ‘Bank performance, efficiency and ownership in transition countries’, Journal of Banking and Finance, 29, 31-53. Davis, E. Philip and Olivier de Bandt, (1999), ‘A cross-country comparison of market structures in European banking’, ECB Working Paper No. 7, September. Dermine, Jean (2005), ‘European banking integration: don’t put the cart before the horse, paper presented at the conference on ‘Cross-border banking, regulatory challenges’, Federal Reserve Bank of Chicago, October. Fries, Steven and Anita Taci (2005), ‘Cost efficiency of banks in transition: Evidence from 289 banks in 15 post-communist countries’, Journal of Banking and Finance, 29, 55-81. Goddard, John, Philip Molyneux and John O. S. Wilson (2001), European banking: efficiency, technology, and growth, Chichester: John Wiley and Sons, Ltd. Hartmann, Philipp, Angela Maddaloni and Simone Manganelli (2003), ‘The Euro-area financial system: structure, integration, and policy initiatives’, Oxford Review of Economic Policy, 19 (1), 180–213. La Porta Rafael, Florencio Lopez-de-Silanes, Andrei Shleifer and Robert W. Vishny (1998), ‘Law and finance’, Journal of Political Economy, 106 (6), pp. 113–1155. Levine, Ross (1997), ‘Financial development and economic growth: views and agenda’, Journal of Economic Literature, 35, 688–726. Pagano, Marco and Ernst-Ludwig von Thadden (2004), ‘The European bond markets under EMU’, Oxford Review of Economic Policy, 20 (4), 531-554. Rajan, Raghuram and Luigi Zingales (2003), ‘Banks and markets: the changing character of European finance’ in Vítor Gaspar, Philipp Hartmann, Olaf Sleijpen (eds), The transformation of the European financial system, Frankfurt: European Central Bank, pp. 123–167. Swiss Re (2000), ‘Europe in focus: Non-life markets undergoing structural change’, Sigma No. 3/2000. Swiss Re (2004), ‘World insurance in 2003: insurance industry on the road to recovery’, Sigma No. 3/2004.
17
Figure 1: Comparison of economic strength and growth
Estonia
Finland
LativaLithuania
Luxemburg
MaltaSlovenia
AustriaBelgium
Cyprus
Czech Republik
Denmark
France
Germany
Greece
Hungary
Ireland
Italy
Netherlands
Poland
Portugal
Slovakia
Spain
Sweden
United Kingdom
EU-25
OMS
NMS
€ 0
€ 10,000
€ 20,000
€ 30,000
€ 40,000
€ 50,000
€ 60,000
0% 1% 2% 3% 4% 5% 6% 7% 8% 9%Average economic growth 1995-2004
GD
P pe
r cap
ita in
PPP
term
s, 2
004
GDP in current prices for individual countries, 2004a
Source: Eurostat, ECB a GDP in current prices for OMS, NMS and EU-25 is the average per country
18
Figure 2 Assets of financial intermediaries as per cent of GDP in 2002
0%
50%
100%
150%
200%
250%
300%
350%
Ban
king
Sys
tem
Asse
ts
Sto
ck M
arke
tC
apita
lisat
ion
Trad
ed N
on-
publ
ic D
ebt
Insu
ranc
eAs
sets
Priv
ate
Pens
ion
Fund
Ass
ets
Mut
ual F
und
Ass
ets
Oth
erFi
nanc
ial
Inte
rmed
iarie
sA
sset
s
OMS NMS
Source: ECB, Eurostat, OECD, National Central Banks
19
Figure 3 Bank sector vs. Stock market (as per cent of GDP), average 1995-2004
AustriaBelgium
Cyprus Denmark
Estonia
Finland
France
Germany
Greece
Hungary
Ireland
Italy
Lativa
Malta
Netherlands
Portugal
SlovakiaSlovenia
Spain
Sweden
United Kingdom
OMS
Czech Republik
Lithuania
Poland
EU-25
NMS
0
20
40
60
80
100
120
140
160
180
0 50 100 150 200Domestic Bank Credit
Stoc
k M
arkt
e C
apita
lizat
ion
Source: ECB, National Central Banks, WDI and National Stock Exchanges
20
Figure 4 Legal determinants of financial activity in the EU-25
Denmark
Germany
Ireland Luxemburg
United Kingdon
Austria
Belgium
FinlandFrance
Greece
Italy Netherlands
Portugal
Spain
Sweden
MaltaCyprusCzech Republic
Poland
Hungary
Slovakia
Slovenia EstoniaLatvia
Lithuania
EU - 25
OMS
NMS
0
1
2
3
4
5
6
0 50 100 150 200
Market capitalization as % of GDP
Inde
x of
ant
i-dire
ctor
righ
ts
Denmark Germany
Ireland
Netherlands
United Kingdon
Austria
Belgium
Finland
France
Greece
Italy
Portugal
Spain
Sweden
MaltaCyprus
Czech Republic
Poland
Hungary
Slovakia
Slovenia
Estonia
Latvia
Lithuania
EU-25OMS
NMS
0
1
2
3
4
0 50 100 150 200
Bank credit as % of GDP
Inde
x of
cre
dito
r rig
hts
Source: ECB, LLSV (1998) and companies laws or commercial codes
21
Table 1 Total assets, credits and deposits of CI as per cent of GDP
Total assets Total credits Total deposits 1995 2004 1995 2004 1995 2004
Austria 213.3 268.0 94.0 125.1 85.0 97.9 Belgium 291.2 322.3 74.7 107.2 74.6 142.8 Cyprus 85.9 305.9 80.2 141.1 86.7 126.8 Czech Republic 132.1 99.7 70.7 38.7 62.2 69.2 Denmark 118.0 309.3 n/a 164.4 53.7 62.2 Estonia 35.9 94.4 14.0 65.4 16.3 45.8 Finland 117.0 141.9 66.0 69.4 54.2 53.2 France 173.1 267.9 101.9 92.9 65.8 77.0 Germany 205.0 29.7 n/a 135.8 62.4 113.3 Greece 98.0 137.9 33.6 76.4 57.1 95.6 Hungary 36.1 80.1 22.5 48.3 40.2 44.4 Ireland 129.4 486.4 70.3 176.2 65.9 122.7 Italy 139.0 168.4 95.6 88.0 57.3 58.0 Latvia 31.0 101.3 7.1 56.5 16.6 65.7 Lithuania 27.9 47.5 14.3 30.4 14.3 30.1 Luxemburg 2876.0 2708.5 n/a 467.3 n/a 859.4 Malta 177.9 476.8 95.8 200.1 114.5 204.9 Netherlands 216.0 343.3 112.5 174.1 77.9 122.4 Poland 48.8 67.6 17.3 34.8 25.7 45.6 Portugal 158.0 242.5 70.5 136.8 76.1 102.2 Slovakia 76.0 87.7 36.7 36.3 54.9 21.7 Slovenia 61.1 93.6 25.7 47.3 31.7 56.7 Spain 159.0 205.0 102.3 120.6 73.6 104.4 Sweden 152.0 208.9 114.1 114.5 40.4 51.2 United Kingdom 239.0 406.4 122.3 142.2 72.4 117.6 EU-25 average a 181.7 215.1 71.6 114.5 63.4 94.3 OMS average a 187.6 219.1 76.5 119.9 65.8 96.9 NMS average a 66.6 84.7 31.8 41.9 38.4 50.6 Source: ECB, National Central Banks and Eurostat n/a= not available a GDP in PPP terms weighted averages
22
Table 2 Structure of the banking sector
Number of CI Asset share of foreign CI CR-5 HHI
1997 2004 1997 2004 1997 2004 1997 2004 Austria 995 796 3.4 19.4 48.3 43.8 515 552 Belgium 131 104 30.4 23.2 54.0 84.3 669 2100 Cyprus n/a 14 10.2 30.1 91.6 69.4 2747 1365 Czech Republic 50 74 24.0 91.8 67.0 64.0 2533 1103 Denmark 213 202 4.5 16.2 70.0 67.0 1431 1146 Estonia 12 9 29.0 98.0 83.0 98.6 4312 3887 Finland 348 363 8.4 59.5 88.0 82.7 2150 2680 France 1,258 897 10.4 11.4 40.0 44.7 449 623 Germany 3,420 2,148 4.3 6.3 17.0 22.1 114 178 Greece 55 62 15.8 24.8 56.0 65.0 885 1069 Hungary 286 217 53.0 77.0 53.0 52.7 2101 795 Ireland 71 80 24.8 45.4 41.0 43.9 500 556 Italy 935 787 7.0 7.7 31.0 26.0 201 230 Latvia 37 23 55.0 57.8 51.0 62.4 1450 1021 Lithuania 37 74 41.0 93.0 84.0 78.9 2972 1854 Luxemburg 215 162 92.5 94.1 23.0 29.7 210 304 Malta n/a 16 47.1 39.1 98.0 78.7 4411 2015 Netherlands 648 461 7.2 12.1 79.4 84.0 1654 1726 Poland 1,378 653 15.3 67.6 46.2 50.2 859 692 Portugal 238 197 14.8 26.1 46.0 66.5 577 1093 Slovakia 29 21 30.0 97.0 63.0 66.5 2643 1154 Slovenia 34 24 5.0 38.0 62.0 64.1 2314 1425 Spain 416 346 12.5 11.5 45.0 41.9 285 482 Sweden 237 212 2.5 8.7 59.0 54.4 830 854 United Kingdom 557 413 52.2 51.3 24.0 34.5 208 376 EU-25 average a 504 334 20.3 29.2 33.3 44.8 389 670 OMS average a 640 482 15.8 19.0 33.0 44.6 370 662 NMS average a 233 113 23.0 70.4 61.3 60.3 2024 1087 Source: ECB, National Central Banks and BankScope n/a= not available a credit institutions assets weighted averages
23
Table 3 Indicators of banking sector performance NIM Overhead costs Cost/Income ROA 1997 2003 1997 2003 1997 2003 1997 2003 Austria 1.82 1.80 1.69 1.63 66.95 65.62 0.25 0.41 Belgium 1.74 1.40 1.29 1.33 66.08 67.72 0.65 0.45 Cyprus 2.24 2.51 2.13 2.29 63.37 67.39 0.75 -0.06 Czech Republic 3.61 2.54 2.66 2.52 53.37 61.48 0.44 1.28 Denmark 1.97 1.36 1.36 0.90 58.87 52.64 0.84 0.58 Estonia 6.14 4.03 3.92 2.80 53.12 52.86 3.64 2.17 Finland 3.62 1.92 1.99 2.09 57.15 59.06 1.50 1.00 France 1.62 1.15 1.73 1.47 72.01 67.37 0.31 0.40 Germany 2.31 1.86 1.67 1.44 62.48 65.93 0.30 0.18 Greece 2.5 3.51 2.63 2.59 64.66 59.89 0.71 0.94 Hungary 5.05 4.62 4.23 4.01 65.81 63.15 1.75 1.73 Ireland 2.27 1.29 1.91 0.85 60.14 51.83 0.92 0.68 Italy 2.87 2.99 2.68 2.46 73.73 69.59 0.36 0.75 Latvia 6.34 3.1 5.57 3.18 65.32 60.68 3.27 1.41 Lithuania 7.16 3.42 6.14 3.39 80.07 79.98 -0.22 1.27 Luxemburg 0.79 0.68 0.62 0.78 46.4 54.53 0.56 0.54 Malta 2.45 2.00 1.67 1.49 53.22 47.11 0.93 1.08 Netherlands 1.93 1.63 1.91 1.72 72.21 70.34 0.58 0.47 Poland 5.61 3.38 3.35 3.84 55.04 68.36 1.97 0.43 Portugal 2.79 2.23 2.22 1.79 59.88 61.06 1.05 0.79 Slovakia 2.63 3.58 3.52 3.28 79.08 70.73 -1.26 1.34 Slovenia 4.48 3.29 3.61 3.06 59.15 64.12 1.11 0.88 Spain 3.16 2.75 2.46 1.95 61.58 54.31 0.89 0.94 Sweden 1.48 1.54 0.93 0.94 50.56 49.48 0.48 0.65 United Kingdom 1.93 1.69 1.75 1.77 60.75 61.03 0.66 0.63 EU-25 average 3.14 2.41 2.55 2.14 62.44 61.85 0.90 0.84 OMS average 2.19 1.85 1.79 1.58 62.23 60.69 0.67 0.63 NMS average 4.57 3.25 3.68 2.99 62.76 63.59 1.24 1.15 Source: BankScope
24
Figure 5 Domestic stock market capitalization as per cent of GDP a
0
50
100
150
200
250
Austria
Belgium
Denmark
Finlan
dFranc
eGerm
any
Greece
Irelan
dIta
lyLu
xembu
rgNetherl
ands
Portug
alSpa
inSwed
en
United King
donMalt
aCyp
rus
Czech
Rep
ublic
Poland
Hungary
Slovakia
Slovenia
Estonia
Latvi
aLit
huania
19952004
Weighted averages, 2004EU-25OMSNMS
Source: WDI, World Federation of Stock Exchanges, National Stock Exchanges a GDP in PPP terms weighted averages
25
Figure 6 Total value equities traded as per cent of GDP a
0
20
40
60
80
100
120
140
160
180
Austria
Belgium
Denmark
Finlan
dFranc
eGerm
any
Greece
Irelan
dIta
lyLu
xembu
rgNetherl
ands
Portug
alSpa
inSwed
en
United King
donMalt
aCyp
rus
Czech
Rep
ublic
Poland
Hungary
Slovakia
Slovenia
Estonia
Latvi
aLit
huania
19952004
Weighted averages, 2004EU-25OMSNMS
Source: WDI, World Federation of Stock Exchanges, National Stock Exchanges a GDP in PPP terms weighted averages
26
Figure 7 Domestic debt market as per cent of GDP, 1995-2004 a
0 10 20 30 40 50 60 70
EU-25
OMS
NMS
Goverment Financial Institutions Corporations
Source: BIS, IMF, National stock exchanges a GDP in PPP terms weighted averages
27
Table 4 Total investments of insurance companies and total assets under management as per cent of GDP Insurance companies Pension funds Investment funds
1995 2004 1995 2004 1995 2004 Austria 26.6 28.8 3.7 4.3 45.3 51.7 Belgium 45.5 57.7 5.7 4.1 34.1 33.4 Cyprus n/a n/a n/a n/a n/a n/a Czech Republic 7.2 9.3 2.4 3.7 4.0 4.3 Denmark 53.8 63.3 23.3 192.8 21.2 39.2 Estonia 2.3 3.4 0.0 1.9 n/a 3.5 Finland 23.7 25.5 n/a n/a 9.0 14.4 France 55.9 59.9 0.0 0.0 43.3 48.5 Germany 44.6 49.3 n/a 11.7 37.6 38.9 Greece 9.2 7.2 0.0 0.0 13.2 9.5 Hungary 4.9 4.4 4.0 6.6 5.0 5.3 Ireland 48.2 58.2 43.7 42.0 242.7 292.5 Italy 25.2 29.4 0.5 0.9 31.5 20.8 Latvia 2.2 2.0 0.2 0.4 0.2 0.5 Lithuania 1.6 2.3 0.0 0.1 n/a n/a Luxemburg 130.0 130.3 n/a n/a 3,878.3 3,797.9 Malta 10.9 13.9 0.0 0.0 13.0 23.5 Netherlands 66.3 65.8 100.8 106.9 25.1 20.1 Poland 5.1 7.1 2.7 7.9 1.7 4.7 Portugal 20.6 24.6 11.5 10.7 19.8 21.9 Slovakia 5.6 7.2 n/a n/a n/a 5.0 Slovenia 6.0 8.9 0.9 2.0 11.5 8.0 Spain 21.9 24.3 6.6 7.7 23.3 24.8 Sweden 0.1 31.3 0.0 0.0 35.6 42.1 United Kingdom 108.6 95.0 73.6 64.5 22.6 24.8 EU-25 average a 46.6 48.3 17.6 21.9 39.6 41.0 OMS average a 50.3 52.2 19.0 23.5 42.9 44.4 NMS average a 5.2 6.7 2.3 5.4 2.8 4.6 Source: ECB, National Central Banks and Eurostat n/a= not available a GDP in PPP terms weighted averages