pdf.usaid.govpdf.usaid.gov/pdf_docs/pnaak624.pdf · tables: 1. unadjusted population by age, sex...
TRANSCRIPT

CONTROL NUMBER 12. SUW ECT CLASSIFICATION (695)BIBLIOGRAPHiC DATA SHEET
3.TITLEAND SUBTITLE(240)
4. PERSONAL AUTHORS (100)
SeL d t' st'Ce.t dcufto. L), sex: gcur '"it
. CORPORATE AUTHORS (101)
6. DOCUMENT DATE (110)]111
9. REFERENCE ORGANIZATION (130)s-T/bIE
10. SUPPLEMENTARY NOTES (500)
-Do-txmeA; ;n
P I(-AAI<S0 lqsl'- ,hj cc.o.r O-d.'r .e..,
17.NUMBER OF PAGES (120).7tUBRoFAE 10[8
I*e&*J
cbtZe& , PA /-f' -AM(-- S -"P 'I/-
S.ARr NUMBER (170)
iloerscuPJu
- FAJPM-tqK-7O)
itr- i
39:
12. DESCRP IORS (920) 13. PROJECT NUMBER (150)
,S±a.tc -"ec.
Lp
Se-)( oleFR ,r-eice1 I-Wioq rc~O, ac. .16.
-- -eP1 14. CONTRACt NO.(141)
ilbTYPE
TYPE OF DOCUMENT (160)
15. CONTRACT (14 0)
ALD 590-7 11-79)

Selected Statistical Data
by Sex
Office of Development Information and Utilization
Washington, D.C. 20523
U.S. Agencyfor International Development

NEAR EAST
Lebanon
ACKNOWLEDGEMENTS This report was prepared by the Economic ai' Social .Data Services Division, Office of Development Information, Bureau for Development Support, utilizing data assembled by the International Demographic Data Center, U.S. Bureau of the Census. Support for the data assembly was prnvided by two offices in AID,the Office of Women in Development and the Office of Population.

5
10
15
20
25
30
.1
Table of Contents
Introduction Foreword. ................................................................................................ 11 Tables:
1. Unadjusted Population by Age, Sex and Urlan/Rural Residence........................................1 2. Unadjusted Population by Age, Sex and Urban/Rural Residence.......................................2 3. Adjusted Population by Age and Sex............................................................... 3 4. Adjusted Population by Age and Sex............................................................... 4 5. Population by Province, Sex and Urban/Rural Residence.............................................
.............................................
6a. Population by Ethnic Group, Sex and Urban/Rural Residence......................................... 6 6b. Population by Religion, Sex and Urban/Rural Residence............................................. 7 6c. Population by Nationality, Sex and Urban/Rural Residence.......................................... 8 6d. Population by Language;, Sex and Urban Rural Residence 9 7. Life Expectancy at Selected Ages, by Sex and Urban/Rural Residence .............................. 8. Infant Mortality Rates (per 1,000 live births), by Sex and Urban/Rural Residence ................ 11 9. Percent of Native-born Population Born Outside of Province of Current Residence, by Age and Sex.12
10a. Total Population, by Marital Status, Age and Sex................................................. 13 lOb. Urban Population, by Marital Status, Age and Sex................................................. 14 lOc. Rural Population, by Marital Status, Age and Sex................................................. 11. Minimum Legal Age at Marriage and Age at which Specified Percent are Ever Married, by sex and
Urban/Rural Residence ........................................................................... 16 12. Number of Households by Size, Mean Size and Median Size, by Urban/Rural Residence ............... 17 13. Heads of Household, by Age, Sex and Urban/Rural Residence........................................18 14a. 14b. Selected Fertility Measures, by Urban/Rural Residence..................... .....................
Age-Specified Fertility Rates (per 1,000 women), by Urban/Rural Residence ......................; 19
15a. Number of Literate Persons, by Age, Sex and Urban/Rural Residence............................... 21 15b. Population Bases for Percentages in Table 15c ...................................................22 15c. Percentage Literate, by Age, Sex, and Urban/Rural Residence ..................................... 23 16a. Number of Persons Enrolled in School, by Age, Sex and Urban/Rural Residence ..................... 24 16b. Population Bases for Percentages in Table 16c ................................................... 16c. Percentage Enrolled in School, by Age, Sex and Urban/Rural Residence ............................ 26 l7a. Number of Economically Active Persons, by Age, Sex and Urban/Rural Residence .................... 27 17b. Population Bases for Percentages in Table 17c.................................................... 28 17c. Percentage Economically Active, by Age, Sex and Urban/Rural Residence ........................... 29 18. Economically Active Population by Occupational Status, Sex and Urban/Rural Residence ............ 19. Income Distribution and Median Income, by Sex, and Urban/Rural Residence........................ 31
Appendix A: Women in Development Countries ............................................................ A-1 Appendix B: A List of Variables Used in the "Women in Development" Tables .............................A-3 Appendix C: Summary of Search Results ................................................................. A-5 Appendix D: Objective/Scope of Work.................................................................. t-10 Appendix E: A Cautionary Note Regarding the Use of Employment Statistics for Women ................... A-12
User Comments Forms...................................................................................... A-16

INTRODUCTION TO THE DATA BASE IN THIS BOOKLET
The United States Bureau of the Census (BuCen) recently completed a pilot six-month project, sponsoredjointly by tie AID Women in Development Office (PPC/WID) and the Office of Population (DS/POP), which,drawing on existing data sources, provides AID with data disaggregated by sex, age and urban-ruralresidence for a variety of variables including demographic, education, health, household, income andemployment. The purpose of the project was to capture and make accessible, in a convenient singlelocation, statistical data from existing sources relevant to a better understanding of the status androles of women in AID-participating countries. The scope of work includedAID-participating countries for specific variables. a data search of 69
conducted is provided in Appendix A. A listing of the countries for which searches wereA listing of the variables searched is provided in Appendix B.Appendix C presents, in matrix form, a summary of the results of the data search. More than 2,000 tableswere compiled during the project (though some remain blank owing to lack of information) using a varietyof national and international sources. The most commonly used sources were national censuses and surveys,statistical abstracts, and international compendia (e.g., publicationa from the United Nations, the LatinAmerican Demographic Center, the International Labor Organization, and sostandard format which permits the
forth). Each table is in afootnoting of sources and important definitions.often included to Further annotation isindicate instances where data availability deviates significantly from the standardtable outline, or where concepts and definitions used in collection or tablulation differ frominternationally recommended standards.
BuCen researches were concerned with recording "hard", reliable data.as valid. Census data were generally acceptedSurvey data were used if they had been judged reliable by the country analysts in the BuCenInternational Demographic Data Center (IDDC). Projections were not used and estimatesmeasures were generally avoided. or questionableIf, of necessity, the latter were employed, caveats appear in thefootnotes.
A major product of this effort is a computerized data file suitable for analysis using standardstatistical packages, e.g., Statistical Package for the Social Sciences (SPSS) and Statistical AnalysisSystem (SAS). Data for all 69 countries are available on a single tape.prepared for all 19 A standard tape file format wastables. Information concerning the record layouts (formats) for the various types ofdata as well as information regarding data-file specifications is available.data, the tapes Beyond the basic tabularindicate source references, concept definitions, and any qualifying information whichshould be considered by the user. The complterized data file is available for use by Agency personnel onthe AID computer. Arrangements for Agency users should be made through the Economic and Social DataServices Division, Office of Development Information and Utilization (DS/DIU/ESDS).available on magnetic tape from the BuCen. The data file is also
Requests should be addressed to Chief, InternationalDemographic Data Center, U. S. Bureau of the Census, Washington, D. C. 20233.
i

At this time we are making copies of the data available in hard copy booklet form, on a country-specificbasis. Each country booklet contains a complete set of computer printout tables for the variables searched for that country. In those cases where the data search failed to uncover data for a variable, the table(s) appears blank in the country booklet. Copies of these country-specific booklets are available upon request from the AID Office of Development Information and Utilization (DS/DIU).
Census data on women exhibit certain limitations and biases which must be taken into account if the statistics are to be interpreted appropriately. Some of these biases are noted in the FOREWORD which follows. Appendix E, "A Cautionary Note Regarding Use of Employment Statistics for Women," by Nadia Youssef, expands on the difficulties surrounding the use of women's statistics in the important area of employment.
The data capture activities comprising this project are being extended and expanded in a three-yearfollow-on contract with the Bureau of the Census, to begin in FY'81. The Objective and Scope of Work for that contract are reprinted in Appendix D for the purpose of informing users of these data about the directions of continuing efforts.
Finally, several tear-out copies of Reader Comments forms have been bound into this volume for use in submitting user reactions and suggestions to the DIU office in AID/Washington. We would appreciate hearing from you. Every effort will be made to improve upon the present volume so that succeeding editions become progressively more useful.
ii

FOREWORD
Background
(a) The International Context
The decade of the seventies witnessed a growing international movement directed towards improvement in the status and roles of women worldwide. Increasingly, it became widely recognized and accepted that, while class or social ranking is a general or basic factor in all people's fate in life, women face - special problem in that there are two systems of stratification in operation. The second system concerns women's position vis-a-vis men in public and private life. It is in this sense that women are confronted with problems of discrimination peculiar to them, and it is this universal problem that lay behind the designation of the International Women's Year in 1975, followed by the current United Nations Decade for Women (1975-1985). A more recent milestone in this international women's movement was reached when, on 18 December 1979, the United Nations General Assembly adopted by a vote of 130 in favor, none against, with II abstentions and II Member States non-voting, The Convention on the Elimination of All Forms of Discrimination Against Women. Eighty-one nations are now signatories to the Convention and ratification proceedings are underway in these countries.
(b) The Situation in AID
During this same time, within the Agency for International Development, awarenebs of women as theyimpacted on, and were affected by, the development process also grew. Reports depicting women as victims of the development process appeared with increasing frequency, as did reports that the contributions of women to the development process were being consistently overlooked.*
Special concern for the status and roles of women was initially provided explicit recognition in the Agency policy framework, in 1973, in Sec. 113 of the Foreign Assistance Act, otherwise known as the Percy Amendment.
*This perspective was also incorporated in the conceptual framework underlying the Programme of Action for the Second Half of the United Nations Decade for Women which states, in part: "It can be argued that the predominant economic analyses of labor and capital insufficiently trace the linkages between production systems in world economics and women's work as producers and reproducers; nor is the subjection, exploitation, oppression and domination of women by men, sufficiently explained in history." (UN: A/Conf. 94/34, 13 August 1980, p. 6)
iii

That amendment mandated that Foreign Assistance "shall be administered so as to give particular attention to those programs, projects and activities which tend to integrate women into the national economies of developing countries, thus improving their status and assisting the total development effort."
While the Percy Amendment dealt specifically with women, other broader changes occurring within the Agency(as well as within the development community generally) indirectly spotlighted the situation of women. First, the AID "new directions" mandate of 1973 focussed attention on issues of distribution and equity in the growth process. Secondly, the "new directions" approach was supplemented mid-decade with the "basic human needs" emphasis. Both orientations pushed toward greater concern for women in the process of societal change. This is the case because (1) women make up a disproportionately large portion of the poorest of the poor, and (' women comnonly bear the major responsibility for supplying themselves and their families with food, water, fuel, health care, sanitation, education, end so forth. Women are, in effect, simultaneously the group most in need and the "front line" providers of basic human needs. Development projects that overlook or misconstrue their capabilities and contributions run the serious risk of being ineffective or, even worse, counterproductive.*
(c) Data Needs on Women
Planners and administrators who have recognized the need to take women into account, both as contributors to, and/or beneficiaries of, the development process, are often frustrated by the lack of solid, accessible statistical evidence of women's situations. In the absence of reliable data, decisions must be made on the basis of impressions, hunches, or even prejudices. At stake are substantial investments of both human and financial resources. Data bases which fail to address the unique situations of women provide little guidance for policy planning, and little basis for judging the rsults of initiatives taken to further women's integration in development. Hence the crticial need for a reliable, up-to-date, accessible data base on women in development.
Within the Agency, it is now generally recognized that beginning with the policy stage and continuing through the project programming, implementation and evaluation cycle, data must be obtained which reflect the differential conditions of men and women. The assumption that when benefits and costs accrue to production aggregates (ranging from nations to households), they will be felt in some comparable way bythe various units (ranging from subgroup to individuals) of which they are comprised, has proven patentlyfalse. Many projects now require the gathering of baseline socioeconomic data pertinent to women's status, e.g., the sexual division of labor, decision-making in the household, the pattern of expenditure of household cash earnings and so forth. Project evaluations and impact assessments increasingly focus on
*See, for example, The Nemow Case, Case Studies of the Impact of Large Scale Development Projects on Women: A Series for Planners, Working Paper No. 7, September 1979, Agency for International Development, Washington,
iv

changes in the differential access of men and women to both the means and fruits of production.*
(d) Problems and Prospects
Problems with the statistical data base an women and women's situations in society emerge from two theoretically distinct sources. One set of problems arises from the concepts and indicators which have been used in the construction of the data base. For example, there are intrinsic limitations to operational definitions of concepts and measurements designed Lo capture employment trends in census practices. These combine with cultural biases against women's employment, and together result in the underreporting and undercounting of women's participation in the market place.** Too often the economic value of what women do in the home and subsistence production is given short shrift in census and many survey data. Necessary changes in the concepts and the operations of data gatherers represent a challenge extending into the future, although some -easure of improvttment is possible in the short run in some areas.
A second set of problems with the statistical data base on women arises from the lack of availability of data at appropriate levels of aggregation; i.e, data are not disaggregated by sex. Although census and survey data have frequently been collected in such a way as to allow the tabulation of responses separately for men and women, because of the past insensitivity to questions concerning differing conditions and responses by sex, separate tabulations have either not been made or have not been reported. This is an area where improvements can be made within relatively short time periods.
One of the goals adopted by the Office of Women in Development (WID) in AID*** is improvements in the collection, reporting and analysis of data concerning the status of women in society and their role in national development. In order to further the goal of reliable information on women in development issues, the WID Office has been supporting a variety of efforts to develop a reliable and internationally comparable data base in these areas. One of these efforts has been to examine existing data sources, and, where possible, provide tabulations of the information separately by sex. The data presented in this series of country booklets represent the product of that effort.
*Assessing the Impact of Development Projects on Women, A.I.D. Program Evaluation Discussion Paper No. 8, Bureau for Program and Policy Coordination, Agency for International Development, May, 1980.
**Limitations and biases regarding employment statistics for women are discussed in Appendix E, "A Cautionary Note Regarding Use of Employment Statistics for Women."
***The Women in Development Office was established within the Agency to help meet the objectives of the
Percy AmevA-m-t
v
It is clearly recognized that the data captured in this project do not represent an ideal or complete set of informaton on the status and role of women necessary for project and/or program needs.* Rather they reflect to a substantial degree what is currently accessible to the research team members. We do feel, however, that it may be useful to publicize basic data available to AID missions, generalists in the development community, and program planners who may be interested in comparisons within regions and comparisons between men and women. In addition we hope this kind of presentation will help create a demand for more detailed and sophisticiated information on women in the future, especially if future publications point out current gaps in information.
An assumption underlying the project was that the availability of data on women in developing countries might remind planners of the importance of incorporating women in their programs, help suggest programs and speed up the orientation of more development programs toward women. In other words, the project was expected to have a "consciousness-raising" function.
A more specific concern however, was to build up a solid set of data on characteristics of women in developing countries which could be updated when new information became available. The 1980 round of censuses will provide more information as will the country specific studies now being done in manycountries. The data base does provide a solid benchmark of what was available from the 1970s and can serve as a source for future comparisons.
*Because of their lack of detail, the data would not be very useful for project planning. It is possible some AID field missions, especially those with smaller staffs, will use the information in their annual Country Development Strategy Statement (CDSS) although many missions may be closer to the data for their own country than the compilers in Washington could be. Regional comparisons might re-emphasize the continued existence of certain problems, e.g., the relatively low life expectancy of females in South Asia.
.vi

TABLE 1. UNADJUSTED POPULATION BY AGEt SEX AND URBAN/RURALRESIDENCE, 1944. LEBANON
01 SEARCH CONDUCTED BUT NO DATA FOUND. ThE FIRST AND ONLY CONPLETEPOPULATION CENSUS IN LEBANON WAS CGNDUCTED IN 1932, W*HIN THECOUNTRY WAS UNDER FRENCH MANLATE.
(1)
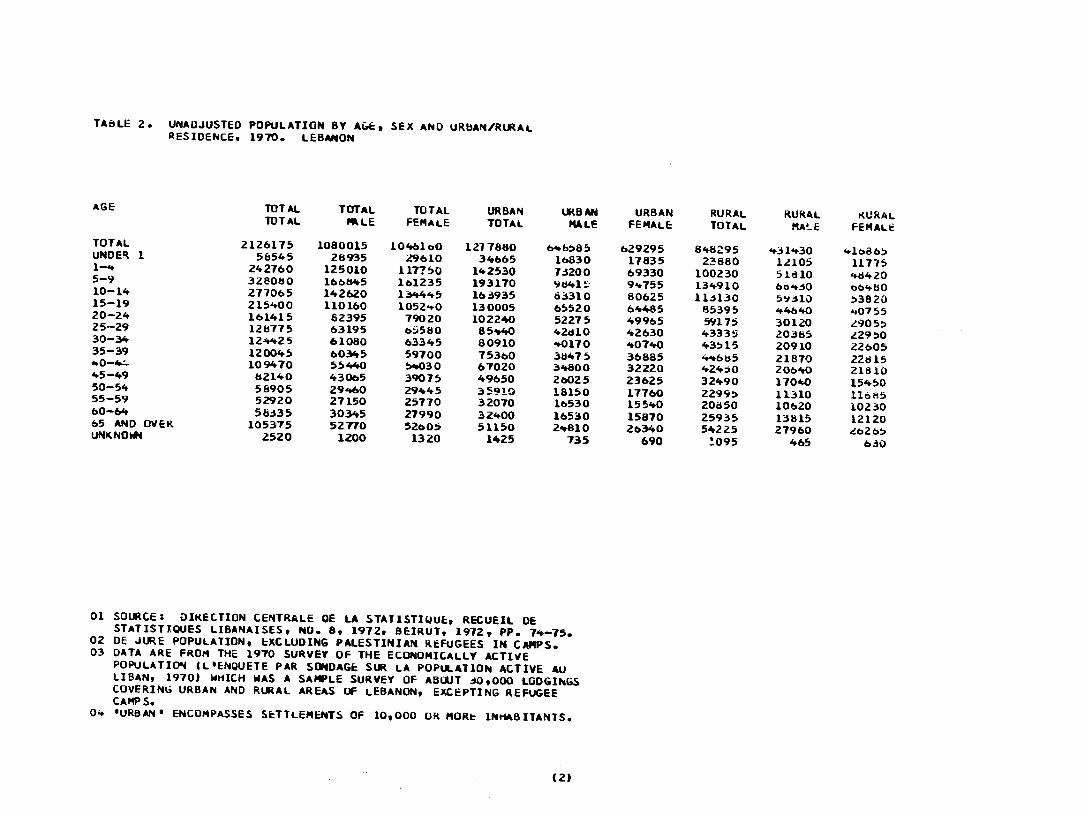
TABLE 2. UNAUJUSTED POPULATION BY AGE, SEX AND URBAN/RURAL RESIDENCE, 1970. LEBANON
AGE TOTAL TOTAL TOTAL URBAN URBAN URBAN RURAL RURAL RURAL TOTAL MkLE FEMALE TOTAL MALE FEMALE TOTAL MAL.E FEMALE
TOTAL 2126175 1080015 10461o0 1217880 64+b8 629295 848295 43$1430 416865UNDER 1 58545 28935 29610 34-665 16830 17835 23880 12105 117751-'," 242760 125010 117750 142530 73200 69330 100230 51d10 "+4205-9 3Z8080 166845 161235 193170 9841.; 9,4755 134910 b0,4O obfUO10-14 277065 142620 13445 163935 63310 80625 113130 5y310 5382015-19 215400 110160 1052"0 130005 65520 64485 85395 44640 ,,075520-24 161415 82395 79020 102240 52275 49965 59175 30120 2905!25-29 12b775 63195 bi;580 85P40 42d10 42630 43335 20365 2295030-34 12-42 5 61080 63345 80910 "0170 40740 43515 20910 2260535-39 120045 60345 59700 75360 3d475 36885 '446k5 21870 22s1540-4f, 109470 55440 5-%030 67020 34800 32220 424,0 20640 2181045-49 82140 43065 39075 49650 2b025 23625 32490 17040 1545050-54 58905 29460 29445 35910 18150 17760 2299! 11310 11b68555-59 52920 27150 25770 32070 16530 15540 20850 10620 1023060-64 58135 30345 27990 32400 16530 15870 25935 13815 1212065 AND OVER 105375 52770 5260 51150 2"810 26340 54225 27960 zbz25UNKNOWN 2520 1200 1320 1425 735 690 !095 465 630
01 SOURCE: DIKECTION CENTRALE DE LA STATISTIUUE, RECUEIL DESTATISTTQUES LIBANAISESt NO. 8, 1972, BEIRUT, 1971Z PP. 714-75.
02 DE JURE POPULATION9 EXCLUDING PALESTINIAN REFUGEES IN CAMPS. 03 DATA ARE FROM THE 1970 SURVEY OF THE ECONOMICALLY ACTIVE
POPULATION (LIENQUETE PAR SONDAGE SUR LA POPULATION ACTIVE AU LIBAN, 1970) WHICH WAS A SAMPLE SURVEY OF ABOUT 40,000 LODGINGS COVERING URBAN AND RURAL AREAS OF LEBANON, EXCEPTING REFUGEE CAMPS.
04 $URBANI ENCOMPASSES SETTLEMENTS OF 10,000 OR MORt- INH8BITANTS.
(2)

rABLE 3. ADJUSTED POPULATION BY AGE AND SEX, 1944. LEbANON
01 SEARCH CONOUCTED BUT NO DATA FOUND.
(3)

TABLE 4. ADJUSTED
AGE
TOTAL
-" 5-9 10-14 15-19 20-24 25-29 30-34 35-39 40-44 45-49 50-54 55-59 bO-64 65 AND OVER
POPULATION
TOTAL TOTAL
2204400 358500 328000 280900 215400
1l0 126800 12400 120000 109600
85700 58900 68600 55700 108500
BY AGE AND0
TOTAL MALE
1109000 182900 166800 1,"2600 110200 82400 63200 61100 60a00 55400 43100 29500 34000 27200 50300
Sl-X, 1970. LEdANON
TOTAL FEMALE
1095400 175600 161200 138.400 105200
79000 65600 63300 59700 54200 42600 2900 34600 28500 58200
01 SOURCE: COURBAGEt YUJUSSEF AND PHILIPPE FARGUES9 LA SITUATION DEMOGRAPHIQUE AU LIBjAN, I. MORTALITE FEI.ONDITE ET PROJECTIONS: METHOOES ET RESULTATS, BEIRUT 1973, PP. 68-69.
02 FIGURES MAY NOT SUM TO TOTALS DUE TO KOUINDING.
£4)

TAILE 5. POPULATION BY PROVINCE, SEX AND URBAN/RURAL RESIDENCE,1970. LEBANON
MOi.AFAZ AT TOTAL TOTAL TOTAL URBAN URBANTOTAL MALE FEMALE TOTAL
TOTAL 212Z25 A A 122265 A BEYROUTH t4870 A A 474870 AMT. LIBAN 633055 A A 478O AL. NORD 3b4935 A A 16765 ALE SUD 249945 A A 58200 ABEQAA 203520 A A 45570 A
01 SOURCE: DIRECTION Cf=NTRALL DE LA STATISTI UL, RtCUt:IL DESTATISTIQUES LIBANAISES, No. 8, 19172, BEIRUT, 1972, PPo 72.02 TOTALS MAY NOT ADD DUE TO ROUNDING..
A DATA NOT AVAILABLE.
URBANFEMALE
A
A A A A A
RURALTOTAL 9AM60
0 i7290 z97070 191745 1579
RUIt!.L 'WIALMALE %-ALUFE:AL. A A
A A A A A A A A A A

TABLE 6A. POPULATION BY ETHNIC GROUP, SEX AND URBAN/RURAL RESIDENCE, 1970, LEBANON
01 SEARCHt CUNDUCTED BUT DATA NOT FOUND.
t()
TABLE 6B. POPULATION BY RELIGIOW SEX AND URBAWIRiAL tESIDEIE, 1970. LEBANON
01 SEARCN CONDUCTED BUT NO DATA FOUND,
.7)

TABLE 6C. POPULAION BY NATIONALITY, SEX AND UKBA/RURAL KESIDENCL, 1970. LEBANON
NATIONALI TY TOTAL 7OTAL T0TAL URBAN URBAN URBAN RURALT0TAL MALE FENALL RURAL RURALTOTAL NALE FEMALE TO7AL MAL t FE4ALE TOTAL 2126325 A A 1278030 ALEBANESE A 848295 A1928580 AA A 1103805OTHER ARABS A A 824775159885 A A AA 141420 A AOTHER FOREIGN 18B46 A17790 AA A 15795 A AUNKNOWN 1995 A20070 AA A 17010 A A 3060 A A
01 SOURCE: DIRECTION CLNTRALE DE LA STkTISTIQUk, RL-CUEIL DtSTATISTIQUES LIBANAISES, NO. 8, 1972, BEIRUT, 19729 P. 82.
A DATA NOT AVAILABLE.
1"8

TAaLE 6D. POPULATION BY LANGUAGE* SEX AND URbAN/RURAL kESIDENCE. 1970. LEBANON
01 SEARCH CONDUCTED BUT NO DATA FOUND*
(9)

TABLE 7. LIFE LXPECTANCY AT SELECTED AGt:S, BY SEX AND URBAN/RURALRESIDENCE, 1970. LEBANON
AGE TOTAL TOTAL TOT AL TOTAL MALE FEMALE
0 6..1 62.1 66.0 1 67.5 65.6 69.35 65.0 63.1 66.615 55.8 54.0 57.630 42.0 0.3 43.7 45 26.7 27.2 30.3 60 16.7 15.7 17.7
01 SOURCE: COURBAGE9 YW1SSEF AND PHILIPPE FARlUlES, LA SITUATIONDEMUGRAPHIQUE AU LIBAN, I. MORTALITE FELONDITE ET PROJECTIONS:METHODES ET RESULTATS9 BEIRUT 1973, PP. 26, 28:"02 ESTIMATED USING ADJUSTED DEATH REGISTRATION DATA AND COALE -DEMENY MODEL LIFE TABLES.
(10)

TA.3LE 8, INFANT MORTALITY RATES (PER 19000 LIVE BIRTHS), BY SEX ANDURBAN/RURAL RESIDENCEs 19709 LEBANON
01 SEhRCP4 CONOUCTLD BUT RELIABLt: DATA NOT FOUND. bY MATCHING ANESTIMATED AGE-SPECIFIC DEATH RATE FOk AGE GROUP 1-4 TO UNITkUNATIONS MODEL LIFE TABLESv FARGUES AND COURBAGt HAVE ESTIIATLU ANINFANT MORTALITY KATE OF 64.5 FUR 1970; SEE PHILIPPE FARGUES ANDYOUSSEF COURBANE, SOME BASIC METHODOLOGICAL ELEMENTS PROPER TOLEBANESE DATA (1970) IN ORDER TO OBTAIN BASIC INDICES ONMORTALITY, EXP-RT GROUP MEETIkG ON MORTALITY, BEIRUT* DECEMBER 1972, ESOB-WHO LMR/MORTP.7. P. 17.
(11)

TABLE 9. PERCENT OF NATIVE-BORN POPULATION BORN OUTSIDE OF PROVINCE OF CURRENT RESIDENCE, BY AGE AND SEX, 1970. LE-ANON
01 SEARCH CONDUCTED BUT NO DATA FOUND.
1 12)

TABLE 1OA. TOTAL POPULATION 10 YEARS OLD AND OVER, BY MARITAL STATUSt AGEP AND SEXt 1970. LEBANON
SEX AND AGE TOTAL 5INGLE HARRIEDCONSENSUAL WID(WEDSEP/DIVOR.MOT STATED TOTAL 1496940 710715 706650 0 71775 7800 0TOTAL MALES 739225 39816 347955 0 10710 2400 010-14 142620 142620 0 0 0 015-19 011OL60 109035 1)I10 0 lb 020-24 0S395 72600 9190 0 15 9025-29 063195 34665 28305 0 30 195 030-34 b108 15405 *5180 0 135 36035-39 060345 9060 508S0 0 120 285*.0-44 055"0 &&725 50040 0 05 270 043--49 43O,5 2445 39855 0 *# 5 300 050-5* 29*60 1090 26910 0 555 105 055-59 27150 Ins 24345 0 735 19560-64 030345 1395 27270 0 1380 300 065 AO OVER 52770 1695 0#335 0 655 285 0UNKNOWN 1200 750 435 15TOTAL FEMALES 737715- 312555 -i5695
0 (
0 0 61065 5 * 0 010-14 134445 133665 7M0 0 0 3015-19 0105240 91365 13590 0 9020-24 195 079020 40135 328"0 0 150 40525-29 0550 16-e5 .*10 0
0 450 73530-34 063345 9000 52680 0 900 765 035-39 59700 6o5 50050 0 1905 900400-44 054210 140 45735 0 3735 60045-49 039075 2635 320,0 0 3640 510 0
20-59 2145 21960 0 N0K0 300 02"555-59 25770 1080 17970 0 5985 16560-4 027990 20*0 1630 0 a0s 315 065 AND OVER 5Z575 2025 19485 0 30015 450UNKNOWN 01320 525 615 0 /50 30 0
01 SOURCE: DIRECTION CENTRALE DE LA STATISTIUUE, RECUEIL DESTATJSTIXUES LIBANAISES, NO. 8, 1972, BEIRUT, 1972, P. 76.
(13)

TABLE 10. URBAN POPULATION 10 YEPAS OLD AND OVER BY MARITAL STATUS, AGE AND SEX, 1970. LEBANUN
SEX AND AGE TOTAL SINGLE 14ARRIEOCONSENSUAL WIDOWEDSEP/DIVOR.NOT STATED TOTAL URBAN 907665 436320 421575 0 44115 5655 0TOTAL MALES 460140 244740 208200 0 559S 160 010-14 83310 83310 0 0 0 0 015-19 65520 6#&785 720 0 15 0 020-24 52275 466,55 5760 0 15 45 025-29 ".2810 23965 18705 0 15 105 030-34 40170 1075 28905 0 105 285 035-39 3b475 5t95 3265 0 105 210 040-44 34800 3105 31170 0 285 240 045-1#9 26025 1635 Z3895 0 Z70 225 050-54 1,150 1245 1645 0 345 75 055-59 16530 1230 14790 0 390 120 060-64 16530 900 14580 0 900 150 065 AND OVER 248lO 640 20670 0 3150 150 0UNKNOWN 735 480 255 0 0 0 0TOTAL FEMALES 447525 191580 213375 0 38520 4050 010-14 80625 80115 400 0 0 30 015-19 64485 5550 8700 0 75 150 020-24 49965 25350 24180 0 120 315 025-29 42630 10215 3S14O70 0 315 630 030-34 40740 5760 33810 0 525 645 035-39 36885 4155 30945 0 1155 630 040-44 32400 2115 26670 0 2535 480,.5-49 023625 1950 113"-5 0 2670 360 050-5' 11760 1455 12255 0 340 210 055-59 15540 1065 10020 4360 75 060-64 15870 1410 8025 0 6110 25565 AND OVER 26310 1575 7845 0 1635 255
0 0UNKNOWN 690 255 330 0 90 15 0
01 SOURCE: DIRECTION CENTRALE DE LA STATISIQUE, R- CJEIL DE STATISTIQUES LIBANAISES, NO. b, 1972, BEIRUT, 1972, PP. 78-80
S14)

IABLE 10C. RURAL POPULATION 10 YEARS OLD AND uVER, BY MARITAL STATUS, AGt, AND SEX, 1970. LEBANON
SEX AND AGE TOTAL SINGLE MARRIEUCUNSENSUAL Wi1OWEDSEP/UIVOR.NOT STATEU TOTAL RURAL 589275 2743c5 265090 0 21o60 2100TOTAL MALES 0299085 153390 139770 0 5115 81010-14 059310 59280 15 0 015-19 15 044640 44250 -90 0 020-24 0 030120 261-t5 39 31 0 0 4525-29 C20385 10680 9600 0 1530-34 90 020910 4.530 16275 0 3035-39 75 02 t70 3165 18Ib 0 1540-44 75 020640 1620 18870 0 12045--9 30 017040 810 159C0 0 19550-54 75 011310 645 1042! 0 21055-59 30 010620 645 9555 0 345 7560-6+ 013815 495 12090 0 480 15065 AND OVER 27960 0855 23265 0 3705 135UNKNOWN 0465 270 180 0TOTAL FEMALES 290190 120975
0 15 0145320 0 22545 1s5010-14 053820 53550 270 0 015-19 0 040755 35805 #A 90 0 15 45 020-24 29055 14835 14100 0 3025-29 90 022950 6270 lboto 0 135 105io-3-t 022605 3240 18870 0 37535-19 120 022815 1890 19905 0 75040-44 270 021810 1425 19065 0 120045-+9 120 015450 735 13395 0 1170 15050-54 011685 690 iY '5 0 1200 90 055-59 10230 565 795L 0 160560-6-01 90 012120 65
630 8805 0 2625 60 0AND OVER 20265 1050 11640 0 13380 195 0UNKNOWN 630 270 2b5 0 60 15 u
01 SOURCE: DIRECTION CENTRAL: Ut- LA STAT1STlwuE, RtCUtIL DrSTATISTIQuES LIBANAISES, NO. 8, 1972, B-IRUT, 1972, P. 81.
(15)

TAdLE 11. MINIMUM LEGAL AGE AT MARRIAGE AND AGE AT WHICH-SPECIFIED PERCENT ARE EVER MARRIEU, BY SEX AND UKBAN/RURAL RES1OtNCE, 1970. LEBANON
ITEM TOTAL TOTAL URBAN URBAN RURAL RURAL MALE FEMALE ML' FEMALE MALE FEMALE
MINIMUM LEUAL AGE 166 13B 168 13B 16B 13B AGE 25% EVER-MARR. 25 19 25 19 25 19 AG- 50% EVER-MARK. 28 23 28 23 26 23 AGt 75% EVtR-MARR. 32 27 33 27 32 28
01 SOURCE: DIB, GEORGE M., 1975, P. 20 IFOR MINIMUM
LAW AND POPULATION IN LEGAL AGE); DIRECTION
LEBANUN, CrNTRALE
MEOFORD, Dt: LA
S7ATISTIQiUE, RECUEIL DE STATISiIQUES LIBANAISES NU. 8, 1972, 6EIRuT, 1972, P. 81.
B VARIES WITH DIFFERENT RELIGIUNS. RANGES ARE lb-l FOR MALES AND 12.5-18 FOR FEMALtS.
(16)
TABLE 12. NUMBER OF HOUSEHOLD!, BY SIZE, MEAN SIZE AND M-DIAN SIZE,BY URBAN/RURAL RESIDENCE, 1970. LEBANON
01 SEARCH CONUUCTtU BUT NO DATA FOUND..
( 1?)

TABLE l.bo HEAD OF HOUStHOLD 10 YEARS OLD AND UVER, BY AGF, SEX AN) URBAN/RURAL RESlDENCE, 1970. LEBANUN
01 SEAkCH CONDUCThtO BUT NO DATA FOUND.
itls)

TASLE 14A. AGE-SPECIFIC FtRTILITY RATES ifPR 19000 WOMtN)t BYURBAN/RURAL RESIDENCE, 1970. LEBANON
AGE TOTAL
15-19 40 20-2t 184 25-29 259 30-34 214 35-39 134 40-44 65 45-49 18
01 SOURCE: CHAMIE, JOSEPH, RELIGIUN AND POPULAIIUN DYNAMILS INLEBANON, UNIVERSITY OF MICHIGAN, JANUARY 19771 TABLE 2.1.02 DATA FROM THE 1971 NATIONAL FERTILITY ANU FAMILY PLANNING SURVEYOF A SAMPLE OF 2795 CURRENTLY MARRIED WOMEN BETWEEN 15-49 YEARSOLD BASED ON THE SELECTED HOUSEHOLDS OF THE 1970 SURVEY OF THEECONOMICALLY ACTIVE POPULATION.
119)

lAdLE 148. SELECTED FERTILITY 14EASURESI BY URBAN/RURAL RESIDENCE, 1970. LEBANON
SELECTED MEASURES TOTAL
CBR (PER 1000 POP) 34.00 TFR (PER WOMAN) 4.57 GRR (PER WOMAN) 2.32 NRR (PER WOMAN) 2.12
01 SOURCE: CHAMIE, JOSEPH, RELIGION AND POPULATION DYNAMICS IN LEBANON, UNIVERSITY OF MICHIGAN, JANUARY 1977, TABLE 2.1.02 DATA FROM THE 1971 NATIONAL FERTILITY AND FAMILY PLANNING SURVEYOF A SAMPLE OF 2795 CURRENTLY MARRIED WOMEN ESETWEEN 15-49 YEARS OLD BASED ON THE SELECTED HOUSEHOLDS OF THE 1970 SURVEY OF THE ECONOM!CALLY ACTIVE POPULATION.
(20)

TABLE 15A. NUMBER OF LITERATE PERSONS 10 YEARS ULD AN) OVER, BY AGE, SEX AND URBAN/RURAL RESIDENCF 1970. LEBANON
AGE TOTAL TOTAL TOTAL UR8AN URBAN URBAN RURAL RURAL RURAL TOTAL MALE FEMALE T3TAL MALE FEMALIE TOTAL MALE FEMAL:
TOTAL 1022189 595363 -426826 b63498 373944, 289554 358691 221419 -37210-14 247795 133920 11387 148154 78j#6 5 69689 99641 !S5455 "t I ub15-19 184251 100796 d3455 113898 59950 5394t8 70353 -*0b46 29G720-24 129752 73332 56420 85029 4.-6826 38205 -t4723 2b50b icLz 125-29 94380 53589 40791 65657 36731 20926 28723 1o0058 lbo30-39 150992 91069 5992j, 106207 61636 44571 44765 293:33 240-49 105199 67771 37'4Z8 72187 44409 27778 33012 23362 9.65050-59 54901 36570 18331 385d8 24530 14058 16313 120tO ,.5oO AND OVER 5'.-919 38316 16603 3377ts 21397 12381 21141 1b9.91*ZI2UNKNOWN 0 0 0 0 0 0 0 0 0
01 SOURCES: DIRECTION CENTRALE DE LA STATISTIQUE, RECUEIL DE STATISTIQUES LIBANAISES, NO. I, 1972, bEIRUT, 1972, PP. 74-75; UIRECTION CENTRALE DE LA STATISTIhlUE, LOENWUETE PAR SONDAGE SUR LA POPULATION ACTIVE AU LISAN, NUV. 1970, VOL. 1, P. 97.
02 LITERATE INCLUDES ALL PERSONS WHJ HAVE ATTE)NOED SCHOOL UK KNOW HOW TO READ ANU WRITE.
121)

TAdLE 156. POPULATION BASES FOR PERCENTAGES IN TABLE 15C, 1970. LEBANUN
AGE TOTAL TOTAL TOTAL URBAN URBAN URBAN RURAL RURAL RURAL TOTAL MALE FEMALE TOTAL VA LE FEMALE TOTAL MAL= FE-cMALE
TOTAL 149b790 759225 7375o,-. 907515 460140 '4-,+7375 589275 299085 290190 10-14 277065 142o20 134445 163935 83310 'Ob25 113130 59310 538 0 15-19 215-+00 110160 1052,*0 130005 65520 644b5 d5396 4'64O0 40755 20-24 1b1415 t2395 79020 102240 52275 49965 5917! 301ZO 2VO55 25-29 30-39
128775 24.470
63195 121'. 5
05580 1230+5
8544*0 156270
42810 7o645
' Zb30 77b25
4-,j 5 8t1200
2035 427b0
22950 ,+542U
40-49 191b10 98505 93105 11bb70 60825 558-t5 7-9-O .376P-0 37200 50-59 111d25 5 oe10 55Z 1 67980 34660 33300 43845 21930 e 1915 60 AND OVtR 163710 83115 80595 83550 41340 42210 s01ob0 41775 3b365 UNKNOWN 2520 1200 1320 1425 735 690 1095 465 b30
01 SOURCE: DIRECION CENTRALE DE LA STATIb7IQUEv RELUEIL DE STATISTIQUES LIBANAISESv NO. d, 1972, Bt'IRUT, 1972. PP. 74-75.
(22)

TABLE 15C. PERCENTAGE LITERATE 10 Y-ARS OLD ANU OV=R, BY AGI, SEX,AND UqBAN/RURAL RESIDENCE, 1970. Lt:BANUN
AGr_ TOTAL TOTAL TOTAL URBAN URBANTOTAL URBAN RURAL KuRALMALE FEMALE TOTAL RURALMAL: FEMALE TOTAL MALE FEMALETOTAL 88.3 78.4 57.9 73.1 b81 310-14 64.7 bO.9 7t.089.4 93.9 +7 -184. 90.4 vo 215-19 86.4 b8.185.5 9..5 82:191.5 79.3 87.o20-24 91.5 83.7O., 89.0 8Z.4 91.571.,* 83.225-29 89.6 76.5 75.o73.3 bts.084.8 02.2 7b.8 .'e .30-39 b5.8 67.961.8 06.3 Z.775.0 48.7 68.0 51.740-49 57.6 78.,t 57.4 50.b68.8 66.8 33.40.2
49.1 64.b 61.9 '.1 o2.050-59 73.0 '-947
60 AND OVER 33.5 31.2 56.8 70.7 42.2 -7.2
Zto 9 46.1 20.6 5-t.9 19.1UNKNOWN 51.8 29.300.0 00.0 00.0
40.4 2c) .4 t0.5 11 000.0 00.0 00.0 00.0 00.0 00.0
01 SOURCE: DIRECTION CENTRALE DE LA STATISTIQU, LGENQUETE PARSONDAGE SUR LA POPULATION ACTIVE AU LIBAN, NOV. 19701 VUL 1,P. 97.02 LITERATE INCLUDES ALL PERSONS WHO HAVE ATTENDED SCHOOL OR KNOWHOW TO READ AND WRITE.
Q23)

TABLE 16A. NUMBER OF PERSONS ENROLLEO IN SLt.HUUL 6 TO 24 YEARS ULD,BY AGE, SEX, AND URBAN/RURAL RtSIDLNCE, 1970. LEBANON
AGE TOTAL TOTAL TUTAL URBAN URBAN URBAN RURAL RURAL RURALTOTAL MALE FEMALE TOTAL MALE FEMALE TOTAL MALE FEMALE TOTAL 599715 33,'035 265600 364335 198945 165390 235360 1350906-9 100290239595 125220 114375 13790 74580 69210 95805 50b4O 451b:10-14 231210 127050 104160 137040 73620 63420 94ti 015-19 53430 -t07,40100770 60615 ,0155 b330 35940 27420 37410 2467:20-24 127-i28140 21150 6990 201,45 14805 5340 7995 6345 1b50
01 SOURCE: DIRELlIUN CENTRALE DE LA STATISTIJUl-, LsENQUETE PARSONDAGE SUR LA POPULATION ACTIVE AU LIBAN, NUV. 19709 VOL. 1, P. 67.
U2 DATA EXCLUUE ENROLLMENT IN KURAN1C SCtIUOLS.
(24)

TABLE IB. POPULATION BASES F.C PERCENTAUES IN TABLE 16C, 1970. LEBANON
AGE TOTAL TOTAL TOTAL URBAN URBAN URBAN RURAL RURAL RUkALTOTAL MALE FEMALE TOTAL MALI: FEMALt TOTAL MALl fr-MALt
TOTAL A A A A A A A A A6-9 A A A A A A A A A10-14 277065 142620 134415 163935 8s310 80ob25 113130 59;10 D-18;u15-19 2 15400 110160 105240 130005 65520 b,485 85395 -4tb'4O -G IOt20-24 161415 82395 79020 102240 52275 49965 59175 30120 90t5
01 SOURCE: DIRLCTION CENTRALL DE LA STATISTIwuE, RtCUEIL Oe STATISTIwUES LIBANAISES, NO. 8, 1972, BEIRUT, 1972, PP. 7'-75.
A DATA NOT AVAILABLE, DUE TO LACK OF POPULATION BAStS FOR ALES o TO 9. BASES FOR AGES 5 TO 9 ARE INDICATED IN TABLE 2.
(25)

TABLE 16C. PERCENTAGE ENROLLED IN SCHOOL b TO 24 YEARS OLD, BY AGE, SEX, AND URBAN/RURAL RESIDENCE, 1970- LEBANON
AGI- TOTAL TOTAL TOTAL URBAN URBAN URBAN RURAL -(URAL RURAL TOTAL MALE FEMALE TOTAL MAL- FEMALE TOTAL MALL FEMALE
TOTAL A A A A A A A A A6-9 A A A A A A A A A10-14 83.5 b9.1 77.5 83.o b8..# 78.7 b3.2 90.1 75.715-19 46.8 55.0 38.2 4d.7 54.9 ,42.5 43.8 55.3 31.z20-24 17.,4 25.7 8.8 19.7 28. 10.7 13.5 21.1 5.7
01 SOURCES: DIRECTION CENTRALE DE LA STATISTIQUE, LRENQUETE PAR SONOAGE SUR LA POPULATION ACTIVE AU LIBAN, NUV. 1970, VOL. 1, P. 87;DIRECTION CENTRALE DE LA STATISTIQUE, RECUEIL DE STATISTIQUES LIBANAISES, NO. 8, 1972, BEIRUT, 1972, PP. 7,4-75.
02 DATA EXCLUDE ENROLLMENT IN KORANIC SCHOOLS.
A OATA NOT AVAILABLE, DUE TO A LACK OF POPULATIUN BASES FUR AGES 6 TO 9. THESE MISSING FIGURES COJULU BE APPROXIMATtD BY ES''IMATING THE 6-9 AGE GROUP FROM DATA ON AGtS 5-9 (SEt TABLE 2).
(26)

TABLE 17A.
AGE
TOTAL 10-14, 15-19 20-2-, 25-29 30-39 40-49 50-59 60-64 o5 AND OVER UNKNOWN
NUMBER OF ECONOMICALLY ACTIVE PERSONS 10 YEARS OLD ANDOVER, BY AGE, SEXt AND URBAN/RURAL RESIDENCE, 1970. LEBANON
TOTAL TOTAL TUTAL URBAN URBAN TOTAL MALE FEMALE TOTAL MALL
569427 471475 97952 350916 290131 17430 8557 k87 113-*2 559158489 41861 1o628 345b4 2521078708 59901 18807 49387 36769 71766 58519 13247 48503 39479136608 1177tsZ 18826 88657 76371 105886 93875 12011 64797 57891 52859 47779 5080 31874 29095 23413 21090 2323 12123 10867 24268 22111 2157 9649 8858
0 0 0 0 0
URBAN FEMALE
60785 5751 9374 12618 9024 12286 6906 2779 1256 791
0
RURAL TOTAL
Zi5l bo8
23905 29321 23263 47951 '10t9 209b5 11290 1,.619
0
RURAL MALE
1 s13,.'. 2966
lob l 2 5132 190,.0 41411 359b,+ 16b8, 10223 13253
0
RUAAL
FEMALL
i7lo7 .122 725't
d9
510t 2z 0 1 10o7 13o6
0
01
02
SOURCE-S: DIRECTION CENTRALE DE LA STATISTIWUE, RECUEIL DLSTATISTIQUES LIBANAISES, NO. 8, 19729 BEIRUI. 1972, PP. 74-75;DIRECTION CENTRALE DE LA STATISTIUUE9 L'ENwULTE PAR SUNUAGE SURLA POPULATION ACTIVE AU LIBAN, NOV. 1970, VOL. 1, P. 109.DEFINITION OF ECONOMICALLY ACTIVE CONFORMS TO ILO STANDARD bUT REFERENCt PERIOD UNKNOWN.
(27)

TASLE 178. POPULATION BASES FOR PtRCENTAG,-s IN TABLE 17C, 1970. L EBANtJN
AGE TOTAL TOTAL TOTAL URBAN URBAN URBAN RURAL RURAL RURALTOTAL MALE FEMALE TOTAL MALE FEMALE TOTAL MALE FEMALE TOTAL 1-496790 759225 737565 907515 460140 "7375 569275 299065 Z9019010-14 277065 142620 134445 163935 ba310 80625 116130 59i0 5)82015-19 215400 110160 105240 130005 6520 64485 8539520-24 44640 't07D5161415 82395 79020 102240 52275 '9965 59175 30120 Z905525-29 126775 63195 055tso 85440 4,2610 42630 '13335 20385 2295030-39 244470 121425 123045 156270 76645 77625 88200 42760 t5420'.0-49 191610 98505 93105 116670 60825 55845 7491,0 376O0 j7260:0-59 111625 56610 55215 67980 6'+0t 0 33300 4a845 21930 219150-b4 5t1335 30.45 27990 32400 1b30 55
15870 25965 13s15 12120AND OVER 105375 52770 52605 51150 2',810 26340 5'-225 27960 ,25265UN NOWN 2520 1200 1320 1425 735 690 1095 *65 c30
01 SOURCE: DIREC7ION LENTkALE DE LA STATI!TWUEt RECUEIL DE STATISTIQUES LIBANAISES, NO. 8, 1972, BEIRUT, 1972, PP. 74-7!).
(28)

TABLE 17C. PERCENTAGE ECONOMICALLY ACTIVE 10 YEARS OLD ANu OVER, aYAGE, SEX, AND URBAN/RURAL RESILUENCE, 1970. LEBANON
AGE TOTAL TOTAL
TOTAL MALE
TOTAL FEMALE
URBAN TOTAL
URBAN MALE
URBAN FEMALE
URAL TOTAL
URAL MAL.
RURAL PcALt
TOTAL 10-14
15-19 23-24 25-29 30-39 40-49 50-59 60-6,4 65 AND OVER UNKNON
38.0 6.3
27.2 "8.8 55.7 55.9 58.0 7.3
.0.1 23.0
0.0
62.1 8.0
38.0 72.7 92.6 97.0 95.3 8.4 69.5 41.9 0.0
13.3 8.6 15.8 23.b 20.2 15.3 12.9 9.2 8.5 4.1 0.0
38.7 6.9
2b.6 ".8.4° 56.8 56.7 55.5 '. 9 37. 18.9 0.0
63.1 6.7
38.5 70. s Y2.2 97.1 95.2 d3.9 65.7 35.7 0.0
13.6 7.1
14.5 25.3 21.2 15.8 12.,-8.3 7.9 3.0
.0
37.1 5.4
26.0 9.6
5z5.7 54.4 5-. b -7.9 '3.5 27.0
0.0
bO.0 5.0
37.3 7b.d 9.4 96.8 9-5.5 bt.2 7.0 -.7.4
U.
12.i .
17.o Z1. 18... 14.,4 13.? 10.
.0 5.2 0.0
01
02
SOURCE: DIRECIION CENTRALE DE LA SATISTIWUE, LIENLUt:TE PARSONDAGE SUR LA POPULATION ACTIVE AU LIBAN, NOV. 1970, VOL. 1,P. 109.DEFINITION OF ECONOMICALLY ACTIVE: CONFOKMS TO ILO STANDARD BUTREFERENCE PERIOD UNKNOWN.
(29)

TABLE 18. ECONOMICALLY ACTIVE POPULATION BY OLCUPATIONAL STATUS, SEX, AND URBAN/RURAL RESIDENCt, 1970. LE:BANON
UCLUP. STATUS TOTAL TUTAL TOTAL URBAN U kd AN URbAN RURAL Rt"RAL RURALTOTAL MALE I-:MALr- TOTAL MALE FEMALE TOTAL MALE FEMALL
TOTAL LABOR FORCE 538410 444285 941 5 330975 A A 207,35 A AEMPLR. G SELF-EMP. 17022C. 157725 12390 95430 A A 7"+790 A AEMPLOYERS 40980 39675 1335 26160 A A 14820SELF-EMPLOYED A A129240 118050 11055 69270 A A 59970 A AEMPLOYEES 321945 259755 61875 223575 A A 98370 A AUNPD. FAM. WORA.ERS 35670 17790 18255 b355 A A 27315 A AOTHERS AND UNKNOWN 10575 9015 1605 3615 A A 6960 A A
01 SOuRCE: DIRECTION CENTRALE DE LA STATISTIUE, LOENQUETE PARSUNDAGE SUR LA POPULATIUN ACTIVE AU LIBAN9 NUV. 1970, VOL. 1, P. 120 AND 132
02 DATA FOR EMPLOYED eCNOMICALLY ACTIVE POPULATION ONLY. 03 ROW AND/OR COLUMN FIGURES MAY NOT AL)TO TOTALS DUE TO ROUNDING,
A DATA .NOTAVAILABLE.
(30)
TA:iLE 19. INCOME DISTRIBUTION AND MEDIAN INCOMt, BY St"X, AND URBAN/KURAL RESIDENCE, 1970. LtBANON
01 SEARCH CONDUCTED BUT NO DATA FOUND.


APPENDIX A
"Women in Development" Countries
A-I

AFRICA
Benin
Botswana Burundi
Cameroon Cape Verde Chad Djibouti
Ethiopia The Gambia Ghana
Guinea Guinea Bissau Ivory Coast Kenya
Leso tho Liberia Mada ga scar
Ma lawi Mali
Mauritania
Mauritius
Mozambique
Niger Rwanda Sao Tome and Principe Senegal
Seychelles
Sierra Leone Somlia
Sudan Swaziland
Tanzania
Togo Upper Volta Zaire
Zambia
ASIA Bangladesh
India Indonesia
Korea Nepal Pakistan Philippines
Sri Lanka Thailand
LATIN AMERICA Bolivia
Costa Rica Dominican Republic Ecuador El Salvador Guatemala Guyana
Haiti Honduras Jamaica
Nicaragua Panama
Paraguay Peru
NEAR EAST Afghanistan
Cyprus Egypt
Israel Jordan Lebanon Morocco
Syria Tunisia Yemen Arab Republic
A-2

APPENDIX B
A List of Variables Used in the "Women in Development" Tables
A-3

"Women in Development" Tables
i. Unadjusted Population by Age, Sex and Urban/Rural Residence, 19 2. Unadjusted Population by Age, Sex and Urban/Rural Residence, 19 3. Adjusted Population by Age and Sex, 19 4. Adjusted Population by Age and Sex, 19 5. Population by Province, Sex and Urban/Rural Residence, 19 6a. Population by Ethnic Group, Sex and Urban/Rural Residence, 19 6b. Population by Religion, Sex and Urban/Rural Residence, 19 6c. Population by Nationality, Sex and Urban/Rural Residence, 19 Ad. Population by Language, Sex and Urban Rural Residence, 19 7. Life Expectancy at Selected Ages, by Sex and Urban/Rural Residence, 19 8. Infant Mortality Rates (per 1,000 live births), by Sex and Urban/Rural Residence, 19 9. Percent of Native-born Population Born Outside of Province of Current Residence, by Age and Sex, 19 10a. Total Population, by Marital Status, Age and Sex, 19 10b. Urban Population, by Marital Status, Age and Sex, 19 10c. Rural Population, by Marital Status, Age and Sex, 19 1i. Minimum Legal Age at Marriage and Age at which Specified Percent are Ever Married, by sex and
Urban/Rural Residence, 19 12. Number of Households by Size, Mean Size and Median Size, by Urban/Rural Residence, 19 13. Heads of Household, by Age, Sex and Urban/Rural Residence, 19 14a. Age-Specified Fertility Rates (per 1,000 women), by Urban/Rural Residence, 19 14b. Selected Fertility Measures, by Urban/Rural Residence, 19 15a. Number of Literate Persons, by Age, Sex and Urban/Rural Residence, 19 15b. Population Bases for Percentages in Table 15c, 19 15c. Percentage Literate, by Age, Sex, and Urban/Rural Residence, 19 16a. Number of Persons Enrolled in School, by Age, Sex and Urban/Rural Residence, 19 16b. Population Bases for Percentages in Table 16c, 19 16c. Percentage Enrolled in School, by Age, Sex and Urban/Rural Residence, 19 17a. Number of Economically Active Persons, by Age, Sex and Urban/Rural Residence, 19 17b. Population Bases for Percentages in Table 17c, 19 17c. Percentage Economically Active, by Age, Sex and Urban/Rural Residence, 19 18. Economically Active Population by Occupational Status, Sex and Urban/Rural Residence, 19 19. Income Distribution and Median Income, by Sex, and Urban/Rural Residence, 19
A-4

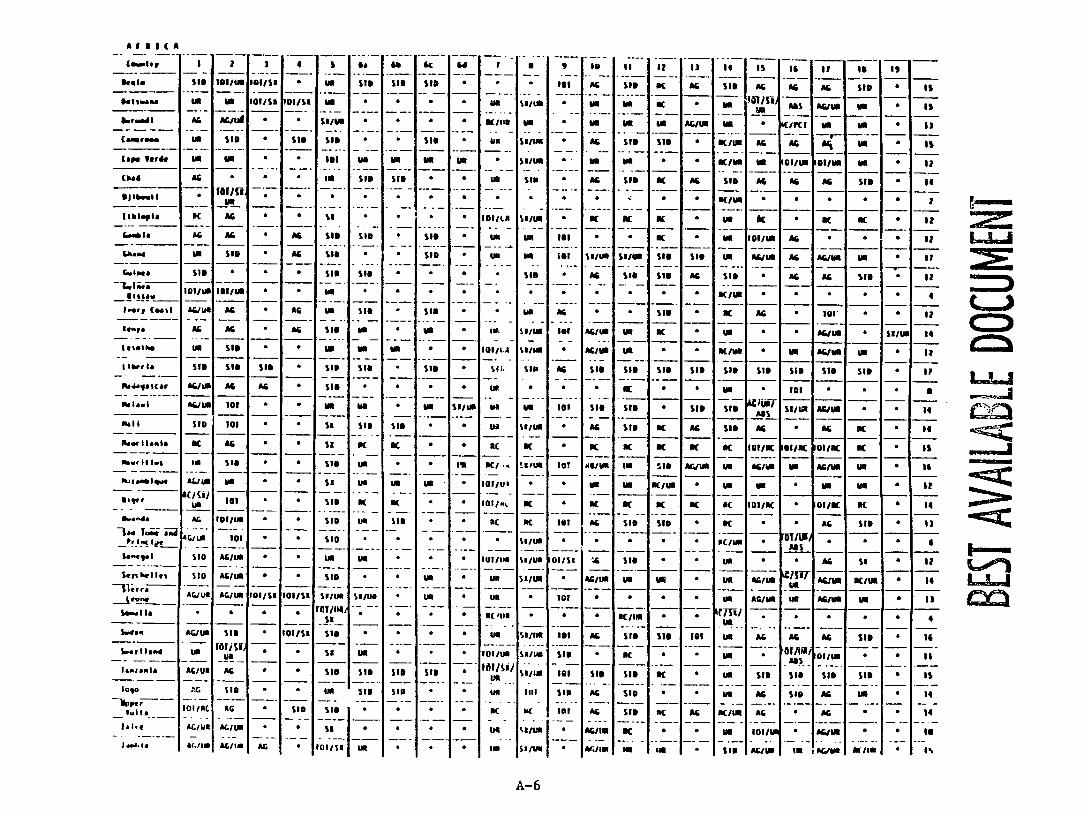
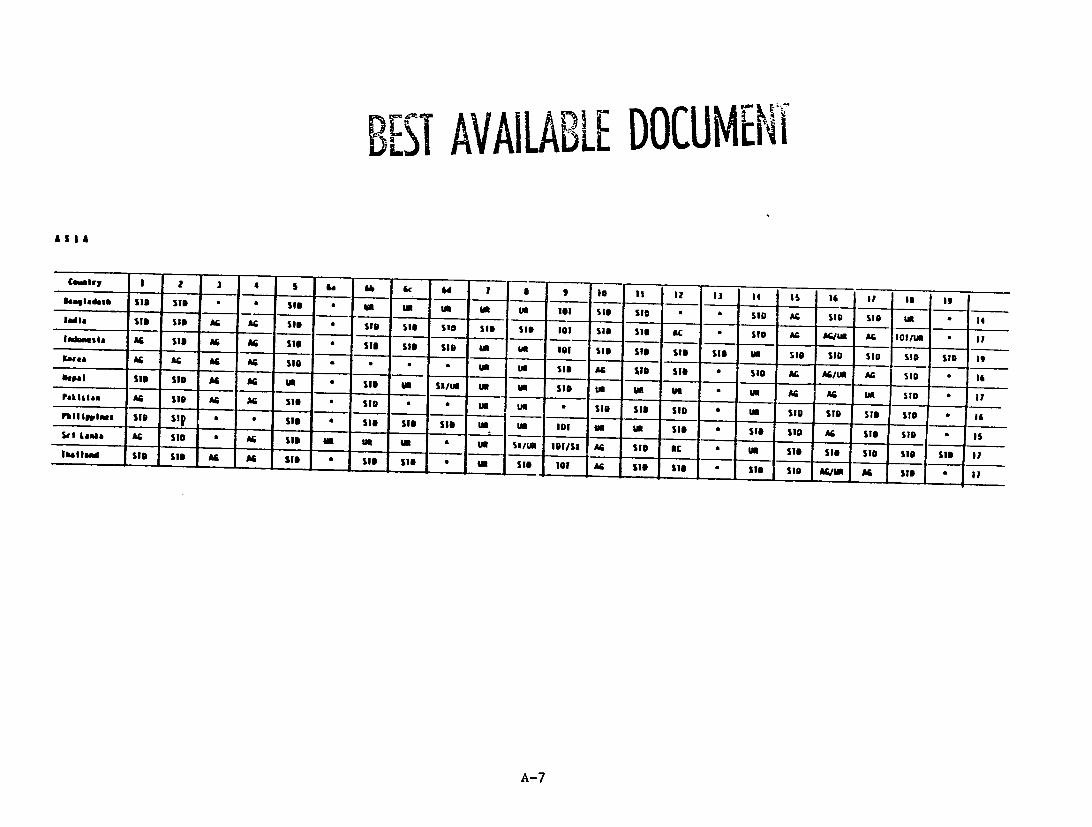
APPENDIX C
Summary of Search Results*
*Column numbers refer to individual data tables, as presented in Appendix B. (Multi-part data tables appear as single units with the exception of Table 6.) Countries have beei grouped by geographic location. Foreach country, the matrix cells indicate the presence or absence of data table information. Lack ofinformation is represented by an asterisk. Other symbols, explained in the matrix key (located at the bottomof the last page of Appendix C), describe the nature of data obtained, insofar as they conform, or do notconform, to particular standard data-table formats. Thr final cell in each country row contains the number of data tables (n=19) for some information was recorded. Similarly, the final row represents marginal sumsfor all 69 countries, indicating the number of countries for which some information for a given data table was located.
A-5
AIllCA A IvA I E A ~ S C S - - - - *--- * -
sein Sim IvelumMAI/Si w S i 3 SID .1 AG SID KE SID Ai A6 AG SID Is -etias
Ca-erso..
Cape erd
€tod llJII~lI
we
*6
us
to
us
A6/Id
SID
m
SM
fog/oIOI/S m-. -. Bali....~~~~~~u03/S
IaOradi sill@
IS I I SID
P U I us
• $ S •SID * . .
•
SI
Ii SM
* a*
P am
18
O*
w
sie.
UsI'iU
S/llsli
$Bl/I
SigINI •
*
6
u t M 101/SmS I K
SM WI us
Simt S ID
tI
S illM
. ....... ....
* ': *
lo-ls-to No Ass* W 'ul -
A /IU• * KI
ME/MO *
K eI/ I Po 10111*
AG SID AG *,
)11....- __ __-
* I~l i
_
USw
A%
0,/so
Ac.
we
UN
I
SIc
*
*
Is***
|
I's
I blehli K I * * " * I01Ifll /uS KE K K " 1 kl K KI
6S610
Ghaa
C..lowam..ieu
A A&
Us SIR
SIDu,:+,15I. •
46
AG
+
sIt SID
%I*
5 SIB solllS
SIc
SID
~
I
on
.
tW
go
Sao.
0I
ioI
o
Sal/ie
AGSm
SiSm
SID
ME
SIB
SID
SID
*G
up *6/IM
SIDK/SM0,. t-.0
Ac
AG
*6WIV
AG
SWe
SID
*I
*
Ii
I
i
f~rpil - 11 * * ..• $1Swe SIB$ill, SID u #, SI D Kl 6 lt-r * 1-
les
Iber t---
AC
--S
iII
_
*6
SID
II
-
SIi
-.
A6
*
Sig
.up...
ImM
go wIe...
S *
. ..
nSIB *
.. . .
go sliS/ i.
101A SI/I*.. .W.
%II•
. . .-
AGAI*6
SID
...
m M EKn
t . .
SID SID
. . .
*
SIM
.
.
KI M
I
._....
SII
i .
SID
*/
Ac/S M
SI S
SI/M
*
14
I?
|6a44l0car
a-,,
il___
Ac/Us
*SM
iUS
Ac
lt
l
•
*
* SI
IW°
°
VI
Ul SI
*
SI
,M S/US*
•
* W
A
A
UIt
SM.l
SlimI
ll
*
*0 K
,.SID utSID
| G SID
*
K
*SID
Ac°
we
SD
SIN
A
AG
lot•
S /M
AG K
Ii
I
N.lala
ftuoal"u
liver
.na
~I
K AG so5
1111 S SID S
AG/ US SM SI
u G * I SID
Ar 101/1812 SID ____,,,-.. .
SI/BA- /Ul * SI
K
us6
K
UK -
SM
S
K
-
on
i .
on
, -
Is
*
*
.-
*
A(S
K/*...
IG/ul
lit/L
ME3 ,+,,
K
I
K
ME -
*
10!tO '
*
gCKot .
0/I'
K
S/
WI
A.
KE
IN
SME
K
-SID .
135
KE
SID
K/Ml
K
SID --
l
K
*6/US
K
- .
K 101111 10I/K 1/K
Ul AGAIN m Ac/IS
uSM nWI
AC I1l/lK 10/K
PCK AG -- o,_,-_,
P/lupUS * Ac
K
Us
toS
R
SID _
Si
* is
14_
aI*
I4
13I .- ,
* It
-.-
S('engal
9tFf -1l, a ~~r;---
Ia aa l ..Siudan
SID AG/US
Ar.iklUir AGIU l"l/S
IGIIIll* -;--
_ _ _ __ A U S LI M * rA/ iJ *TJI
AI/__._.. SIB
us
l SI Di/U
rA l
SI_l SI IISI*OI S
a 5.. ITitm
us
SI/U
--
_ oII
.SIB
*a USUI
:. *
_ ____ _-_ " 'SI
SI
SIB l
i
*
*
loUS/ItU SI/US
lNt *
*'. lJ
U I 1/tIM
lt/U l U
USk
W A
0
____ ISa 55
SIB
/Sa
Lo
*
*S
S ig
us
K/S
S
SC
SotIBt
M
SI
*
*
1
*
M A M
US AQ/SM
IIalI
WI _. __ A10U
S*
SM A&c
*
*6
-AS
AG-
ACmS
AGA6/
a
* 6
0/S*
SI
K/M
I SM
*
SLI
1D
*
a
*
It
14
4l/
I S
I1i16
m.
vgi/Us AID SIDSIB S ISID - I l 0IIIII SID 1S AG SIBK *A s1l SID Is
- -.- - .. . _ l --/U . .
$0I11/CiSIN*
. _ _
*
- -. . -. . ...
K I/I
.. . . l$l+i $III
I
. I
* A/l
. .-1Sil
I K
-. ..... SilIC
A
. .
Sll /
...- . -Li 10/0
*
- -
Ac.
. -GUII10$lI -
1I
lau.Ia bil/l AG/UI AC * l0 I 1 * i1 $M/N AGAIN -It• * lKi tcAPV"
A-6
BE'ST AVAILAB'LE DOCUM~i
A~~r I •~~~ S. 6a 6b 6C 6d840 l14des SIB SID + I ' I-., , .,
0 IIQ,l Is 1 2 13 ,• 1S0. + I , ,SIIneel KSl .1 -- -I & -" -Sl 1-- 1 SonI I1 SI SID AG l 1D SO 1
two& AGlllul Sl AGSAG "G sit- - -l- a. - $1 - -SlSI -$1" .A1Lr. ArmSO . -M ISIG a 6 . SIB Si. SIBO- $1- ..- I-II- SO I 1 10 -" ISID SID SID SID SID Is
A-77

BEST AVAILA-BLE DOCUMALH1L A I1 A i NIIC A
Country 2 3 4 S 6, 66 6c 6d 1 I 9J 10 1 I 13 14 15 l Ii II 1 -
BOlivia UI AG a AG SI - - STO un Sit lor AG/RC SD C * MO I 510 STU SID 1!
Costa lice S10 1TS0 AG A 10 - - SID U oI 101 SID S10 SI0 AG Us 58 AG AG S1 S0 Ig
I S * AG SI $T0 SID AG Us tI U • IS
Ecuador AG ST1 AG AG STU * - - sx/iU • AC S19 SID UP SID. AG AG SID * IS
£Ialydr STU SID AG AC SD tUm s1/U3 SID AG $I0 sT) AG STU STU AC STU um ii
110cSID STU AG a STUD • * -
Lo Ar 110 17
&jyana UPI lO il ll UR It u lurt A IcIumR TIC us AG/IA lt AGIUA AGUIA UR 1B
Aitmala AG SID AG 10 SID * UUA *"S/A AGC SD Ic 1l sic ST S
tn TOi/s S urn
Maiti AU S U a • 1C 11D sicSD a 1 a I UI S tUA 101 STU S0 II
Hondura 110 S S11 AG SI1 t U S1 * AG 110 AC 101 SID ST AG STU ST1 0 Is
Jamaica AIA UI 1l AG SID UA U UR SiltI 10 AG/I SID Us AG IA AIA AG/IA UIit lt UI I1
D *
Panama S1 SID AG AG U SID & U SX/uA AG A SID S11 AG u AG AG SID S10 a Is
Paragmay 1i0 SID AG S1D Sic a a SI1 a U SI/I a AG SID SID 10/S1 UA SID AG AG $TO a 17
Peru 110SI 110 aIA At. AG. 1 sin /IA m Ae SID SID SiB
Nicaragua AG AG AG AS 11I * U IA SIB SID aC * U SID AC SID SID a IS
A-8

_ ____ ______
BEST AVAILABLE DOCUMENT NLAA t ASI
Lount Iy 2 3
Afghanlstan AG
(gpt- ....................-C AGI I0 *
Cyprus ASill AG/IfE apt A,11 10 1 ~~~~~ilretArUtilt AG •I
4 5 S
AA *
Sl
SKAS11/*A Sill
A.. . .. . . N
e, h Sc
. ,
• 1
t 111
. . . . .. . W~l• I I N
Sd
*
*
u
ur
SI/Utin SUI
1 n
510I
-Si l
IIISI I10
1
101
l
*
10 II IZ I) i 14
Sill SID Sin SI
urni *', ,,
il sl II0 A 1DA i PICl SID°
- - . . . . .s to1W _SII il ID AWII01 RJl .
1
SID
h
101A i l ilR l
6
AG
RaBA
AG IAI
17
Sill
AG,. G
G1/tnIN AG
to 1
NC
so
i l.I PClaII
9
"
*
II
114
1
16
Jrdan WIN.. SIlD AG .SID U I * AG SIl ID Ii AG AG AGUll tit I;
paiocc.
Syrla
Inlsla
SIll SID AG AG SI .........~...............................
S10 SID S
S1D AG AG
I
Si
Up
$i
SID
*
*
UPI..........--......
up
ti n *
WI
up
--.
*
SIlD
AG113AC
SIl
son IE ..-... .
$1g0]- $1S
S10 SItD
AG ...
01
AI
SID .....
$10
tIDto
siln AGltIi
SI
.S $1sill * n $I •
slDSIll
3UP *
I1
1S
. ..- i I-lU- ---. . . . .. .. . . . . ..-l. . .. . . ..-I .
. .. ..-. . . .... . . . lot"I ol all I...
... ... 1....... ..... .
1 1... .....
1.1cr ...Sabe ... . .. ...I- - -
I .. Ies U I c ,lA e d-m
tabl I ....
III
Itolal or partlal# not available. - Search conducted but no data lan-I. Iable Framwork. UP - Urlanhural breatdrn.nSin - Data conlorn t a IS.
AG - Age categories differ from standard table framework. AIIS- lable contains absolute numbers only (re: tables ll table contains column or row totals only.
KI - table contains percentalges only (re: tables 15. 1I. Ideviation from standard table frw ork SI - Sea distilnction (total or partial) not available. PC -ow and/or colvai
(other than Si. UIK.or AG).
IIII: 'SID tables my be missing certain cells.
"* tables may contain figures and/or other Informatlon In footnotes.
A-9

APPENDIX D
"A. OBJECTIVE
"The objective of this contract is two-fold: (1) to develop and make accessible a body of reliableand internationally comparable data which will facilitate better understanding of the statuses and roles of women worldwide, and their participation in national development, and (2) to promoteinstitutionalization of WID issues and concerns in national and international census and surveyactivities. Our purpose is to update, expand and make more relevant and accessible, both now and inthe future, the census and survey data available to the Agency and AID participating countries pertinent -' !-'omen in Development (WID) issues and concerns.
"B. SCOPE OF WORK
"The contractor will pursue this goal through the accomplishment of a number of basic tasks: (I)expansion of the data base of social, economic and demographic information related to the status and roles of women worldwide; (2) preparation of a hard copy publication(s) providing a worldwide statistical portrait of women, accompanied by interpretative text and an analytical critique of the indicators and the data base as they relate to an understanding of the conditions of women;encouraging through consultation and coordination ongoing and contemplated BuCen programs for
(3)
statistical training andtechnical assistance to take into consideration the needs for the conceptualization, design, collection, tabulation and analysis of data pertinent to women in development issues; (4) function as a repository for international WID data and provide dissemination of assembled international WID data base in response to user requests (U. S. and international)utilizing specific transportable medium (tape, card, diskette, etc.) as appropriate, and to include documentation; (5) preparation of special tabulations from census samples and surveys to provide data concerning WID issues which have not previously been available, e.g., micro data from censuses and surveys may be exploitedto prepare data on women migrants, women-headed households, male/female incomedifferentials; and (6) compilation of data on subject areas less frequently included in population censuses and general purpose household surveys, e.g., access to credit, political participation.
"Under this new contract agreement BuCen will (1) assess the variables included in the previous stageof work to determine whether new variables should be added to the data base, (2) extend the data capture activities to include, in addition to the 69 AID-participating countries, all countries of 5million or more population, (3) update the data presented under the previous contract to reflect most recent information available, and (4) drawing on the information presented in this expanded data base, prepare for hard copy publication a worldwide statistical portrait of women using the most recent data availabe, to include interpretive text and an analytical critique of the data base.
A-10

Dissemination and utilization of these data i . a primary objective. As indicated above, the data will be made available in two forms: (1) in machin -readable form according to agreed-upon file specifications; and (2) a world handbook, or regional handbooks, which select and display data from the automated file in a maximally useful anal:,tic mode and provide(s) a critique of the data base and indicators. The BuCen will function as repository for these data, and will create a reproductivecapacity and disseminate the data in response to user requests, both U. S. and international, in a form consistent with user capabilities.
"An additional priority focus in the contract effort is the institutionalization of an integrated concern and capability for assessing the role,; and status of women, in a manner which accuratelyreflects women's real social and economic contributions and conditions in society, in national andinternational census and survey data collection, reporting and analysis activities. To this end,BuCen will consult and coordinate with ongoing Census Bureau programs. Examples of these programs are the Census Bureau's regular training programs for population analysis, POPSTAN workshops, assistance to the Economic and Social Commission for Asia and the Pacific (ESCAP) program of national surveys oninternal migration and the Survey and Evaluation Unit (SEU) Resource Support Services Agreement (RSSA)agreement with AID to assist AID-participating countries in data collection, :-rocessing and compilation efforts and to provide on-the-job training for host country nationals in data collection and information management."
A-1 1

APPENDIX E
A Cautionary Note Regarding the Use of Employment Statistics for Womenl/
Nadia H. Youssef International Center for Research on Women
Washington, D.C.
The Agency's commitment to promoting productive employment as an integral component of its programmatic emphasis has important bearing on development efforts on behalf of women. The relationship between increasing the use of women's economic resources and improving the economic picture of underdevelopment is only now beginning to surface. AID projects have recently begun to address women in their productive role. However, fuller planning efforts are thwarted by the absence in the Third World of a system of statistics showing the reallty of women's economi: contribution. National censuses, which are the primary source of data for development planning, have up to now consistently undervalued the productive contribution of women to the national economy. Unless corrective action is introduced women will continue to be excluded from social and economic development planning../
The perennial problem is that internationally adopted standards, the operational definitions of concepts, and measures of employment are grounded in a system of identification and evaluation of economic activity based on developed and industrialized economies. Methodologically, such an approach is inadequate for developing economies, because it focuses on stable wage-earners and thereby fails to capture the totality of men's and women's productive contributions. The census statistics for women, more than for men. are
fraught with ambiguities and sex related biases. This tendency is due to the interaction between two factors: (a) the inappropriate conceptualization of female labor force activity and its underenumeration by means of censuses, and (b) the cultural bias against acknowledging the types and level of work that women perform that leads to distorted reporting and recording of women's contribution to total employment.
The following pages single out some of the limitations intrinsic to current operational definitions and measurement of work in standard census practices.
1/ This is a condensed version of a larger paper entitled "Sex-Related Biases in Census Counts" in the
report Priorities in the Design of Development Programs: Women's Issues, Bureau of Development Support, AID, Washington, D. C.
2/ A basic critique of the situation can be found in the U.N. Secretariat "Sex Biases and National Data
Systems," (ST/ESA/STAT/99), (June 1980).
A-12

MEASUREMENTS OF WORK: WOMEN'S PRODUCTIVITY
Standard census practices use the labor force approach in collecting data on economic characteristics and
in classifying populations as economically "active" or "inactive". According to this approach, the
economically active population is identified as 1) at work for pay or profit during a specified brief
day; 2) with a job but not at work, or 3) actively seeking employment.period, either one week or one
This measure, originally developed in the United States during the Depression to assess the extent of
unemployment, fails to capture the reality of working conditions in developing economies for the following
reasons: a) much of production is family-based and for home consumption; b) the agricultural cycle
generates sharp seasonai variation in activity; c) the length of working days is not uniform; d) most wage
work is for daily wages; and e) individuals engage in not one, but a variety of economic activities in the
course of a singLe year.
The flaws intrinsic to this conventional measure are more acute for women than for men because of a deeply
entrenched bias against female employment. This bias takes the form of failure to report on the
productive contribution of women to economic life, not only through The self-reporting process (because
women do not consider their work to be economically important), buz also in instructing the interviewer to
accept a married woman's designation of herself as a "housewife" (hence to be counted "economically
inactive") without further probing into a possible distinction between the economic and non-economic value
of the activities she performs.
THE LABOR FORCE APPROACH AND WOMEN WORKERS
A rigorous interpretation of the concept "economic activity", as utilized in the labor force approach, is
disadvantageous to women because of the following:
Domestic Production: The concept excludes activities connected with family production which do not result
in the actual production of market goods, such as personal services and home consumption goods.
Reference Periods: Women are more likely to be misclassified as economically inactive because the
reference period or time frame in which women perform work is often not according to "standard" reference
periods used in the census. To facilitate accurate recall, censuses and labor surveys inquire about work
performed in the last week or month. Since most men work almost every week or month of the year, the
short reference period will accurately reflect men's long-term labor force status. Many women however,
work irregularly, since they either constitute a seasonal labor force used to meet agricultural peak labor
demands, or in urban areas, they may engage intermittently in informal sector activities.
A-13

Subsistence Activities: Women who work in traditional subsistence activities tend to be excluded from the labor force count. Many agricultural societies are characterized by heavy reliance upon traditional subsistence activities, which remain outside the sphere of formal markets although supporting a high proportion of the rural population. Work activities in those traditional societies are family labor, in-kind exchange labor, and labor provided to meet social obligations at the village level. Such work is typically regarded by enumerators as having no economic significance, often because no form of cash is exchanged. Given that the zubsistence economy is mostly in female hands, excluding such forms of labor operates to decrease further the number of women reported in the statistics as part of the labor force.
Unpaid Family Workers: The category of "unpaid family labor" is meant to exclude household work such as food preparation, childcare, and care of livestock used for family consumption, but may include any farm activities which result in the cash sale of products and services.
Follow ILO specifications, most surveys and censuses require that a person work at least one-third time during the short reference period (typically the past week or month) to qualify as an "unpaid family worker". This specification has proved to be disadvantageous to women, in that the uncertainty surrounding what constitutes "one-third" of cash producing work by "unpaid" female workers in particular, are misclassified by census enumerators as "economically inactive".
Informal Sector: Women's work in informal sectors of the economy is unrecognized in census statistics. A widespread phenomenon in Third World countries. rticularly in the urban areas, is the build-up of an extensive shadow economy, developing as a necessary complement to the expanding formal sector wage labor. Most activities in the informal sector are on the periphery of the job market, and these jobs are not integrated into any industry coding, or detailed occupational breakdown, as exists for the formal sector.
Since informal sector jobs often fall outside taxation structures, lack a set location to transact business, or may even be quasi-legal, the tendency is to exclude informal sector activities from the labor force count. This has led to a considerable underestimation of the number of urban women who are actually economically active.
Multiple Roles: Multiple economic roles of women are not captured in census c¢jnts. According to the standard definitions, individuals are classified as economically active or inactive on the basis of a series of questions clustered around the concept of principal economic activity. In developing economies, however, the formulation of such a question does not reflect the totality of work involvement, for both sexes are engaged in a multiplicity of economic activities at different levels of productivity.
A-14

The rigidity of standard definitions leads to a distortion once more, andunreported, because their day--more so it is the women who gothan that of men--is characterized by a constant and subtlealternation between numerous activities with both economic and non-economic significance. No statisticalacknowledgement is made of women who intermittently engage in small-scale trade and in short duration
income-earning activities, which are interspersed between housework.
The Underestimation of Unemployment: The standard labor force approach works to the disadvantage of including women in unemployment rates.
Many women who are unemployed are, in fact, not counted. First of all, there is a tendency among censustakers to automatically attribute the status of "unemployed" housewife to a married woman who is notworking at the time of the census, without probing whether or not she is currently in search of work.Further, the conventional practice of defining the actively unemployed as those who sought work in theprevious week leaves out of the count the passively unemployed group of women: those wanting or needingwork but who are discouraged, and the groups of women who wanted a job and would have accepted one had itbeen offered. Inclusion of the passively unemployed group (which may have more members among women thanmen) in the unemployment rate would reflect a more accurate measure of the proportion of women available for employment.
POLICY RELEVANCE OF SOUND STATISTICS ON WOMEN'S WORK
Women will continue to be dropped from the labor force count unless more categories of activity status(full-time, part-time, seasonal worker, and the like) are introduced, unless occupational classificationsare set up to fit the specific types of work women pursue, and unless interviewers themsleves are trainedand sensitized to probe into the economic value and functions of the activities women perform.
Assigning a social and economic value to women's labor force participation has implications beyond theimprovement of statistics. The development of sensitive measures which address the critical questions"What types of work do women perform?" women who are active in the labor
and "What are the occupational characteristics and skill levels offorce?" directly bears upon formulation of employment policies for women.
A-15

USER COMMENTS
If subsequent efforts in this data capture/dissemination activity are to be improved in a manner maximallyresponsive to user needs , the major ideas for such improvement must come from the persons who actually usethe data to meet policy program and project needs. This tear-out form is placed here in multiple copiesto make it easy for successive users to submit constructive comments.
It would be l:elpful if The reader would clearly identify on this form the features of the Data by Sexbooklet considered particularly effective in contri!uting to its usefulness. Such supportive "feedback"is necessary to ensu-e th;ai the strong points of this report will be retained in the future.
It is smggested thar the introduction and Foreword be read once more before this form is completed, inorder- that the reader .a,; have a clear idea of just what the data base is meant to be, as well as what it is not meant to be.
AID field officers should air pouch the completed form to the address on the left, and others mail it to the address on the right:
Statistical Data by Sex Statistical Data by SexDS/DIU/ESDS
DS/DIU/ESDSAID/Washington
Agency for International Development
Washington, D. C. 20523
U. S. A.
Please record your comments below, on the reverse side, and if necessary, on additional sheet(s).
A-16

USER COMMENTS (conLinued)
A-17