virtua health process driven design pebble … virtua health process driven design pebble conference...
TRANSCRIPT
1
Virtua Health Process Driven Design
Pebble Conference March 21, 2007
Mike Kotzen, COO, Voorhees HospitalTejas Gandi, Director Management Engineering
Stephanie Fendrick, Greenfield PM
Agenda• Introduction to Virtua Health
– Relationship with GE– History with Six Sigma
• Vision for New Campus• Architect Selection Process• Future State Planning Process• Master Site Planning Process• Management Engineering Role

2
Virtua Health….Today• Four hospital system in Southern New Jersey• Two Long Term Care Facilities• Two Home Health Agencies• Two Free Standing Surgical Centers• Ambulatory Care - Camden• Fitness Center• 7000 employees + 1700 physicians• 7,500 deliveries• $840 million in revenues• STAR Culture
Virtua Health: Where We Were?• 1999: Merged corporate departments;
integrated governance and management structures---Average performance.
• 01/01: CEO “We don’t want to be average…We want to be outstanding.”
• 03/01: Created a system wide cultural transformation: The STAR Initiative
• 10/01: Began the use of the GE Tool Kit to support cultural change

3
Excellent service
Best people
Caring culture
Highest clinical quality
Resourcestewardship
Outstanding Patient
Experience
StrategyStrategy
Mission and
Mission and
ValuesValues
Performance
Performance
The VirtuaThe Virtua
Current State: STAR
Commitment
Desired State: STAR
Performance
It’s Great to Have a Philosophy . . . But We Need a Strategy !!
Six Sigma is part of our strategy on our journey through the mazeSix Sigma is part of our strategy on our journey through the maze
4
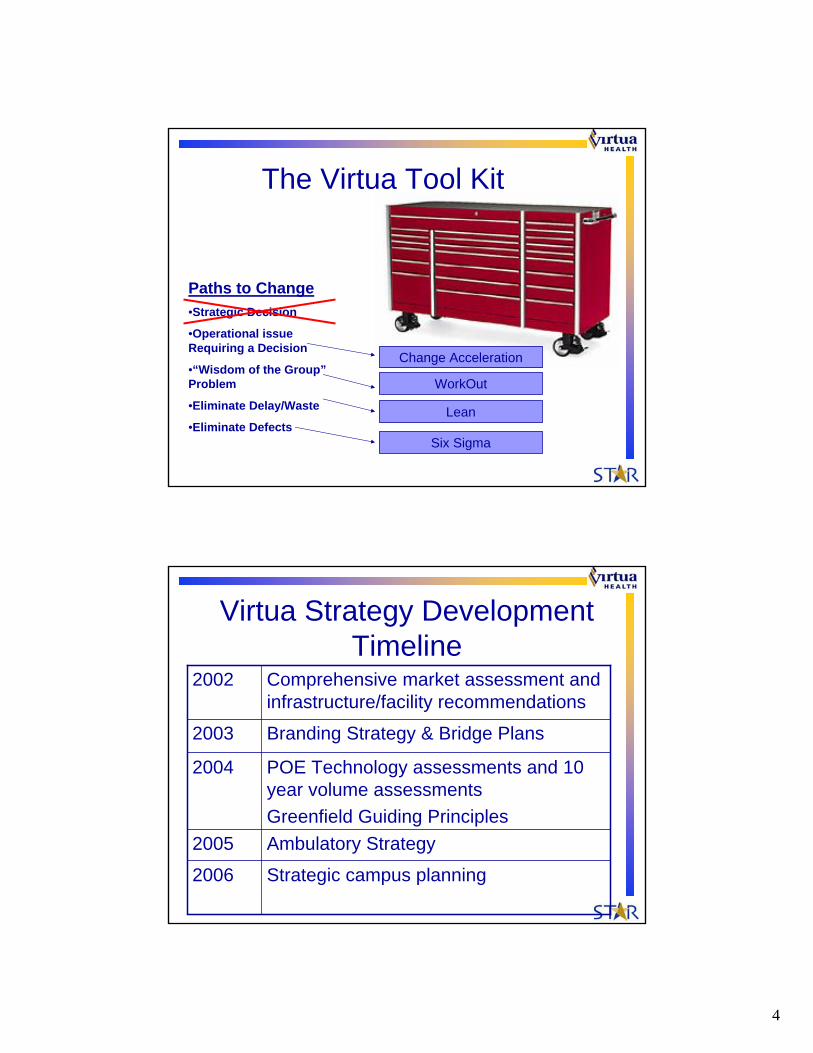
The Virtua Tool Kit
Paths to Change•Strategic Decision
•Operational issue Requiring a Decision
•“Wisdom of the Group”Problem
•Eliminate Delay/Waste
•Eliminate Defects
Change Acceleration
WorkOut
Lean
Six Sigma
Virtua Strategy Development Timeline
Ambulatory Strategy2005
Strategic campus planning2006
POE Technology assessments and 10 year volume assessmentsGreenfield Guiding Principles
2004
Branding Strategy & Bridge Plans2003
Comprehensive market assessment and infrastructure/facility recommendations
2002

5
Overview of Current Voorhees Hospital
• 293 beds• 24,000 Admissions• 50,000 ED visits• 5500 births• 90%+ Typical
Occupancy Levels
Drivers for new campus• Replacement Hospital for Voorhees
Hospital – No capacity– Inefficient and costly hospital infrastructure– Landlocked site – Consumer preferences– Digital Hospital infrastructure needs– New technology for diagnosis and treatment
• Implement Ambulatory strategy – Capture shift of IP to OP– Patient convenience

6
Campus Guiding Principles• Provide a digital model to reduce errors, improve communication of
vital information and drive efficiency.• Develop a campus that is flexible and versatile with ability to
maintain appropriate adjacencies with future expansion. Plan for long-term consolidation.
• Create a feeling of destination upon arrival to the campus.• Create high touch/high tech facilities and services that
integrate technology with the delivery of world class level service.• Provide a full compliment of “one-stop” services.• Create and maintain the identity of specialty hospital or
centers (Women’s and Children’s Pavilion; Cancer Center) • Provide clear separation of outpatient and inpatient
services.• Provide clear definition between public vs. private spaces.• Provide a healing, family centered environment.• Maximize operational efficiency throughout.
Payor
Physician
Nurse
Hospital
Patient
Digital Transformation – 3 Themes1. Information access
everywhere – scope, documentation expand, leads to…
2. Streamline processes for efficiency
3. Establish new levels of processeffectiveness, robustness for better outcomes

7
With 3 Enablers to Safety, Quality
Paperless Filmless Wireless
Architect Selection ProcessEarly 2005
8
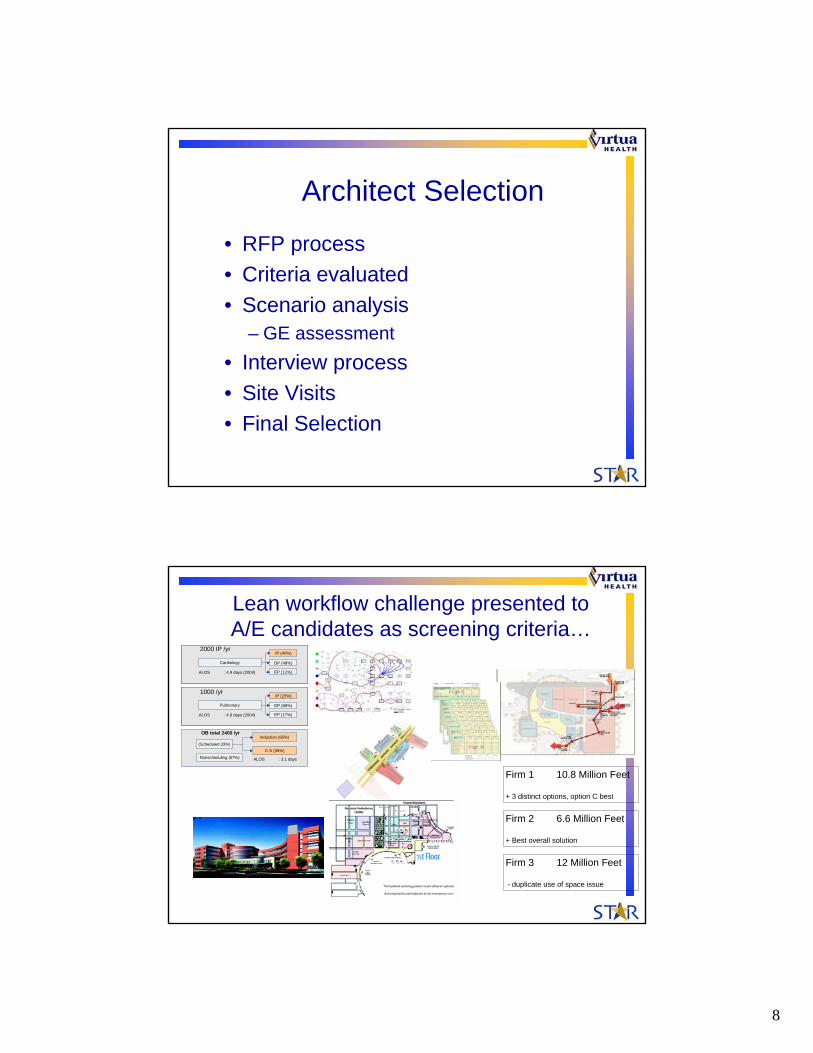
Architect Selection
• RFP process• Criteria evaluated• Scenario analysis
– GE assessment• Interview process• Site Visits• Final Selection
Lean workflow challenge presented to A/E candidates as screening criteria…
Cardiology
IP (40%)
OP (48%)
EP (12%)ALOS : 4.9 days (2004)
Cardiology
IP (40%)
OP (48%)
EP (12%)ALOS : 4.9 days (2004)
2000 IP /yr
Pulmonary
IP (15%)
OP (68%)
EP (17%)ALOS : 4.9 days (2004)
Pulmonary
IP (15%)
OP (68%)
EP (17%)ALOS : 4.9 days (2004)
1000 /yr
Induction (65%)
C-S (35%)(Scheduled 33%)
Nonscheduling (67%) ALOS : 3.1 days
OB total 2400 /yr
Firm 1 10.8 Million Feet
+ 3 distinct options, option C best
Firm 2 6.6 Million Feet
+ Best overall solution
Firm 3 12 Million Feet
- duplicate use of space issue

9
Fee
Reputation
Overall perceived strength, capability, and experience
Overall perceived strength, capability, and style – Exterior and Interior Design
Design within tight budgets
Energy Management experience (LEED project experience)
Design from the inside out
Understanding operating differences between inpatient and ambulatory services
Cutting edge healthcare assignment example
Collaborate with other professionals in a non traditional designapproach
Design the best patient centered care environment
Design to optimize mix and co-location of business ("B") and institutional ("I") occupancies
Enhance standard design process with clinical workflow analysis
Digital healthcare environment understanding & experience
Design experience with Women’s / Children’s services
Experience
Design & management team
321
HighMedium Low
AE Selection Criteria
Relative Importance
Future State Planning for the Future State Planning for the Greenfield campusGreenfield campus
Stephanie FendrickStephanie Fendrick
10
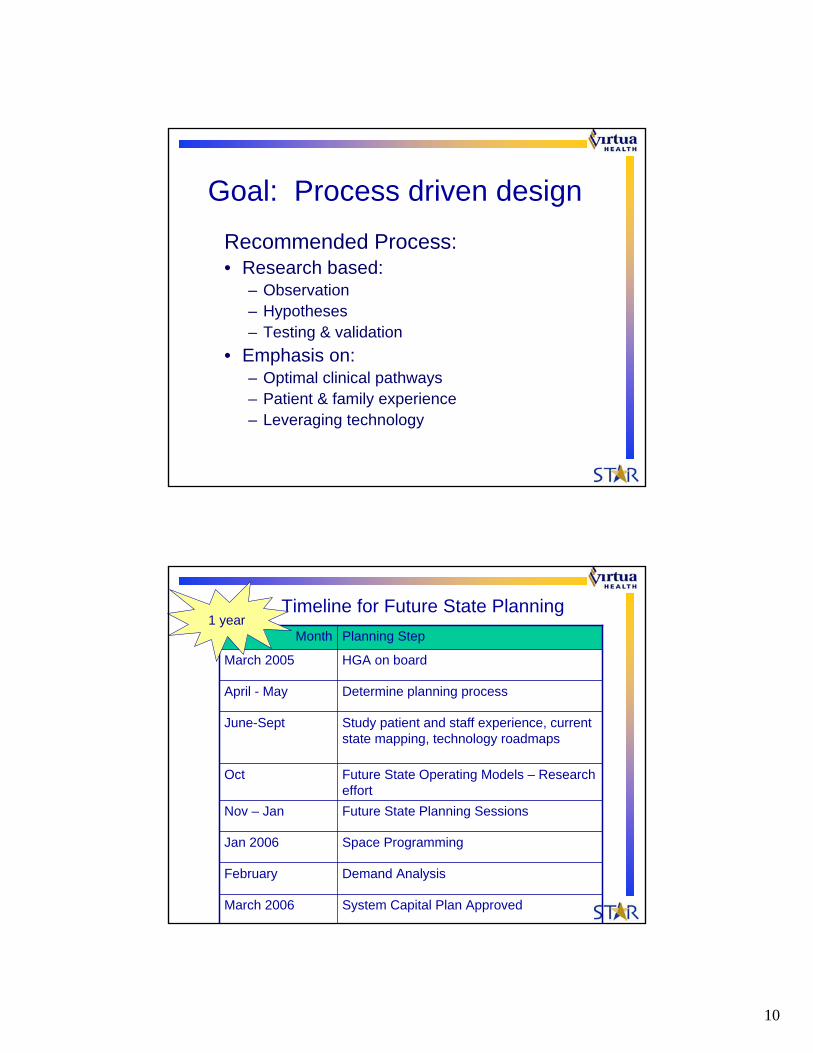
Goal: Process driven designRecommended Process:• Research based:
– Observation– Hypotheses– Testing & validation
• Emphasis on:– Optimal clinical pathways– Patient & family experience– Leveraging technology
Timeline for Future State Planning
Space ProgrammingJan 2006
Planning StepMonth
System Capital Plan ApprovedMarch 2006
Demand AnalysisFebruary
Future State Planning SessionsNov – Jan
Future State Operating Models – Research effort
Oct
Study patient and staff experience, current state mapping, technology roadmaps
June-Sept
Determine planning processApril - May
HGA on boardMarch 2005
1 year

11
IntegrationSite Visits Leading
Practice Research
Peer to Peer Surveys
Photo Journaling
Technology Roadmaps
From-to Adjacency
High LevelFlow
ARENASimulation
IT Enablers
Evidence Based Design
Patient Experience
Des
ign
Des
ign
FutureState
FutureState
TransformationTransformation
DesignIntelligence
Mov
e In
Mov
e In
SafetyChecklists
Greenfield Workflow – A/E Input Deck5569
4073
3699
2593
2378
2214
0 1000 2000 3000 4000 5000 6000
Cardiac PacemakerCardiac-OpenHeart
CardiologyDermatology
EndocrinologyGastroenterologyGeneral MedicineGeneral Surgery
Infectious DisNephrologyNeurology
NeurosurgeryOncology Hem/MedOncology Surgical
OphthalmologyOral Surgery
Orthopedic SurgerOtolaryngologyPlastic Surgery
PsychiatryPulmonary MedicinSubstance AbuseThoracic Surgery
UrologyVascular SurgeryW&C Gynecology
W&C NeonatalW&C Newborn
W&C Obstetrics
Serv
ice
Line
Discharges
Pareto High Volume Pathways
Adjust for Tech Roadmap
Procedures / MixCycle Times / Value Stream mapFlow Patterns/Spaghetti
Architectural Concepts
12
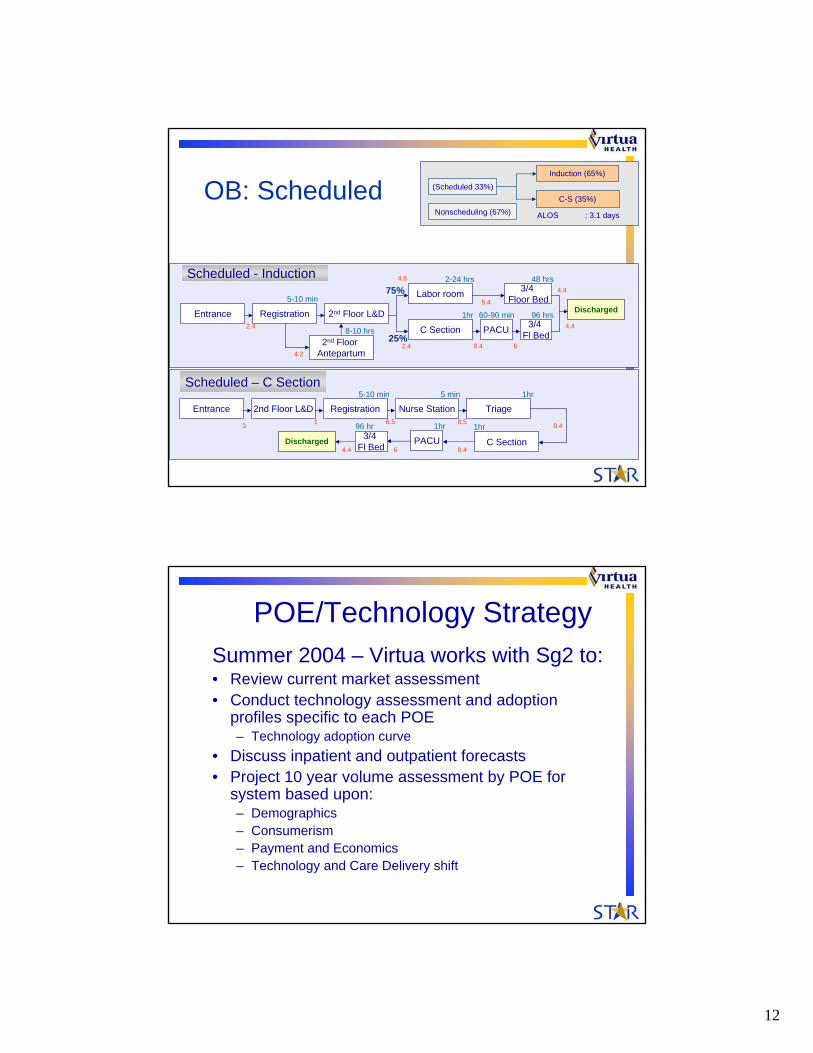
OB: ScheduledInduction (65%)
C-S (35%)(Scheduled 33%)
Nonscheduling (67%)
Entrance Registration2nd Floor L&D
Discharged
5-10 min
Nurse Station Triage
C SectionPACU3/4 Fl Bed
5 min 1hr
1hr1hr96 hr
Scheduled – C Section
Entrance Registration 2nd Floor L&D
Labor room
C Section PACU 3/4 Fl Bed
Discharged5-10 min
8-10 hrs2nd Floor
Antepartum
2-24 hrs75%
25%
60-90 min 96 hrs
3/4 Floor Bed
48 hrs
1hr
Scheduled - Induction
ALOS : 3.1 days
2.4
4.6
2.4 0.4 6
4.4
4.4
5.4
4.2
3 1 0.5 0.5 0.4
0.4 6 4.4
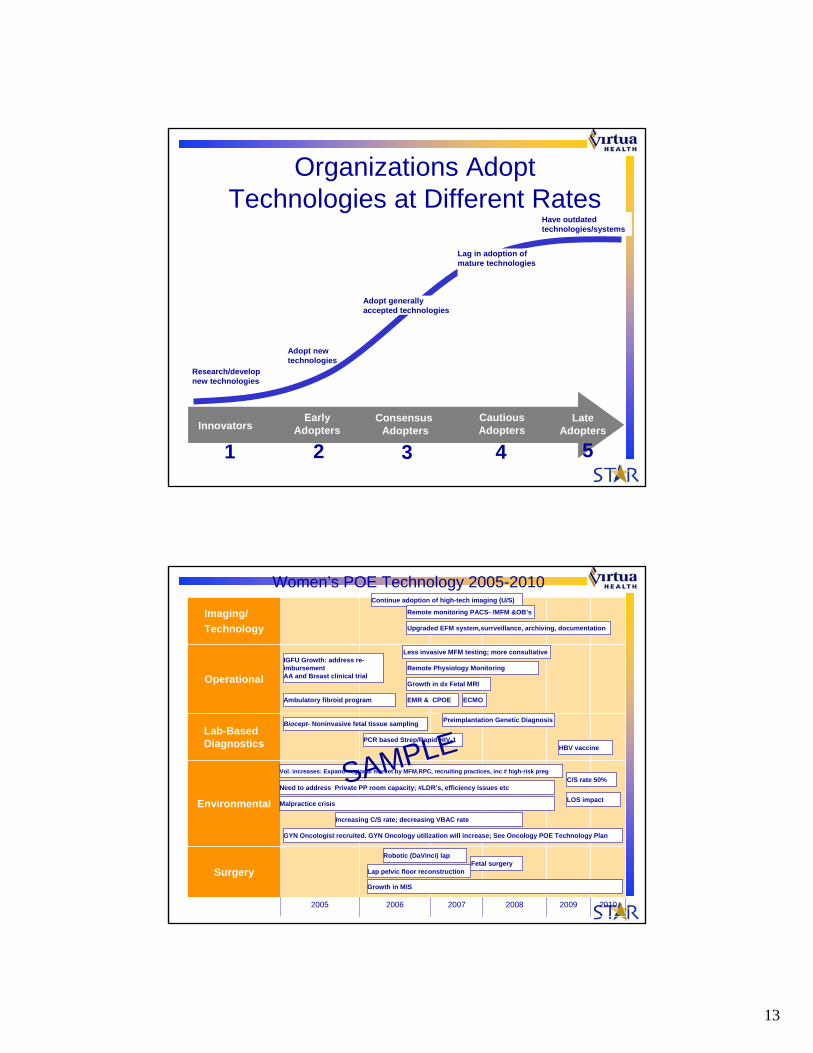
POE/Technology StrategySummer 2004 – Virtua works with Sg2 to:• Review current market assessment• Conduct technology assessment and adoption
profiles specific to each POE– Technology adoption curve
• Discuss inpatient and outpatient forecasts• Project 10 year volume assessment by POE for
system based upon:– Demographics– Consumerism– Payment and Economics– Technology and Care Delivery shift
13
Organizations Adopt Technologies at Different Rates
InnovatorsEarly
AdoptersConsensus
AdoptersCautiousAdopters
LateAdopters
Adopt new technologies
Research/develop new technologies
Have outdated technologies/systems
Lag in adoption of mature technologies
Adopt generally accepted technologies
1 2 3 4 5
Operational
Environmental
20092008200720062005
Surgery
Lab-Based Diagnostics
Imaging/Technology
2010
Women’s POE Technology 2005-2010
Vol. increases: Expand regional market by MFM,RPC, recruiting practices, inc # high-risk preg
EMR & CPOE
Continue adoption of high-tech imaging (U/S)
Biocept- Noninvasive fetal tissue sampling
C/S rate 50%
Fetal surgery
Need to address Private PP room capacity; #LDR’s, efficiency issues etc
Ambulatory fibroid program
Growth in dx Fetal MRI
Less invasive MFM testing; more consultative
Remote monitoring PACS- /MFM &OB’s
IGFU Growth: address re-imbursementAA and Breast clinical trial
Preimplantation Genetic Diagnosis
LOS impact
Robotic (DaVinci) lap
PCR based Strep/Rapid HIV-1
Lap pelvic floor reconstruction
Increasing C/S rate; decreasing VBAC rate
Upgraded EFM system,surrveillance, archiving, documentation
Malpractice crisis
ECMO
HBV vaccine
Growth in MIS
GYN Oncologist recruited. GYN Oncology utilization will increase; See Oncology POE Technology Plan
Remote Physiology Monitoring
SAMPLE
14
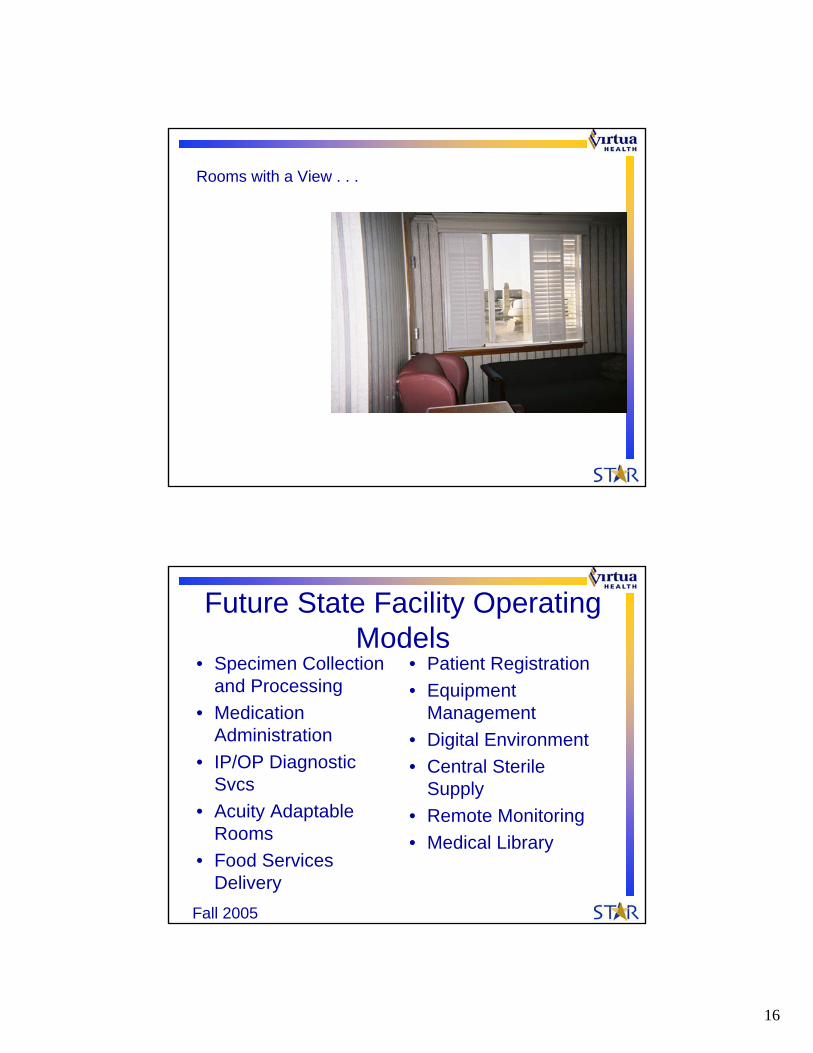
Photo journaling
• Staff perspective • Patient perspective
Summer 2005
Major Themes expressed in photo journals
• Lack of storage• Lack of privacy• Lack of personal space for staff• Poor waiting spaces• Public and private spaces mixed• Unscenic views for patients and staff• Poor work spaces
15
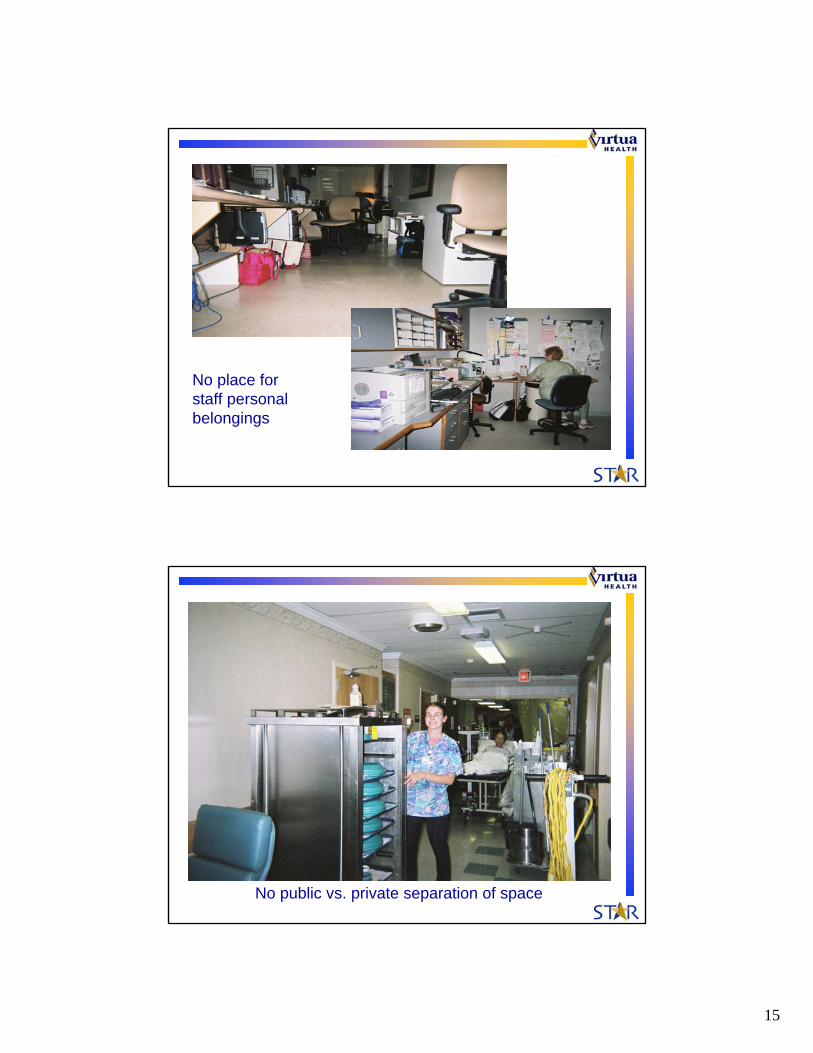
No place for staff personal belongings
No public vs. private separation of space
16
Rooms with a View . . .
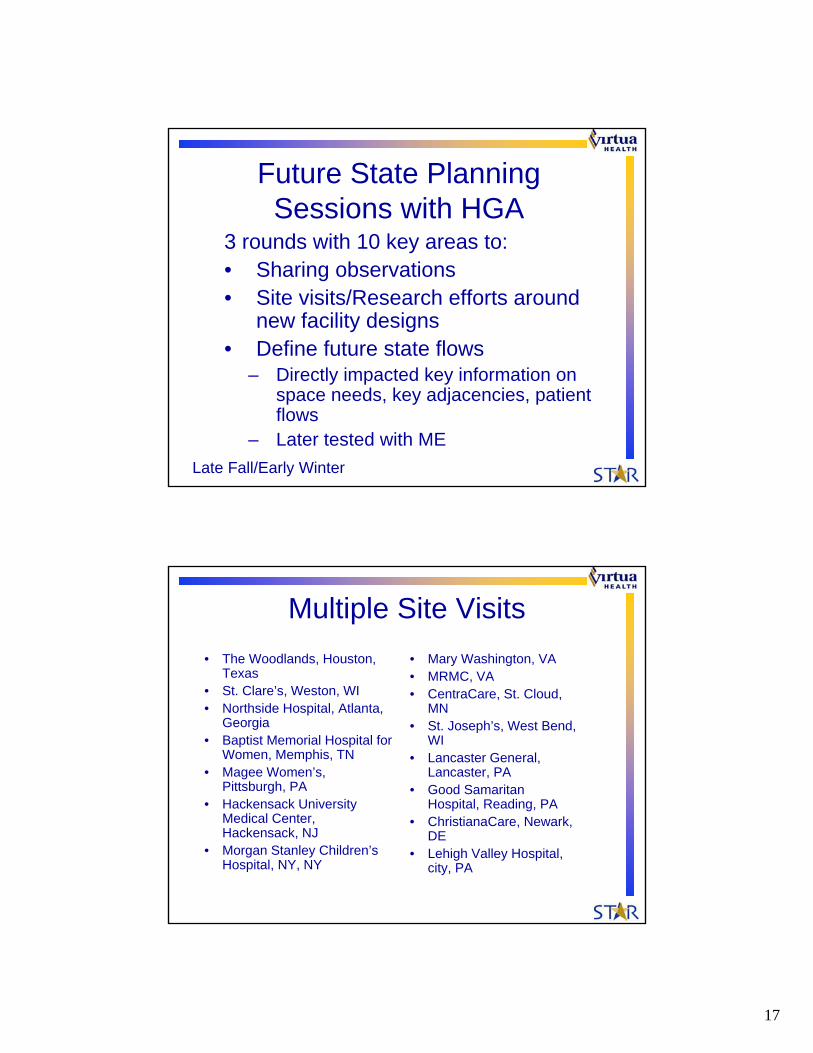
Future State Facility Operating Models
• Specimen Collection and Processing
• Medication Administration
• IP/OP Diagnostic Svcs
• Acuity Adaptable Rooms
• Food Services Delivery
• Patient Registration• Equipment
Management• Digital Environment• Central Sterile
Supply• Remote Monitoring• Medical Library
Fall 2005
17
Future State Planning Sessions with HGA
3 rounds with 10 key areas to:• Sharing observations• Site visits/Research efforts around
new facility designs• Define future state flows
– Directly impacted key information on space needs, key adjacencies, patient flows
– Later tested with MELate Fall/Early Winter
Multiple Site Visits• The Woodlands, Houston,
Texas• St. Clare’s, Weston, WI• Northside Hospital, Atlanta,
Georgia• Baptist Memorial Hospital for
Women, Memphis, TN• Magee Women’s,
Pittsburgh, PA• Hackensack University
Medical Center, Hackensack, NJ
• Morgan Stanley Children’s Hospital, NY, NY
• Mary Washington, VA• MRMC, VA• CentraCare, St. Cloud,
MN• St. Joseph’s, West Bend,
WI• Lancaster General,
Lancaster, PA• Good Samaritan
Hospital, Reading, PA• ChristianaCare, Newark,
DE• Lehigh Valley Hospital,
city, PA

18
Community based Focus Groups
• Use of backwards imaging• Recommendations• Mock up evaluations• Update sessions
NICU –A Case Study• Photo journals illustrating concerns with
current layout• Focus group on past experience• Future State mtgs discussed ways to
organize unit – open, pods, single rooms• Single Rooms “This will never work”• Research on new level III NICU designs
– Site visits- “I could not believe it until I saw it!”• Focus Group input – privacy vs. security
balance
19
MASTER SITE PLANNINGMASTER SITE PLANNING
Mike KotzenMike Kotzen
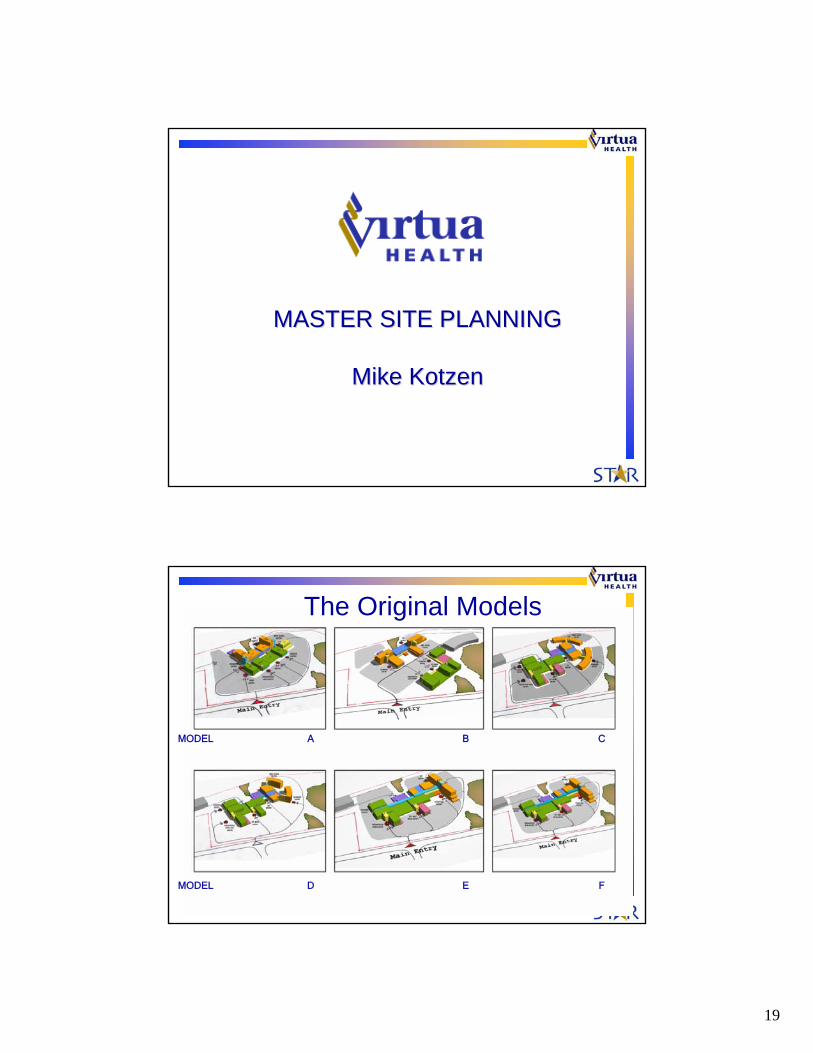
The Original Models
MODEL A B C
MODEL D E F

20
Model Evaluator Matrix
MODEL A

21
MODEL E
Master Site Plan Drivers• Two campus layout
– Inpatient (north)– Outpatient (south)
• Integrated physician offices in the center• Image of two inpatient hospital buildings
– Women’s and Children’s– Adult– Separate identities & separate visitor entrances
• Efficiency of one hospital - one campus– Service and Patient Spine
• Outpatient / ambulatory patient convenience• Flexibility for future growth
22
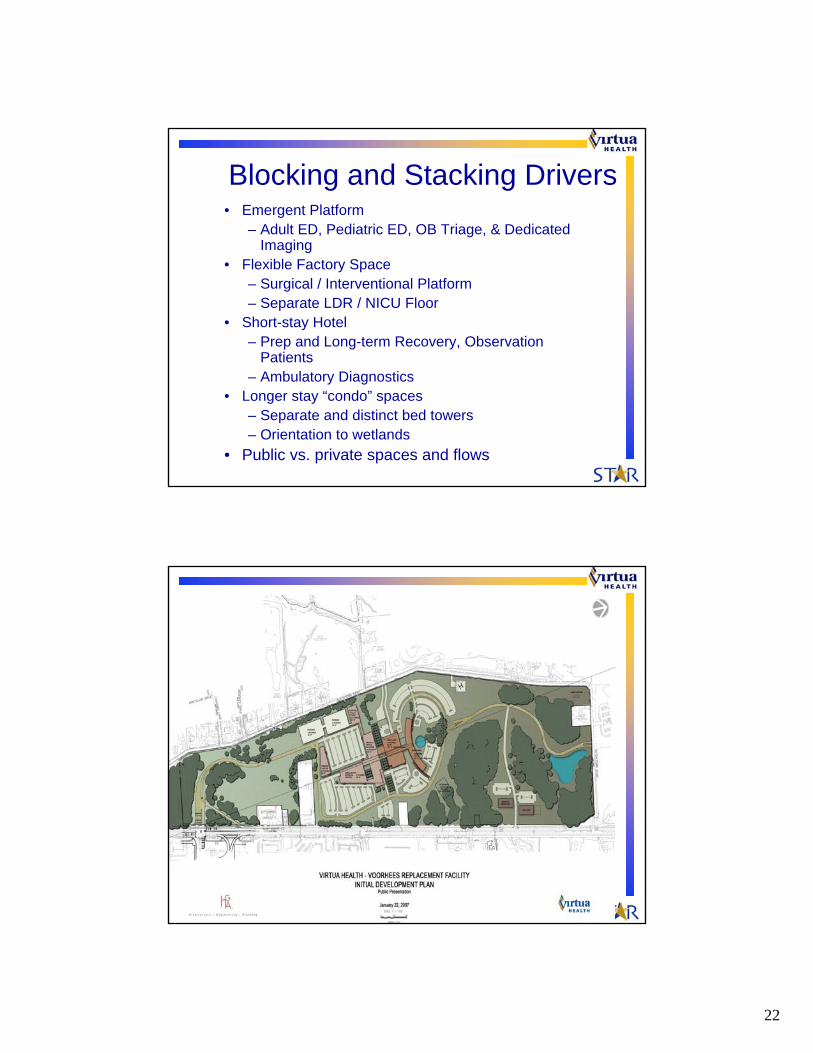
Blocking and Stacking Drivers• Emergent Platform
– Adult ED, Pediatric ED, OB Triage, & Dedicated Imaging
• Flexible Factory Space– Surgical / Interventional Platform– Separate LDR / NICU Floor
• Short-stay Hotel– Prep and Long-term Recovery, Observation
Patients– Ambulatory Diagnostics
• Longer stay “condo” spaces – Separate and distinct bed towers– Orientation to wetlands
• Public vs. private spaces and flows
Hybrid Master Site Plan Model

23
ROLE OF MANAGEMENT ROLE OF MANAGEMENT ENGINEERINGENGINEERINGTejas GandhiTejas Gandhi
Role of Management Engineering
• Modeling for demand analysis• MSP quantitative analysis• Blocking and stacking
recommendations• Schematic design – application of
LEAN
24
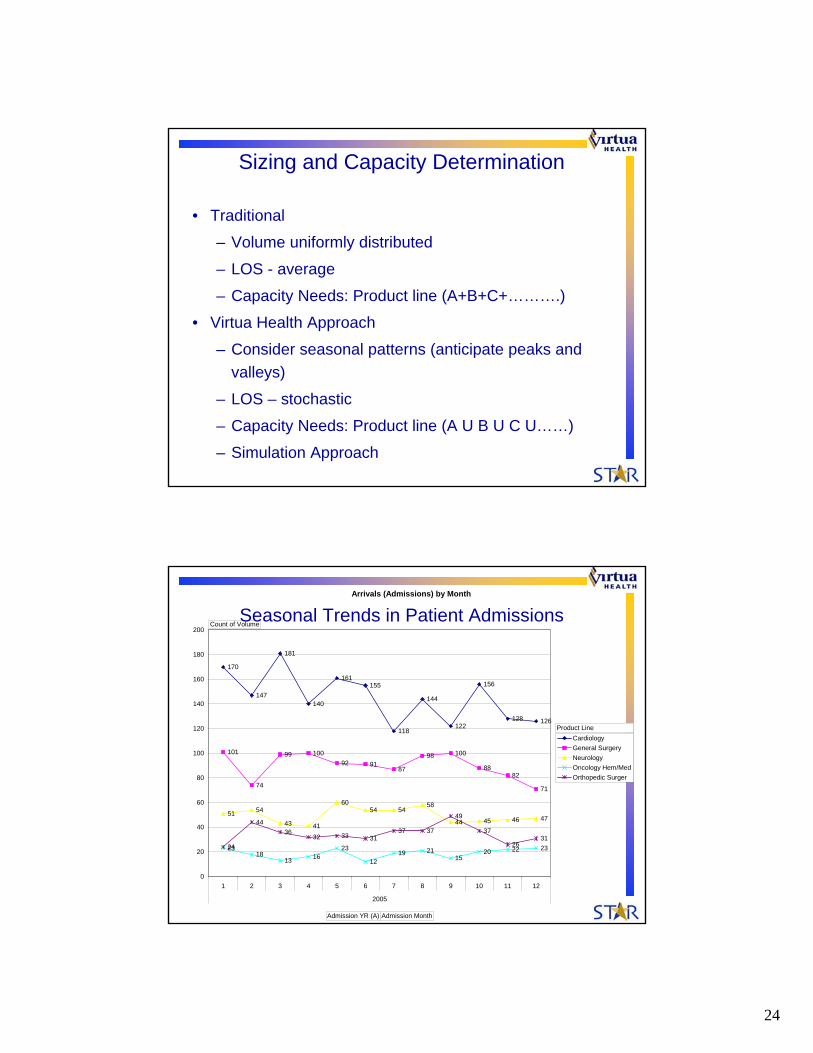
Sizing and Capacity Determination
• Traditional
– Volume uniformly distributed
– LOS - average
– Capacity Needs: Product line (A+B+C+……….)
• Virtua Health Approach
– Consider seasonal patterns (anticipate peaks and valleys)
– LOS – stochastic
– Capacity Needs: Product line (A U B U C U……)
– Simulation Approach
Arrivals (Admissions) by Month
170
147
181
140
161155
118
144
122
156
128 126
101
74
99 10092 91
87
98 100
8882
71
51 54
43 41
6054 54
58
44 45 46 47
2318
13 1623
1219 21
1520 22 2324
4436
32 33 3137 37
49
37
2631
0
20
40
60
80
100
120
140
160
180
200
1 2 3 4 5 6 7 8 9 10 11 12
2005
CardiologyGeneral SurgeryNeurologyOncology Hem/MedOrthopedic Surger
Count of Volume
Admission YR (A) Admission Month
Product Line
Seasonal Trends in Patient Admissions
25
2012 Utilization Rates Using Current Bed Capacities
0102030405060708090
100
Antepa
rtum
Postpa
rtum
Mother
Baby
WH Med
/Surg
Med/Surg
/Onc Te
le ICUNICU
Nursery PCU
Peds
PICU
Utliz
atio
n (%
)
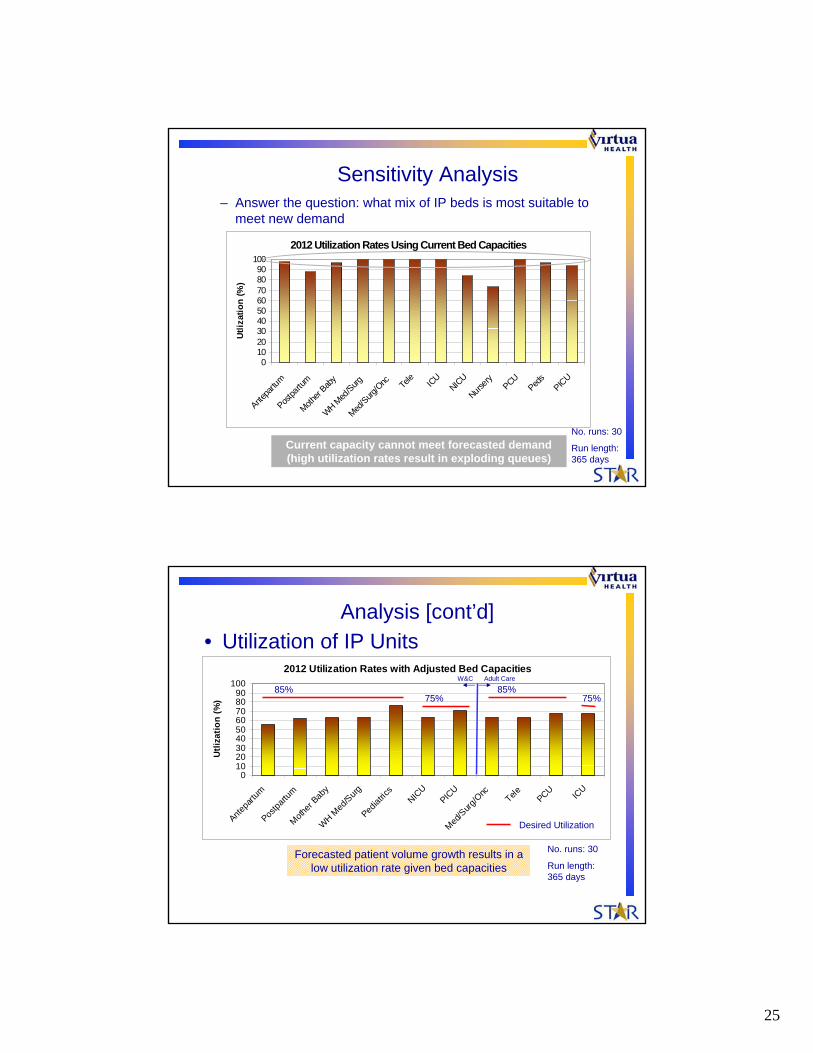
Sensitivity Analysis– Answer the question: what mix of IP beds is most suitable to
meet new demand
Current capacity cannot meet forecasted demand (high utilization rates result in exploding queues)
No. runs: 30
Run length: 365 days
2012 Utilization Rates with Adjusted Bed Capacities
0102030405060708090
100
Antepa
rtum
Postpa
rtum
Mother
Baby
WH Med
/Surg
Pediat
rics
NICU
PICU
Med/S
urg/O
ncTele PCU IC
U
Utli
zatio
n (%
)
Analysis [cont’d]• Utilization of IP Units
Forecasted patient volume growth results in a low utilization rate given bed capacities
Desired Utilization
85%75%
No. runs: 30
Run length: 365 days
85%75%
W&C Adult Care
26
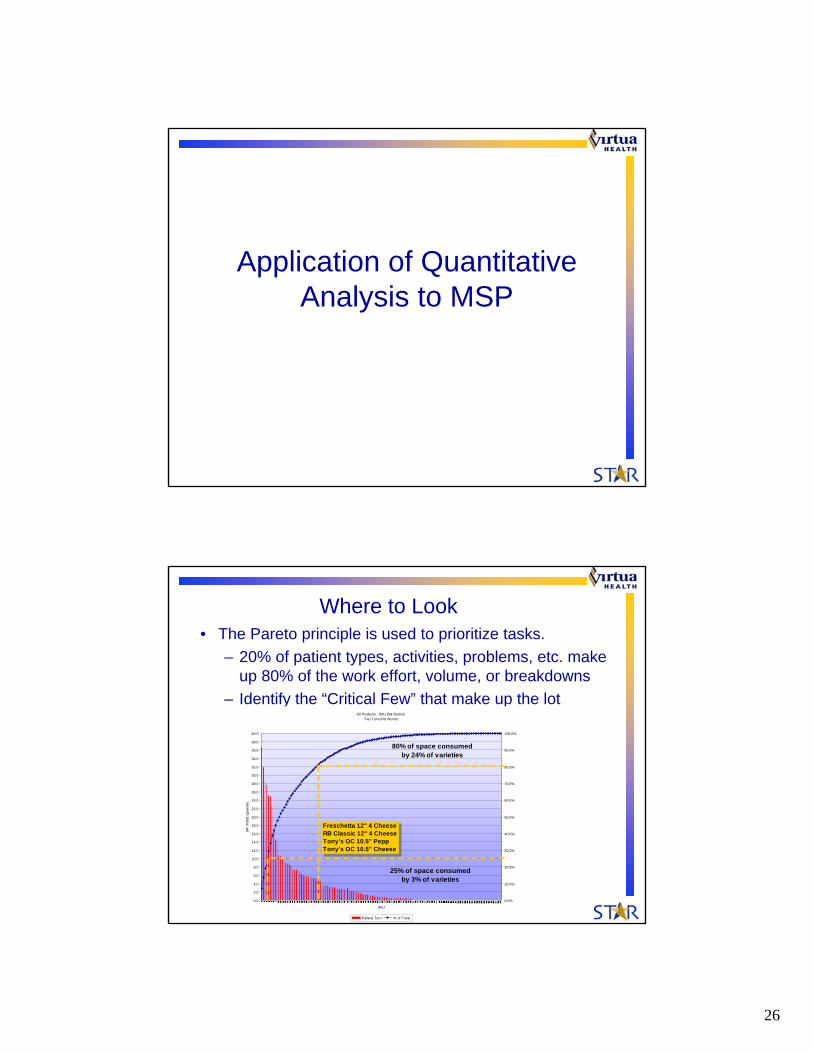
Application of Quantitative Analysis to MSP
Where to Look• The Pareto principle is used to prioritize tasks.
– 20% of patient types, activities, problems, etc. make up 80% of the work effort, volume, or breakdowns
– Identify the “Critical Few” that make up the lotAll Products - SKU Distribut ion
Two Turns Per Month
0.0
2.0
4.0
6.0
8.0
10.0
12.0
14.0
16.0
18.0
20.0
22.0
24.0
26.0
28.0
30.0
32.0
34.0
36.0
38.0
40.0
SKU
84" P
alle
t Qua
ntity
0.0%
10.0%
20.0%
30.0%
40.0%
50.0%
60.0%
70.0%
80.0%
90.0%
100.0%
Pallets/ Turn % of Total
80% of space consumed by 24% of varieties
25% of space consumed by 3% of varieties
Freschetta 12" 4 CheeseRB Classic 12" 4 CheeseTony's OC 10.5" PeppTony's OC 10.5" Cheese
27
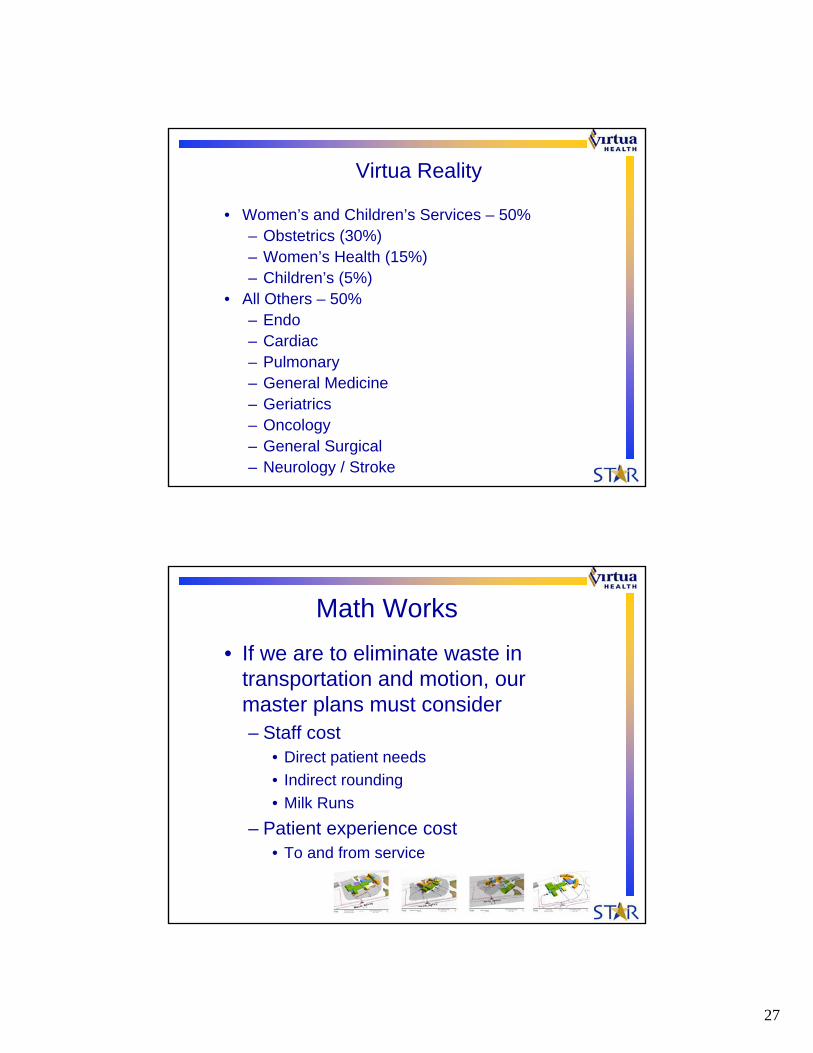
Virtua Reality
• Women’s and Children’s Services – 50%– Obstetrics (30%)– Women’s Health (15%) – Children’s (5%)
• All Others – 50%– Endo– Cardiac– Pulmonary– General Medicine– Geriatrics– Oncology– General Surgical– Neurology / Stroke
Math Works• If we are to eliminate waste in
transportation and motion, our master plans must consider– Staff cost
• Direct patient needs• Indirect rounding • Milk Runs
– Patient experience cost• To and from service
28
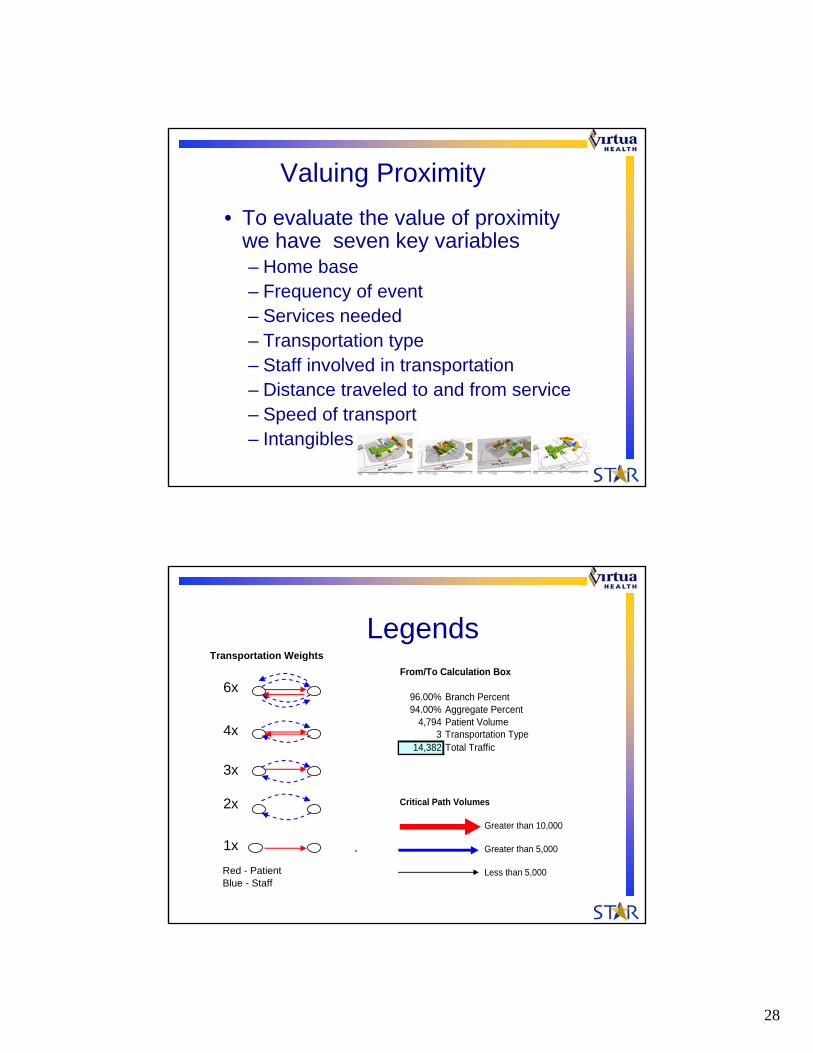
Valuing Proximity• To evaluate the value of proximity
we have seven key variables– Home base– Frequency of event– Services needed– Transportation type– Staff involved in transportation– Distance traveled to and from service– Speed of transport– Intangibles
LegendsTransportation Weights
6x
3x
4x
2x
1x
Red - PatientBlue - Staff
From/To Calculation Box
96.00% Branch Percent94.00% Aggregate Percent
4,794 Patient Volume3 Transportation Type
14,382 Total Traffic
Critical Path Volumes
Greater than 10,000
Greater than 5,000
Less than 5,000
29
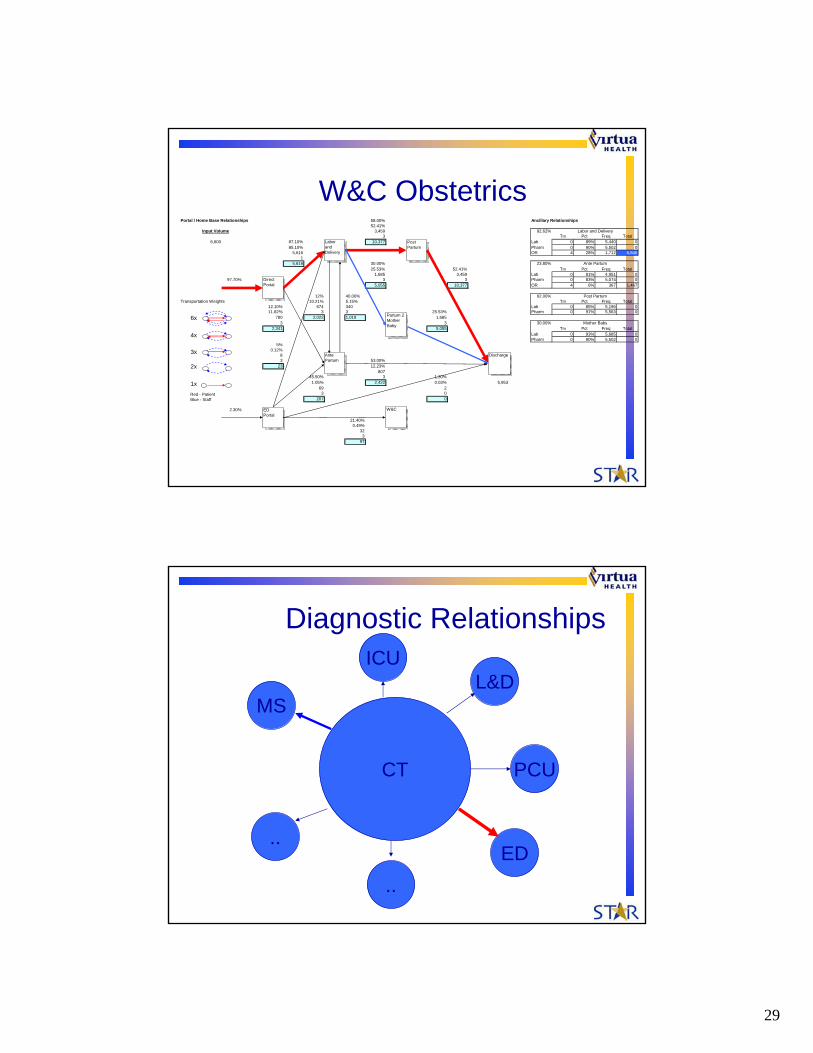
W&C ObstetricsPortal / Home Base Relationships 58.00% Ancillary Relationships
52.41%Input Volume 3,459 92.62% Labor and Delivery
3 Trv Pct Freq Total6,600 87.10% 10,377 Lab 0 89% 5,440 0
85.10% Pharm 0 90% 5,502 05,616 OR 4 28% 1,712 6,846
15,616 30.00% 23.80% Ante Partum
25.53% 52.41% Trv Pct Freq Total1,685 3,459 Lab 0 81% 4,951 0
97.70% 3 3 Pharm 0 83% 5,074 05,055 10,377 OR 4 6% 367 1,467
12% 40.00% 62.00% Post PartumTransportation Weights 10.21% 5.15% Trv Pct Freq Total
12.10% 674 340 Lab 0 85% 5,196 011.82% 3 3 25.53% Pharm 0 91% 5,563 0
780 2,022 1,019 1,6853 3 30.00% Mother Baby
2,341 5,055 Trv Pct Freq TotalLab 0 93% 5,685 0Pharm 0 90% 5,502 0
5%0.12%
83 53.00%
23 12.23%807
45.50% 3 1.30%1.05% 2,422 0.03% 5,953
69 23 0
207 0
2.30%
21.40%0.49%
323
97
EDPortal
DirectPortal
Ante Partum
Labor and Delivery
Post Partum
W&C
Discharge
Partum 2Mother Baby
6x
3x
4x
2x
1xRed - PatientBlue - Staff
Diagnostic Relationships
CT
L&D
..
..ED
ICU
PCU
MS

30
Blocking and Stacking Drivers
• Management Engineering Analysis:– Travel distances– Ancillary deployment– New models – Equipment Depot
• Cost and Space Programming– Best fit scenarios– I to B
Schematic Design
• Application of LEAN:• Updating process maps• Spaghetti diagrams – current state• Evaluation of alternatives
31
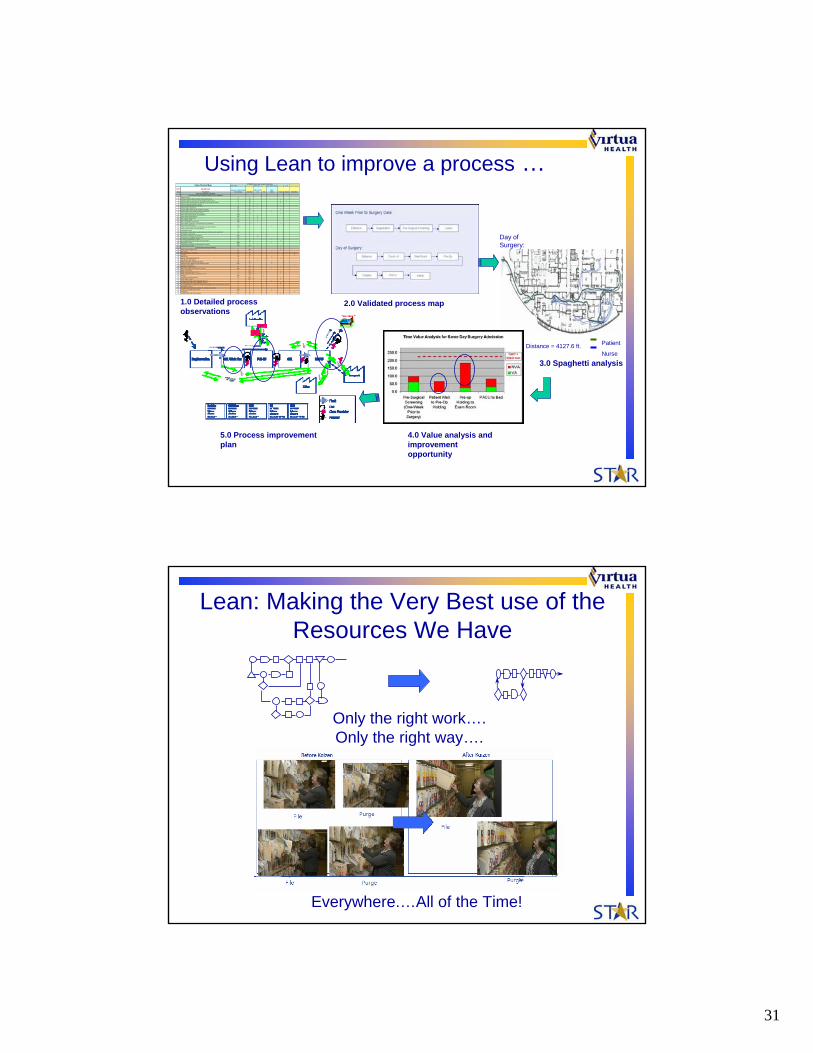
Using Lean to improve a process …Start Time: End Time: Total Cycle Time: 0:00
TAKT 22.65 min Observer: Sylvia Konopka Date: 12/7/04 Mark:Step Description Time (secs.) Dist.(Ft.) VA VE Wait Travel Inspect NVA-Other
Same Day Surgery AdmissionPre-Surgical Screening (One-Week Prior to Surgery)
0 Patient Arrives 0 01 Person at desks notifies Corrinne (screening person) 8 28 12 Corrinne walks to desk and checks off pt on sign in sheet 11 30 1 13 Corrine walks toward patient in waiting area to introduce herself 6 18 14 Corrine introduces herself to patient 1 0 15 Corrinne takes patient back to room 11 30 16 Patient Signs Paperwork 89 0 17 Corrine walks patient to per-surgical screening 84 137 18 Patient waits in pre-surgical surgical screening 577 0 19 Nurse takes patient into exam room B 20 28 1
10 Nurse asks questions/has pt sign papers 1670 0 111 Nurse takes blood pressure 168 0 112 Nurse takes temperature 14 0 113 Nurse draws blood 178 0 114 Nurse completes assessment 350 0 115 Nurse walks to phone to call anesthesia to come down 5 13 116 Nurse calls anesthesia 82 017 Patient waits for anesthesia, respiratory, and house doctor 108 0 118 House doctor arrives to do assessment 0 019 Respiratory arrives 0 020 Respiratory stamps forms, grabs pt bag, and leaves to come back later 128 23 121 Anesthesia enters room 0 022 Anesthesia completes assessment 313 0 123 House doctor completes assessment 596 0 124 Pt waits for respiratory to return 80 0 125 Pt is moved from exam room B to exam room A 17 20 126 Respiratory returns 1045 0 127 Respiratory completes assessment/instructions 109 0 128 Patient leaves building 138 147 1
Patient Wait to Pre-Op Holding29 Arrive in reg and get in line 6 36.6 130 wait in line 65 6 131 talk with ladies at front desk 15 0 132 sit down 13 20 133 wait in line 10 0 134 person at front desk walk to pt 5 0 135 lady at front desk with pt 20 0 136 Walk from Reg to OR Wait Rm Desk 59 172 137 Wait for clerk to show up to OR Wait Rm Desk 360 0 138 Check in at OR desk 0 0 139 OR desk to waiting area 0 73.0 140 Wait to be called to front desk for consult 365 0 141 Walk to front desk 8 73.0 142 Walk to consult room (1 or 2) 5 20.0 143 Clerk walks from desk to consult rm 1 or 2 87 16.0 144 Consult 108 0 145 Pt walks to seat in wait area 10 93.0 146 Clerk walks to desk 0 16.0 147 Wait until staff calls pt for bloodwork (if necc) 0 0 148 Pt walks from wait area to OR desk (if necc) 0 0 149 Pt and phlebotomist walk from OR desk to bloodwork area in pre-op room (if necc) 0 0 150 Bloodwork (if necc) 0 0 151 Pt walks from bloodwork area back to waiting area (if necc) 0 0 152 Wait until staff calls pt for pre-op 2767 0 153 Pt gets up 0 0 154 Pt walks from seat to pre-op door 15 30 1
STREAM: Same Day Surgery AdmissionValue Stream Map
1.0 Detailed process observations
2.0 Validated process map
Day of Surgery:
Distance = 4127.6 ft. Patient
Nurse
3.0 Spaghetti analysis
5.0 Process improvement plan
4.0 Value analysis and improvement opportunity
Lean: Making the Very Best use of the Resources We Have
Only the right work…. Only the right way….
Everywhere.…All of the Time!

32
Lean: Schematic Design• Pre-Schematic Session Work
– Integration of any previous work– Shadow map high quantity tasks by staff
• Activity description• Location accessed• Distance in motion
– Swim Lanes– Space Relationships– Spaghetti Diagrams– Identify Lean concepts and opportunities in existing
designs– Recommend ways to reduce waste in the system
from people, process, technology and space perspective
33
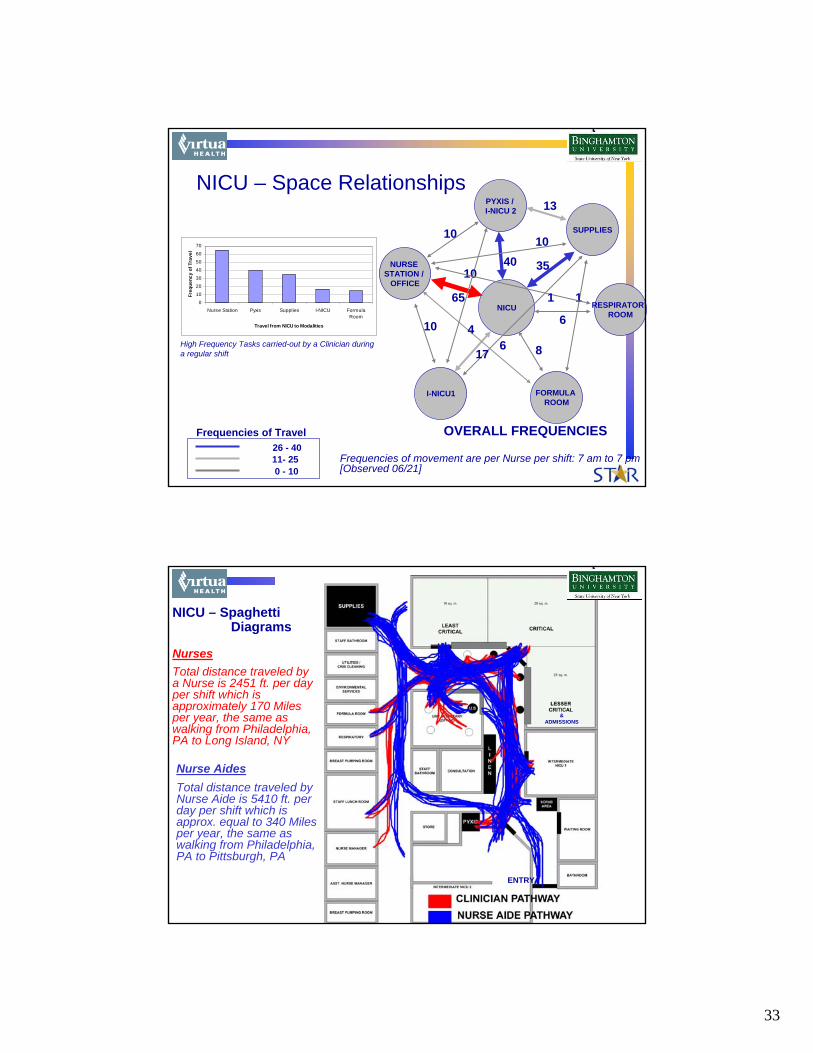
NICU – Space Relationships
NICU
PYXIS / I-NICU 2
RESPIRATORYROOM
FORMULA ROOM
NURSE STATION /
OFFICE
SUPPLIES
I-NICU1
26 - 4011- 250 - 10
Frequencies of movement are per Nurse per shift: 7 am to 7 pm[Observed 06/21]
40
65
6
8
10 10
10 4
OVERALL FREQUENCIES
10
1
Frequencies of Travel
13
1
617
35
0
10
20
30
4050
60
70
Nurse Station Pyxis Supplies I-NICU FormulaRoom
Travel from NICU to Modalities
Freq
uenc
y of
Tra
vel
High Frequency Tasks carried-out by a Clinician during a regular shift
NursesTotal distance traveled by a Nurse is 2451 ft. per day per shift which is approximately 170 Miles per year, the same as walking from Philadelphia, PA to Long Island, NY
Nurse AidesTotal distance traveled by Nurse Aide is 5410 ft. per day per shift which is approx. equal to 340 Miles per year, the same as walking from Philadelphia, PA to Pittsburgh, PA
NICU – SpaghettiDiagrams
&ADMISSIONS
ENTRY

34
Schematic Design: Evaluation• Process defines space not space defining process• Evaluate the activity
– Is it value added?– Will technology enable, eliminate or improve the activity?– Can you change the sequence or route to complete the
activity to reduce motion?– Can you bring the essentials tools and information within
reach or closer to the care giver to reduce motion?
• Evaluate the alternative designs– Map future state– Spaghetti map flows– Recommend pros and cons of design
Clinician
Nursing Aide
Clinician & Aide Travel Pathways
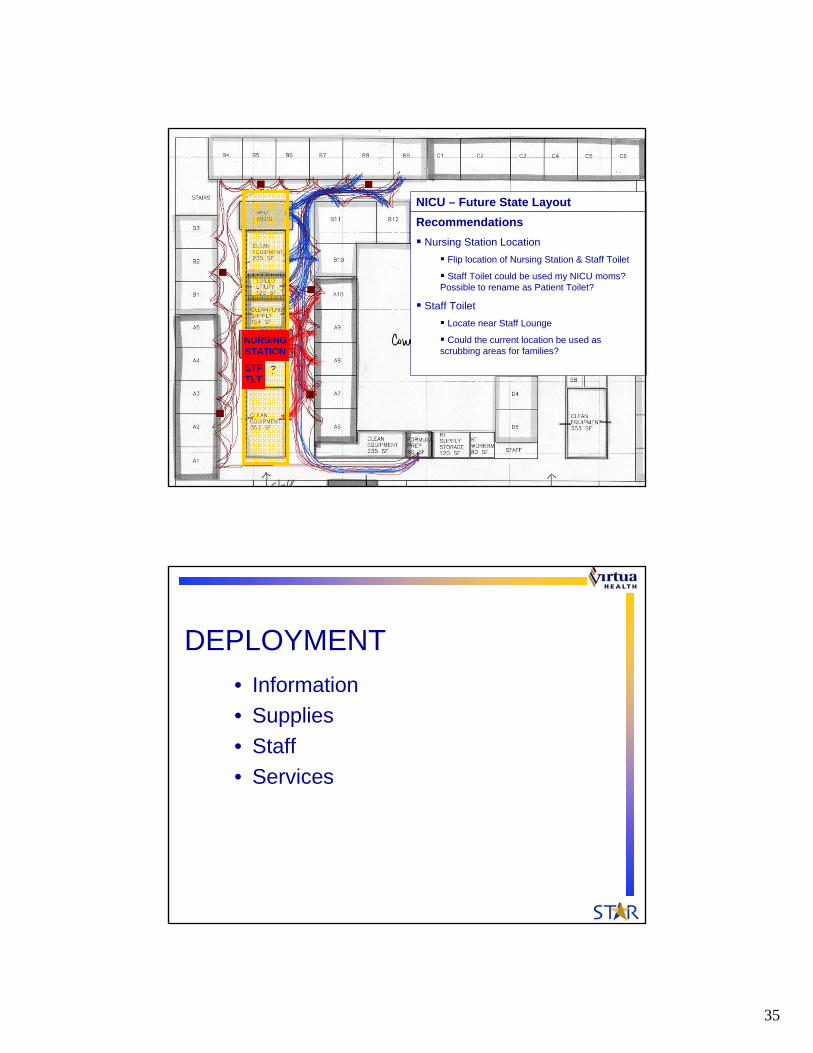
NICU – Future State Spaghettis
35
Clinician
Nursing Aide
Clinician & Aide Travel Pathways
RecommendationsNursing Station Location
Flip location of Nursing Station & Staff Toilet
Staff Toilet could be used my NICU moms? Possible to rename as Patient Toilet?
Staff ToiletLocate near Staff Lounge
Could the current location be used as scrubbing areas for families?
NICU – Future State Layout
NURSINGSTATION
STFTLT
DEPLOYMENT• Information• Supplies• Staff• Services
36
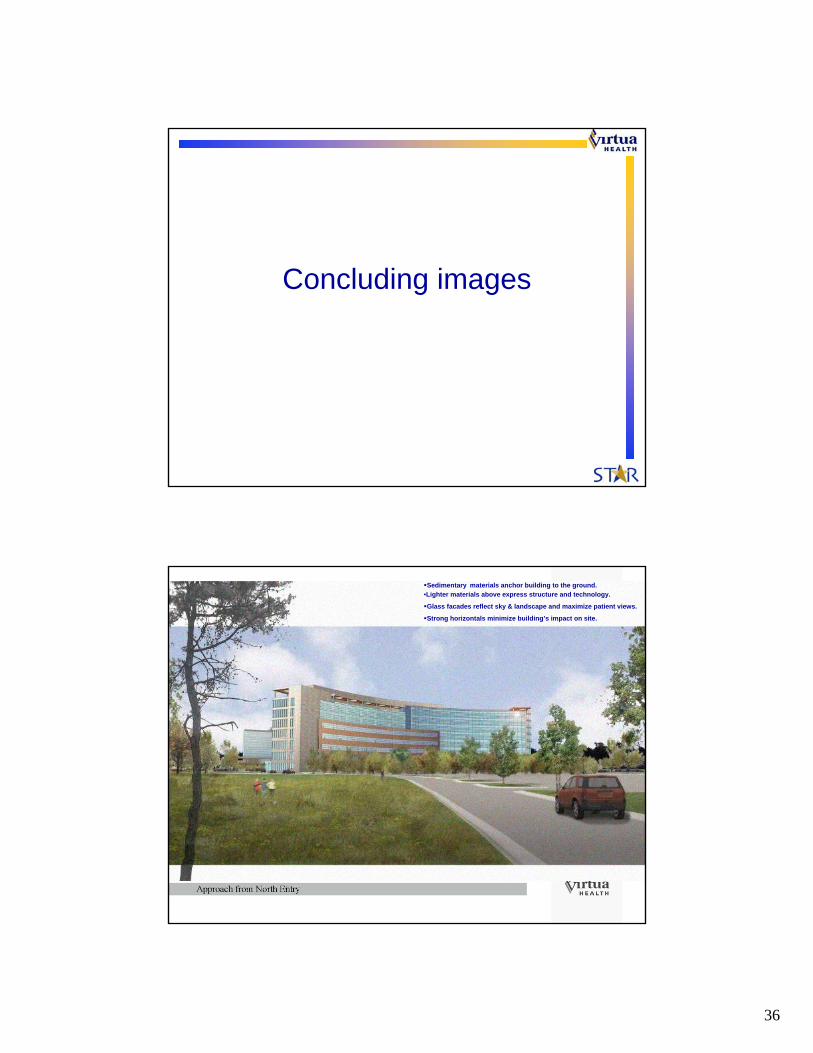
Concluding images
Sedimentary materials anchor building to the ground.•Lighter materials above express structure and technology.
Glass facades reflect sky & landscape and maximize patient views.
Strong horizontals minimize building’s impact on site.

37
Landscape flows through campus creating a variety of vistas for positive health and healing.
Intermittent courtyards aid patients in way-finding and a feeling of release.
The building acts as a filter and link between adjacent wet lands.
The building takes advantage of indirect light from the north while restricting the harsh southern sun.
The campus creates an intimate sensation through creation of plazas and gardens.

38
Glass lanterns at ends of bed tower mark entries and family waiting areas.
Canopy & signage extend from the building and grab the ring road to direct patients to the entrance.
Courtyards orient patients as they travel through building.
Views are directed toward gardens and limit views onto adjacent parking lots.
Images of successful patients illustrate the importance of human interaction in Virtua’s process.
Purposefully human scaled environment instills a sense of calm.

39
Captivates the senses through sight, scent, touch, and sound.
The curve of the bed tower embraces the landscape.
The postpartum is expressed with the accent material.
Emergency Department is separated from ambulance drop off through landscaping.
Thoughtful and engaging through concealing and revealing.

40
Potential Pebble ProjectsAccess to Natural Light and Nature
Way finding with multiple entrances, distributed parking, separate visitor experiences.
Observation unit in ambulatory setting and impact on LOS
Single Room NICU
Inpatient unit design with decentralized charting stations, decentralized support areas,
Impact of floor design on travel distances – reduced walking and improved workflow – reduce time hunting and gathering
Private patient rooms with a patient controlled environment, family centered care environment, hospitality like setting, safety
Team hub design to promote care team environment. Impact of decisions with regarding to lighting and acoustics in this area.
Medication distribution process and impact on med errors with pharmacy deployed near patients and decentralized medication room and new technologies
Equipment Depot and impact on service response time& nursing efficiency
Work Process StudyInpatient Unit Design
• Decentralized Charting Stations• Decentralized Support• New Technologies• Strategically Located Hand-washing Stations
• Measurable Outcomes– Increase in patient safety / observation– Decrease in time “hunting & gathering”– Decrease in staff fatigue / errors– Decrease in “sneaker time”– Increase in communication – Increase in infection control ratings
41
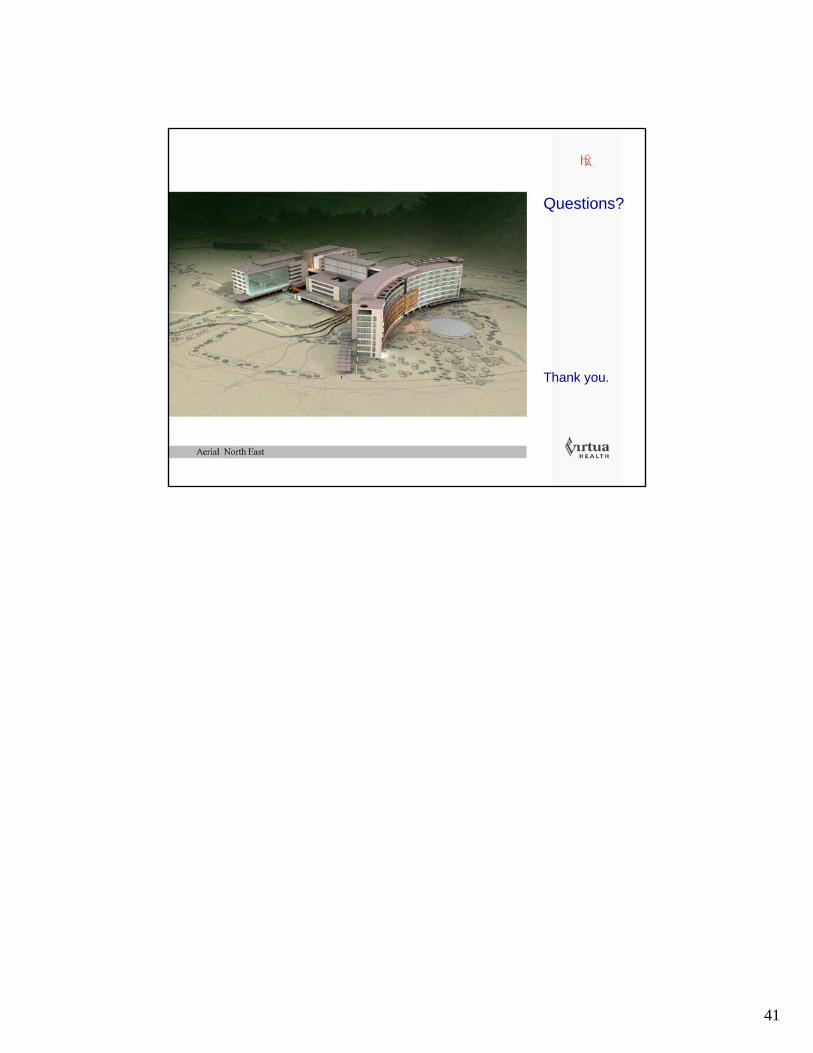
Questions?
Thank you.