peace bridge neighborhood air quality study: 3rd data ... · an api 651 ufp monitor was ... dates...
TRANSCRIPT

1
Peace Bridge Neighborhood Air Quality Study: 3rd Data Review Meeting
Data: 2nd Qtr 2015Presentation: September 2, 2015

2
About the Study: DesignOne full year of monitoring - August 2014 to (August – September) 2015
Objective: Seasonal pollutant profiles and annual VOC/Carbonyl data Study goal: to increase understanding of the impact of mobilesource emissions (BC, VOCs, Carbonyls and UFP)
Downwind Site - Busti Avenue near Rhode Island StreetSource impact site is within the residential neighborhood
Urban Site - PS198 International Preparatory School Background site is away from Bridge and within the same community
Community Sampling Effort – Citizen ScienceTrained volunteers from Clean Air Coalition of Western New York

3
2005-2009 Met Data
from Buffalo Airport
4
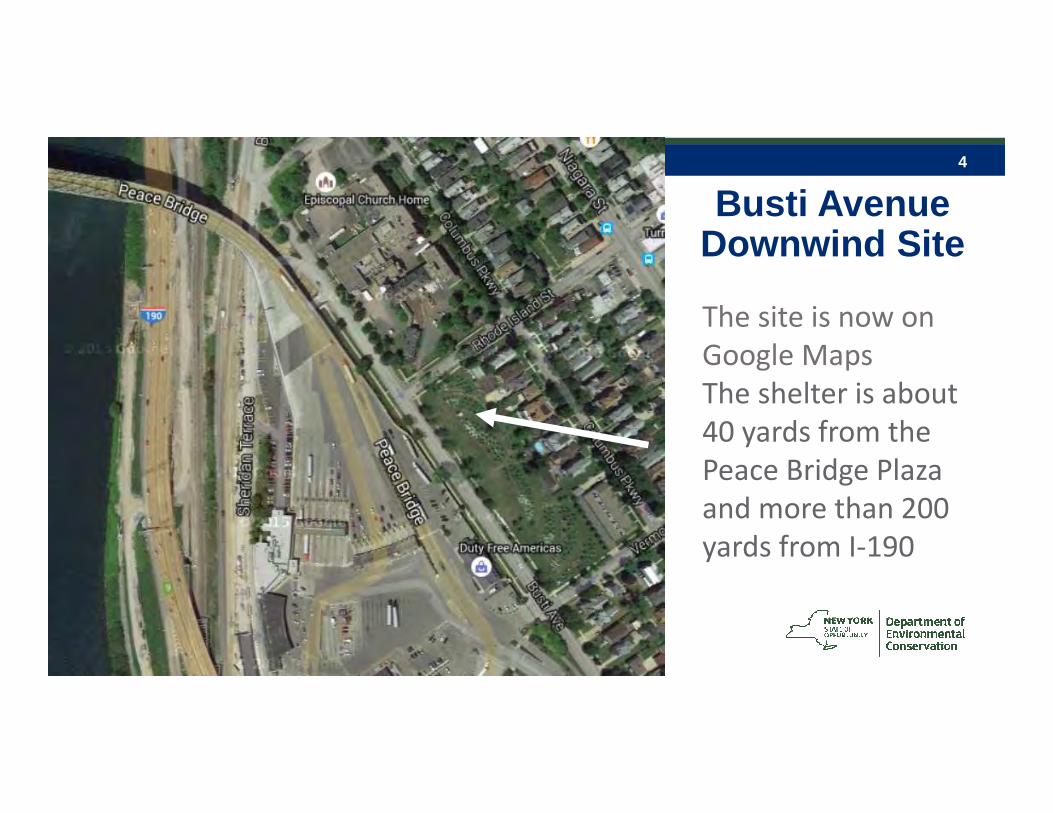
Busti Avenue Downwind Site
The site is now on
Google Maps
The shelter is about
40 yards from the
Peace Bridge Plaza
and more than 200
yards from I-190
5
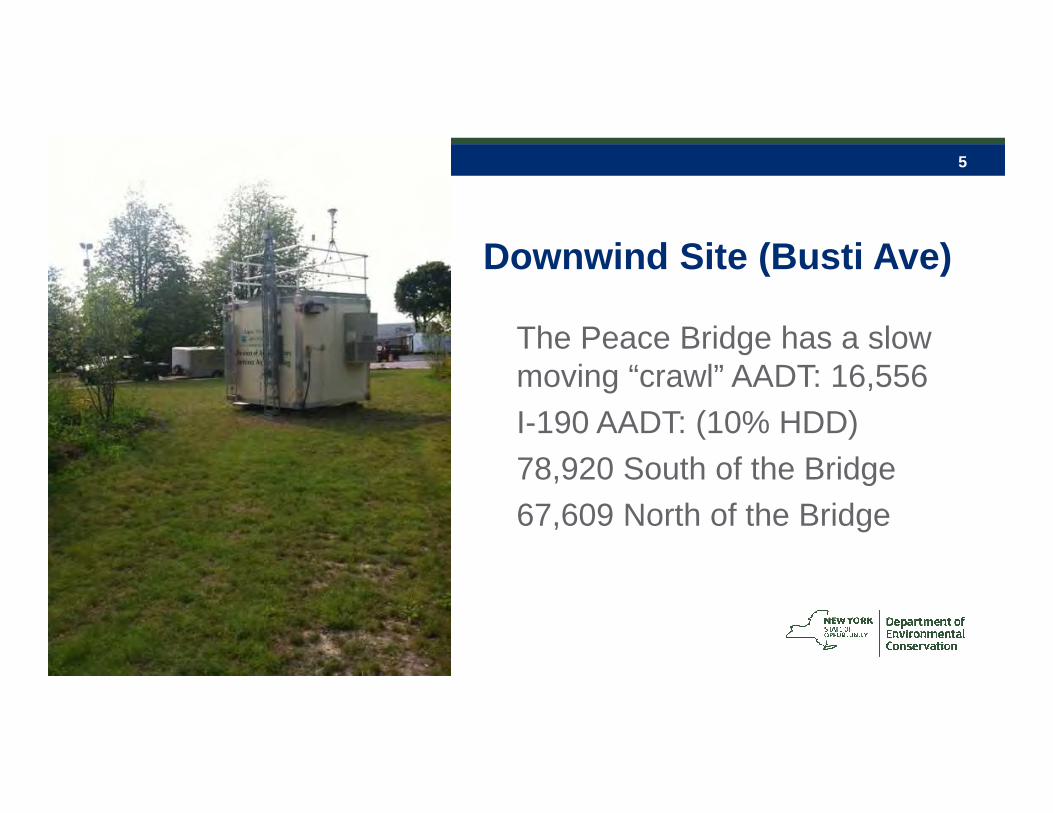
Downwind Site (Busti Ave)
The Peace Bridge has a slow moving “crawl” AADT: 16,556
I-190 AADT: (10% HDD)
78,920 South of the Bridge
67,609 North of the Bridge
6
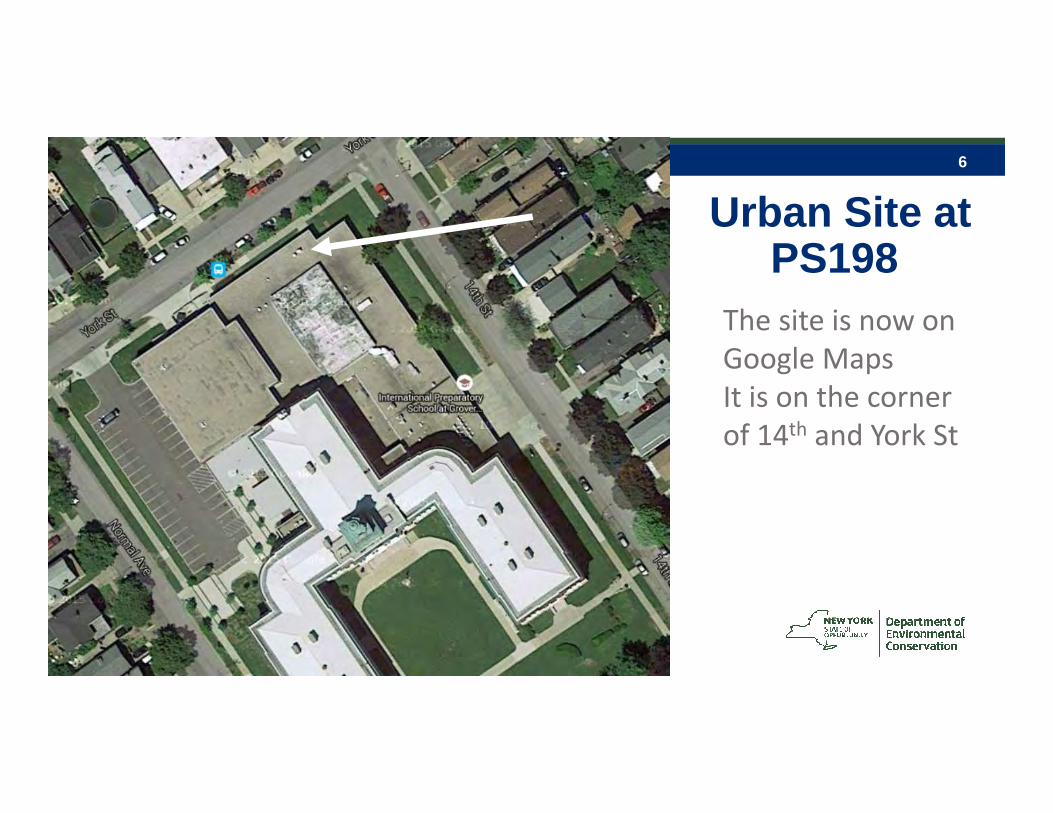
Urban Site at PS198
Black Carbon
PM2.5
The site is now on
Google Maps
It is on the corner
of 14th and York St
7
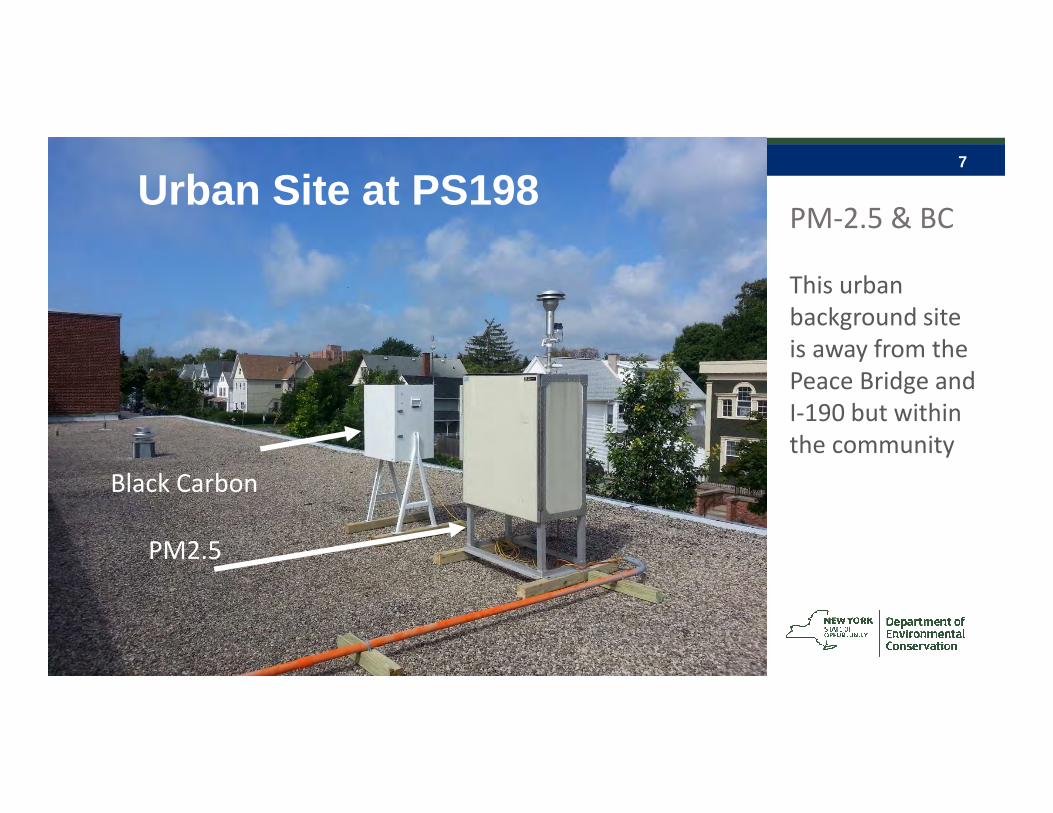
Urban Site at PS198
Black Carbon
PM2.5
PM-2.5 & BC
This urban
background site
is away from the
Peace Bridge and
I-190 but within
the community
8
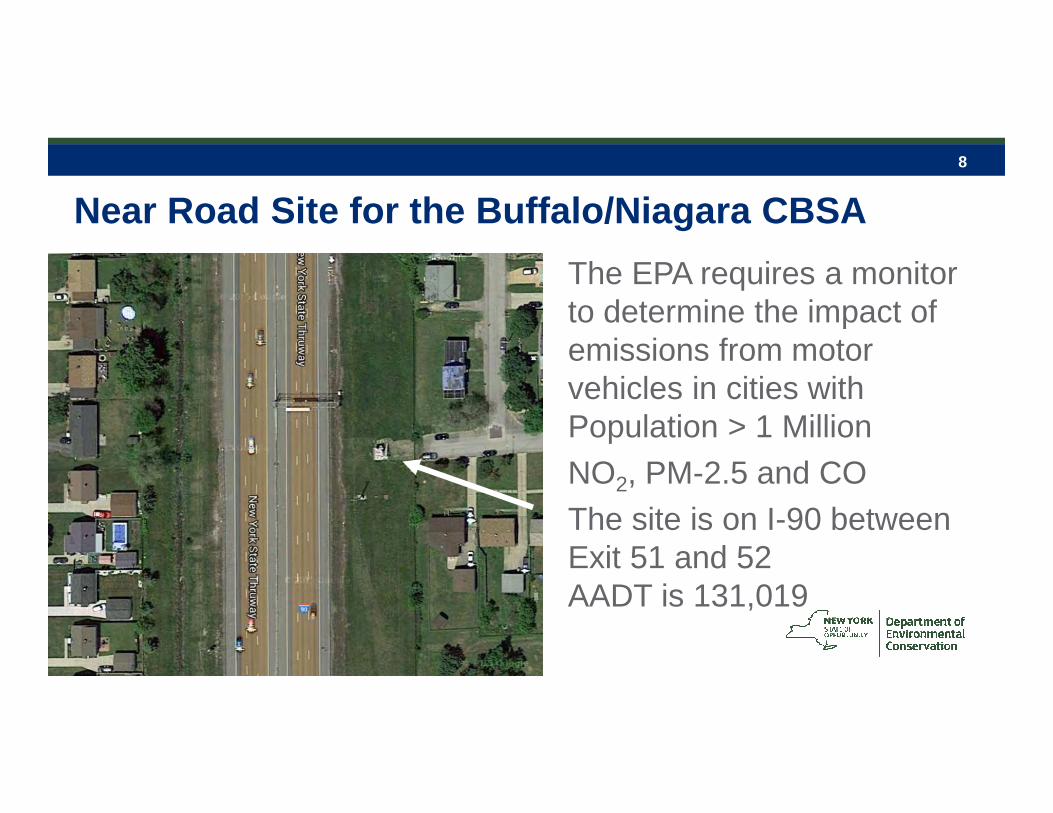
Near Road Site for the Buffalo/Niagara CBSA
The EPA requires a monitor to determine the impact of emissions from motor vehicles in cities with Population > 1 Million
NO2, PM-2.5 and CO
The site is on I-90 between Exit 51 and 52 AADT is 131,019
9
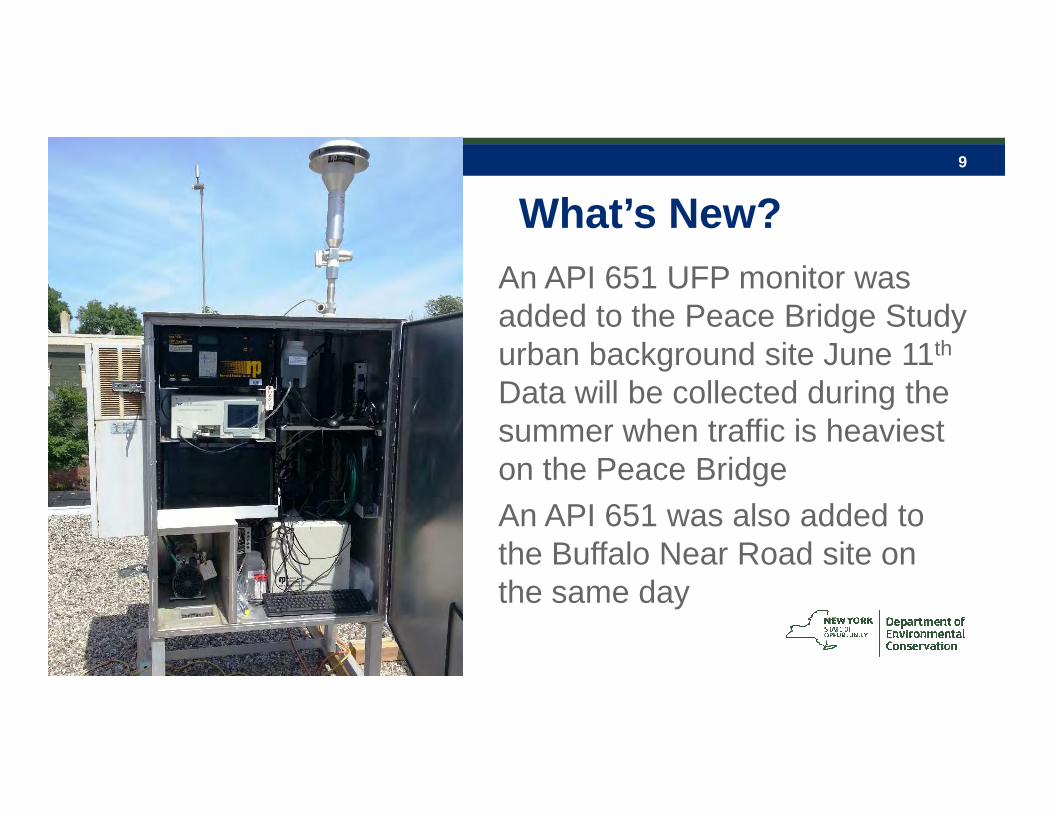
What’s New?An API 651 UFP monitor was added to the Peace Bridge Study urban background site June 11th
Data will be collected during the summer when traffic is heaviest on the Peace Bridge
An API 651 was also added to the Buffalo Near Road site on the same day
10
Data Collection: Dates in 2014 & 2015Busti Avenue Site
• PM-2.5, Meteorological, BC: 8/11/14 – 9/30/15
• Ultrafine Particle Data (UFP): 9/24/14 – 9/30/15
• (VOC) and Carbonyl sample collection 8/15/14 – 9/30/15
PS 198
• BC: 8/21/14 – 9/30/15
• PM-2.5: 8/26/14 – 9/30/15
• UFP: 6/11/15 – 9/30/15 (summer deployment – highest bridge traffic)
Peace Bridge and I-190 Traffic
• Vehicle transit and delay data available Monthly
11
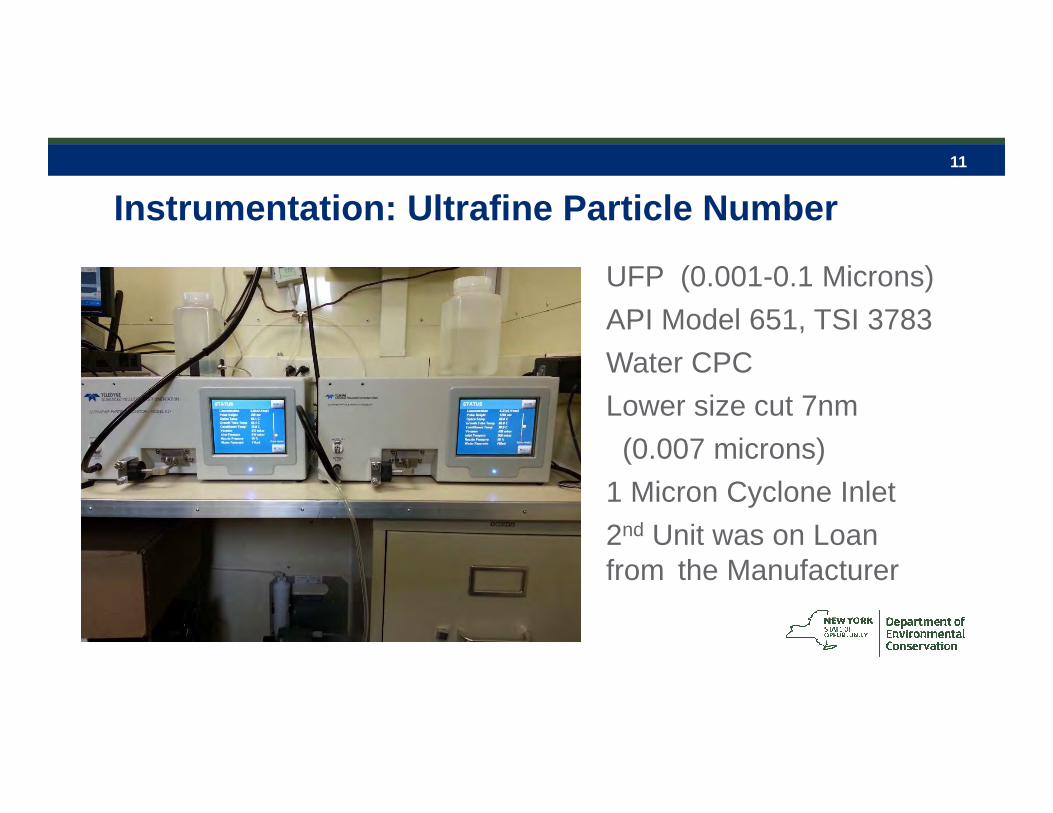
Instrumentation: Ultrafine Particle Number
UFP (0.001-0.1 Microns)
API Model 651, TSI 3783
Water CPC
Lower size cut 7nm
(0.007 microns)
1 Micron Cyclone Inlet
2nd Unit was on Loan from the Manufacturer
12
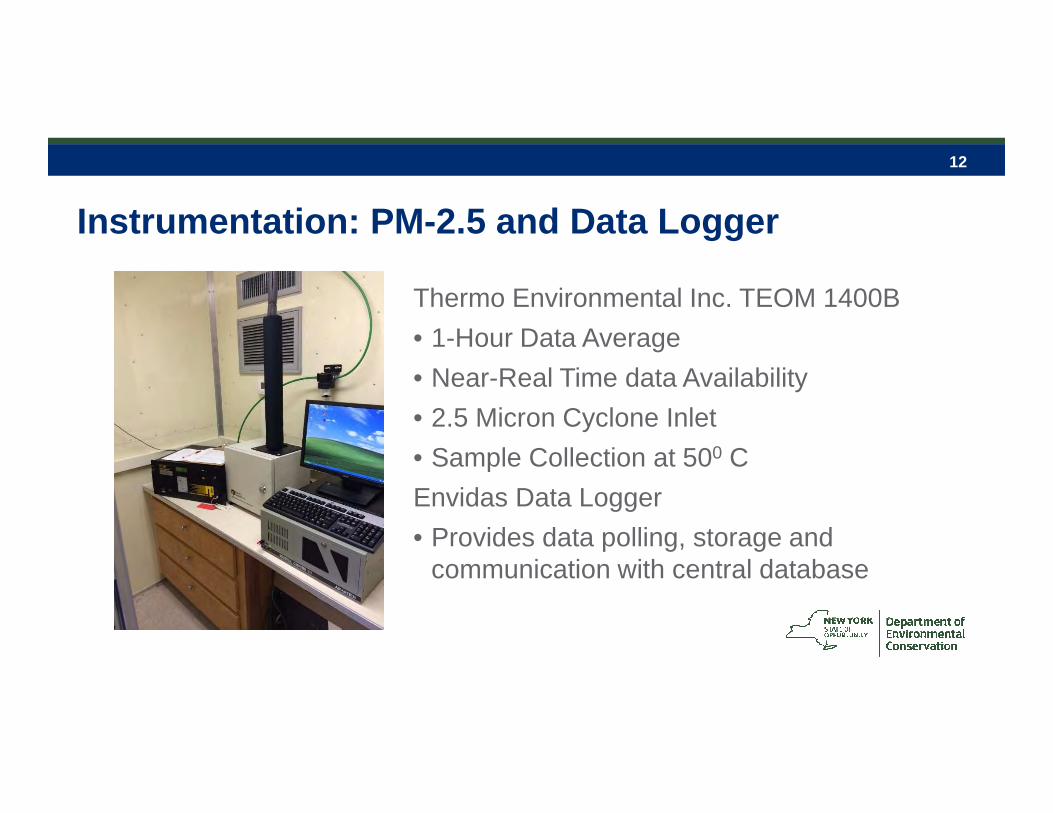
Instrumentation: PM-2.5 and Data Logger
Thermo Environmental Inc. TEOM 1400B
• 1-Hour Data Average
• Near-Real Time data Availability
• 2.5 Micron Cyclone Inlet
• Sample Collection at 500 C
Envidas Data Logger
• Provides data polling, storage and communication with central database

13
Instrumentation: Aethalometer for Black CarbonMagee Scientific Model AE22 and the newer Model AE33
• Measures light attenuation due to particle load on filter tape at 2 or 7 wavelengths
• Near-Real time data availability
• Data must be post processed
• BC absorbs light 1000x other species
• UV – BC = DC (330 & 880nm)
• DC has been associated with combustion of biomass (indicator for wood smoke)
14
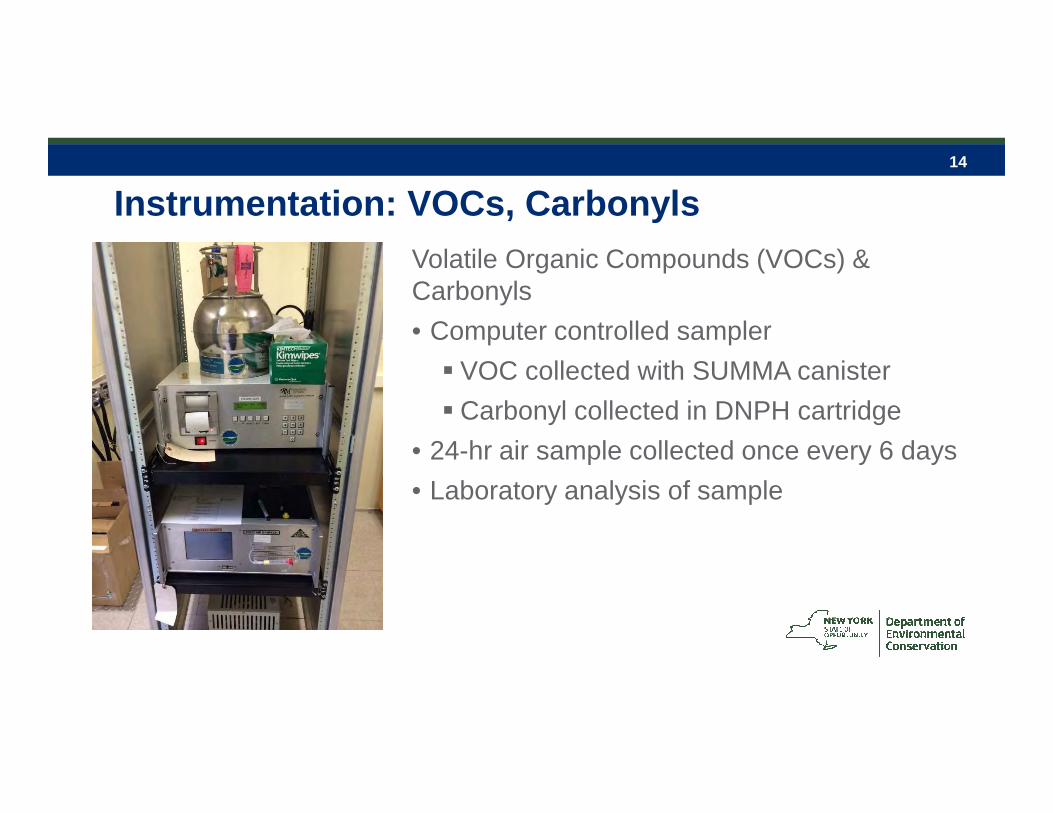
Instrumentation: VOCs, CarbonylsVolatile Organic Compounds (VOCs) & Carbonyls
• Computer controlled sampler
� VOC collected with SUMMA canister
� Carbonyl collected in DNPH cartridge
• 24-hr air sample collected once every 6 days
• Laboratory analysis of sample
15
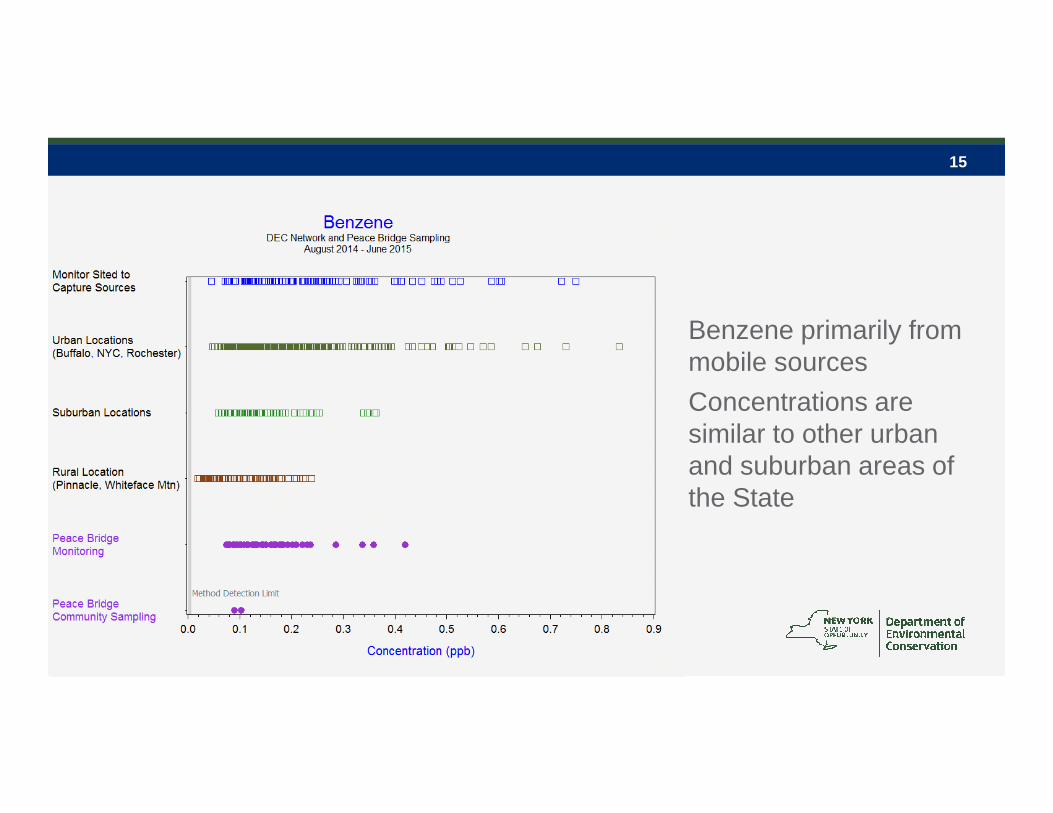
• Benzene primarily from mobile sources
• Concentrations are similar to other urban and suburban areas of the State
16
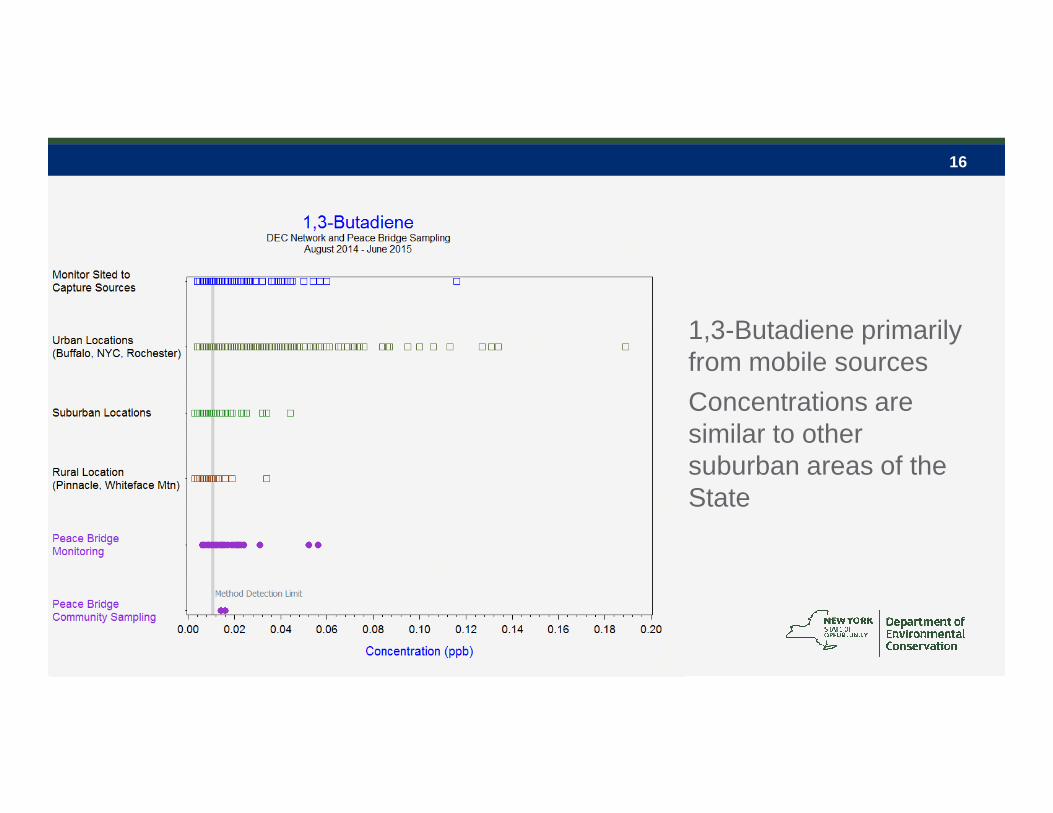
• 1,3-Butadiene primarily from mobile sources
• Concentrations are similar to other suburban areas of the State

17
• Concentrations are similar to other suburban areas of the State

18
• Concentrations are similar to other areas of the State
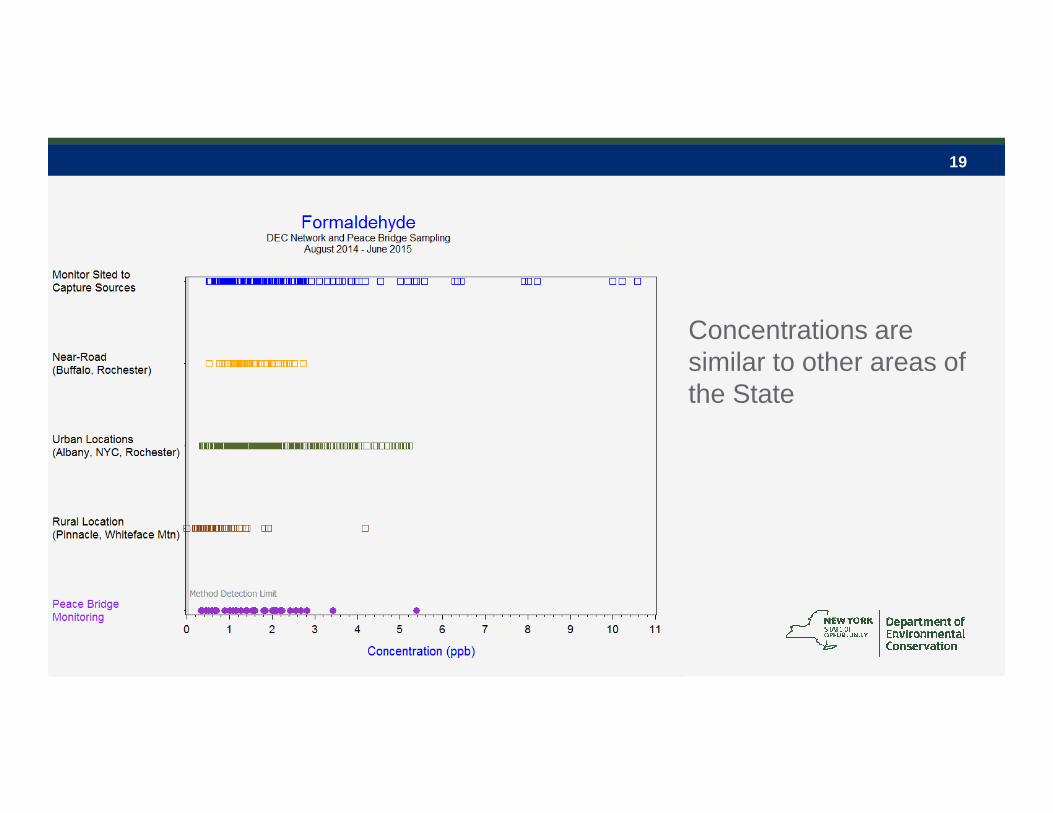
19
• Concentrations are similar to other areas of the State
20
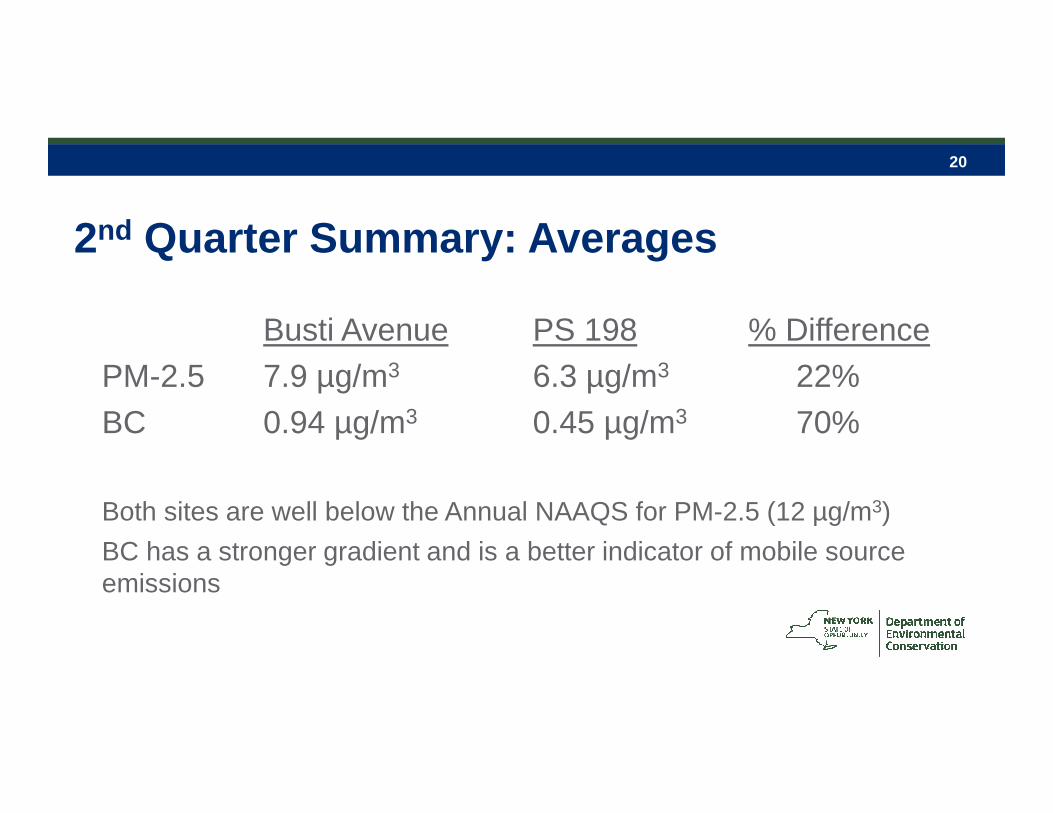
2nd Quarter Summary: Averages
Busti Avenue PS 198 % Difference
PM-2.5 7.9 µg/m3 6.3 µg/m3 22%
BC 0.94 µg/m3 0.45 µg/m3 70%
Both sites are well below the Annual NAAQS for PM-2.5 (12 µg/m3)
BC has a stronger gradient and is a better indicator of mobile source emissions
21
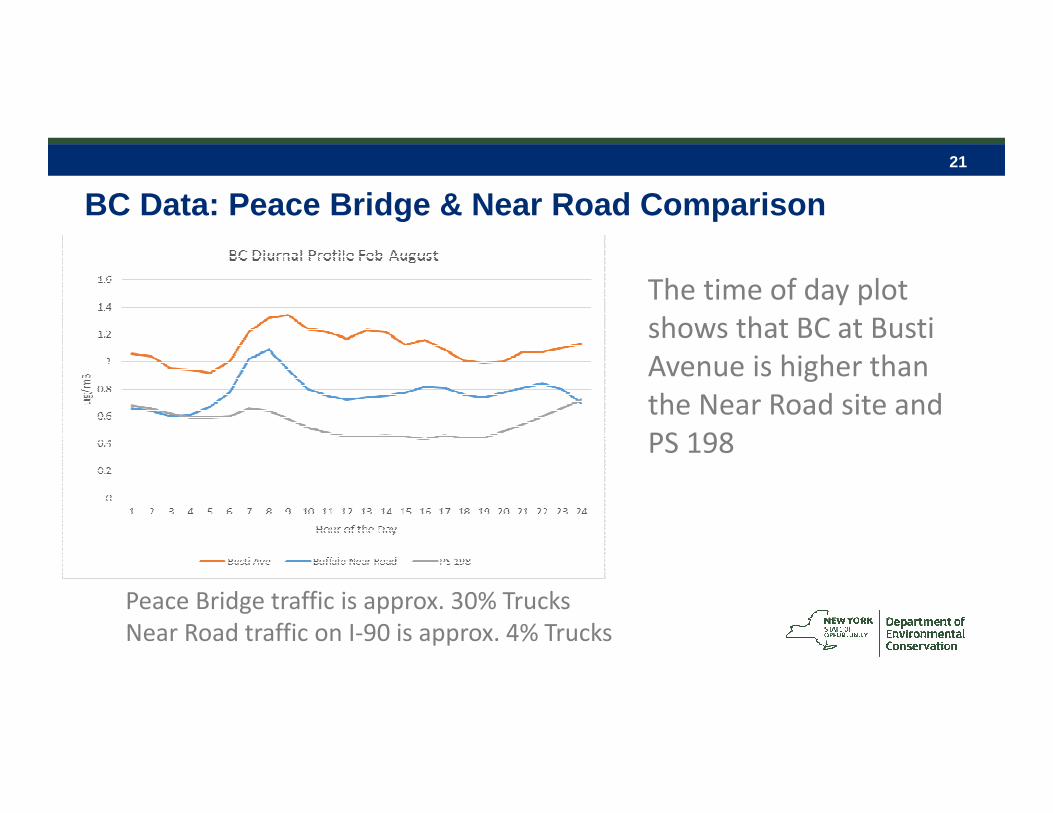
BC Data: Peace Bridge & Near Road Comparison
The time of day plot
shows that BC at Busti
Avenue is higher than
the Near Road site and
PS 198
Peace Bridge traffic is approx. 30% Trucks
Near Road traffic on I-90 is approx. 4% Trucks
22
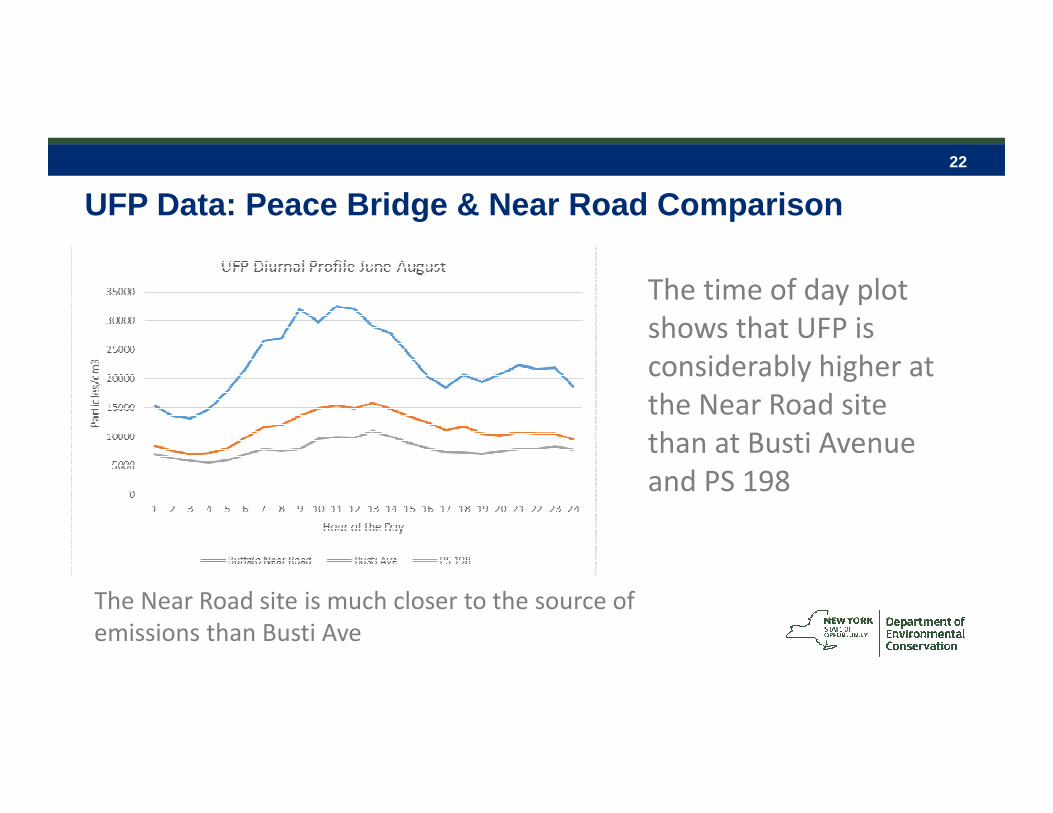
UFP Data: Peace Bridge & Near Road Comparison
The time of day plot
shows that UFP is
considerably higher at
the Near Road site
than at Busti Avenue
and PS 198
The Near Road site is much closer to the source of
emissions than Busti Ave
23
The Behavior of Mobile Source Emissions Tracers
Why is BC higher at Busti Avenue andUFP higher at the Near Road Site?
BC is emitted and it disperses in the environmentBC particles are relatively unreactive
UFP are emitted and disperse and quickly undergo transformations – UFP evaporate or agglomerate
UFP do not last long so concentrations are highest very close to the source of emissions

24
Busti Av. UFP: Seasonal Time SeriesData are presented with Winter in the Center of the plot
UFP are more stable in cold temps< Evaporation< Humidity< Particle Growthalso Low B Layer
25
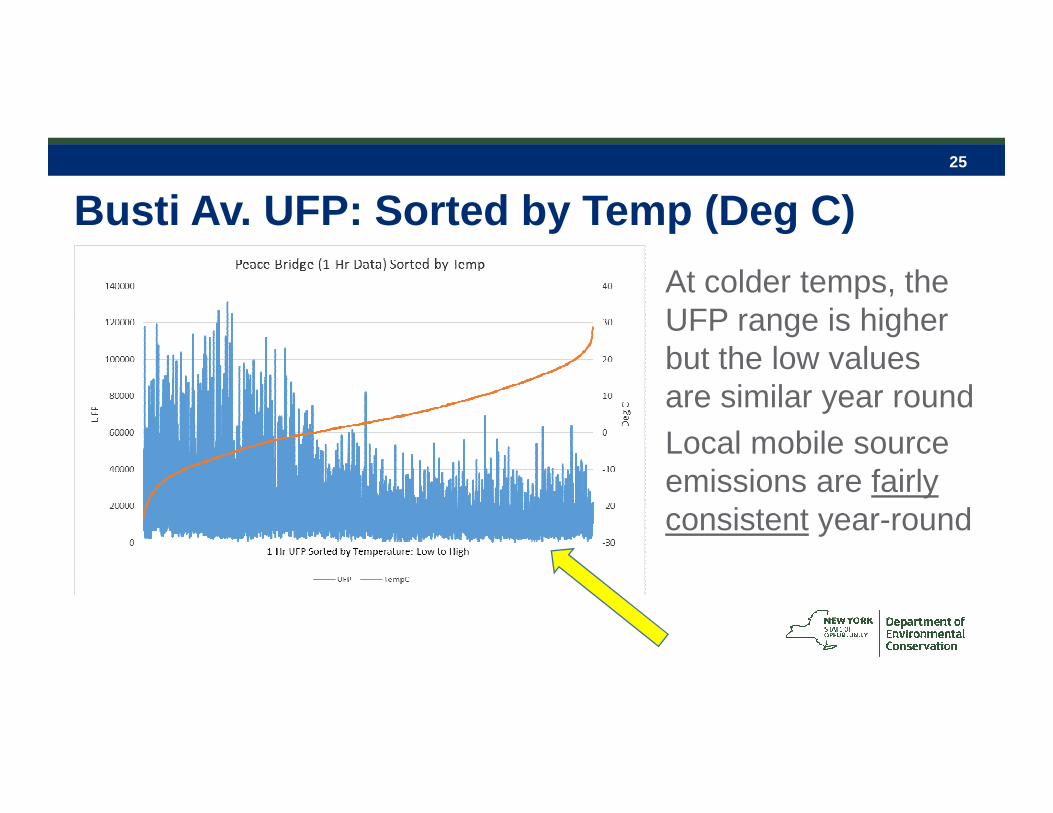
Busti Av. UFP: Sorted by Temp (Deg C)
At colder temps, the UFP range is higher but the low values are similar year round
Local mobile source emissions are fairly consistent year-round
26
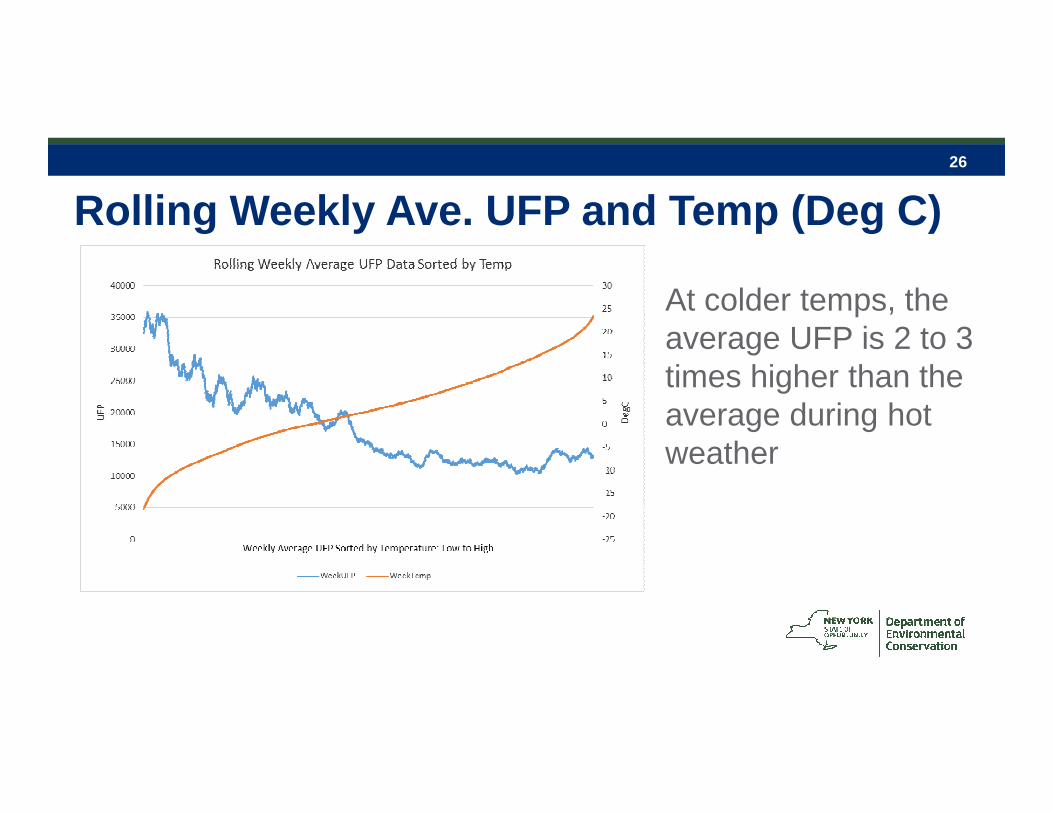
Rolling Weekly Ave. UFP and Temp (Deg C)
At colder temps, the average UFP is 2 to 3 times higher than the average during hot weather

27
Rolling Weekly Ave. UFP vs Temp (Deg C)Peace Bridge Study Busti Avenue
XY Plot
(UFP vs Temp ºC) shows the relationship between UFP and temp at this location

28
Rolling Weekly Ave. UFP vs Temp (Deg C)Boise, Idaho Near Road 2012 Data Winter in Center of time series plot
Boise Near Road AADT: 103,000 FE-AADT: 162,000

29
Rolling Weekly Ave. UFP vs Temp (Deg C)Queens, NYC 2013 - 2015 Data Winter in Center of time series plot
UFP rarely approaches zero at this site, note incr UFP at higher temps
30
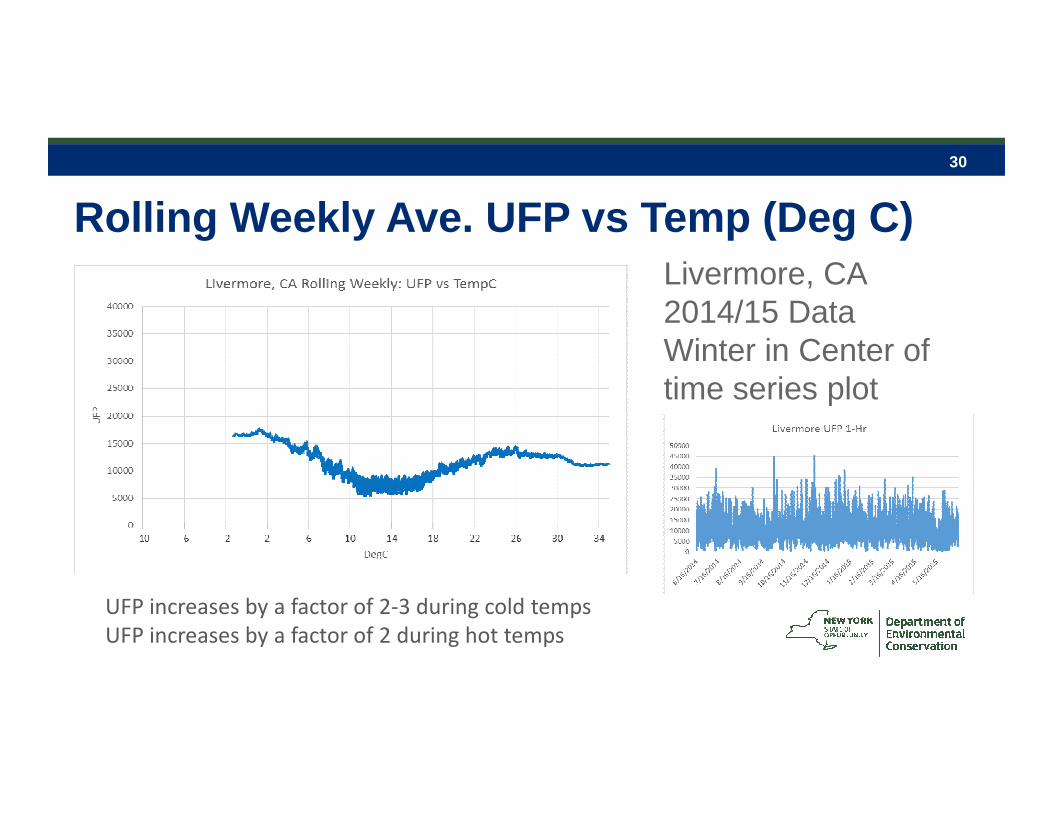
Rolling Weekly Ave. UFP vs Temp (Deg C)Livermore, CA 2014/15 Data Winter in Center of time series plot
UFP increases by a factor of 2-3 during cold temps
UFP increases by a factor of 2 during hot temps

31
Rolling Weekly Ave. UFP vs Temp (Deg C)Burbank, CA 2012/13 Data Winter in Center of time series plot
CA recently completed an Air Toxics study with UFP
monitors at 6 sites around Los Angeles
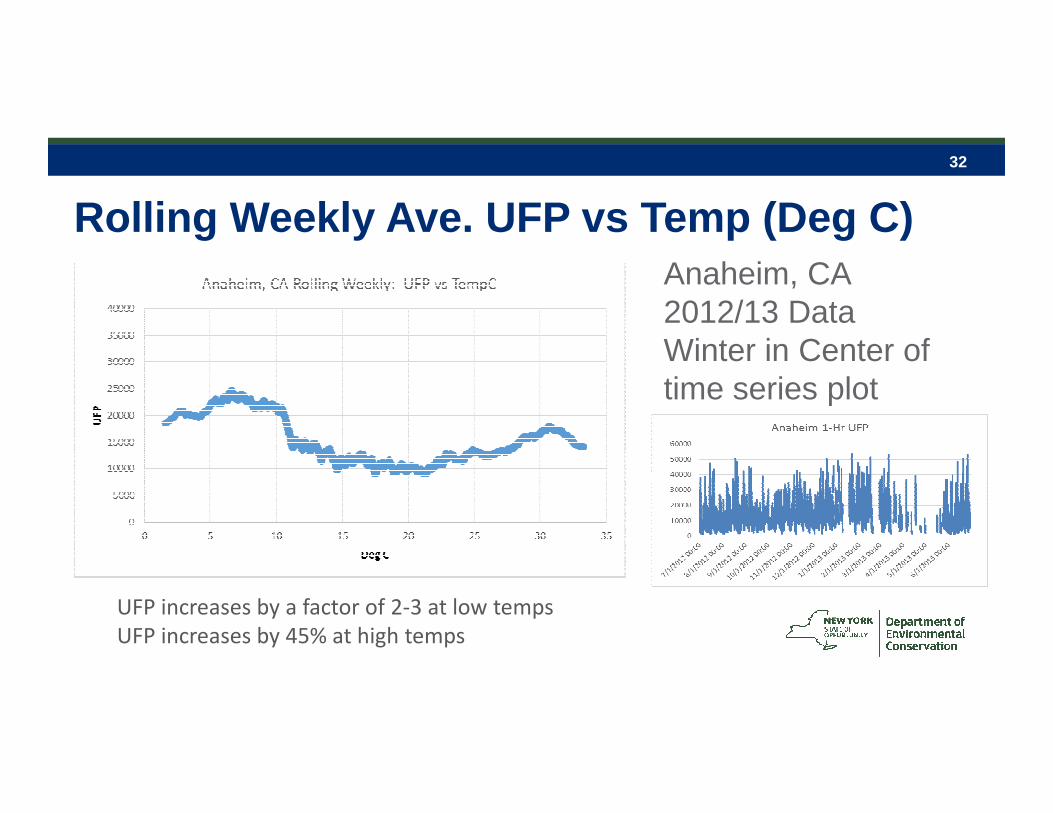
32
Rolling Weekly Ave. UFP vs Temp (Deg C)Anaheim, CA 2012/13 Data Winter in Center of time series plot
UFP increases by a factor of 2-3 at low temps
UFP increases by 45% at high temps
33
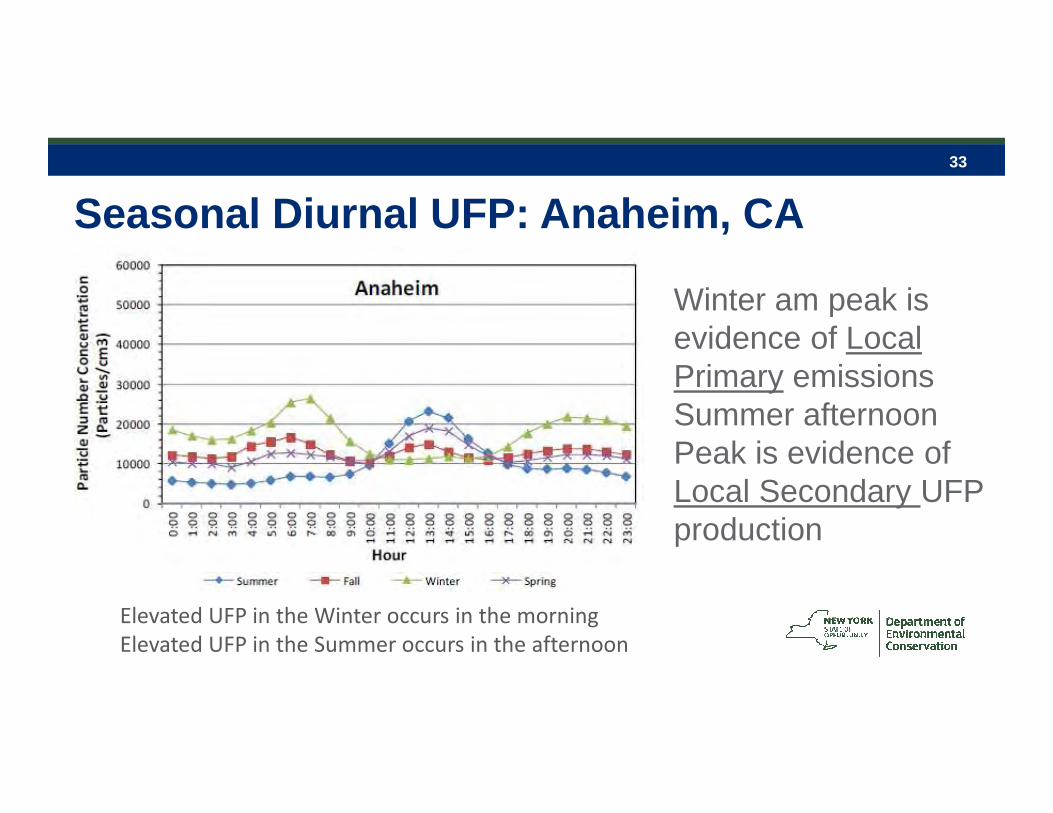
Seasonal Diurnal UFP: Anaheim, CA
Winter am peak is evidence of Local Primary emissionsSummer afternoon Peak is evidence of Local Secondary UFP production
Elevated UFP in the Winter occurs in the morning
Elevated UFP in the Summer occurs in the afternoon
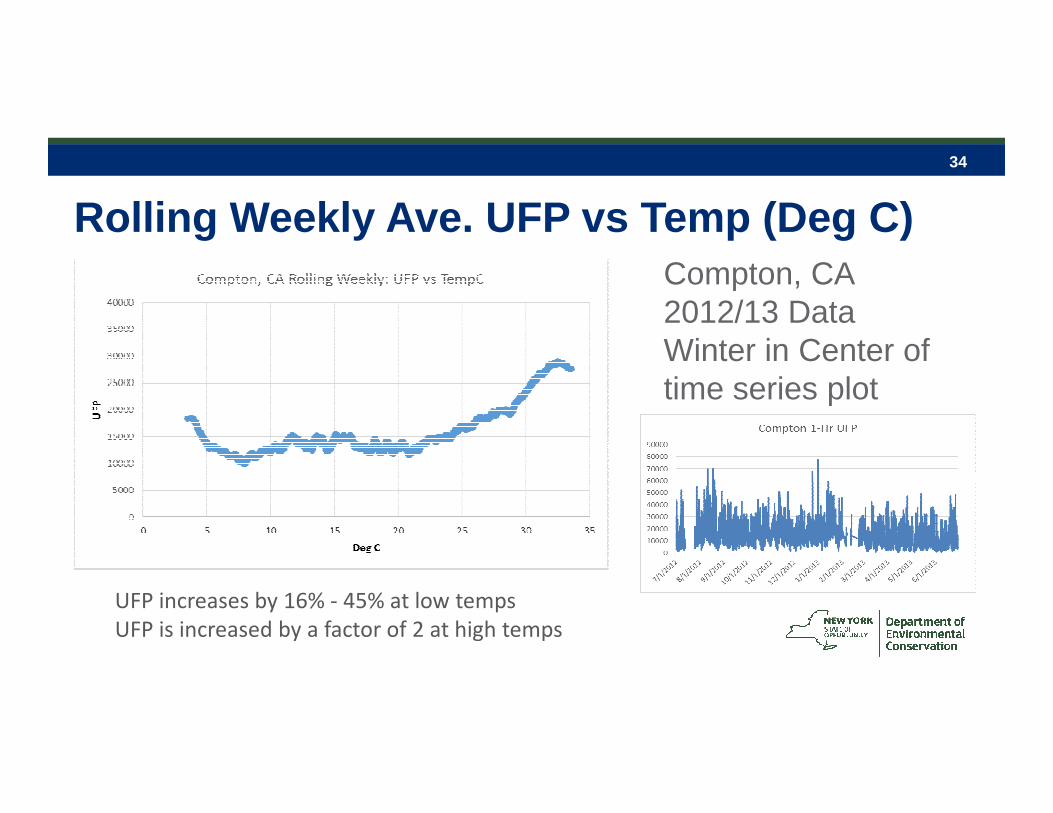
34
Rolling Weekly Ave. UFP vs Temp (Deg C)Compton, CA 2012/13 Data Winter in Center of time series plot
UFP increases by 16% - 45% at low temps
UFP is increased by a factor of 2 at high temps

35
Seasonal Diurnal UFP: Compton, CA
Summer afternoon Peak is evidence of Local Secondary UFP production
Elevated UFP in the Summer occurs in the afternoon

36
Rolling Weekly Ave. UFP vs Temp (Deg C)Long Beach, CA 2012/13 Data Winter in Center of time series plot
UFP increases by 20% - 40% at low temps
UFP is increased by a factor of 3 at high temps

37
Seasonal Diurnal UFP: Long Beach, CA
Summer afternoon peak dominates UFP at this location. This is evidence of LocalSecondary UFP production
Site is near a major Port with high proportion of HDD emissions

38
All Sites: Rolling Weekly Ave. UFP vs TempUFP from Busti Avenue, Queens, IdahoNR, San Francisco and four Los Angeles sites
UFP > low temps: all sites
UFP > high temps: at some very urban and Industrial sites

39
Rolling Weekly Ave. UFP vs Temp (Deg C)MD Near Road Site elevated UFP with less temperature dependence
UFP Axis is now 50K on XY Plot and 200K on Time Series Plot
MD is missing much of the Summer which may lower values slightly
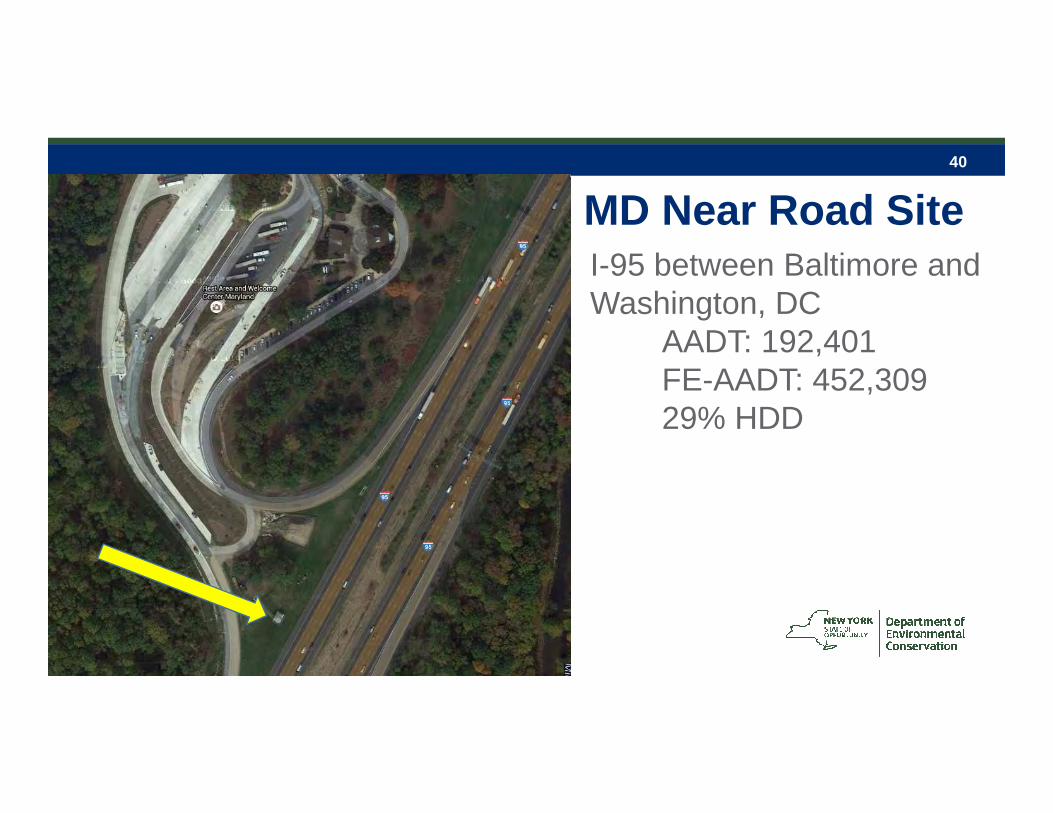
40
MD Near Road SiteI-95 between Baltimore and Washington, DC
AADT: 192,401FE-AADT: 452,30929% HDD
41
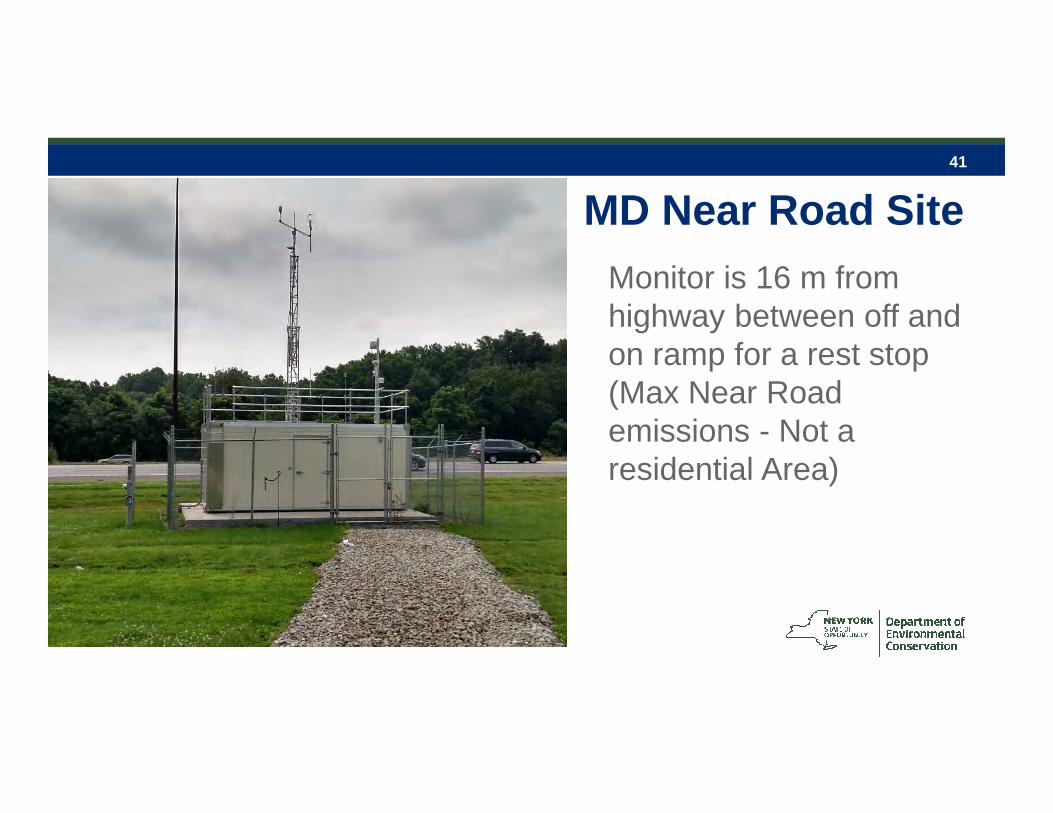
MD Near Road Site
Monitor is 16 m from highway between off and on ramp for a rest stop(Max Near Road emissions - Not a residential Area)

42
Why is MD UFP Data Different?
MD: The average UFP data are within the steep part of the roadway emissions gradient (16 m from source)
Buffalo, Boise, Livermore, Los Angeles: The average UFP are on the flatter part of the gradient - Suggests weaker or intermittent local source or monitor located further from the roadway
Zhu et al., JAMA 2002, Atm. Env., 2002
Wind Direction
43
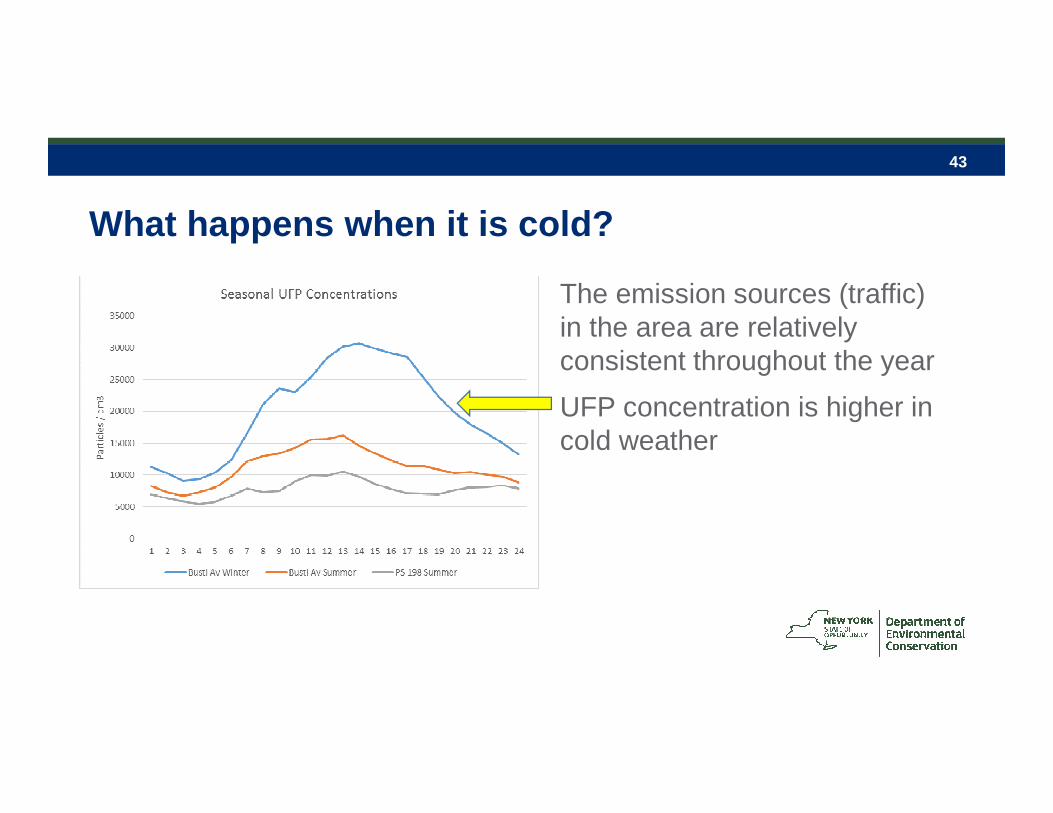
What happens when it is cold?
The emission sources (traffic) in the area are relatively consistent throughout the year
UFP concentration is higher in cold weather
44
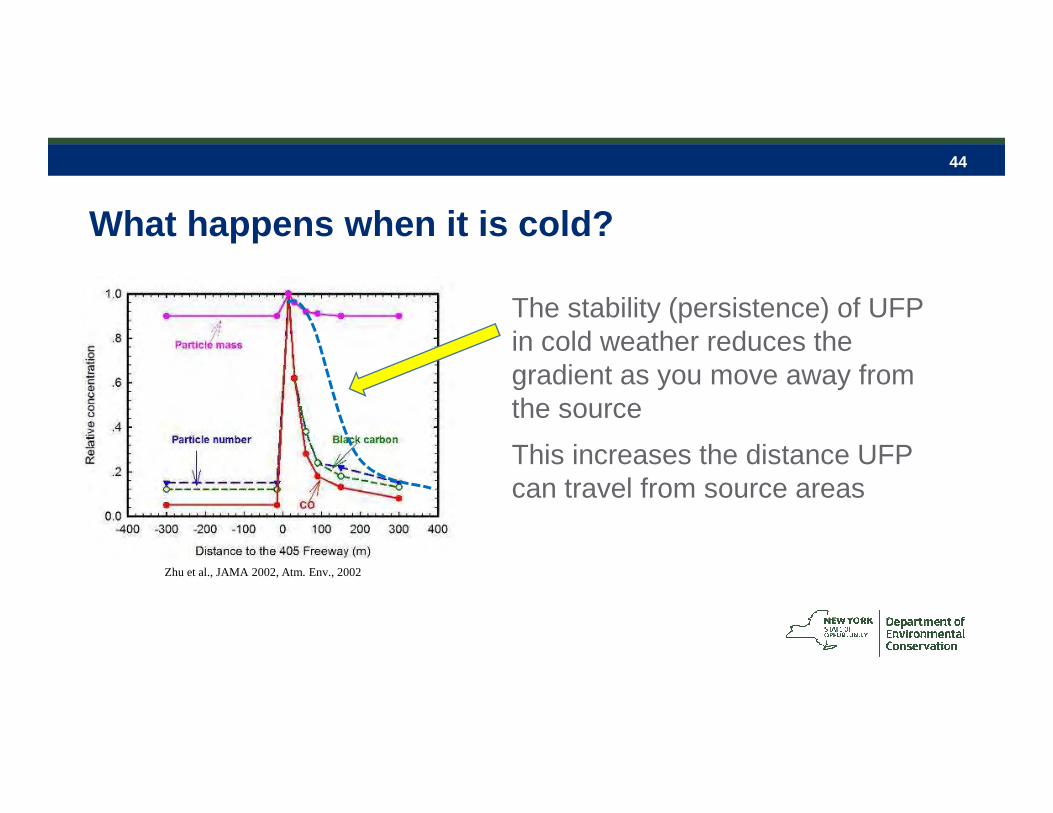
What happens when it is cold?
The stability (persistence) of UFP in cold weather reduces the gradient as you move away from the source
This increases the distance UFP can travel from source areas
Zhu et al., JAMA 2002, Atm. Env., 2002

45
Observations• UFP and BC are better indicators of mobile source
emissions than PM-2.5
UFP decrease more quickly than BC
• UFP are enhanced at lower temperatures and at high temperatures in areas with strong local sources
• This study is increasing our understanding of mobile source emissions as they disperse and transform
Gas ↔ Particle Winter ↔ Summer
46
Conclusions
• The Near Road site in Cheektowaga as expected has higher UFP and will successfully represent the worst case near road emissions for the Buffalo-Niagara region
• The study data will be available to the EPA and other researchers. Tentative EPA database Site IDs are:
Busti Avenue: 36-029-024
PS 198: 36-029-025
47
Thank You
• Dirk Felton,
• Randi Walker,
• Oliver Rattigan
• William Scheider
Connect with us:Facebook: www.facebook.com/NYSDECTwitter: twitter.com/NYSDECFlickr: www.flickr.com/photos/nysdec