‘peak car’ - university of the west of england, bristol present, very rapid developments •the...
TRANSCRIPT
Phil Goodwin Emeritus Professor of Transport Policy
‘Peak Car’ Where did the idea come from? And where is it going?

Definitions (after a fashion)
• Current official traffic forecasts
• The ‘Interrupted Growth’ hypothesis.
• The ‘Saturation’ hypothesis.
• The ‘Peak Car’ hypothesis.
Care needed about traffic, car traffic, car ownership, car use per person, mileage, trips… but it’s not disabling

At present, very rapid developments
• The idea of peak travel – but mostly peak car - has risen from a small minority interest to international research within 5 years, and mostly within the last 2 years – and changes by the week.
• There has been overview analysis for at least 25 countries, and detailed work in about ten.
• But in the UK, it all started over 40 years ago – and then disappeared for a generation...

The old tradition: in 1973 official forecasts expected saturation in car ownership by about 2010 – traffic forecast very accurate (for the wrong reasons?)
1973 DfT/TRL Car traffic forecast to 2010

An explanation? ‘Travel time budgets’? Zahavi and others 1970s – reinvented every decade
Schaeffer and Victor 2000: Strong elasticity of distance wrt income, but travel time is stable. So higher income drives to faster modes – total distance goes on increasing, but slow modes (inc. car) replaced by air.
(predicted maximum US car use by
2010, and absolute decline in OECD countries)
Metz: Destinations increase with speed², but then more distance has diminishing marginal utility. Total travel time is stable, income becomes redundant. So total distance (and car distance) saturates.
(we have reached peak now, but decline is due to economy)
Unresolved issues with statistical averages being treated as behavioural constants Not a behavioural explanation - but still an intriguing empirical observation
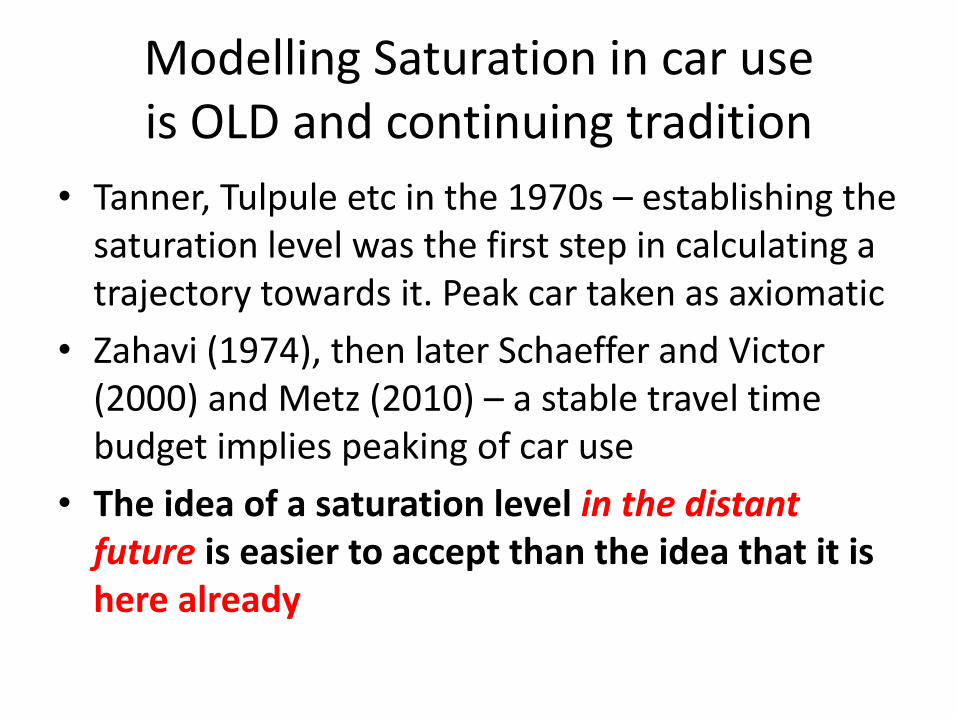
Modelling Saturation in car use is OLD and continuing tradition
• Tanner, Tulpule etc in the 1970s – establishing the saturation level was the first step in calculating a trajectory towards it. Peak car taken as axiomatic
• Zahavi (1974), then later Schaeffer and Victor (2000) and Metz (2010) – a stable travel time budget implies peaking of car use
• The idea of a saturation level in the distant future is easier to accept than the idea that it is here already
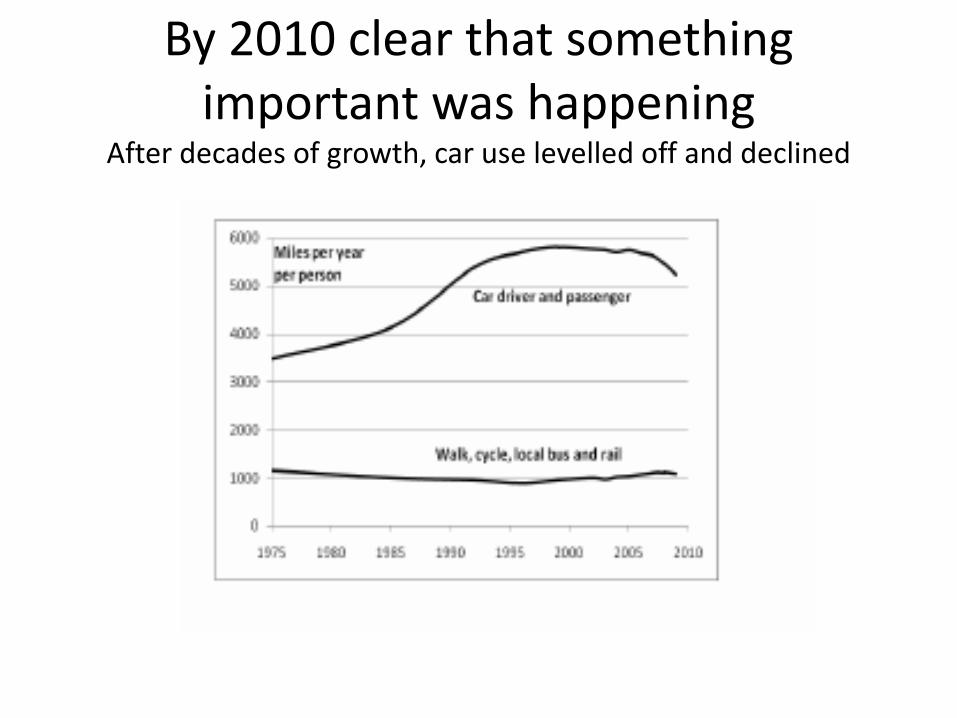
By 2010 clear that something important was happening
After decades of growth, car use levelled off and declined

A progressive, systematic and continuing tendency for long term trends in car use to be over-forecast.
(not attributed to peaking or saturation, but to faulty external input data)
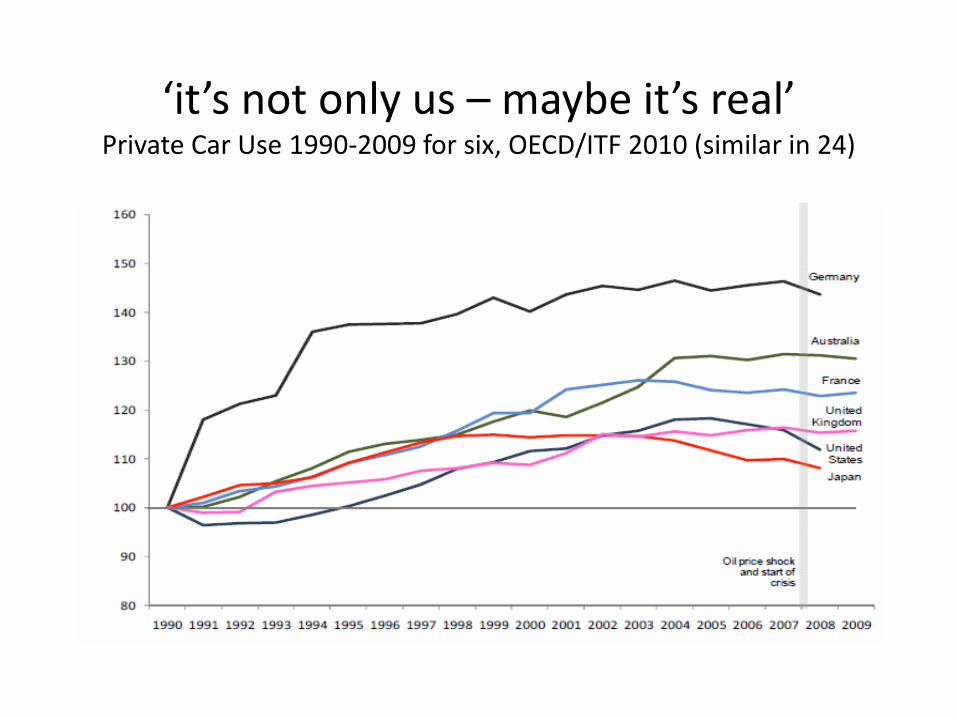
‘it’s not only us – maybe it’s real’ Private Car Use 1990-2009 for six, OECD/ITF 2010 (similar in 24)

The search for evidence on structural change in demand
A remarkable convergence on four key research themes in many different countries
• Decoupling or reversal of income effect
• Age/Cohort effects
• Urban policy impacts moderated by density and life cycle transitions
• Mobile internet, e-activities and cultural shifts about the ‘love affair’

Revival of interest - discovery by 2007 of change in relationship between mobility and income around 1992-4, little noticed

25-4-12 12
David Metz: ‘Decoupling of distance travelled from income’ (since 1990?)
0
0.5
1
1.5
2
2.5
1970 1975 1980 1985 1990 1995 2000 2005 2010 2015
Income
Car use

Stokes: biggest falls in car use by highest income men
• Higher income men are driving less • ... And lower incomes, driving more
0
1000
2000
3000
4000
5000
6000
7000
8000
9000
10000
1995 1996 1997 1998 1999 2000 2001 2002 2003 2004 2005 2006 2007 2008 2009 2010
Income Quintile - Males
Lowest 2 3 4 Highest
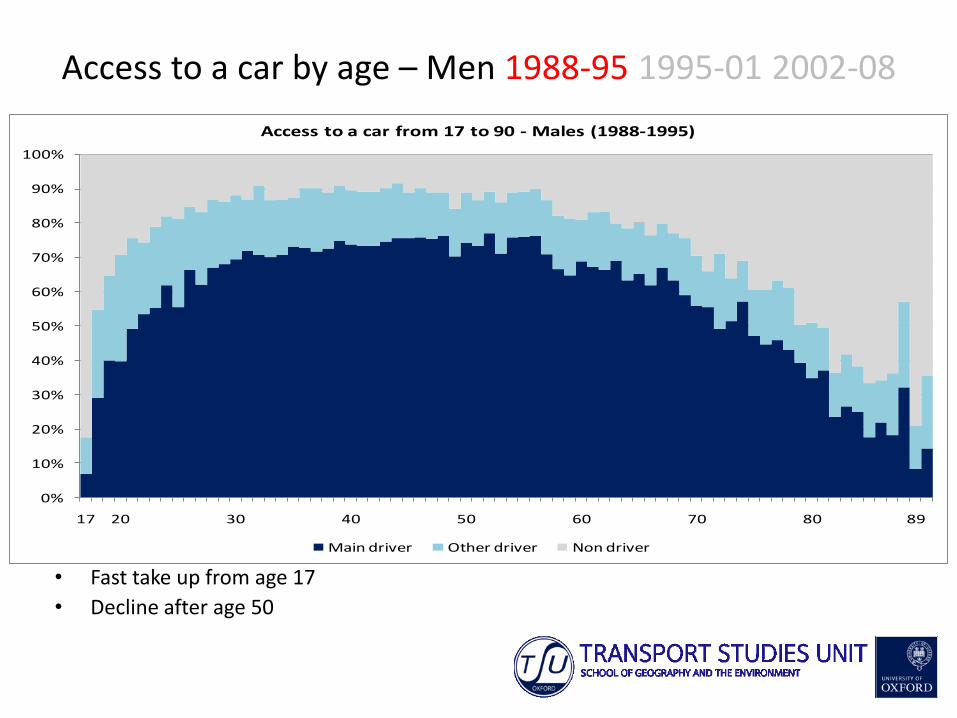
Access to a car by age – Men 1988-95 1995-01 2002-08
• Fast take up from age 17
• Decline after age 50
0%
10%
20%
30%
40%
50%
60%
70%
80%
90%
100%
17 20 30 40 50 60 70 80 89
Access to a car from 17 to 90 - Males (1988-1995)
Main driver Other driver Non driver

Access to a car by age – Men 1988-95 1995-01 2002-08
• Slightly slower rise • ‘peak’ remains to late 50s
0%
10%
20%
30%
40%
50%
60%
70%
80%
90%
100%
17 20 30 40 50 60 70 80 90
Access to a car from 17 to 90 - Males (1995-2001)
Main driver Other Driver Non driver
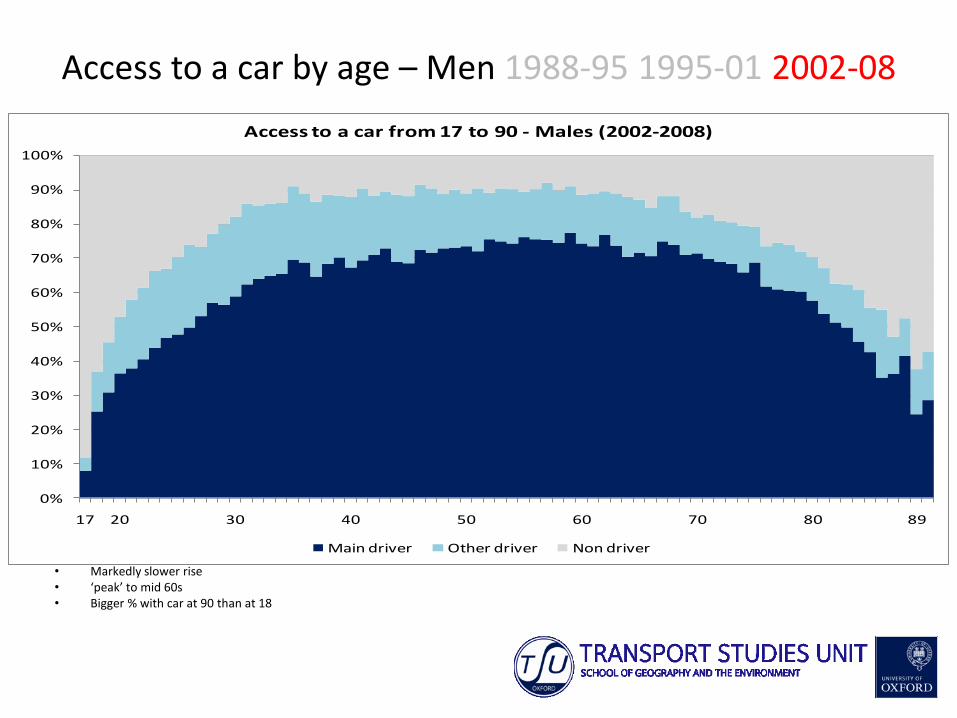
Access to a car by age – Men 1988-95 1995-01 2002-08
• Markedly slower rise • ‘peak’ to mid 60s • Bigger % with car at 90 than at 18
0%
10%
20%
30%
40%
50%
60%
70%
80%
90%
100%
17 20 30 40 50 60 70 80 89
Access to a car from 17 to 90 - Males (2002-2008)
Main driver Other driver Non driver

Access to a car by age – Women 1988-95 1995-01 2002-08
• Much lower than for men
• Tail off from about 45
0%
10%
20%
30%
40%
50%
60%
70%
80%
90%
100%
17 20 30 40 50 60 70 80 89
Access to a car from 17 to 90 - Females (1988-1995)
Main driver Other driver Non driver

• Similar profile bit to higher peak level
0%
10%
20%
30%
40%
50%
60%
70%
80%
90%
100%
17 20 30 40 50 60 70 80 90
Access to a car from 17 to 90 - Females (1995-2001)
Main driver Other Driver Non driver
Access to a car by age – Women 1988-95 1995-01 2002-08

• Peak close to that for males
• Lengthening of peak level
0%
10%
20%
30%
40%
50%
60%
70%
80%
90%
100%
17 20 30 40 50 60 70 80 89
Access to a car from 17 to 90 - Females (2002-2008)
Main driver Other driver Non driver
Access to a car by age – Women 1988-95 1995-01 2002-08
Urban Policy/Density/Transitions
Rich, economically successful cities with high incomes and growing population – greatest reduction in car use (London – similar trends to cities like Munich, Paris – and smaller cities like Freiburg, Strasbourg…)
• Also reductions in medium size towns especially English ‘sustainable
travel towns’ 2004-8 , • and lower car use in high density new urban developments. Behaviour change builds up over time triggered by life events – same
profile as time-dependent lagged elasticities So not only because of economic pressure – Policy effects?

Non Transport Trends
• Rise of mobile computing
• Cultural and attitudinal changes
• Health, environment as motivations
• Demographic changes – aging population, more single person households, later birth age, young and also ‘empty nesters’ going back to city, richer urban ‘tourists’ taking over villages...
• Changes in images of contemporary life

On-line shopping
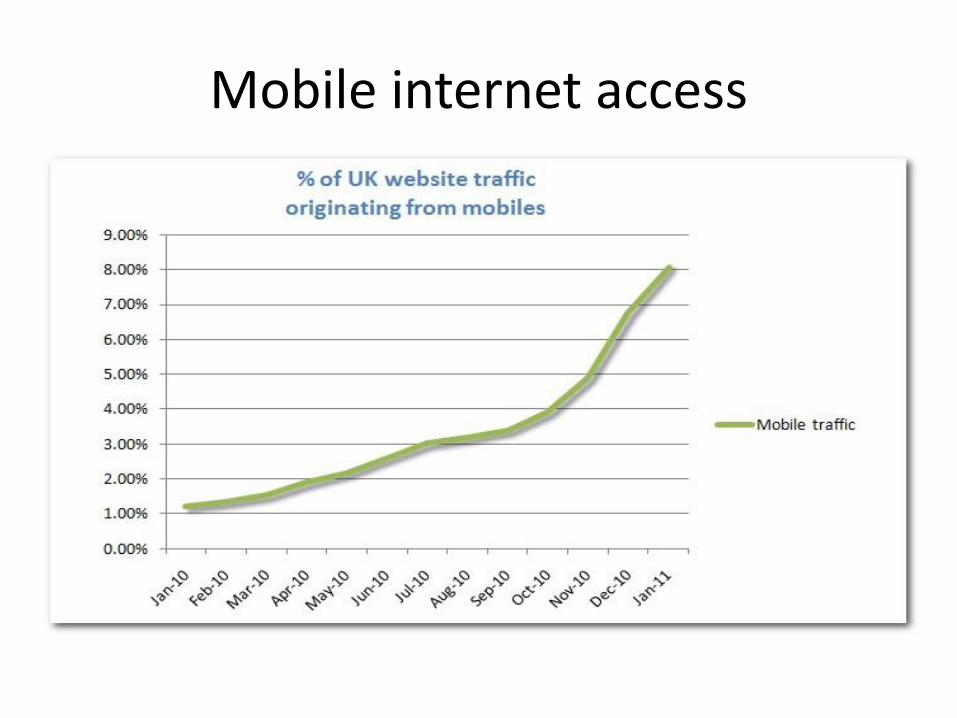
Mobile internet access

A shift in the ‘salient imagery’
“Love affair with the car: I love my car because….”

The search for another love


Very recent…
• OECD/ITF research round table in Paris – especially notable USA, BMW, and French research, inputs from a dozen others
• The simultaneous publication of a research report by Scott LeVine and Peter Jones, a different nuanced statement by the report’s 4 sponsors, and a substantially different press release by the RAC Foundation

Le Vine and Jones (December 2012)
THE REPORT
• Analysis confined to pre-recession
• Most trends observed by other researchers confirmed
• Important new analysis of company car use decline
• The future is complex and unresolved
THE RAC PRESS RELEASE
‘over-whelmingly we remain a country of car drivers…there has been much talk of ‘peak car’ – the idea that individual car use has reached a plateau – but strip out the one-off impact of a collapse in company car mileage and prior to the recession we were actually driving more’
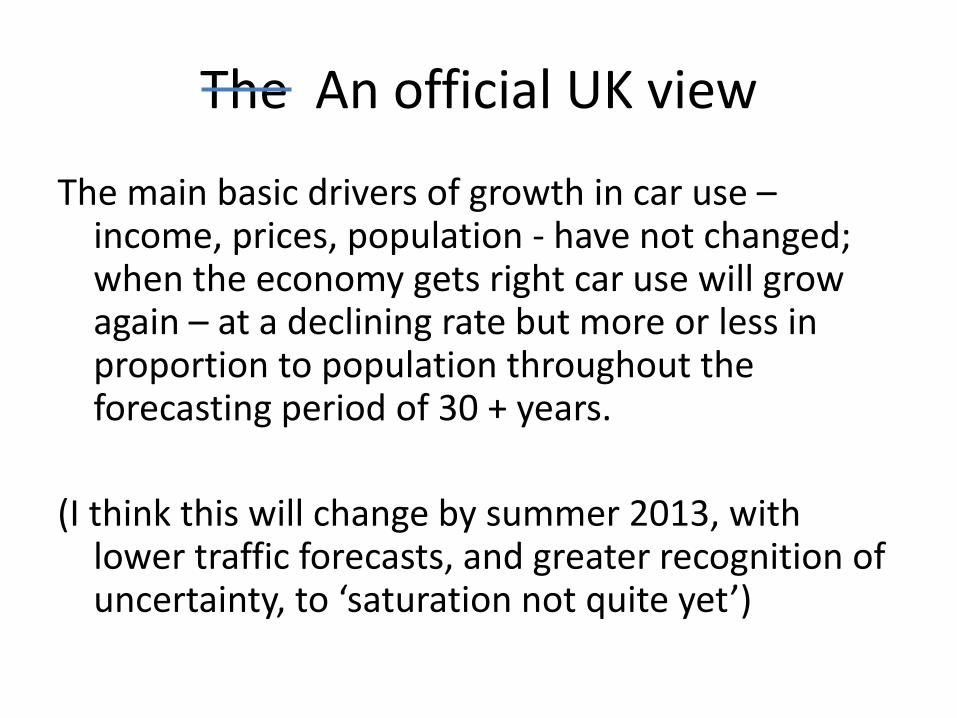
The An official UK view
The main basic drivers of growth in car use – income, prices, population - have not changed; when the economy gets right car use will grow again – at a declining rate but more or less in proportion to population throughout the forecasting period of 30 + years.
(I think this will change by summer 2013, with lower traffic forecasts, and greater recognition of uncertainty, to ‘saturation not quite yet’)
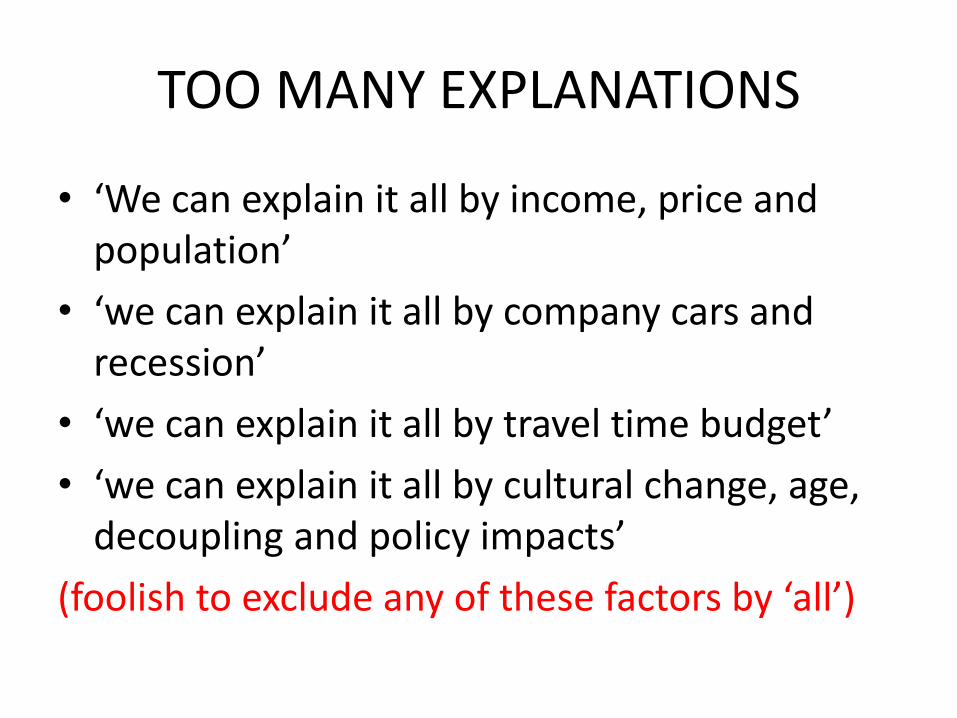
TOO MANY EXPLANATIONS
• ‘We can explain it all by income, price and population’
• ‘we can explain it all by company cars and recession’
• ‘we can explain it all by travel time budget’
• ‘we can explain it all by cultural change, age, decoupling and policy impacts’
(foolish to exclude any of these factors by ‘all’)

Conclusion
The research issues are not resolved – and will not be in the next year or two.
Therefore there remains uncertainty – but this is not a question of an error band around forecasts, it is a question of contested views of the future
We should focus more on what sort of future we choose – and there is a rather wider choice than we have thought.

Policy implications
• The effects of policy on trends
• Road construction and finance
• Tax revenue and the environment
• Robustness to alternative futures
• Demand management

1. Policy does have an effect
• Some evidence that the cumulative effects of policies to discourage car use and encourage walk/cycle/public transport have bigger impacts on car use, over several years, than conventional (non-dynamic) elasticities.
• The empirical evidence base is now very strong but not well enough known: better public transport, traffic restraint, parking, charging, pedestrianisation, cycling, ‘smarter choices’, low-car redevelopment in brown-field sites...
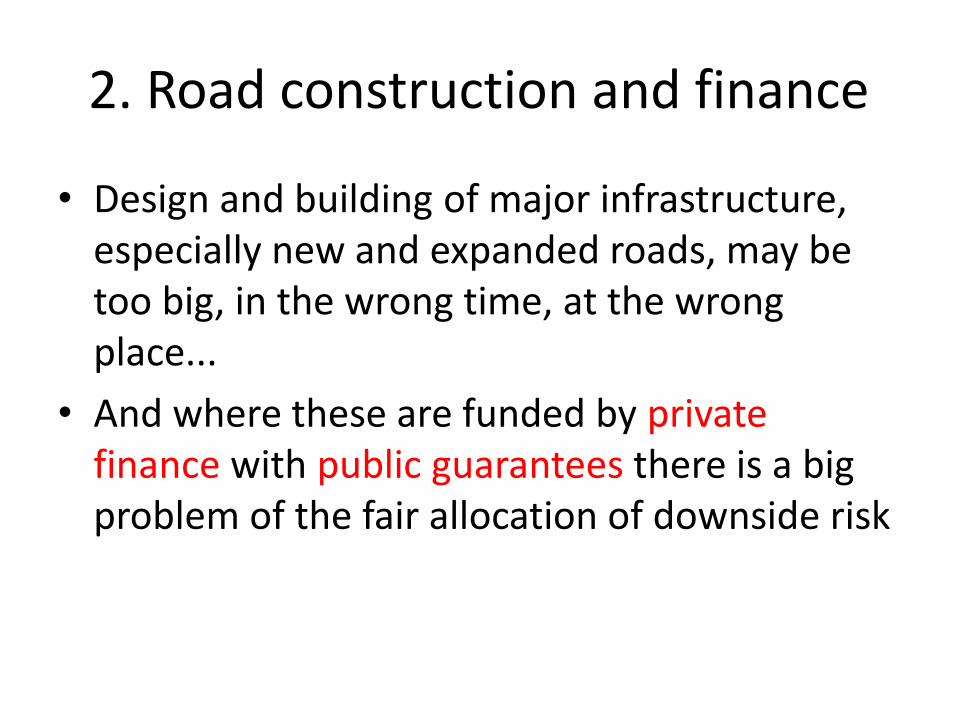
2. Road construction and finance
• Design and building of major infrastructure, especially new and expanded roads, may be too big, in the wrong time, at the wrong place...
• And where these are funded by private finance with public guarantees there is a big problem of the fair allocation of downside risk
3. Tax revenue and environment
• There is a major problem of the long term buoyancy of tax revenue from the transport sector. System-wide road pricing as a medium term measure but even that will not solve the long term.
• BUT there is a major advantage in terms of environmental damage, quality of life, health etc, as initiatives which ‘go with the grain’ of trends have less resitance and more effect
4. Robustness to alternative futures
• ‘Peak car’ is possible but not certain; the propositions are contested not consensus; and the arguments are not yet resolved.
• Therefore problem of project and policy appraisal – what initiatives are robust to different futures? (For example, expansion of public transport is necessary, but for different reasons, both if car use trend is increasing or reducing)
Demand management
• Consider demand management (by pricing or ‘soft’ measures): if car use growth continues, this policy is vital, for environment and economic efficiency.
• But if car use stabilises or reduces, the balance may shift: it will still be important to deliver mobility and access to activities and products. So we will still need demand policies but a different focus