peak flow rate records in the diagnosis of occupational ... · peakflowraterecordsin...
TRANSCRIPT
Thorax, 1979, 34, 308-316
Peak flow rate records in the diagnosis ofoccupational asthma due to colophonyP SHERWOOD BURGE, I M O'BRIEN, AND M G HtARRIES
From the Department of Clinical Immunology, Cardiothoracic Institute, Brompton Hospital,London SW3 6HP, UK
ABSTRACT Peak expiratory flow rate (PEFR) has been measured hourly from waking to sleepingin 29 workers with respiratory symptoms exposed to the fumes of soft soldering fluxes containingcolophony (pine resin). Thirty-nine records of mean length 33 days have been analysed, and theresults compared with the occupational history and bronchial provocation testing in the sameworkers. From plots of daily mean, maximum, and minimum PEFR, recurring physiologicalpatterns of asthma emerge. The most common pattern is for asthma to increase with eachsuccessive working day. Some workers have an equivalent deterioration each working day.
Regular recovery patterns taking one, two, and three days are described. The combination ofa three-day recovery pattern and a late asthmatic reaction on Monday results in Mondaybeing the best day of each week. Assessment of these records has shown them to be specific andsensitive, provided the worker was not taking corticosteroids or sodium cromoglycate during theperiod of the record and that bronchodilator usage was kept constant on days at home and at
work. The results of the PEFR records correlate well with bronchial provocation testing, andprovide a suitable alternative to this for the diagnosis of mild to moderate occupational asthma.The records are of particular use for screening symptomatic workers whose symptoms appear
unlikely to be related to work.
An occupational cause for wheeze and breathless-ness is often missed. Reasons for this include thelack of readily applicable diagnostic tests and alack of understanding of the basic patterns ofoccupational asthma, as seen at work rather thanin the laboratory. The Monday morning symptomsof stage I byssinosis provide the only clearlydescribed pattern of occupational airways disease.It is so characteristic that the diagnosis can bebased on the history alone (Schilling, 1956).Symptoms most severe on the first day of theworking week are seen in a wide range of diseaseswhere fever is prominent, and wheeze is oftenpresent. These include metal fume fever (Green-how, 1862), humidifier fever (Pickering et al,1976), meat wrapper's asthma (Sokol, 1973),feather picker's asthma (Plessner, 1960), andgrain fever (Williams et al, 1964; Kleinfeld et al,1968).Measurement of lung function before and after
a working shift has formed the basis of objectivetests for occupational asthma in the work situa-
tion. This has often been disappointing. Schoen-berg and Mitchell (1975) measured FEV, andMEF50 in workers with lower respiratory symp-toms exposed to formaldehyde fumes. The meanfall in FEV1 was [1I% over a Monday shift witha slight increase on a Friday shift. MEF50 fell4-3% on the Monday and rose on the Friday.Gandevia (1963) found a mean decrease in FEV1of 0-18 1 in 15 workers exposed to isocyanatefumes over three working days. Fawcett et al(1978) showed a mean fall in FEV1 of 4% in agroup of byssinotics in a coarse cotton mill. Thesestudies illustrate the difficulty in confirming anoccupational history this way. Burge et al (1979b)were able to show a fall in FEV1 of 10% or moreover at least one of three work shifts in a third ofa group of workers in an electronics factory, allof whom had symptoms highly suggestive ofoccupational asthma. Most workers with colo-phony sensitivity have immediate asthmaticreactions on bronchial provocation testing (Burgeet al, 1978), which may explain these better
308
on 8 Novem
ber 2018 by guest. Protected by copyright.
http://thorax.bmj.com
/T
horax: first published as 10.1136/thx.34.3.308 on 1 June 1979. Dow
nloaded from
Peak flow rate records in the diagnosis of occupational asthma due to colophony
results. Objective evidence, however, was still notobtained in two-thirds of the symptomaticworkers.
Occupational-type provocation testing has beenextremely useful in recording new causes ofoccupational asthma (Pepys and Hutchcroft,1975; Burge and Pepys, 1979). It is time-consuming and necessitates hospital admission foran average of two weeks. A negative provocationtest may result from a failure to expose an indi-vidual to the material causing his symptoms orfailure to produce the same conditions as at work.False-positive reactions can occur if irritant con-centrations of fumes and dust are reached.
This study represents an attempt to do fourthings: to provide objective evidence in theelectronics industry for occupational respiratorysymptoms suggestive of asthma; to investigate thepatterns of asthmatic reactions seen at work andat home; to evaluate the use of the records ofPEFR for diagnosis; and to compare the resultsobtained with those from the history andbronchial provocation testing.Each worker has been studied using an occu-
pational history, bronchial provocation testing,and a record of peak expiratory flow rate at homeand work for at least two weeks.
Previous work has shown that the main sensitis-ing agent in the electronics industry using flux-cored solder is colophony, an extract of pineresin (Burge et al, 1978). Some workers in theelectronics industry have also been sensitised totoluene di-isocyanate fumes liberated whenpolyurethane-coated wires are soldered or tinned(Paisley, 1969; Pepys et al, 1972).
Methods
We studied workers who had had bronchialprovocation testing by exposure to solder-fluxfumes in hospital and had kept a record of theirPEFR at home and at work for at least twoweeks. Workers were studied from five separateelectronics factories. All manufactured radios ortelevision; one factory was not using mass produc-tion techniques. Atmospheric monitoring ofcolophony levels in two of the factories hadshown levels of exposure below the threshold limitvalue on personal monitors. Workers with themost severe symptoms had already left workbefore they were investigated and were thereforeexcluded.Each worker was given either a Wright's peak
flow meter (Wright and McKerrow, 1959), a
Wright's peak flow gauge (Gregg, 1964), or
occasionally a Vitalograph pulmonary monitor
(Haydu et al, 1976). They were shown how to usethe meter and read the result. They were askedto perform at least three blows on each occasionand to record the best result. The best two resultshad to be within 20 1/min of each other (or onedivision on a pulmonary monitor). They wereasked to record their PEFR every hour fromwaking to sleeping.
Bronchial provocation testing was carried outin hospital with a single exposure on each day(Burge et al, 1978). The provocation test wascalled negative if there was a fall in FEV1 of lessthan 15% compared with control after exposureto solder-flux fumes for one hour on twosuccessive days.
ANALYSIS OF RESULTS OF THE PEAK EXPIRATORYFLOW RATE RECORDSThe basis of the interpretation was the comparisonof recordings taken when away from work withthose taken at work. Since a reaction resultingfrom work often continues or starts after work,all readings taken within 24 hours of starting workwere classed as "at work" and compared withreadings taken on days with no work exposure atall. For each day the mean, maximum, and mini-mum PEFR was plotted, this being the easiestway to visualise the significance of recordings.The distribution of the daily values about thedaily mean was usually skewed with a greaternumber of lower readings than would be expectedin a normal distribution. Some records wereplotted using the daily median rather than themean. The visual effects were similar, the medianbeing usually about 10 1/min above the mean.Because of their visual similarity mean valueshave been used as they are simpler to calculate.
Thirty-nine records were obtained from 29workers. The mean length of the records was32-6 days (14-78).
Results
The physiological pattern seen in the PEFRrecords have been classed as those occurring fromhour to hour within a day (the hourly pattern),those occurring from day to day in the sameworking week (the daily pattern), and thoseoccurring from week to week (the weeklypattern).The hourly patterns showed the immediate and
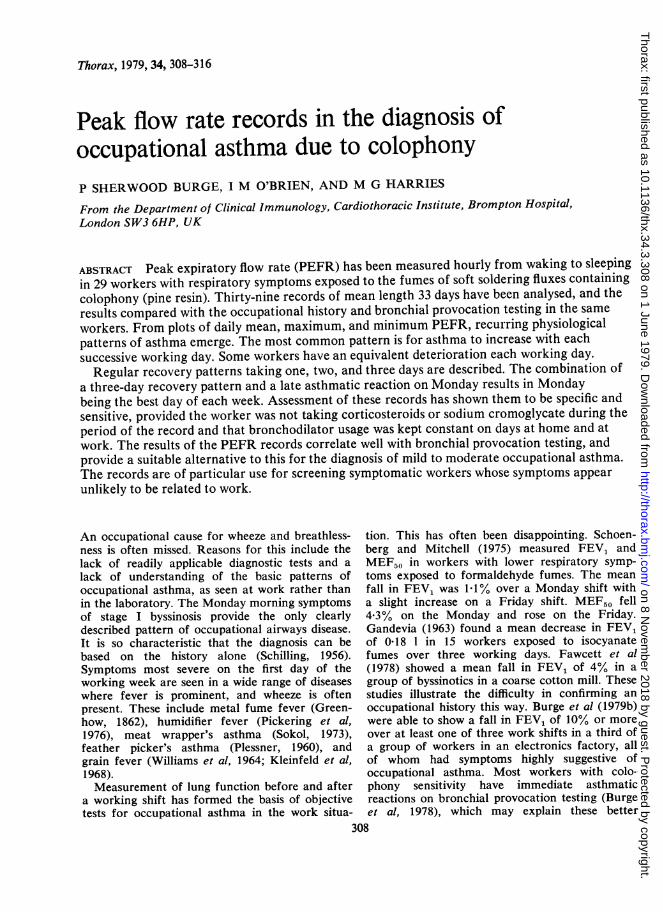
late asthmatic reactions seen on bronchial pro-vocation testing. An example of an immediatereaction is shown in fig 1. The drop in PEFRstarted within 15 minutes of coming to work onMonday morning. The PEFR continued to fall
309
on 8 Novem
ber 2018 by guest. Protected by copyright.
http://thorax.bmj.com
/T
horax: first published as 10.1136/thx.34.3.308 on 1 June 1979. Dow
nloaded from
P Sherwood Burge, I M O'Brien, and M G Harries
7 8 9 10 11 12 1 2 3 4 5 6 7 8 9am pm
Fig 1 Plot of hourly PEFR of a wiring and solderingline supervisor. Period at work on Monday andFriday is shaded. Sunday record is taken at home.It shows a drop in peak flow within 15 minutes ofcoming to work on Monday, which continues to falluntil leaving work. By Friday a morning dip hasoccurred, masking initial fall in PEFR. This recordshows equivalent deterioration each working day.
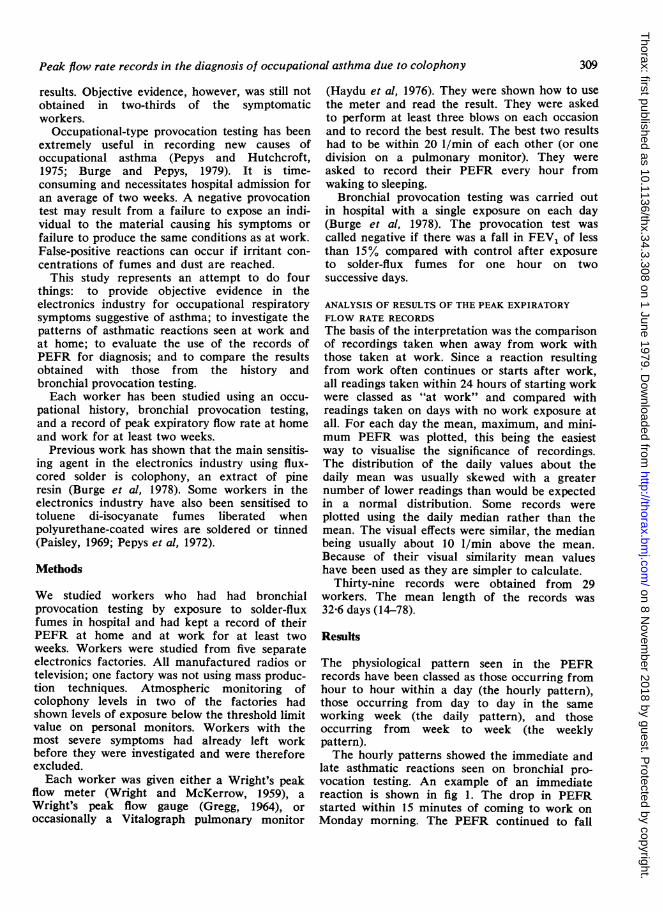
8 9 10 1 1 12 1 2 3 4 5 6 7 8 9 1am pm
Fig 2 Plot of hourly PEFR in a production lineinserter. Sunday record at home shows a morningdip and exaggerated "normal" diurnal variation.Morning dip has lessened by Monday morning but a
late asthmatic reaction starts just before leavingwork. By Friday of same working week morning dipand late asthmatic reaction are pronounced. Thisrecord shows progressive deterioration with workexposure and a three-day recovery pattern (see fig 4).
throughout the day, persisted in the evening, andrecovered overnight. On provocation testing anine and a half minute exposure to flux coredsolder produced an immediate asthmatic reactionthat resolved after two hours. The reaction wasblocked by sodium cromoglycate pretreatment.
Figure 2 shows a late asthmatic reaction atwork. This woman had a pronounced morningdip followed by initial improvement at work. Herasthma usually started shortly before leavingwork in the evening, but sometimes only afterleaving work. The first day at work after a breakproduced a much smaller reaction than on subse-quent days. Her PEFR was often lower on comingto work than when leaving.
DAILY PATTERNS OF PEAK EXPIRATORY FLOW RATE
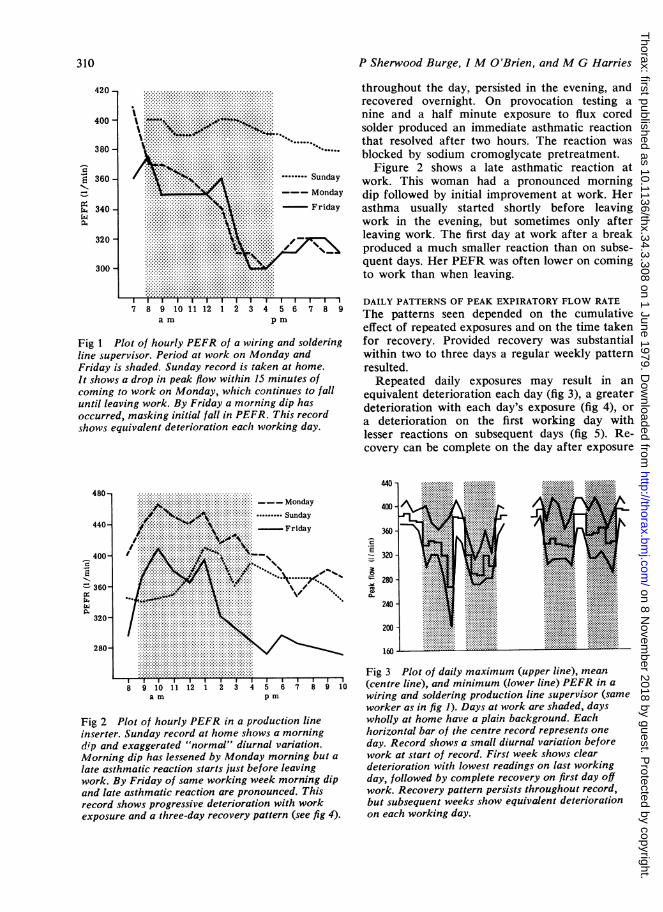
The patterns seen depended on the cumulativeeffect of repeated exposures and on the time takenfor recovery. Provided recovery was substantialwithin two to three days a regular weekly patternresulted.Repeated daily exposures may result in an
equivalent deterioration each day (fig 3), a greaterdeterioration with each day's exposure (fig 4), ora deterioration on the first working day withlesser reactions on subsequent days (fig 5). Re-covery can be complete on the day after exposure
.400
200-
160
Fig 3 Plot of daily maximum (upper line), mean(centre line), and minimum (lower line) PEFR in awiring and soldering production line supervisor (sameworker as in fig 1). Days at work are shaded, dayswholly at home have a plain background. Eachhorizontal bar of the centre record represents oneday. Record shows a small diurnal variation beforework at start of record. First week shows cleardeterioration with lowest readings on last workingday, followed by complete recovery on first day offwork. Recovery pattern persists throughout record,but subsequent weeks show equivalent deteriorationon each working day.
310
on 8 Novem
ber 2018 by guest. Protected by copyright.
http://thorax.bmj.com
/T
horax: first published as 10.1136/thx.34.3.308 on 1 June 1979. Dow
nloaded from
Peak flow rate records in the diagnosis of occupational asthma due tocolophony31
480
440 ~ ......... ........
c400~~~~~~~~~.......~~~~360.. ......0 ~ ~ ~ ~ ~ .......
4430 Fig4.Potof.axium.men,.ndminmu........ ..dal.P.Rinaprdutinlie.nsrer(sm.......... ~~ore s i 2.Rcodshw roge sv...........dtrirtinwthe.hw rkn ayi bt wes..........Rcoey.aestre ay a M ndybet
280 record)......
240~~~~~~~~~~~~~~~~. ...
440 21... .. . .. . .. . .. . .
400 ~ ~ .. . . . .. . . .. . . . .
.............. ............20B360 ~ . . . . . .. . .. . . .. . .
- 19... .. .. . . .. . .
320 ~ ~ .. . . . . .. . . .. . . . .
~~~280 18.... ... .. . .. .
........... ... .......
/40 ~ ~ . . . . . . . . . . . . .
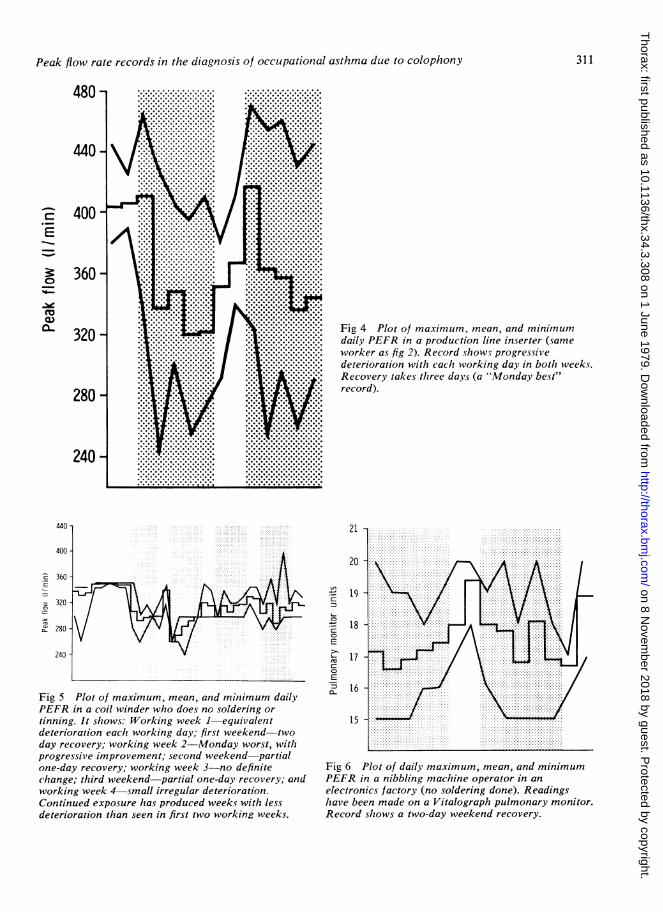
FigPltofmaxmum,mea, an miimu daily....PEFRinacoilwindr wo dos nosoldrin or.....tinineIthow: Wrkig wek ecivaen 15.....
deterioration each working day; first weekend-twoday recovery; working week 2-Monday worst, withprogressive improvement; second weekend-partialone-day recovery; working week 3-no definitechange; third weekend-partial one-day recovery, andworking week 4-small irregular deterioration.Continued exposure has produced weeks with lessdeterioration than seen in first two working weeks.
Fig6Plot of..dail maximum,...mean,.and..minimumPEFRin anibbling.machine operator......in ..anelectronics factor (nosodein. dne. Readings..........havebeen mad ona... Vitalograph..pulmonary.monitor.Record shows a..two-day.weeen recover.........
311
on 8 Novem
ber 2018 by guest. Protected by copyright.
http://thorax.bmj.com
/T
horax: first published as 10.1136/thx.34.3.308 on 1 June 1979. Dow
nloaded from
P Sherwood Burge, I M O'Brien, and M G Harries
480
440 -
400 -
c
-E
0-
3~
360
320 280 - ~~~~~~~~~~~~~.....':: ...~~~~~~......:~ ~~~~~~~~..,.....
~ ~
240 - %.: , ~~~~~~~......... ,:::::.::::..... \, ................................... .-.-.-.-.-.-.-.-.-.-.-.-.-.-.-.-.-..L .:. .:.:.:,.:.:.:.:.:.:,.:.:.:..:.... ~.-.-.-.-.-.-.-.-.-.-.-.-.-.-.-
... ................... ..
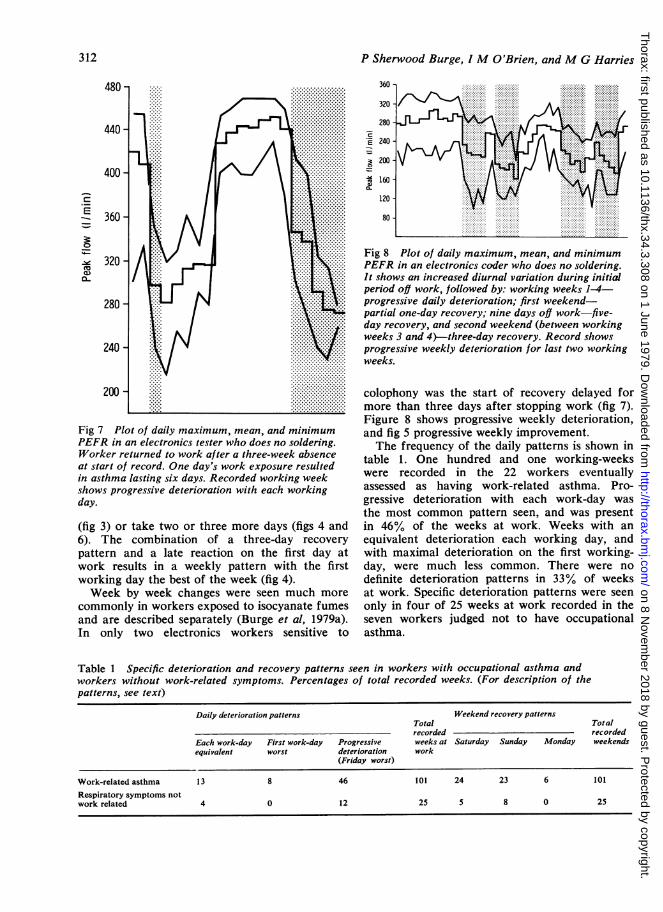
PEFR in an electronics tester who does no soldering.
Worker returned to work after a three-week absence
at start of record. One day's work exposure resulted
in asthma lasting six days. Recorded working week
shows progressive deterioration with each working
day.
(fig 3) or take two or three more days (figs 4 and
6). The combination of a three-day recovery
pattern and a late reaction on the first day at
work results in a weekly pattern with the first
working day the best of the week (fig 4).
Week by week changes were seen much more
commonly in workers exposed to isocyanate fumes
and are described separately (Burge et al, 1979a).
In only two electronics workers sensitive to
240 ~~~~~~~~~~~. _.A... .x.....
200 - ..' {.'...:
e 160 ......
...,'.......
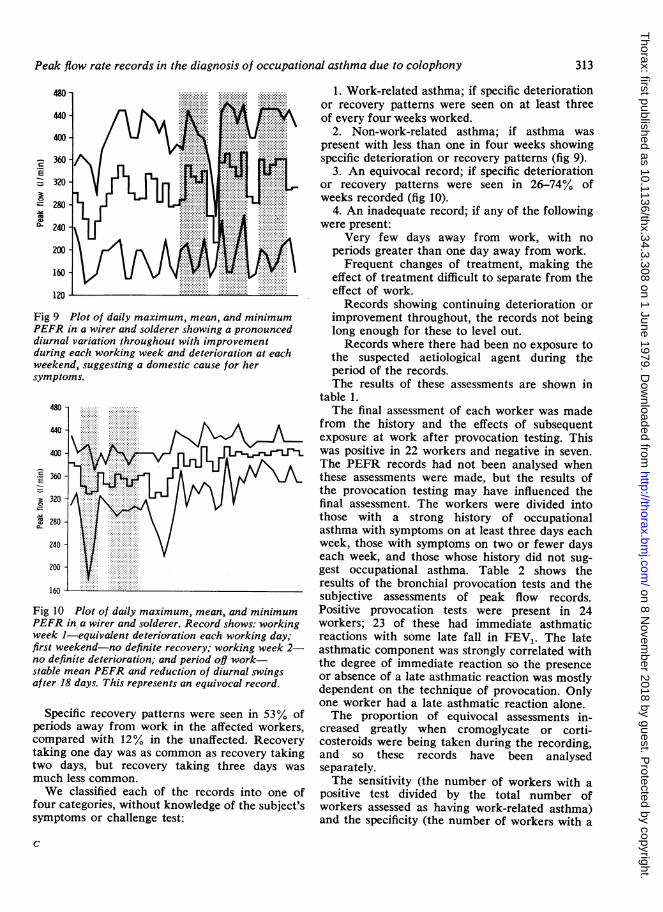
Fig 8 Plot of daily maximum, mean, and minimum
PEFR in an electronics coder who does no soldering.
It shows an increased diurnal variation during initial
period off work, followed by: working weeks 1X-4progressive daily deterioration; first weekend-
partial one-day recovery; nine days off work five-
day recovery, and second weekend (between working
weeks 3 and 4)-three-day recovery. Record shows
progressive weekly deterioration for last two working
weeks.
colophony was the start of recovery delayed for
more than three days after stopping work (fig 7).
Figure 8 shows progressive weekly deterioration,
and fig 5 progressive weekly improvement.
The frequency of the daily patterns is shown in
table 1. One hundred and one working-weeks
were recorded in the 22 workers eventually
assessed as having work-related asthma. Pro-
gressive deterioration with each work-day was
the most common pattern seen, and was present
in 46% of the weeks at work. Weeks with an
equivalent deterioration each working day, and
with maximal deterioration on the first working-
day, were much less common. There were no
definite deterioration patterns in 33% of weeks
at work. Specific deterioration patterns were seen
only in four of 25 weeks at work recorded in the
seven workers judged not to have occupational
asthma.
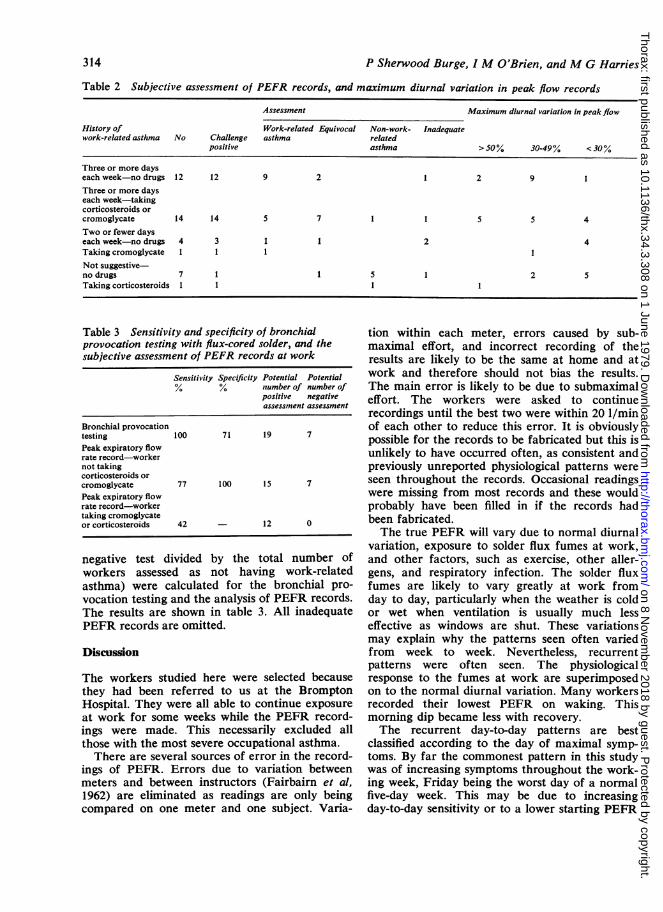
Table 1 Specific deterioration and recovery patterns seen in workers with occupational asthma andworkers without work-related symptoms. Percentages of total recorded weeks. (For description of thepatterns, see text)
Daily deterioration patterns Weekend recovery patternsTotal Totalrecorded recorded
Each work-day First work-day Progressive weeks at Saturday Sunday Monday weekendsequivalent worst deterioration work
(Friday worst)
Work-related asthma 13 8 46 101 24 23 6 101
Respiratory symptoms notwork related 4 0 12 25 5 8 0 25
312
on 8 Novem
ber 2018 by guest. Protected by copyright.
http://thorax.bmj.com
/T
horax: first published as 10.1136/thx.34.3.308 on 1 June 1979. Dow
nloaded from
Peak flow rate records in the diagnosis of occupational asthma due to colophony
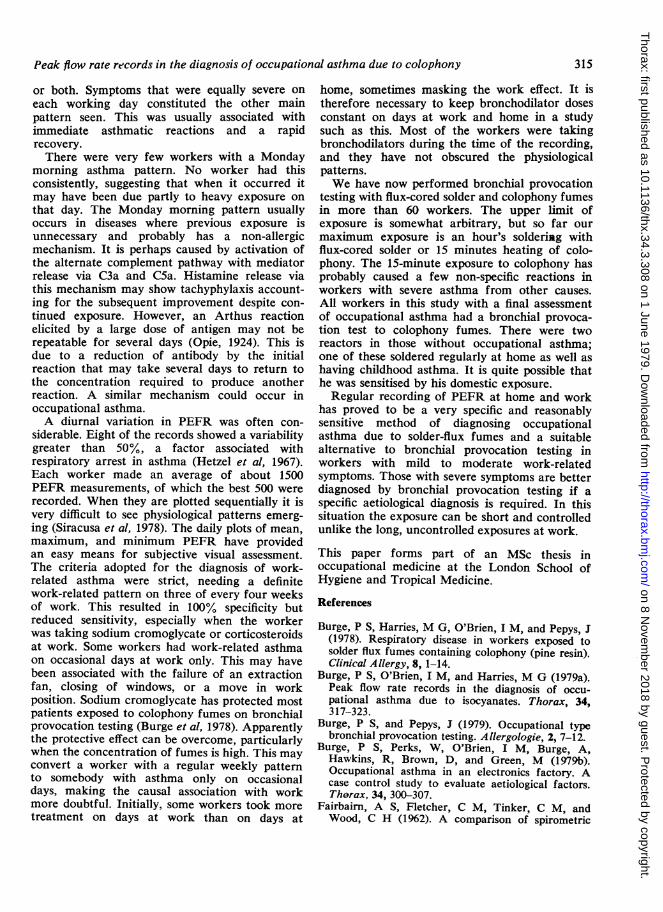
E
3
CL
Fig 9 Plot of daily maximum, mean, and minimumPEFR in a wirer and solderer showing a pronounceddiurnal variation throughout with improvementduring each working week and deterioration at eachweekend, suggesting a domestic cause for hersymptoms.
480 - ::::::::
*E 360 <20-....-.'.-
320 .. .. ........
160 - ...... .............
Fig 10 Plot of daily maximum, mean, and minimumPEFR in a wirer and solderer. Record shows: workingweek 1-equivalent deterioration each working day;first weekend-no definite recovery; working week 2-no definite deterioration; and period off work-stable mean PEFR and reduction of diurnal swingsafter 18 days. This represents an equivocal record.
Specific recovery patterns were seen in 53% ofperiods away from work in the affected workers,compared with 12% in the unaffected. Recoverytaking one day was as common as recovery takingtwo days, but recovery taking three days wasmuch less common.We classified each of the records into one of
four categories, without knowledge of the subject'ssymptoms or challenge test:
1. Work-related asthma; if specific deteriorationor recovery patterns were seen on at least threeof every four weeks worked.
2. Non-work-related asthma; if asthma waspresent with less than one in four weeks showingspecific deterioration or recovery patterns (fig 9).
3. An equivocal record; if specific deteriorationor recovery patterns were seen in 26-74% ofweeks recorded (fig 10).
4. An inadequate record; if any of the followingwere present:
Very few days away from work, with noperiods greater than one day away from work.Frequent changes of treatment, making the
effect of treatment difficult to separate from theeffect of work.Records showing continuing deterioration or
improvement throughout, the records not beinglong enough for these to level out.Records where there had been no exposure to
the suspected aetiological agent during theperiod of the records.The results of these assessments are shown in
table 1.The final assessment of each worker was made
from the history and the effects of subsequentexposure at work after provocation testing. Thiswas positive in 22 workers and negative in seven.The PEFR records had not been analysed whenthese assessments were made, but the results ofthe provocation testing may have influenced thefinal assessment. The workers were divided intothose with a strong history of occupationalasthma with symptoms on at least three days eachweek, those with symptoms on two or fewer dayseach week, and those whose history did not sug-gest occupational asthma. Table 2 shows theresults of the bronchial provocation tests and thesubjective assessments of peak flow records.Positive provocation tests were present in 24workers; 23 of these had immediate asthmaticreactions with some late fall in FEV1. The lateasthmatic component was strongly correlated withthe degree of immediate reaction so the presenceor absence of a late asthmatic reaction was mostlydependent on the technique of provocation. Onlyone worker had a late asthmatic reaction alone.The proportion of equivocal assessments in-
creased greatly when cromoglycate or corti-costeroids were being taken during the recording,and so these records have been analysedseparately.The sensitivity (the number of workers with a
positive test divided by the total number ofworkers assessed as having work-related asthma)and the specificity (the number of workers with a
c
313
on 8 Novem
ber 2018 by guest. Protected by copyright.
http://thorax.bmj.com
/T
horax: first published as 10.1136/thx.34.3.308 on 1 June 1979. Dow
nloaded from
P Sherwood Burge, I M O'Brien, and M G Harries
Table 2 Subjective assessment of PEFR records, and maximum diurnal variation in peak flow records
Assessment Maximum diurnal variation in peakflow
History of Work-related Equivocal Non-work- Inadequatework-related asthma No Challenge asthma related
positive asthma >50% 30-49% <30%
Three or more dayseach week-no drugs 12 12 9 2 1 2 9 1Three or more dayseach week-takingcorticosteroids orcromoglycate 14 14 5 7 1 1 5 5 4Two or fewer dayseachweek-no drugs 4 3 1 1 2 4Taking cromoglycate 1 1 1 1Not suggestive-no drugs 7 1 1 5 1 2 5Taking corticosteroids 1 1 1 1
Table 3 Sensitivity and specificity of bronchialprovocation testing with flux-cored solder, and thesubjective assessment of PEFR records at work
Sensitivity Specificity Potential Potential% %7 number of number of
positive negativeassessment assessment
Bronchial provocationtesting 100 71 19 7Peak expiratory flowrate record-workernot takingcorticosteroids orcromoglycate 77 100 15 7Peak expiratory flowrate record-workertaking cromoglycateor corticosteroids 42 - 12 0
negative test divided by the total number ofworkers assessed as not having work-relatedasthma) were calculated for the bronchial pro-vocation testing and the analysis of PEFR records.The results are shown in table 3. All inadequatePEFR records are omitted.
Discussion
The workers studied here were selected becausethey had been referred to us at the BromptonHospital. They were all able to continue exposureat work for some weeks while the PEFR record-ings were made. This necessarily excluded allthose with the most severe occupational asthma.There are several sources of error in the record-
ings of PEFR. Errors due to variation betweenmeters and between instructors (Fairbairn et al,1962) are eliminated as readings are only beingcompared on one meter and one subject. Varia-
tion within each meter, errors caused by sub-maximal effort, and incorrect recording of theresults are likely to be the same at home and atwork and therefore should not bias the results.The main error is likely to be due to submaximaleffort. The workers were asked to continuerecordings until the best two were within 20 1/minof each other to reduce this error. It is obviouslypossible for the records to be fabricated but this isunlikely to have occurred often, as consistent andpreviously unreported physiological patterns wereseen throughout the records. Occasional readingswere missing from most records and these wouldprobably have been filled in if the records hadbeen fabricated.The true PEFR will vary due to normal diurnal
variation, exposure to solder flux fumes at work,and other factors, such as exercise, other aller-gens, and respiratory infection. The solder fluxfumes are likely to vary greatly at work fromday to day, particularly when the weather is coldor wet when ventilation is usually much lesseffective as windows are shut. These variationsmay explain why the patterns seen often variedfrom week to week. Nevertheless, recurrentpatterns were often seen. The physiologicalresponse to the fumes at work are superimposedon to the normal diurnal variation. Many workersrecorded their lowest PEFR on waking. Thismorning dip became less with recovery.The recurrent day-to-day patterns are best
classified according to the day of maximal symp-toms. By far the commonest pattern in this studywas of increasing symptoms throughout the work-ing week, Friday being the worst day of a normalfive-day week. This may be due to increasingday-to-day sensitivity or to a lower starting PEFR
314
on 8 Novem
ber 2018 by guest. Protected by copyright.
http://thorax.bmj.com
/T
horax: first published as 10.1136/thx.34.3.308 on 1 June 1979. Dow
nloaded from
Peak flow rate records in the diagnosis of occupational asthma due to colophony
or both. Symptoms that were equally severe oneach working day constituted the other mainpattern seen. This was usually associated withimmediate asthmatic reactions and a rapidrecovery.There were very few workers with a Monday
morning asthma pattern. No worker had thisconsistently, suggesting that when it occurred itmay have been due partly to heavy exposure onthat day. The Monday morning pattern usuallyoccurs in diseases where previous exposure isunnecessary and probably has a non-allergicmechanism. It is perhaps caused by activation ofthe alternate complement pathway with mediatorrelease via C3a and C5a. Histamine release viathis mechanism may show tachyphylaxis account-ing for the subsequent improvement despite con-tinued exposure. However, an Arthus reactionelicited by a large dose of antigen may not berepeatable for several days (Opie, 1924). This isdue to a reduction of antibody by the initialreaction that may take several days to return tothe concentration required to produce anotherreaction. A similar mechanism could occur inoccupational asthma.A diurnal variation in PEFR was often con-
siderable. Eight of the records showed a variabilitygreater than 50%, a factor associated withrespiratory arrest in asthma (Hetzel et al, 1967).Each worker made an average of about 1500PEFR measurements, of which the best 500 wererecorded. When they are plotted sequentially it isvery difficult to see physiological patterns emerg-ing (Siracusa et al, 1978). The daily plots of mean,maximum, and minimum PEFR have providedan easy means for subjective visual assessment.The criteria adopted for the diagnosis of work-related asthma were strict, needing a definitework-related pattern on three of every four weeksof work. This resulted in 100% specificity butreduced sensitivity, especially when the workerwas taking sodium cromoglycate or corticosteroidsat work. Some workers had work-related asthmaon occasional days at work only. This may havebeen associated with the failure of an extractionfan, closing of windows, or a move in workposition. Sodium cromoglycate has protected mostpatients exposed to colophony fumes on bronchialprovocation testing (Burge et al, 1978). Apparentlythe protective effect can be overcome, particularlywhen the concentration of fumes is high. This mayconvert a worker with a regular weekly patternto somebody with asthma only on occasionaldays, making the causal association with workmore doubtful. Initially, some workers took moretreatment on days at work than on days at
home, sometimes masking the work effect. It istherefore necessary to keep bronchodilator dosesconstant on days at work and home in a studysuch as this. Most of the workers were takingbronchodilators during the time of the recording,and they have not obscured the physiologicalpatterns.We have now performed bronchial provocation
testing with flux-cored solder and colophony fumesin more than 60 workers. The upper limit ofexposure is somewhat arbitrary, but so far ourmaximum exposure is an hour's solderilg withflux-cored solder or 15 minutes heating of colo-phony. The 15-minute exposure to colophony hasprobably caused a few non-specific reactions inworkers with severe asthma from other causes.All workers in this study with a final assessmentof occupational asthma had a bronchial provoca-tion test to colophony fumes. There were tworeactors in those without occupational asthma;one of these soldered regularly at home as well ashaving childhood asthma. It is quite possible thathe was sensitised by his domestic exposure.
Regular recording of PEFR at home and workhas proved to be a very specific and reasonablysensitive method of diagnosing occupationalasthma due to solder-flux fumes and a suitablealternative to bronchial provocation testing inworkers with mild to moderate work-relatedsymptoms. Those with severe symptoms are betterdiagnosed by bronchial provocation testing if aspecific aetiological diagnosis is required. In thissituation the exposure can be short and controlledunlike the long, uncontrolled exposures at work.
This paper forms part of an MSc thesis inoccupational medicine at the London School ofHygiene and Tropical Medicine.
References
Burge, P S, Harries, M G, O'Brien, I M, and Pepys, J(1978). Respiratory disease in workers exposed tosolder flux fumes containing colophony (pine resin).Clinical Allergy, 8, 1-14.
Burge, P S, O'Brien, I M, and Harries, M G (1979a).Peak flow rate records in the diagnosis of occu-pational asthma due to isocyanates. Thorax, 34,317-323.
Burge, P S, and Pepys, J (1979). Occupational typebronchial provocation testing. Allergologie, 2, 7-12.
Burge, P S, Perks, W, O'Brien, I M, Burge, A,Hawkins, R, Brown, D, and Green, M (1979b).Occupational asthma in an electronics factory. Acase control study to evaluate aetiological factors.Thorax, 34, 300-307.
Fairbairn, A S, Fletcher, C M, Tinker, C M, andWood, C H (1962). A comparison of spirometric
315
on 8 Novem
ber 2018 by guest. Protected by copyright.
http://thorax.bmj.com
/T
horax: first published as 10.1136/thx.34.3.308 on 1 June 1979. Dow
nloaded from
316
and peak expiratory flow measurements in menwith and without chronic bronchitis. Thorax, 17,168-174.
Fawcett, I W, Merchant, J A, Simmonds, S P, andPepys, J (1978). The effect of sodium cromoglycate,beclomethazone diproprionate, and salbutamol onthe ventilatory response to cotton dust in millworkers. British Journal of Diseases of the Chest,72, 29-38.
Gandevia, B (1963). Studies of ventilatory capacityand histamine response during exposure to iso-cyanate vapour in polyurethane foam manufacture.British Journal of Industrial Medicine, 20, 204-209.
Greenhow, E H (1862). On brass-founders' ague.Medico Chirurgical Transactions, 45, 177-187.
Gregg, I (1964). The measurement of peak expira-tory flow rate and its application in general practice.Journal of the College of General Practitioners, 7,199-214.
Haydu, S P, Chapman, T T, and Hughes, D T D(1976). Pulmonary monitor for assessment of air-ways obstruction. Lancet, 2, 1225-1226.
Hetzel, M R, Clark, T J H, Branthwaite, M A (1977).Asthma: analysis of sudden deaths and ventilatoryarrests in hospital. British Medical Journal, 1, 808-811.
Kleinfeld, M, Messite, J, Swencicki, R E, andShapiro, J (1968). A clinical and physiologic studyof grain handlers. Archives of EnvironmentalHealth, 16, 380-384.
Opie, E C (1924). Desensitisation to local action ofantigen (Arthus Phenomenon). Journal of Immu-noloy, 9, 247-253.
Paisley, D P G (1969). Isocyanate hazard from wireinsulation, an old hazard in a new guise. BritishJournal of Industrial Medicine, 26, 79-81.
Pepys, J, and Hutchcroft, B J (1975). Bronchialprovocation tests in etiologic diagnosis and analysis
P Sherwood Burge, I M O'Brien, and M G Harries
of asthma. American Review of RespiratoryDisease, 112, 829-859.
Pepys, J, Pickering, C A C, Breslin, A B X, andTerry, D S (1972). Asthma due to inhaled chemicalagents-tolylene diisocyanate. Clinical Allergy, 2,225-236.
Pickering, C A C, Moore, W K S, Lacey, J, Holford-Strevens, V C, and Pepys, J (1976). Investigation ofa respiratory disease associated with an air-conditioning system. Clinical Allergy, 6, 109-118.
Plessner, M M (1960). Une maladie des trieurs deplumes: la fievre de canard. Archives des MaladiesProfessionelles, 21, 67-69.
Schilling, R S F (1956). Byssinosis in cotton and othertextile workers. Lancet, 2, 261 and 319.
Schoenberg, J B, Mitchell, C A (1975). Airway diseasecaused by phenolic (phenol-formaldehyde) resinexposure. Archives of Environmental Health, 30,574-577.
Siracusa, A, Curradi, F, and Abbritti, G (1978). Re-current nocturnal asthma due to tolylene di-isocyanate: a case report. Clinical Allergy, 8, 195-201.
Sokol, W N, Aelony, Y, and Beall, G N (1973). Meat-wrapper's asthma. Journal of the American MedicalAssociation, 226, 639-641.
Williams, N, Skoulas, A, and Merriman, J E (1964).Exposure to grain dust I. A survey of the effects.Journal of Occupational Medicine, 6, 319-329.
Wright, B M, and McKerrow, C B (1959). Maximumforced expiratory flow rate as a measure of ventila-tory capacity. British Medical Journal, 2, 1041-1047.
Requests for reprints to: Dr P S Burge, Departmentof Clinical Immunology, Cardiothoracic Institute,Brompton Hospital, Fulham Road, London SW36HP.
on 8 Novem
ber 2018 by guest. Protected by copyright.
http://thorax.bmj.com
/T
horax: first published as 10.1136/thx.34.3.308 on 1 June 1979. Dow
nloaded from