peak of hurricane season is here - cornell university
TRANSCRIPT

NOAA Updated 2019 Hurricane Season Outlook
Dr. Gerry Bell
Lead Seasonal Forecaster
Climate Prediction Center /NOAA/ NWS/ NCEP
Collaboration With
Peak of Hurricane Season is Here
National Hurricane Center/ NOAA/ NWS/ NCEP
Hurricane Research Division/ NOAA/ OAR/ AOML/ HRD
Presented to NOAA Eastern Region Climate Services: 29 August 2019

Predicted Path of Hurricane Dorian
Rush Hurricane Preparedness Plans to Completion

Preparedness
Water/ food for several days Batteries Flashlights, radio Medications Kids and Pets needs Cash
Evacuation Zone: Know where you will go Medications Important Documents Clothing Hygiene Items Gas for car
Web Links
Atlantic Hurricane Outlook
Outlook press release https://www.noaa.gov/media-release/noaa-increases-chance-for-above-normal-hurricane-season
Outlook technical write-up and analyses www.cpc.ncep.noaa.gov/products/hurricane
El Niño/ La Niña
Weekly update of tropical Pacific conditions: http://www.cpc.ncep.noaa.gov/products/analysis_monitoring/lanina/enso_evolution-status-fcsts-web.pdf
Tutorial (Technical): http://www.cpc.ncep.noaa.gov/products/analysis_monitoring/ensocycle/enso_cycle.shtml
Monthly Discussion/ Forecast http://www.cpc.ncep.noaa.gov/products/analysis_monitoring/enso_advisory/

Outline
1. Historical Atlantic storm tracks and counts
2. Updated 2019 Atlantic hurricane season outlook
3. Factors behind the updated outlook
4. Hurricane landfalls and preparedness
5. Summary

Main Development Region (MDR)
Atlantic BasinStorm Tracks 1980-2005
Historical Atlantic Storm Tracks
Atlantic Basin Storm Tracks 1980-2005
The activity in the Main Development Region (MDR) determines the strength of the hurricane season.
NOAA’s seasonal outlooks are based on predicting conditions within the MDR.
During above-normal seasons, storms typically have longer westward storm tracks, which means an increased threat of landfall.
Main Development Region (MDR)
Figure Courtesy of Wikipedia
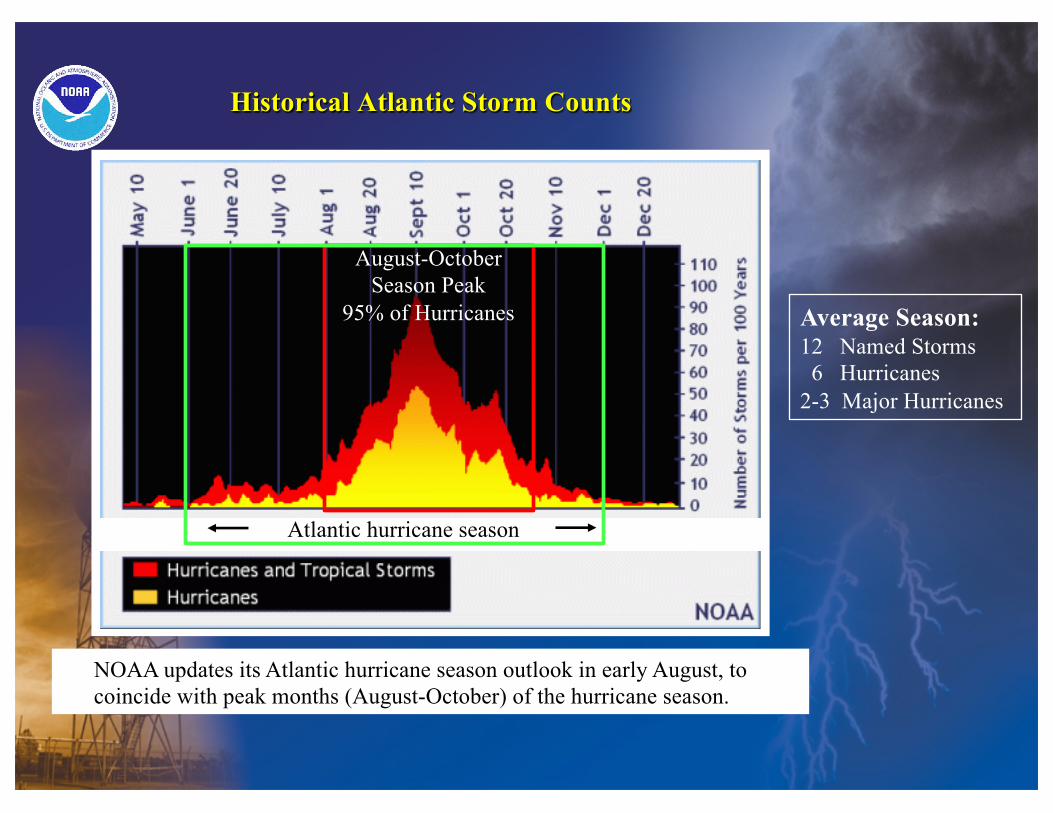
Historical Atlantic Storm Counts
August-October Season Peak
95% of Hurricanes
Atlantic hurricane season
Average Season: 12 Named Storms
6 Hurricanes 2-3 Major Hurricanes
NOAA updates its Atlantic hurricane season outlook in early August, to coincide with peak months (August-October) of the hurricane season.

NOAA’s Updated 2019 Atlantic Hurricane Season Outlook Forecasters increase Atlantic hurricane season prediction
A near-normal or above-normal Atlantic hurricane season is likely.
Outlook is for the overall seasonal activity. It is not a landfall forecast.
Activity August 2019 May 2019 Outlook Outlook
Named Storms 10-17 9-15
Hurricanes 5-9 4-8
Major Hurricanes 2-4 2-4

• 10-17 Named Storms Predicted (Jerry through Rebekah)
• Already had 5 storms to date. Still have a long way to go with this hurricane season.

The 2019 Atlantic Outlook in a Historical Perspective
70% probability of ACE range 85% - 165% of the median.
Ongoing conditions associated with the high-activity era favor a more active season for 2019.
High- and low activity eras typically last about 25-40 years. The current high-activity era for Atlantic hurricanes began in 1995.

The 2019 Outlook in a Historical Perspective Major Hurricanes
0
1
2
3
4
5
6
7
8 M
ajor
Hur
rican
es
Atlantic Major Hurricanes (MH) Per Season
High-activity era High-activity era Low-activity era
2019 Outlook
2.8 MH 1.5 MH 3.5 MH 19
50
1953
19
56
1959
19
62
1965
19
68
1971
19
74
1977
19
80
1983
19
86
1989
19
92
1995
19
98
2001
20
04
2007
20
10
2013
20
16
Yearly Count 5-pt Running Mean
Much of the year-to-year and decade-to-decade variability is not random.

Factors Behind the 2019 Hurricane Outlook

Underlying Concept behind Seasonal Hurricane Outlook
Hurricanes are ultimately a weather phenomena. However, seasonal hurricane activity is generally not random.
The regional conditions within the MDR (which largely control the number, strength, and duration of hurricanes) are often inter-related, often last for months or seasons, and often have strong climate links.
Some Regional Conditions That Influence Hurricanes African Easterly Waves Atlantic and Pacific Wind Shear Pre-Existing “Trigger” Ocean Temperatures
UPPER-LEVEL WINDS
LOWER-LEVEL WINDS
By predicting the key climate patterns and their combined impacts, we can often predict the strength of the hurricane season.

Hurricanes Require Weak Vertical Wind Shear Vertical wind shear refers to the change in wind speed and direction going up through the atmosphere.
Hurricanes need weak shear- Hurricanes destroyed by strong little change in winds. shear-large change in winds
Upper-Level Winds
Lower-Level Winds
Looking sideways through storm clouds
Looking down on storm clouds
Strong Hurricane
Ocean
40,000 ft. Upper-Level Winds
Lower-Level Winds
Lower clouds and circulation
Upper clouds
Strongly Sheared Storm
Ocean
40,000 ft.
EY
EE
ye W
all
Eye
Wal
l

Active
Most
Least Active
These Climate Patterns Strongly Influence Atlantic Hurricane Season
El Niño/ La Niña: Year-to-year Atlantic Multi-Decadal Oscillation (AMO): Multi-changes in Atlantic hurricanes decadal cycles in Atlantic hurricanes
Climate Pattern for High-Activity Era ElNiño:FewerHurricanes WarmerOcean
Stronger Warm Phase of AMO Shear Warm,Wet
Stronger, wetter WarmerOcean WestAfricanWeakerShear Monsoon
MainDevelopmentRegionLaNiña:MoreHurricanes
Climate Pattern for Low-Activity Era Weaker
CoolerOcean Shear Cool,Dry
Cool Phase of AMO
Weaker,drier CoolerOcean WestAfricanStrongerShear Monsoon Predicting these climate patterns and their MainDevelopmentRegioncombined impacts is the basis for making NOAA’s seasonal hurricane outlook.

1. El Niño dissipated during July----- In May, forecasters predicted a 60% chance of El Niño during August-October.
2. Reduced duration and strength of El Niño’s lingering, suppressing impacts (vertical wind shear and sinking motion) are now predicted.
3. Conducive conditions have developed across the eastern tropical Atlantic and western Africa, as predicted in May--Associated with ongoing high-activity era.
4. Model guidance now predicts more activity than it did in May.
Four Reasons Why the Season Could Be More Active

Expected Conditions During the Peak Months (August-October) of the 2019 Atlantic Hurricane Season
Main Development Region (MDR)
Above- or Near-Average Vertical Wind Shear (Green area)
Weaker Vertical Wind Shear (Orange area)
Lingering enhanced wind shear associatedwith El Niño is not expected to be as strong,or to last as long, as was predicted in May.
Above-average SSTs (Red area)
StrongerWest African
Monsoon
Weaker Trade Winds (Dark blue arrow)
Conducive African Easterly Jet (Light blue arrow)
In eastern MDR and Africa, high-activity eraconditions favor enhanced hurricane activity.

ENSO Evolution and Forecasts

Recent Sea Surface Temperature Anomalies (ºC)
El Niño/ La Niña Region
• El Niño dissipated during July• Currently no El Niño or La Niña.
oC
MDR MDREl Niño/ La Niña
Region
El Niño

Dynamical Model SST Anomaly Forecasts: Niño-3.4 Region
Model predictions from April, May, and June failed to predict the summertime dissipation of El Niño.
3-Month Season
00.10.20.30.40.50.60.70.80.9
1
JAS ASO SON OND NDJ
Deg
ree
C
Predicted SST Anomaly in Nino 3.4 RegionAverage of Dynamical Model Forecasts
Forecasts made in mid-April
00.10.20.30.40.50.60.70.80.9
1
JAS ASO SON OND NDJ
Deg
ree
C
Predicted SST Anomaly in Nino 3.4 RegionAverage of Dynamical Model Forecasts
Forecasts made in mid-May
00.10.20.30.40.50.60.70.80.9
1
JAS ASO SON OND NDJ
Deg
ree
C
Predicted SST Anomaly in Nino 3.4 RegionAverage of Dynamical Model Forecasts
Forecasts made in mid-June
00.10.20.30.40.50.60.70.80.9
1
JAS ASO SON OND NDJ
Deg
ree
C
Predicted SST Anomaly in Nino 3.4 RegionAverage of Dynamical Model Forecasts
Forecasts made in mid-July
El NiñoThreshold
00.10.20.30.40.50.60.70.80.9
1
JAS ASO SON OND NDJ
Deg
ree
C
Predicted SST Anomaly in Nino 3.4 RegionAverage of Dynamical Model Forecasts
Forecasts made in mid-August

0
10
20
30
40
50
60
70
80
April May Jun Jul Aug
CPC probability Forecast for ASO
CPC/ IRI ENSO Probability Forecasts for Aug-Oct
Prob
abili
ty o
f EN
SO P
hase
(%)
Month that Forecast was Issued
The CPC/ IRI forecast now indicates about a 65% chance of ENSO neutral during ASO 2019,whereas in May and June the forecast was for a 55%-60% chance of El Niño.
The unpredicted dissipation of El Niño is a main reason why the hurricane outlook ranges wereraised.

CPC/ IRI ENSO Probability ForecastForecast Issued August 8th
3-Month Season
La Niña ENSO El NiñoNeutral
Latest forecast predicts about a 50-55% chance of ENSO-neutral through remainder of year.

Hurricane Landfalls, Preparedness and Planning

40
77
0
10
20
30
40
50
60
70
80
90
Percent Increase in Number of U.S.Hurricane Landfalls
Percent Increase in Seasons withMultiple U.S. Hurricane Landfalls
The U.S. Sees More Landfalling Hurricanes During High-Activity Eras
44% Increase
86% Increase
Perc
ent I
ncre
ase

80+ million people are Atlantic or Gulf Coast residents that can be impacted by a tropical storm or hurricane.
Did you know?

Remember…It Only Takes One!
Be Ready! Take Action!
Prepare for every hurricane season regardless of seasonal outlook
12

Great web sites for hurricane preparedness
Ready.govHurricanes.gov
You are your first line of defense if a hurricane strikes14

Hurricanes are NOT just a coastal event.
Your hurricane preparedness plans must reflect bothyour personal situation and the storm conditions youmight expect.
Storm surge
Inland flooding
Tornadoes
Rip Currents
Devastating Winds
Downed Trees and Power Lines

U.S. Landfalling Hurricanes Last Year
Massive inland flooding.
Typical of a slow-moving tropical storm or a hurricane with long overland track.
Hurricane Florence Hurricane Michael (160 mph winds)
Significant coastal impacts: Storm surge, sometimes complete destruction.
Pre-storm preparedness and evacuations saved un-tolled number of lives
Hurricanes Florence and MichaelCaused $50+ Billion in Damage, 100+ lives lost
Each had different characteristics and impacts.

Summary
• We are now in the peak three months (August-October) of the Atlantic hurricane season.
• Increased likelihood of above-normal activity, with 10-17 named storms, 5-9 hurricanes, 2-4 major hurricanes, and an ACE range of 85%-165% of the median.
• The main reason for the change from May outlook is that El Niño has dissipated, and its suppressing influence is expected to be weaker and less extensive---ENSO forecasts issued in spring tend to have little skill.
Remember…It Only Takes One!
Be Ready! Take Action!
• High-activity era for Atlantic hurricanes continues—more hurricanes and more landfalling hurricanes
• Coastlines continue to build up—80+ million people have the potential to be impacted by a tropical storm or hurricane.