peak performance 2.0 review april 11, 2014. - 2 - 2 agenda welcome and introductions performance...
TRANSCRIPT

Peak Performance 2.0 ReviewApril 11, 2014

- 2 -2
Agenda
Welcome and introductions
Performance management and innovation
Lights on dialogue; takeaways and next steps

- 3 -3
Vision Alignment
Citywide Vision:
We will deliver a world-class city where everyone matters.
Agency Vision :
Provide a structure which enables those in need of assistance or protection to have a proven, timely path to safety and self-sufficiency allowing us to focus on prevention and strengthening our community.

- 4 - 4
Strategic Plan Overview
Strategy 1: Cutting Edge Practice
Implement best practice, performance
based, continuous improvement
decision-making
Mission: Partnering with our community to protect those in harm’s way and help all people in need.
Protection and Prevention: Protect vulnerable children and adults from abuse, neglect and
exploitation while fostering healthy families and communities to their fullest potential.
Assistance: Assure that people’s basic needs are met through the provision of timely, integrated financial assistance with comprehensive service
that helps individuals and families meet self-sufficiency.
Strategy 2: Responsive Customer
Service
Pursue a customer friendly, accessible
service delivery system
Strategy 3: Collaborative Community
Partnerships
Expand and strengthen local
community and state partnerships
Strategy 4 Responsible Financial
Management
Promote fiscal responsibility and
accountability
Strategy 5: Superior Workforce
Development
Attract and retain a high performing, diverse and well-trained workforce

- 5 - 5
Performance Measure: Goal Qtr12013
Qtr22013
Qtr32013
Qtr42013
Timeliness:Percent of assistance applications across all programs (excluding Child Support Enforcement) are processed within federal timeliness guidelines
>95%CDHS
88.6 86.7 90.1 90.1
Outreach:Percent of potentially eligible Denver residents receive SNAP/food assistance
>90%DHS
89.0 87.7 88.0 89.1
Percent of potentially eligible Denver residents receive family medical assistance >90%DHS 76.0 76.8 75.8 74.2
Administrative Efficiency:Percent of administrative overhead to distribute assistance benefits to families and children
<13% DHS
20.8 20.4 20.0 19.8
Percent of owed court ordered child support obligations that were collected and distributed to families.
>61% DHS
58.2 59.9 59.7 59.0
Goal I: AssistanceMission-Level Metrics

- 6 - 6
Food Assistance/ SNAP Outreach
Why does it change?
•The denominator is derived from US Census estimates of Federal Poverty.
•No adjustment in 2013
1
•Mass Closures and Corrections in State Systems.
•Cost of Living Adjustments
2
•Active Individuals of Cases receiving FA benefits
•Individuals used to calculate FA benefits
3

- 7 - 7
Medical Assistance OutreachAffordable Care Act
Why does it change?
•The denominator is derived from US Census estimates adjusted annually
1
•Affordable Care Act and Marketing
2
•System Changes
3

- 8 - 8
Performance Measure: Goal Qtr12013
Qtr22013
Qtr32013
Qtr42013
Prevention of Re-Abuse:Percent of children who experienced founded abuse or neglect did not experience repeat founded abuse or neglect within 6 months
>94.6%Fed
93.8 91.7 93.3 95.8
Family Preservation:Percent of children initially served in their own home were not placed outside the home anytime during case involvement
>85%CDHS
71.2 75.4 70.1 64.6
Responsiveness: Percent of alleged child victims were seen within federal guidelines for initial response >90%
Fed90.5 91.1 90.8 91.2
Percent of Adult Protection referrals were responded to within 3 days >85%DHS
98.9 99.4 98.5 96.7
Well Being:Percent of children requiring monthly face-to-face contacts are seen as expected and documented according to ARD guidelines
>95%DHS
86.0 89.5
91.4
85.8
Goal II: Protection & PreventionMission-Level Metrics
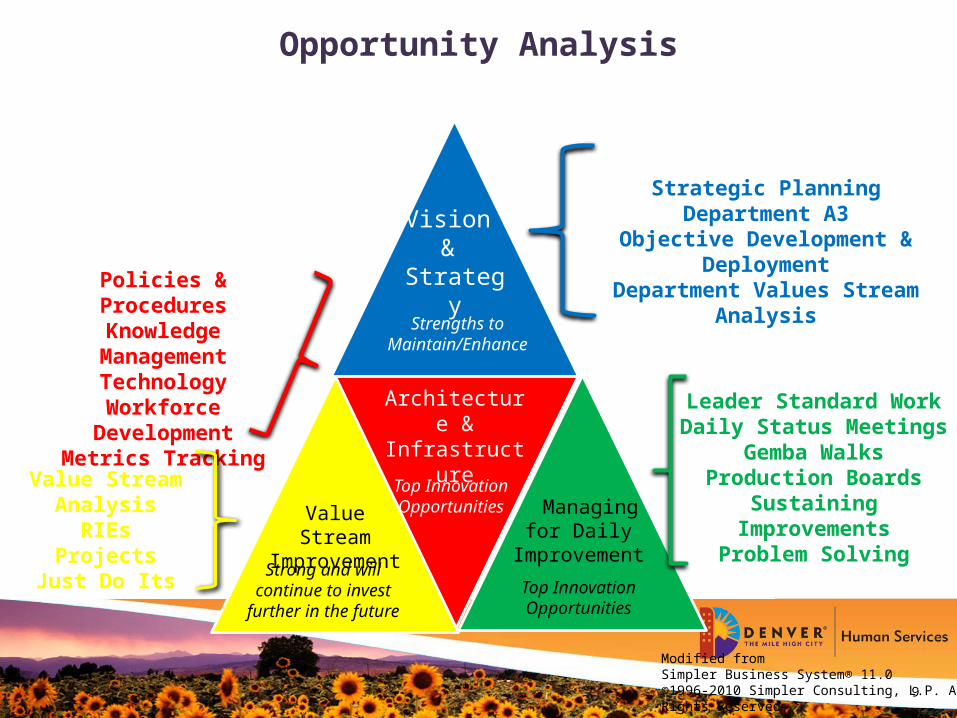
Opportunity Analysis
Architecture & Infrastructure
Policies & ProceduresKnowledge Management
TechnologyWorkforce Development
Metrics Tracking
Top Innovation Opportunities Managing for
Daily Improvement
Leader Standard WorkDaily Status Meetings
Gemba WalksProduction Boards
Sustaining ImprovementsProblem Solving
Top Innovation Opportunities
Value Stream Improvement
Value Stream Analysis
RIEsProjects
Just Do ItsStrong and will
continue to invest further in the future
Strategic PlanningDepartment A3
Objective Development & Deployment
Department Values Stream Analysis
Vision &
Strategy
Strengths to Maintain/Enhance
Modified from Simpler Business System® 11.0 ©1996-2010 Simpler Consulting, L.P. All Rights Reserved
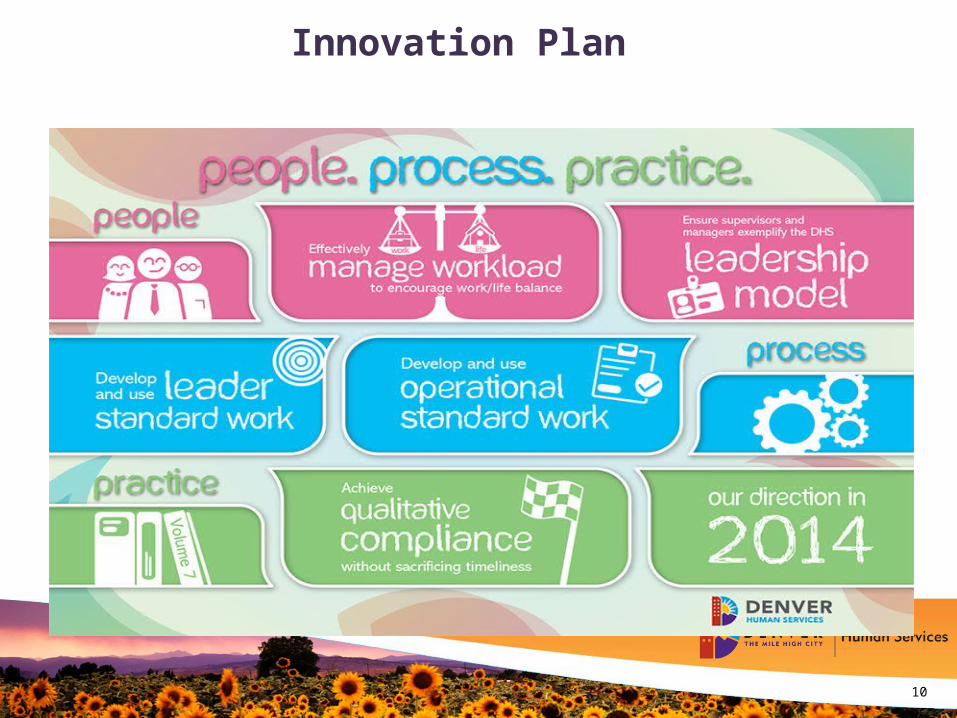
Innovation Plan
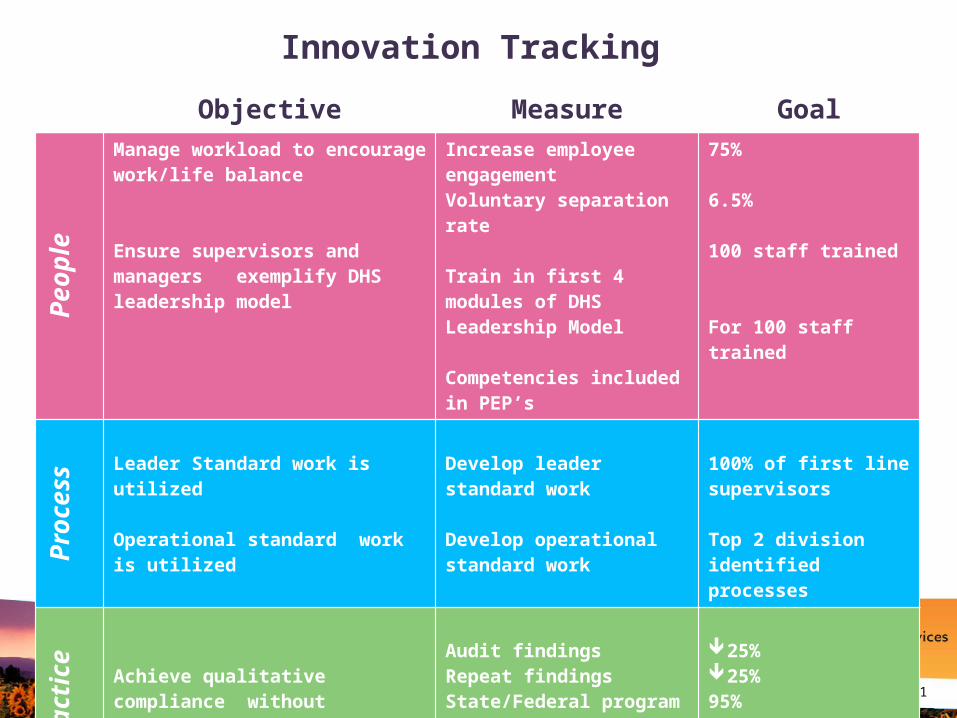
Objective Measure Goal
People
Manage workload to encourage work/life balance
Ensure supervisors and managers exemplify DHS leadership model
Increase employee engagementVoluntary separation rate
Train in first 4 modules of DHS Leadership Model
Competencies included in PEP’s
75%
6.5%
100 staff trained
For 100 staff trained
Process
Leader Standard work is utilized
Operational standard work is utilized
Develop leader standard work
Develop operational standard work
100% of first line supervisors
Top 2 division identified processes
Practice
Achieve qualitative compliance without sacrificing timeliness
Audit findingsRepeat findingsState/Federal program quality standardsState/Federal timeliness standards
25%25%95%
90%
Innovation Tracking
- 12 - 12
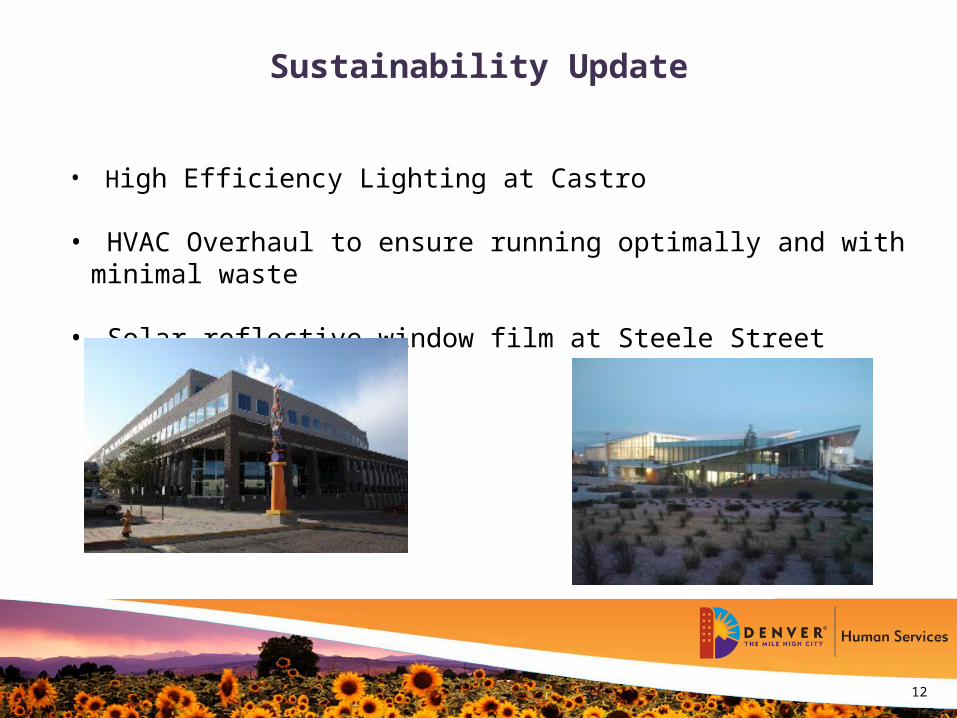
Sustainability Update
• High Efficiency Lighting at Castro
• HVAC Overhaul to ensure running optimally and with minimal waste
• Solar reflective window film at Steele Street

- 13 -
Employee Engagement
9.5
2011 Engagement Index
17.7% actively engaged – 8.2% actively disengaged
14.4
2013 Engagement Index
20.3% actively engaged – 5.9% actively disengaged

- 14 -
Succession Planning
Denver Human ServicesEmployees Eligible for Retirement
by Classification12/31/15
Denver Human ServicesEmployees Eligible for Re-tirement by Classification
12/31/15 (n=133)
Professional
Clerical
IT
Legal
Enf/Comp
Fiscal
Denver Human ServicesEmployees Eligible for Re-
tirement by 12/31/2015 (n=133)
Admin
B Mgmt
CSE
FAD
FS
PIA
P&P
6
36
3
16
14
50
8
79
9
29
13
1
2
- 15 - 15
Accomplishments & Challenges
Accomplishments: • Flow Cell Implementation• Same Day Interviews• Continuity of Care• Denver Authorization Referral Tracking (DART)• 29 RIE’s in 2 identified value streams and across other programs• Green Belts: 35 Black Belts: 65
Challenges: • Affordable Care Act implementation and technology• Quality
On the Radar• Program and practice changes: Adult Protection; Child Care Assistance• Child Welfare Hotline; Child Welfare Differential Response

- 16 -16
Next Steps
CFO performance budget kickoff Innovation update 2014 plan:
– People– Process– Practice