pebble abrasion during fluvial transport: experimental ...pebble abrasion during fluvial transport:...
TRANSCRIPT

Pebble abrasion during fluvial transport: Experimental results
and implications for the evolution of the sediment load along rivers
Mikael Attal1 and Jerome Lave2
Received 30 March 2009; revised 18 August 2009; accepted 2 September 2009; published 15 December 2009.
[1] In actively eroding landscapes, fluvial abrasion modifies the characteristics of thesediment carried by rivers and consequently has a direct impact on the ability of mountainrivers to erode their bedrock and on the characteristics and volume of the sedimentexported from upland catchments. In this experimental study, we use a novel flumereplicating hydrodynamic conditions prevailing in mountain rivers to investigate the roleplayed by different controlling variables on pebble abrasion during fluvial transport.Lithology controls abrasion rates and processes, with differences in abrasion ratesexceeding two orders of magnitude. Attrition as well as breaking and splitting are efficientprocesses in reducing particle size. Mass loss by attrition increases with particlevelocity but is weakly dependent on particle size. Fragment production is enhanced by theuse of large particles, high impact velocities and the presence of joints. Based on ourexperimental results, we extrapolate a preliminary generic relationship between pebbleattrition rate and transport stage (t*/t*c ), where t* = fluvial Shields stress and t*c = criticalShields stress for incipient pebble motion. This relationship predicts that attrition rates areindependent of transport stage for (t*/t*c ) � 3 and increase linearly with transport stagebeyond this value. We evaluate the extent to which abrasion rates control downstreamfining in several different natural settings. A simplified model predicts that the mostresistant lithologies control bed load flux and fining ratio and that the concavity oftransport-limited river profiles should rarely exceed 0.25 in the absence of depositionand sorting.
Citation: Attal, M., and J. Lave (2009), Pebble abrasion during fluvial transport: Experimental results and implications for the
evolution of the sediment load along rivers, J. Geophys. Res., 114, F04023, doi:10.1029/2009JF001328.
1. Introduction
[2] Mountainous landscapes result from the competitionbetween rock uplift and erosion. In nonglaciated regions,rivers have been recognized as one of the primary agents oferosion. During mountain denudation, river networks play adual role. First, rivers incise into bedrock and thus drivegravitational instabilities and landslides, controlling in thatway part of the hillslope erosion processes [e.g., Burbank etal., 1996; Whipple et al., 1999]. Second, rivers conveythe erosion products supplied from hillslopes and fromupstream to sedimentary basins. Mountain rivers transportthe erosion products as dissolved load, suspended load andbed load. Bed load characteristics, i.e., pebble size distri-bution, lithologic proportion and ratio to total exported load,usually vary along a river course from its source down tothe foreland basins. This longitudinal evolution dependson the geographic distribution of sediment fluxes fromhillslopes, on the characteristics of these sources of sedi-ment, on the abrasion processes during fluvial transport, and
on the hydraulic sorting processes during fluvial transport[Attal and Lave, 2006].[3] There are at least two reasons why such downstream
evolution of sediment size and quantity needs to beaddressed, understood and quantified. First, an appropriatetheory and quantification of this phenomenon wouldprovide the framework to interpret preserved sedimentaryrecords of erosion in detrital series. In particular, it wouldhelp to unravel the paleoclimatic or tectonic informationrelated to the denuded orogen by correcting the sedimentarysignal from the distortion that abrasion and fluvial transportprocesses may introduce between the internal mountainoussediment source and the foreland basin. Second, researchersare increasingly recognizing the potentially important roleof sediment flux, in particular bed load flux, in determiningriver incision rates into bedrock [Gilbert, 1877;Willgoose etal., 1991; Howard et al., 1994; Sklar and Dietrich, 1998,2004; Whipple and Tucker, 2002; Cowie et al., 2008].Because river incision controls landscape denudation inactive orogens, quantifying the downstream evolution ofthe sediment load is a central issue in long-term landscapeevolution models and related problems, such as the linkagesbetween climate, erosion, and tectonics.[4] For more than a century, scientists have studied the
evolution of bed load characteristics during fluvial trans-port. The rounding processes that transform angular clasts at
JOURNAL OF GEOPHYSICAL RESEARCH, VOL. 114, F04023, doi:10.1029/2009JF001328, 2009ClickHere
for
FullArticle
1School of GeoSciences, University of Edinburgh, Edinburgh, UK.2Centre de Recherches Petrographiques et Geochimiques, Nancy,
France.
Copyright 2009 by the American Geophysical Union.0148-0227/09/2009JF001328$09.00
F04023 1 of 22

the source to rounded pebbles with varied shapes receivedconsiderable attention during the first half of the 20thcentury [e.g., Wentworth, 1919; Krumbein, 1941; Kuenen,1956] and a general consensus has arisen on the qualitativedescription of this rounding phenomenon. In contrast, thenature of the processes that lead to downstream sizereduction has been debated for more than 50 years. Thecontroversy arises from the general discrepancy betweensize reduction rates measured in experimental studies ofpebble abrasion and the downstream fining rates measuredalong rivers [Kuenen, 1956; Bradley, 1970; Shaw andKellerhals, 1982; Kukal, 1990; Brewer and Lewin, 1993;Kodama, 1994a, 1994b]. Downstream fining in rivers iscommonly described by Sternberg’s [1875] law:
D ¼ D0:e�dLt; ð1Þ
where D0 = initial grain size, D = grain size after a traveleddistance Lt, and d = fining rate in km�1. Experimental sizereduction rates have been found to be one to two orders ofmagnitude lower than fining rates in the field. Thisdiscrepancy has led several authors to conclude thatselective sorting during fluvial transport is the dominantcontrol on downstream sediment grain size reduction[Brierley and Hickin, 1985; Paola et al., 1992; Brewerand Lewin, 1993; Ferguson et al., 1996; Surian, 2002;Moussavi-Harami et al., 2004]. Such a conclusion isprobably valid in river systems where sediment aggradationis occurring (e.g., alluvial rivers). In contrast, in a riversystem which is not aggrading, selective sorting can beexpected to be minimal because there is no selectivedeposition of coarse material. Other authors have thusproposed that the discrepancy results from higher abrasionrates in natural systems than in experimental conditions,either because of the combined roles of chemical weatheringand abrasion [Bradley, 1970; Jones and Humphrey, 1997] orbecause most of the experimental devices improperlyreproduce pebble trajectories and associated impacts [e.g.,Kuenen, 1956; Mikos and Jaeggi, 1995; Lewin and Brewer,2002]. This latter criticism is mainly aimed at the tumblingbarrels used in many previous studies (e.g., Daubree [1879],Wentworth [1919], Krumbein [1941], Brewer and Lewin[1993], Mikos and Jaeggi [1995], and Jones and Humphrey[1997]; see exhaustive list in the work by Lewin and Brewer[2002]), although some of them were designed to replicatehigh velocity impacts characterizing mountain rivers[Kodama, 1994b].[5] The purpose of the present study is to characterize and
quantify pebble abrasion during fluvial transport using anovel experimental device that reproduces for the first timeboth the type and magnitude of hydrodynamic conditionsprevailing during floods in mountain rivers [Attal et al.,2006]. In this parametric study, we explore the dependenceof abrasion on controlling variables: sediment amount,particle velocity, size, and lithology, and channel floorconditions. Our facility consists of a circular flume in whicha flow is produced by four tangential water injection points(Figure 1). Particular attention was given to the possibilityof measuring the hydrodynamic variables and pebbletrajectories in order to enable transposition of the resultsto natural rivers. After a detailed description of the flumeand of the procedure applied to measure hydrodynamic
variables, abrasion rates and the characteristics of abrasionproducts, we present our experimental results of pebbleabrasion by interpebble impacts and describe the controlsexerted by the above variables on abrasion rates. Finally, weconsider the implications of our results for the evolution ofthe bed load during its journey along fluvial networks anddiscuss the effects of this evolution on fluvial erosion,on landscape evolution and on the information recorded inthe characteristics of detrital rocks along rivers and insedimentary basins.
2. Experimental Device and Procedure
2.1. Experimental Device
[6] Two different types of device that permit sediments tobe transported over large distances have been used to studypebble abrasion: tumbling mills and circular flumes. Incontrast with tumbling mills, in which abrasion is a com-bination of intergranular friction and rolling during sedi-ment motion and for which traveling distance is difficult toestimate [Mikos and Jaeggi, 1995], circular flumes offer thepossibility to better reproduce the hydrodynamic conditionsprevalent in natural rivers, because sediment motion isinduced by a water current. In the first design of circularflume proposed by Kuenen [1956], water circulation wasmaintained by paddles in rotation. However, such a paddlesystem may generate unrealistic turbulence at the edges ofeach paddle; it also creates difficulties to monitor variablesor to introduce sensors and instruments into the flume;finally, interactions between pebbles and paddles cannot beexcluded, in particular at high flow. Alternative designs thatprevent such drawbacks involve circular flow sustained bylateral fluid injection and a water recirculation system[Lewin and Brewer, 2002; Attal et al., 2006].[7] In the water recirculating device that we developed
[Attal et al., 2006], the water is entrained by a 22 kW pump.The pump system is driven by a flowmeter that allows thedischarge to be adjusted to any value between 0 and 140 l/s.Water is brought to the circular flume by flexible pipes andis injected tangentially at four points to provide an approx-imately uniform flow within the flume (Figure 1). Thestainless steel circular flume has the following dimensions:external diameter = 1.5 m, flume width = 0.3 m and flumedepth = 0.6 m. Water is evacuated by overflowing theinternal wall of the flume and is collected in a 5 m3 tankbefore being recirculated by the pump. During experiments,a vortex is created by the effect of the centrifugal forceexerted on the water column. The bed of the flume isprotected by removable plates which can be covered bydifferent kinds of material. To study pebble abrasion byimpacts between moving pebbles without the influence ofbedrock (this study), ‘‘nonabrasive’’ plates covered withpieces of tires were installed on the flume floor. To studyinteractions between pebble and bedrock, or betweenmoving pebble and immobile pebbles, ‘‘nonabrasive’’ platescan be replaced by ‘‘abrasive’’ plates with varied roughnessand strength. A 0.5 mm mesh sieve is located between theflume and the tank to collect the largest abrasion productsand to prevent damage to the pump.[8] For some experiments and to investigate scaling
issues, a simplified and reduced (1/5 scale) version of theabove device was used (Figure 1d). In this device, hereafter
F04023 ATTAL AND LAVE: EXPERIMENTAL STUDY OF PEBBLE ABRASION
2 of 22
F04023

called the small flume, four similar pumps provide constanttangential injection discharge directly in the flume channel.Hydraulic and pebble transport conditions are consistentwith those prevailing in the large flume [Attal, 2003].
2.2. Flow Dynamics and Particle Behavior
[9] Despite its circular geometry, the experimental devicereproduces flow patterns and particle behavior similar tothose described in natural rivers [Attal et al., 2006], inexperimental straight flumes or in numerical models [e.g.,Nino et al., 1994; Nino and Garcıa, 1994]. Using the heightof the vortex, mean water velocity can easily be determinedfor any experiment. For a radially uniform flow, the vortex
size depends on the mean water velocity across the flume[Chang, 1988; Attal et al., 2006]:
dZ �wU2
fl
grm; ð2Þ
where dZ is the height difference between the top and thebottom of the vortex (Figure 1c), w is the flume width, Ufl isthe mean water velocity across a flume section, g is thegravitational acceleration and rm is the mean radius of theflume. In this flume, the height of the external wall (1.5 m)limits the maximum average flow velocity to �4 m.s�1. The
Figure 1. The experimental device. Basal and lateral windows (BW and LW, respectively) allow thevisualization of pebble motion during experiments. (a) Photo of the device. (b) Plan view of the device.For clarity, the pipes connecting the flow distributor to the flume (p) have not been drawn. (c) Crosssection of the flume showing the vortex created by the fluid in rotation during experiments (zoom�2 with respect to Figure 1b). (d) Photo of the small circular flume (1/5 scale) showing the vortex.
F04023 ATTAL AND LAVE: EXPERIMENTAL STUDY OF PEBBLE ABRASION
3 of 22
F04023

average flow velocity depends on the injection velocity andon the bed roughness. Roughness increases with an increasein size and/or amount of sediment and it controls the verticaland radial gradients of fluid velocity [Attal et al., 2006]. Thetangential velocity is relatively constant in a vertical profile,
except near the floor where an abrupt velocity drop marksthe basal boundary layer, whose thickness increases withsediment roughness. The application of the Euler theoremallows the calculation of the basal shear stress exerted onthe flume floor and on the pebbles [Attal et al., 2006].Along a radial profile, the tangential velocity is alsorelatively constant when the roughness is low or for highfluid injection. However, a radial gradient characterized bya decrease in velocity from the outer wall to the inner wallof the flume may appear when roughness is large. In thatcase, equation (2) reduces the radius-averaged velocity to acrude approximation [Attal et al., 2006].[10] The flume lateral and basal windows (LW and BW in
Figures 1a and 1b) allow observation of particle behavior.Particle trajectories and collisions were recorded and ana-lyzed using a high-speed camera. When drag and lift forcesare sufficient to extract pebbles from their position, pebblesmove by saltation and occasionally by rolling (Figure 2a).Mean saltation velocity up during a hop, as well as trajec-tory, were measured directly from particle tracking on themovies (1/125 s time sampling). In order to accuratelycalculate the average traveling velocity Up and the meandistance traveled by the pebbles during an experiment, theaverage radius of curvature of the particle trajectory wasestimated. This radius is a function of the centrifugal forceacting on the particle, a centripetal force due to the com-bined effects of a radial pressure gradient and of secondarycurrents existing in the basal boundary layer [e.g., Chang,1988], and the momentum transfer during interparticlecollision and collision with the walls of the flume. For therange of pebble sizes and flow velocities used in this study,it was observed through the basal window that pebblesoccupy the full width of the flume but that the meancurvature radius and average particle path slightly vary,depending on pebble size, velocity and amount of sediment(Figure 2b).[11] The average traveling velocity Up to accomplish a
round trip in the flume was determined by dividing themean distance traveled by the pebbles during a lap by themean time required by the pebbles to accomplish a lap. Thistime was estimated in three different ways: by timing apainted pebble during the experiment; by timing a specificpebble (specific in shape and/or color) that was recognizableon the video record, and by estimating the flux of pebbleson the video record and then dividing it by the number ofpebbles introduced into the flume. The three methodsprovide similar results and the average velocity Up is foundto be very close to the mean hop velocity up, except at lowstage, when pebble motion is only partial. In this latter case,the average traveling velocity Up represents the sum ofmotion periods characterized by a velocity up and of resting
Figure 2. (a) Snapshots of movies recorded with a highspeed camera to track the trajectories of pebbles in saltationduring experiments with (top) 34 kg of 60–80 mm pebblesand an input discharge of 118 l/s and (bottom) 18 kg of10–20 mm pebbles and an input discharge of 62 l/s.(b) Mean trajectory curvature radius as a function of fluidvelocity and sediment amount for the 60–80 mm pebbles.Trajectories with large curvature radius are observed forhigh velocity and low sediment amount.
F04023 ATTAL AND LAVE: EXPERIMENTAL STUDY OF PEBBLE ABRASION
4 of 22
F04023

periods; in this case, we frequently observed that someparticles remain permanently motionless. For both flumes,the mean pebble velocity is, to a first approximation,linearly related to the water velocity (Figure 3) almostwhatever the size and quantity of sediments introduced inthe flume, as long as the sediments are in full motion. This‘‘full motion’’ condition was fulfilled in almost all of ourabrasion experiments.
2.3. Experimental Procedure
[12] For most of the experiments (except multilithologyexperiments), limestone pebbles were used. Such lithologyis sufficiently ‘‘soft’’ to obtain significant abrasion rateseven for short experiment durations. All the limestonepebbles were collected in a single gravel bar located inAspremont, along the Grand Buech River (Devoluy-Bochaine Massif, French Alps). Most of the pebbles inthe river are sourced from Upper Jurassic and Cretaceousfine-grained limestones, and have traveled at least 10 km.This enabled us to use relatively well-rounded and non-weathered clasts, in order to avoid an overestimation of theabrasion rates due to the fast rounding of angular clasts[Krumbein, 1941; Kuenen, 1956; Pearce, 1971] or to theremoval of the weakened superficial layer of weatheredpebbles [Bradley, 1970]. Well-sorted material was used inthe experiments, and four size classes were defined: 10–20 mm, 20–40 mm, 40–60 mm and 60–80 mm. Thesedimensions correspond to the mesh of the square meshsieves used to sort the sediment. Gravel of size varyingbetween 10 and 28 mm was also collected for experimentsin the small flume.
[13] Pebble abrasion during fluvial transport results frommoving pebbles impacting other moving pebbles or ‘‘sub-strate’’ (bedrock or immobile pebbles). In order to isolate asingle process and better characterize the control exerted bythe different variables on abrasion, our experiments mostlyfocus on abrasion by impacts between moving pebbles. Todo so, we used rubber flooring to suppress any substrateabrasion and conducted our experiments primarily at fulltransport stage, i.e., with all the pebbles in motion. At fulltransport stage, water and pebble velocities were found tobe approximately radially uniform, thus enabling a simplerinterpretation to our parametric study. Four sets of experi-ments were performed in both flumes (Table 1) to investi-gate the influence of different variables on pebble abrasionrate: amount of sediment, particle velocity, size andlithology, and bed conditions. One specific set of experi-ments was also performed in the small flume with varyingbed conditions to document the effect of the impacts withimmobile pebbles. Experiment duration ranged between0.5 and 2 h in the large flume and between 1.5 and 7 h inthe small flume. At the end of each experiment, all pebblesand fragments were collected from the flume and from the0.5 mm square mesh sieve located between the flume andthe tank. The amount of abrasion was measured by sievinginto size classes and weighing all the sediment before andafter each experiment. A standard drying procedure wasapplied before any weighing; this minimized the empiricalerror due to wetness differences to <5% for both small andlarge flume experiments, as estimated from replicating theweighing procedure on the same sediment sample.[14] Abrasion rates Et and Ed are expressed in percent
mass loss per unit time and per unit traveled distance
Figure 3. Mean pebble velocity during a round trip as a function of mean water velocity in the flumes.Both small and large flume data describe a linear relationship at full motion. For low velocity and/or largeamount of sediments, data depart from the trend, because round trips include both motion and restingperiods. Particle velocities are obtained using three different methods (see text); average values (datapoints) and maximum and minimum values (tips of ‘‘error’’ bars) are shown.
F04023 ATTAL AND LAVE: EXPERIMENTAL STUDY OF PEBBLE ABRASION
5 of 22
F04023

respectively (Ed = Et/Up). Abrasion rates are calcu-lated following
Ed ¼ ln m0=mð Þ=Lt ð3Þ
(obtained by integrating equation (1) and assuming that Ed
does not vary during the experiment), where m0 = initialpebble mass and m = pebble mass after a traveled distanceLt; note that because particle mass scales with D3, it can beshown by combining equations (1) and (3) that an abrasionrate Ed corresponds to a size reduction coefficient d = Ed/3.When estimating the mass loss rate per unit traveleddistance, the error associated with the methods used todetermine pebble weight and velocity ranges between 10and 30% at high and low transport stage respectively [Attal,2003].[15] Different abrasion processes produce different types
of products [Kuenen, 1956; Kodama, 1994b]: clay, silt andsand are produced by attrition (the action of pebbles rubbingagainst each other) and crushing, while small and largefragments are produced by splitting, breaking and chipping.No quantitative definition, based for example on fragmentsize or morphology, has been proposed so far to identify theabove distinct mass loss processes. In the following, we willtherefore arbitrarily assume that the fragments produced bysplitting, chipping and breaking processes are larger thansand size, i.e., the 0.5–1 mm fraction, and are interceptedby the 0.5 mm mesh sieve. All the abrasion products thatpass through the sieve and settle down the tank at the end ofthe experiments will be considered as attrition and crushingproducts. We define the abrasion rate as the total mass lossrate including both fragments and fine products. The termattrition rate is reserved for the production rate of the finestfraction (<0.5 mm), while the term fragment productionrate refers to the production rate of fragments larger than0.5 mm.
2.4. Experiment Reproducibility
[16] To test the reproducibility of our results, severalexperiments were replicated with similar hydrodynamicconditions and sediment amounts (Figure 4). The abrasion
rates obtained for these experiments were found to beconsistent within error, with differences in abrasion ratestypically ranging between 5 and 20%. These differencesresult mostly from the variation in sediment geometry andmechanical characteristics from experiment to experiment.The same sediment was used in more than one experiment,with variable addition of ‘‘fresh’’ material. Successiveexperiments tend to further round pebbles, leading to apotential decrease in abrasion rate [Kuenen, 1956]. Inaddition, the sediment used was sampled on a natural gravelbar and was thus not perfectly homogeneous: the leastresistant pebbles are probably abraded away during succes-sive experiments, causing the remaining material to becomemore resistant and thus leading to a general decrease in totalabrasion rate. For example, four experiments were con-ducted with �34 kg of 10–20 mm pebbles and a meanpebble velocity of 1.8 m/s (Figure 4c): the first threeexperiments were carried out in a row using initially freshmaterial and produced consistent abrasion rates with arelative deviation of 8%; in contrast, the fourth experimentwas carried out using sediment that had experienced 20 runs(but including a �15% addition of fresh material) andproduced an abrasion rate 26% lower than the mean valueobtained in the first 3 experiments. Such a deviation canprobably be viewed as a maximum estimate of the variabilitythat can be expected for our experiments, as the samesediment was never used for more than 20 runs. Finally, ithas to be noted that differences between replicates werefound to increase with pebble size and velocity and with therate of fragment production.
3. Experimental Results
3.1. Amount of Sediment and Abrasion Rates
[17] The amount of sediment introduced into the flume isexpected to have a significant influence on pebble abrasionrate by controlling the frequency of impacts. Initially, oneexperiment was carried out with only six 20–40 mmpebbles (�350 g of material) to make sure that the tirefloor fulfills the condition of nonabrasivity. The pebblestraveled at a mean velocity of �2 m/s for 12 h. The pebble
Table 1. Description of the Four Sets of Experiments
Large Flume Small Flume
Set 1 Set 2 Set 3 Set 4
Tested variable grain size (well sorted material),flow and particle velocity,
amount of sediment,study of the abrasion products
lithology heterogeneityin grain size
bed condition,amount of sediment
Number of runs 50 2 2 + 3 repeat. tests 11 + 3 repeat. testsBed conditions nonabrasive nonabrasive nonabrasive variableMaterial grain size well sorted:
10–20 mm(subset 1a, 23 runs),
20–40 mm(subset 1b, 17 runs),
40–60and 60–80 mm
(subset 1c, 10 runs)
well sorted: 40–80 mm poorly sorted:individual limestone gravel
of different size(9 to 39 mm) diluted
in �400 g of 11–18 mmor 18–30 mmgranitic gravel
well sorted: 10–20 mm
Input discharge variable constant (97 l/s) constant (4 � 0.4 l/s) constant (4 � 0.4 l/s)Amount of sediment variable constant (75 kg) constant (�500–650 g) variableLithology homogeneous
(limestone)variable: 15 kg of pebbleswith varied lithologies +60 kg of granitic pebbles)
individual limestone gravel +400 g of granitic gravel
homogeneous (limestone)
F04023 ATTAL AND LAVE: EXPERIMENTAL STUDY OF PEBBLE ABRASION
6 of 22
F04023

abrasion rate did not exceed 0.08 percent mass loss perhour, i.e., less than �1/20 of the mass loss measured insimilar hydrodynamic conditions but for large amount ofsediments. This very low abrasion rate is explained by avery low probability of collision and confirms the non-abrasivity of the flume floor and walls.[18] In order to interpret the results of experiments
involving various amounts of pebbles, we introduce thequantity of sediment in terms of packing density on theflume floor. This packing density can be expressed as
p ¼ Se=Af ¼ nppD2=4Af ¼ 3Ms=2rsDAf ; ð4Þ
considering that pebbles are spheres of diameter D, withSe = the projected surface of the pebbles, Af = total area of
the flume floor (1.08 m2 for the large flume), np = numberof pebbles introduced in the flume, Ms = mass of sedimentintroduced into the flume, and rs = rock density(�2650 kg/m3 here). Depending on the packing model(square or hexagonal packing), the packing density pcp tofully cover a surface with contiguous spheres rangesbetween p/4 � pcp � p/2
ffiffiffi3p
. Using the geometric mean ofthe grain sizes for each class, the close packing massrequired to cover the floor of the large flume Msc is 21–24 kg for the 10–20 mm pebbles, 42–48 kg for the 20–40 mm pebbles, 74–85 kg for the 40–60 mm pebbles and104–119 kg for the 60–80 mm pebbles. Despite thepresence of the flume walls and the simplifying assump-tion that pebbles are spherical, the direct measurement ofthe actual masses of sediment required to roughly coverthe floor of the flume corroborates the model estimates.
Figure 4. Attrition rate as a function of the amount of sediment introduced into the flume for (a, c) 10–20 mm and (b, d) 20–40 mm pebbles. Gray zone indicates the approximate amount of sediment forwhich the floor of the flume is fully covered with pebbles (packing density is pcp; see text). In Figures 4aand 4b attrition rate is in % mass per hour; water discharge (in l/s) is indicated on data points and onextrapolated curves for constant water discharge. Discharges of 50, 70, and 90 l/s correspond to fluidinjection velocities of 2.5, 3.5, and 4.5 m/s, respectively. In Figures 4c and 4d attrition rate is in % massper km; mean pebble velocity (in m/s) is indicated on data points and on extrapolated curves for constantpebble velocity.
F04023 ATTAL AND LAVE: EXPERIMENTAL STUDY OF PEBBLE ABRASION
7 of 22
F04023
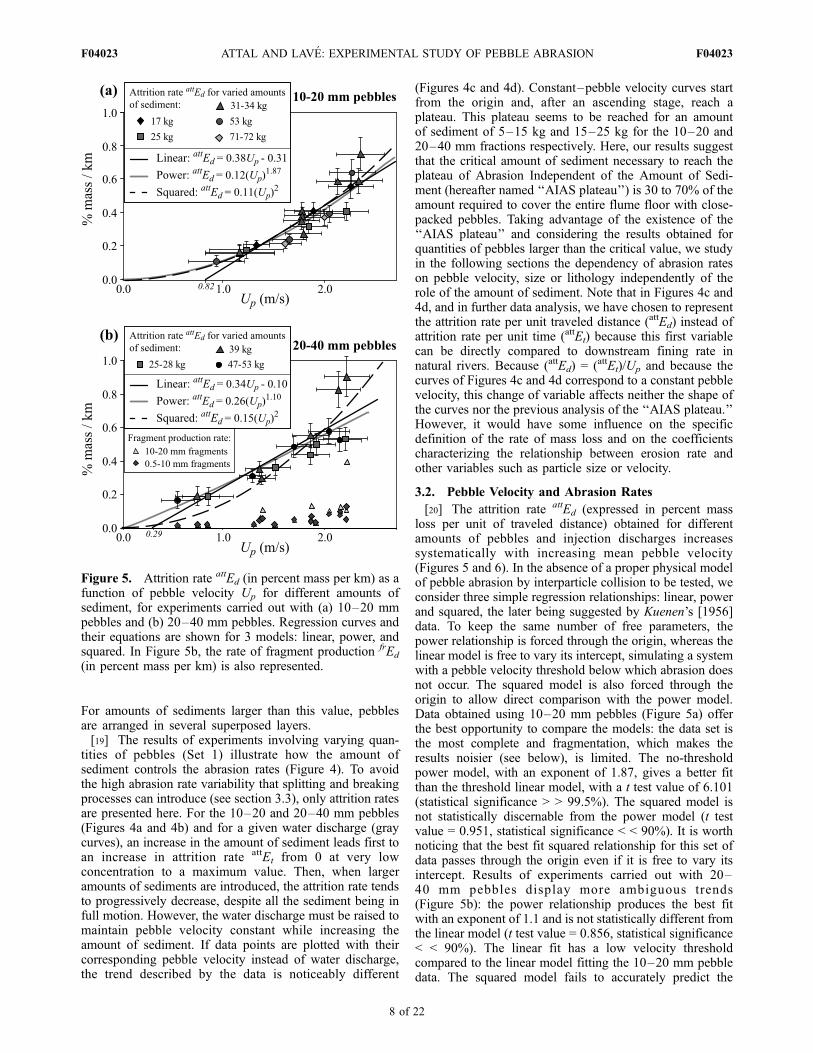
For amounts of sediments larger than this value, pebblesare arranged in several superposed layers.[19] The results of experiments involving varying quan-
tities of pebbles (Set 1) illustrate how the amount ofsediment controls the abrasion rates (Figure 4). To avoidthe high abrasion rate variability that splitting and breakingprocesses can introduce (see section 3.3), only attrition ratesare presented here. For the 10–20 and 20–40 mm pebbles(Figures 4a and 4b) and for a given water discharge (graycurves), an increase in the amount of sediment leads first toan increase in attrition rate attEt from 0 at very lowconcentration to a maximum value. Then, when largeramounts of sediments are introduced, the attrition rate tendsto progressively decrease, despite all the sediment being infull motion. However, the water discharge must be raised tomaintain pebble velocity constant while increasing theamount of sediment. If data points are plotted with theircorresponding pebble velocity instead of water discharge,the trend described by the data is noticeably different
(Figures 4c and 4d). Constant–pebble velocity curves startfrom the origin and, after an ascending stage, reach aplateau. This plateau seems to be reached for an amountof sediment of 5–15 kg and 15–25 kg for the 10–20 and20–40 mm fractions respectively. Here, our results suggestthat the critical amount of sediment necessary to reach theplateau of Abrasion Independent of the Amount of Sedi-ment (hereafter named ‘‘AIAS plateau’’) is 30 to 70% of theamount required to cover the entire flume floor with close-packed pebbles. Taking advantage of the existence of the‘‘AIAS plateau’’ and considering the results obtained forquantities of pebbles larger than the critical value, we studyin the following sections the dependency of abrasion rateson pebble velocity, size or lithology independently of therole of the amount of sediment. Note that in Figures 4c and4d, and in further data analysis, we have chosen to representthe attrition rate per unit traveled distance (attEd) instead ofattrition rate per unit time (attEt) because this first variablecan be directly compared to downstream fining rate innatural rivers. Because (attEd) = (attEt)/Up and because thecurves of Figures 4c and 4d correspond to a constant pebblevelocity, this change of variable affects neither the shape ofthe curves nor the previous analysis of the ‘‘AIAS plateau.’’However, it would have some influence on the specificdefinition of the rate of mass loss and on the coefficientscharacterizing the relationship between erosion rate andother variables such as particle size or velocity.
3.2. Pebble Velocity and Abrasion Rates
[20] The attrition rate attEd (expressed in percent massloss per unit of traveled distance) obtained for differentamounts of pebbles and injection discharges increasessystematically with increasing mean pebble velocity(Figures 5 and 6). In the absence of a proper physical modelof pebble abrasion by interparticle collision to be tested, weconsider three simple regression relationships: linear, powerand squared, the later being suggested by Kuenen’s [1956]data. To keep the same number of free parameters, thepower relationship is forced through the origin, whereas thelinear model is free to vary its intercept, simulating a systemwith a pebble velocity threshold below which abrasion doesnot occur. The squared model is also forced through theorigin to allow direct comparison with the power model.Data obtained using 10–20 mm pebbles (Figure 5a) offerthe best opportunity to compare the models: the data set isthe most complete and fragmentation, which makes theresults noisier (see below), is limited. The no-thresholdpower model, with an exponent of 1.87, gives a better fitthan the threshold linear model, with a t test value of 6.101(statistical significance > > 99.5%). The squared model isnot statistically discernable from the power model (t testvalue = 0.951, statistical significance < < 90%). It is worthnoticing that the best fit squared relationship for this set ofdata passes through the origin even if it is free to vary itsintercept. Results of experiments carried out with 20–40 mm pebbles display more ambiguous trends(Figure 5b): the power relationship produces the best fitwith an exponent of 1.1 and is not statistically different fromthe linear model (t test value = 0.856, statistical significance< < 90%). The linear fit has a low velocity thresholdcompared to the linear model fitting the 10–20 mm pebbledata. The squared model fails to accurately predict the
Figure 5. Attrition rate attEd (in percent mass per km) as afunction of pebble velocity Up for different amounts ofsediment, for experiments carried out with (a) 10–20 mmpebbles and (b) 20–40 mm pebbles. Regression curves andtheir equations are shown for 3 models: linear, power, andsquared. In Figure 5b, the rate of fragment production frEd
(in percent mass per km) is also represented.
F04023 ATTAL AND LAVE: EXPERIMENTAL STUDY OF PEBBLE ABRASION
8 of 22
F04023
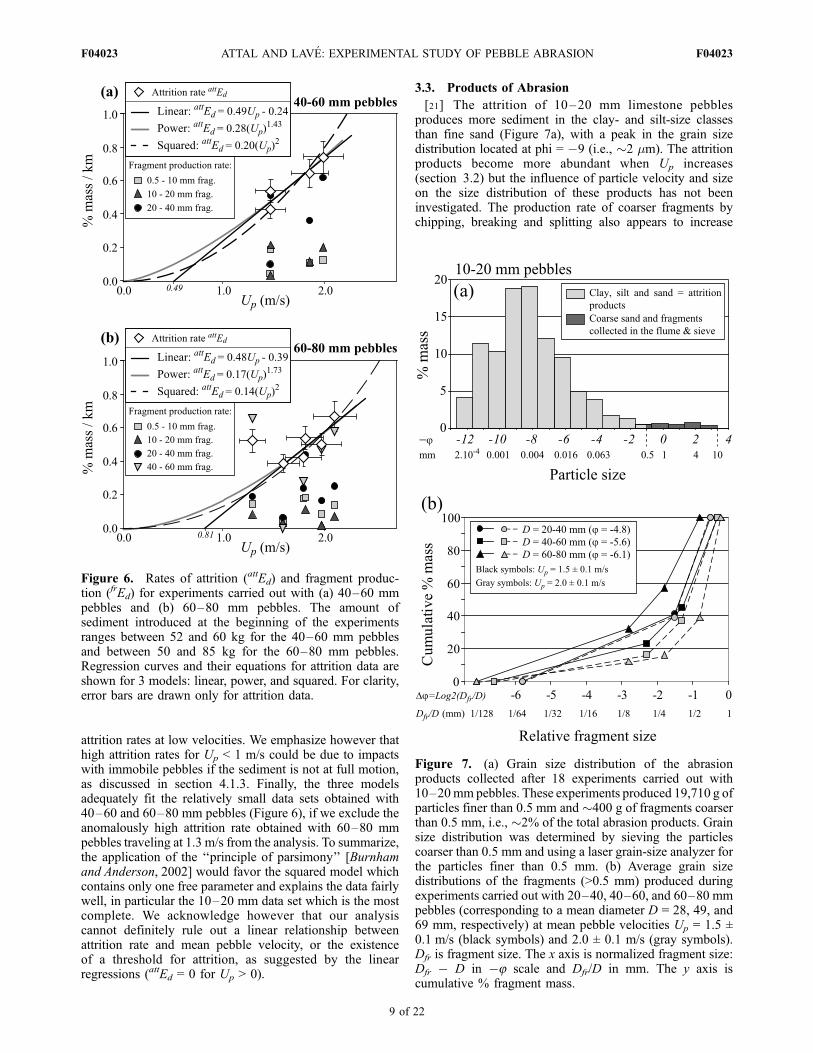
attrition rates at low velocities. We emphasize however thathigh attrition rates for Up < 1 m/s could be due to impactswith immobile pebbles if the sediment is not at full motion,as discussed in section 4.1.3. Finally, the three modelsadequately fit the relatively small data sets obtained with40–60 and 60–80 mm pebbles (Figure 6), if we exclude theanomalously high attrition rate obtained with 60–80 mmpebbles traveling at 1.3 m/s from the analysis. To summarize,the application of the ‘‘principle of parsimony’’ [Burnhamand Anderson, 2002] would favor the squared model whichcontains only one free parameter and explains the data fairlywell, in particular the 10–20 mm data set which is the mostcomplete. We acknowledge however that our analysiscannot definitely rule out a linear relationship betweenattrition rate and mean pebble velocity, or the existenceof a threshold for attrition, as suggested by the linearregressions (attEd = 0 for Up > 0).
3.3. Products of Abrasion
[21] The attrition of 10–20 mm limestone pebblesproduces more sediment in the clay- and silt-size classesthan fine sand (Figure 7a), with a peak in the grain sizedistribution located at phi = �9 (i.e., �2 mm). The attritionproducts become more abundant when Up increases(section 3.2) but the influence of particle velocity and sizeon the size distribution of these products has not beeninvestigated. The production rate of coarser fragments bychipping, breaking and splitting also appears to increase
Figure 6. Rates of attrition (attEd) and fragment produc-tion (frEd) for experiments carried out with (a) 40–60 mmpebbles and (b) 60–80 mm pebbles. The amount ofsediment introduced at the beginning of the experimentsranges between 52 and 60 kg for the 40–60 mm pebblesand between 50 and 85 kg for the 60–80 mm pebbles.Regression curves and their equations for attrition data areshown for 3 models: linear, power, and squared. For clarity,error bars are drawn only for attrition data.
Figure 7. (a) Grain size distribution of the abrasionproducts collected after 18 experiments carried out with10–20mm pebbles. These experiments produced 19,710 g ofparticles finer than 0.5 mm and �400 g of fragments coarserthan 0.5 mm, i.e., �2% of the total abrasion products. Grainsize distribution was determined by sieving the particlescoarser than 0.5 mm and using a laser grain-size analyzer forthe particles finer than 0.5 mm. (b) Average grain sizedistributions of the fragments (>0.5 mm) produced duringexperiments carried out with 20–40, 40–60, and 60–80 mmpebbles (corresponding to a mean diameter D = 28, 49, and69 mm, respectively) at mean pebble velocities Up = 1.5 ±0.1 m/s (black symbols) and 2.0 ± 0.1 m/s (gray symbols).Dfr is fragment size. The x axis is normalized fragment size:Dfr � D in �8 scale and Dfr/D in mm. The y axis iscumulative % fragment mass.
F04023 ATTAL AND LAVE: EXPERIMENTAL STUDY OF PEBBLE ABRASION
9 of 22
F04023

with increasing pebble velocity. This phenomenon is notwell shown by the experiments carried out with 10–20 mmpebbles, as fragments coarser than 0.5 mm do not representon average more than �2% of the total mass loss(Figure 7a). On the other hand, data obtained using 20–40 mm pebbles show that, despite a significant scattering,fragment production rate frEd increases with increasingpebble velocity (Figures 5b and 8a). The scattering isamplified in the experiments performed with the large40–60 mm and 60–80 mm pebbles (Figures 6 and 8a):despite using amounts of sediment large enough to makesure that the ‘‘AIAS plateau’’ was reached, abrasion ratesshow high variability for similar velocities. In addition, theorder in which the experiments were carried out seems toinfluence the relative production of fragments if the samematerial is reused: experiments with low fragment produc-tion rates are found to systematically follow experimentscarried out at high pebble velocity. As a general rule,fragments and fragmented pebbles were systematicallyproduced by experiments for which Up exceeded �1.5 m/s(Figure 8a). We qualitatively observed that splitting andbreaking are favored by the existence of weakness zoneswithin the pebbles (bedding plane, schistosity, fracture,tension gash). Moreover, we observed that anomalously highattrition rates, i.e., for which the attrition rate plots abovethe best fit curves (Figure 6), systematically correspond toexperiments characterized by high fragment production.[22] The normalization of fragment size by the initial
mean pebble size produces similar fragment size distribu-tions for all experiments carried out with pebbles largerthan 20 mm traveling at velocities in excess of 1.4 m/s(Figure 7b). For all the experiments but one, relatively largefragments are mostly produced (Figure 7b): more than 60%(in mass) of the fragments produced are larger than a thirdof the initial pebble size; fragments larger than a eight of theinitial pebble size represent 70 to 90% of the mass offragment produced.
3.4. Pebble Size and Abrasion Rates for Well-SortedMaterial
[23] Whereas a attEd = k(Up)2 relationship can reasonably
fit all our experimental data points (section 3.2), the controlthat the grain size exerts on the value of the coefficient kdoes not display obvious systematic behavior (Figures 5, 6,and 8b): the coefficient k is maximum for D = 40–60 mmbut, in any case, the variation in k is modest. The averagevalue of k is 0.17 (% mass � 10�3 s2/m3) and its standarddeviation 44% when all data are included. If we exclude thefour data points obtained at low pebble velocity in the 20–
Figure 8. (a) Fragment production rate and (b) attritionrate as a function of squared pebble velocity and sedimentgrain size for all experiments. In Figure 8b, thick graydotted line highlights roughly constant attrition rates at lowflow stage for the 20–40 mm pebbles. (c) Average rate ofmass loss by attrition and fragmentation as a function ofsediment grain size for experiments carried out with a meanpebble velocity of 2.0 m/s, within error (the number ofexperiments included in the average is indicated on top ofeach column). (d) Ratio of fragment production rate frEd
over attrition rate attEd as a function of sediment grain sizeand mean particle velocity Up for all experiments.
F04023 ATTAL AND LAVE: EXPERIMENTAL STUDY OF PEBBLE ABRASION
10 of 22
F04023

40 mm and 60–80 mm data sets that depart from theparabolic relationship (Figures 5b and 6b), the averagevalue of k is 0.15 (% mass � 10�3 s2/m3) and its standarddeviation falls to 27%. The same trend is observed whenattrition rate is represented as a function of pebble size forexperiments conducted at similar pebble velocities(Figure 8c): maximum attrition rate is obtained for D =40–60 mm but mass loss by attrition displays low variabilitydespite a fivefold variation in particle diameter. Althoughmore experiments are needed to clearly define the dependencyof attrition rate on particle diameter and extend it for a largerrange of particle size, our data show that this dependency isweak and that attrition rate is much more sensitive toparticle velocity.
[24] In contrast to attrition, fragment production stronglydepends on particle size: pebbles with D � 40 mm exhibitfragment production rates (Figures 8a and 8c) and fragment-production-rate-to-attrition-rate ratios (Figure 8d) which aremuch higher than those obtained with smaller pebbles.Pebble size exerts in that sense an unambiguous controlon the total abrasion rate by abruptly enhancing theproduction of fragments for pebbles larger than 40 mm(Figures 8a, 8c, and 8d).
3.5. Pebble Size and Abrasion Rates for PoorlySorted Material
[25] When poorly sorted material which mimics analluvium with a realistic grain size distribution is used, thecircular flume tends to produce a radial segregation of sizes.To partly avoid this problem, single pebbles of differentsizes were diluted in well-sorted material (Set 3). The effectof the difference between a pebble grain size and thematerial median grain size on pebble abrasion rate was theninvestigated. To reduce dispersion due to breaking processesand to lithologic differences between pebbles, the experi-ments were carried out in the small flume where attrition isthe dominant process, and with artificially made pebblesfrom a single homogeneous piece of limestone. Two graniticpebble mixtures with different median grain sizes were used(Figure 9a): 10–18 mm with D50 = 14 mm and 18–28 mmwith D50 = 22 mm. Individual limestone pebbles with sizesin the ranges 9–29 mm and 12–39 mm were introducedinto the 10–18 mm and 18–28 mm mixtures respectively.Despite the threefold variation in individual pebble size,pebble velocities were found to be relatively homogeneous:average velocity was 0.64 m/s for the 9–29 mm pebbles inthe 10–18 mm mixture, with a standard deviation of 3%;average velocity was 0.75 m/s for the 12–39 mm pebbles inthe 18–28 mm mixture, with a standard deviation of 7%.[26] There is a systematic decrease in abrasion rate with
increasing initial pebble diameter D (Figure 9a). This trend,which appears linear in the investigated range of pebblesize, is observed for the two pebble mixtures. A similar butless systematic trend is observed with pebbles of differentsize and lithologies that were used to investigate theabrasion dependence on lithology (section 3.7). Experi-ments (Set 2) were carried out in the large flume withpebbles from varied lithology, the size of which rangedbetween 40 and 80 mm (Figure 9b). Despite larger disper-sion due to the heterogeneity of the natural pebbles sampledon gravel bars and to the fragmentation processes which aremore effective in the large flume, the global trend observedfor almost all lithologies is a decrease in abrasion rate withincreasing pebble size, as observed in Set 3. A similarbehavior had been previously observed by Kodama[1994b]: in his experiments (see Kodama’s Figure 11), theabrasion rate of large pebbles was reduced when pebbleswere mixed with poorly sorted material instead of well-sorted material; the opposite trend was observed for smallpebbles (see Kodama’s Figure 11), whatever attrition orbreaking was the dominant process.
3.6. Influence of Bed Condition
[27] In natural rivers, moving pebbles lose mass whenthey impact other moving pebbles, but they also experiencesubstantial abrasionwhen they hit either bedrock or immobile
Figure 9. (a) Abrasion rates for individual limestonepebbles of different sizes eroded in the small flume with�400 g of 18–28 mm gravel (gray squares) and 10–18 mmgravel (black diamonds). Best linear fits are displayed withequations. Boxes at the bottom of Figure 9a indicate therange of gravel size in the 18–28 mm mixture (gray box)and 10–18 mm mixture (black box). Median grain size D50
is shown for both mixtures by inverted triangles on boxes.(b) Normalized abrasion rates for pebbles of differentlithologies abraded together in the large flume in the sameexperimental conditions. Abrasion rates are normalized bythe average abrasion rate obtained for each lithology. Forinformation, the equivalent grain diameter D is indicated initalic above the x axis.
F04023 ATTAL AND LAVE: EXPERIMENTAL STUDY OF PEBBLE ABRASION
11 of 22
F04023

pebbles. The nonabrasive bed condition in previous experi-ments was imposed in order to suppress the latter compo-nent of the abrasion and isolate a single process. However,before any transposition of our experimental results toabrasion in natural rivers, it is important to quantify thecontribution of the impacts with the floor. We thereforeglued limestone gravel (4–8 mm) to a removable floor andcarried out experiments in the small flume with differentamounts of gravel of the same size and from the same origin(Set 4). Two subsets of experiments were carried out withtwo distinct floors of equivalent roughness: a nonabrasiverubber floor and an abrasive pebbly floor (subsets 4a and 4brespectively). For a given amount of gravel, the differencein mean pebble velocity induced by the change in bedcondition is on average 5% and does not exceed 10%. Forthe first subset (4a), as is already observed in the large flume(section 3.1), abrasion rate first increases with increasingamount of sediment (Figure 10). Abrasion rate then reachesan asymptotic value close to 0.25%/km for an amount ofsediment roughly equivalent to half the amount requiredto cover the floor of the flume with close-packed pebbles(Msc � 410 g for 4–8 mm gravel in the small flume, seesection 3.1). This subset of the experiments thus confirmsthe existence of the AIAS plateau (section 3.1 andFigures 4c and 4d). The second subset of experiments(4b) shows an inverted trend (Figure 10): for reducedamount of sediment, most of the impacts are occurring withfixed pebbles on the floor and these collisions promotemuch higher abrasion rates (3.5 times higher) than the ratesassociated with impacts between moving gravel when theAIAS plateau is reached. However, when the amount ofsediment increases, the contribution of the impacts with thefloor decreases first rapidly (for amounts up to half theamount required for covering the floor with close-packedpebbles) and then more gently, leading to a progressive
convergence between the curves of subsets 4a and 4b. Whenthe amount of sediment reaches 800 g, i.e., when thesediment amount is equivalent to two layers of close-packedgravel, the abrasion rate is close to the value of 0.25%/kmobtained with the nonabrasive floor. For such an amount ofsediment, collisions between moving particles thus largelypredominate over collisions with the floor.
3.7. Pebble Lithology and Abrasion Rates
[28] To explore the lithologic control on abrasion rates,two experiments were carried out with 15 kg of 40–80 mmpebbles of various lithologies mixed with 60 kg of 40–80 mm pebbles of Alpine igneous crystalline rocks [Attaland Lave, 2006] (Set 2). Hydrodynamic conditions werechosen to be of the same order as those prevailing duringthe annual peak discharge in large mountain rivers. Injectiondischarge was set to 97 l/s, which in that case corresponds toa mean flow velocity of 2.3 m/s, a mean pebble velocity of1.2 m/s for this grain size, and an average basal shear stressof �250 N.m�2. The total sediment amount of 75 kgensured that the ‘‘AIAS plateau’’ was reached.[29] As evidenced by previous experimental studies [e.g.,
Schoklitsch, 1933; Kuenen, 1956; Bradley, 1970; Kodama,1994b; Lewin and Brewer, 2002], lithology exerts a veryimportant control on pebble abrasion rate (Figure 11). Theabrasion rate is 500 times higher for unconsolidated sand-stone (up to 50%/km) than for the strongest quartzite (0.1%/km). Soft lithologies (schist and sandstone) present ingeneral a much more important dispersion in abrasion ratesthan resistant lithologies (quartzite and granite) or moderatelyresistant lithologies (gneiss, limestone and marble). Forthese soft lithologies, our experimental abrasion rates are4 to 20 times higher than previously published rates. Incontrast, our abrasion rates were found to be only 1 to3 times larger than previous estimates for resistant lithologies(Figures 11a and 11b), if we except the highly vigorousexperiments carried out in a tumbling barrel by Kodama[1994b] (Figure 11b).[30] Detailed observation of the pebbles of various
lithologies used in our experiments brings additionalinsights into the factors that control rock resistance toabrasion. The nature and strength of the constitutiveminerals exerts a primary control on pebble abrasion rates:calcite-bearing rocks (limestone, marble) are less resistantthan quartz-bearing rocks (quartzite, granite, gneiss), whilesilicification of limestone greatly enhances its resistance toabrasion (Figure 11a). Low-strength phyllitic mineralsweaken the rocks: schists which are rich in phylliticminerals are quickly abraded. Biotite-rich and aluminousgneisses exhibit higher abrasion rates than calcic gneisseswhich contain less phyllitic minerals. In addition, phylliticminerals present a strong mechanical anisotropy: when theyare preferentially oriented within foliated rocks, the resis-tance to abrasion is further lowered, as observed forgneisses that are abraded faster than isotropic but mica-richgranites. Cohesion between minerals also plays an impor-tant role in controlling pebble abrasion rates. Sandstonediagenesis results in grain cementation and rock porosityreduction. This phenomenon increases rock resistance toabrasion: weakly cemented sandstones are abraded muchfaster than cemented ones. Finally, joints (including beddingplanes, schistosity, fractures and tension gashes) constitute
Figure 10. Abrasion rate as a function of sediment amountfor two different floor conditions (experiments were carriedout with 4–8 mm limestone gravel in the small flume). Firstsubset of experiments (4a, diamonds) was carried out with arubber floor. Second subset (4b, circles) was conducted witha floor covered with one glued layer of close-packed gravelwith the same size and lithology as the gravel transported inthe flume. Vertical shaded area corresponds to theapproximate amount of sediment for which the flume flooris fully covered with pebbles.
F04023 ATTAL AND LAVE: EXPERIMENTAL STUDY OF PEBBLE ABRASION
12 of 22
F04023

weakness zones which can favor abrasion (section 3.3). Inschists and mica schists, the combination of schistosityplanes and high content of phyllitic minerals promotes highabrasion rates and pebble splitting. The important point isthat lithology controls not only abrasion rates but alsoabrasion processes [see also Kodama, 1994b].
[31] Pebble abrasion rates are also expected to depend onthe lithology of the pebbles with which they are mixed. Fivepebbles of the fine-grained limestone which has been usedin the Set 1 experiments were introduced in the multi-lithology Set 2 experiments. Mixed with a majority ofigneous pebbles, the limestone pebbles were abraded at arate of 1.15 ± 0.4%/km, i.e., 2 to 3 times faster than if theyhad been mixed with other limestone pebbles in the sameconditions (for similar amount of sediment, grain size andparticle velocity, attEd � 0.3–0.4%/km and Ed � 0.5%/km).Impacts with more resistant lithologies therefore significantlyenhance abrasion efficiency. Sklar and Dietrich [2001]similarly documented a threefold increase in their experi-mental bedrock abrasion rates when limestone bedrock wasabraded by quartzite pebbles rather than by limestonepebbles. The experimental pebble abrasion rates presentedin Figure 11a have therefore to be considered within theframework of our experiments, i.e., valid for pebblesmixed with resistant igneous rocks. However, becauseresistant pebbles are predominant in mountain rivers[e.g., Attal and Lave, 2006], we believe that our experi-mental abrasion rates would be valid in many naturalsettings.
4. Discussion
4.1. Sensitivity of Abrasion Rates and Processesto the Controlling Variables4.1.1. Products of Abrasion
[32] Observations with the high speed camera suggestthat collision is the dominant type of contact betweenparticles during our experiments. We therefore infer thatmost of the abrasion results from dynamic impacts betweenparticles with nonnegligible relative velocities. Thesedynamic contacts produce two populations of abrasionproducts for our limestone pebbles (section 3.3): largefragments and very small ones, with a gap in the 0.5–10 mm fraction (Figures 5b, 6, and 7). Such gap justifies aposteriori our choice of a cutoff at 0.5 mm to separate theproducts of fragmentation and attrition, that might relate totwo distinct brittle deformation processes: the activation oflarge planes of rupture at the scale of the pebble (leading tothe detachment of large fragments) and the coalescence ofmicrofractures at the scale of the contact zone, respectively.Abrasion by attrition is dominant at low velocity and forsmall particles (<40 mm in the case of limestone), whereasfragmentation becomes dominant for large pebbles trans-ported at high velocity (section 3.3, 3.4 and Figure 8).However, experiments involving varied pebble sizes andvelocities produced similar normalized fragment sizedistributions (Figure 7b), suggesting that the mechanics ofthe fragmentation process are relatively independent ofthese two variables.[33] If the influence of the controlling factors on attrition
rate can be investigated and discussed in the following, theinfluence of these factors on the rate of fragment productionis however difficult to establish because fragment produc-tion shows high variability in our experiments (Figure 8a).Because of the stochastic behavior of the chipping, breakingand splitting processes, more experiments would berequired to produce meaningful trends. In addition, ourresults are probably biased by the use of the same pebbles
Figure 11. Influence of lithology on abrasion rates.(a) Summary of our experiments carried out with 15 kg ofpebbles of different lithologies mixed with 60 kg of 40–80 mm igneous crystalline pebbles; water discharge was97 l/s [Attal and Lave, 2006]. Star represents mean abrasionrate for 5 Buech limestone pebbles that were included in thisset of experiments. (b) Compilation of previously publishedexperimental abrasion rates for similar groups of lithologies[Schoklitsch, 1933; Bullows, 1939; Krumbein, 1941;Kuenen, 1956; Bradley, 1970; Adams, 1978; Mikos, 1994;Kodama, 1994b; Jones and Humphrey, 1997; Lewin andBrewer, 2002]. Size and mass diminution coefficients havebeen converted to abrasion rates (in % mass loss/km). Lightgray boxes are flume data, and dark gray boxes are tumblingbarrel data. Light-colored dashed boxes correspond to dataobtained in experiments carried out with angular clasts, withweathered clasts or in Kodama’s [1994b] vigorous ERCtumbling barrel (with impact velocities up to 2 m/s).Asterisks: ‘‘Granite’’ and ‘‘Volcanics’’ include differenttypes of intrusive and extrusive igneous rocks, respectively;‘‘Quartzite’’ includes different types of siliceous rocks:quartzite, flint, chert, agate, radiolarite, and obsidian.
F04023 ATTAL AND LAVE: EXPERIMENTAL STUDY OF PEBBLE ABRASION
13 of 22
F04023

for successive experiments, since fragmentation depends onthe initial state of the pebbles. For example, experimentswith low fragment production rates are found to systematicallyfollow experiments carried out at high velocity (section 3.3):if splitting is favored by high energy impacts, the number ofweakness zones in pebbles might dramatically decreaseduring high velocity experiments, possibly reducing theeffectiveness of the splitting and breaking processes in thefollowing experiment conducted at lower pebble velocity.[34] Finally, it has to be noted that our results are valid for
rounded particles. The abrasion rate of angular clasts hasbeen found to be up to 5 times higher than the abrasion rateof similar rounded pebbles, due to the preferential abrasionof corners and edges, mostly by chipping [Kuenen, 1956;Lewin and Brewer, 2002]. However, it has been shown thatthe rounding of corners and edges is rapid and that suchhigh abrasion rates due to the high angularity of clasts arelimited to the first few kilometers of transport along rivers[e.g., Krumbein, 1941; Kuenen, 1956]. For that reason, anddespite most particles delivered by hillslopes to the fluvialnetwork being angular, we will neglect in the following thisphenomenon affecting pebbles as they begin their journeyalong the river.4.1.2. Influence of Lithology on Abrasion Ratesand Processes[35] As already emphasized in previous studies, lithology
exerts the most important control on pebble abrasion ratesand processes [Schoklitsch, 1933; Kuenen, 1956; Bradley,1970; Kodama, 1994b; Lewin and Brewer, 2002]: theweakest lithology tested in our experiments is abraded500 times faster than the strongest one (section 3.7). Wealso observe that fragment production rate is highly lithologydependent [Kodama, 1994b]: fragmentation is limited inresistant and compact lithologies but is the dominantabrasion process in jointed rocks. Because our experimentalflume reproduces breaking and chipping processes at highimpact velocities more efficiently than the tumbling barrelswhich were often used in previous studies, our experimentalabrasion rates are consistent with or slightly higher thanpreviously published abrasion rates for resistant and com-pact lithologies (e.g., quartzite, granite, limestone) but areup to an order of magnitude higher than published abrasionrates for weak or jointed rocks (mostly sandstone and schist;Figures 11a and 11b). Future steps in this research willinvolve linking these variations in attrition and fragmenta-tion production rates to the mechanical properties of therocks, such as tensile strength [Sklar and Dietrich, 2001] orjoint spacing.4.1.3. Amount of Sediment, Pebble Velocity,Bed Condition, and Transport Stage[36] The existence of the AIAS plateau suggests that the
frequency of collision between moving pebbles increasescontinuously with increasing amount of sediment untilreaching a plateau for around half the amount of sedimentnecessary to cover the flume floor with close-packedpebbles (Figures 4 and 10). Therefore, if the sediment isnot at full motion and the amount of sediment in motion islower than this critical amount, collisions with restingpebbles can no longer be neglected. In our experiments, itwas observed on the high-speed camera movies that fullmotion of one layer of pebbles occurs at mean pebblevelocities of �1.5, �1.2 and �1.0 m/s for the 60–80 mm,
20–40 mm, and 10–20 mm pebbles respectively. For the20–40 mm pebbles, we indeed observe that below thiscritical velocity (Up � 1.2 m/s), attrition rates are higherthan what the regression relationships would predict, inparticular the relation attEd = k(Up)
2 which fits the data fairlywell (section 3.2 and Figures 5 and 8). This is what wouldbe expected if a large proportion of the moving pebbleswere impacting immobile particles. Below this threshold,attrition rate seems to become roughly constant (Figures 5and 8b). We thus hypothesize that pebble attrition rate inchannel beds made of loose sediments is proportional to(Up)
2 at transport stages above full motion of a gravel layerbut becomes approximately constant at low flow stage, dueto infrequent pebble motions and high mass loss whenmoving pebbles impact immobile pebbles. Future additionalexperiments near incipient pebble motion, using a modifiedflume to reduce the large radial velocity gradient observedat low pump discharge (e.g., including additional flowinjections along the internal wall of the flume [Lewin andBrewer, 2002]) are however required to better documentsuch a trend.[37] In our experiments, we analyzed independently the
influence of the amount of sediment, pebble size, pebblevelocity and bed condition on pebble abrasion rates. Innatural rivers, these variables are intimately linked: theydepend on the transport stage, i.e., the ratio t*/t*c, wheret* and t*c are the dimensionless Shields stress and criticalShields stress for particle entrainment, respectively. Forsaltating particles, mean hop velocity appears to dependon t*/t*c and on the grain size D, according to thefollowing relation [Sklar and Dietrich, 2004]:
up /ffiffiffiffiffiffiffiffiffiffiffiffiffiffiffirs � rw
rw
r ffiffiffiffiDp t*
tc*� 1
� �0:5
; ð5Þ
where rs and rw are the density of the sediment and waterrespectively. According to our experimental results (Sets 1and 4), at high flow stage, i.e., at full pebble motion, mostcollisions occur between moving pebbles and Up � up. Onthe basis of the apparent relation between attrition rate and(Up)
2, we propose that
attEd / D t*=tc*� 1ð Þ ð6Þ
at full motion (Figure 12). For lower values of transportstage, as stated above from a reduced set of experimentswith 20–40 mm pebbles, we hypothesize that attrition rateincreasingly departs from the linear trend in equation (6)when approaching incipient pebble motion (t*/t*c = 1) andwould tend to be roughly constant at low transport stage dueto dominant impacts with immobile pebbles and increasednumber of impacts per unit length (Figure 12). In ourexperiments, it was found that incipient full motion of onelayer, i.e., the threshold between the constant and lineardomains in Figure 12, occurs at transport stage of t*/t*c �3.3 ± 0.3, independently of the grain size.4.1.4. Influence of Pebble Size on Abrasion Ratesand Processes[38] In our experiments, pebble size was found to be the
least determinant parameter on pebble attrition rate whenwell sorted material was used (section 3.4). However,
F04023 ATTAL AND LAVE: EXPERIMENTAL STUDY OF PEBBLE ABRASION
14 of 22
F04023
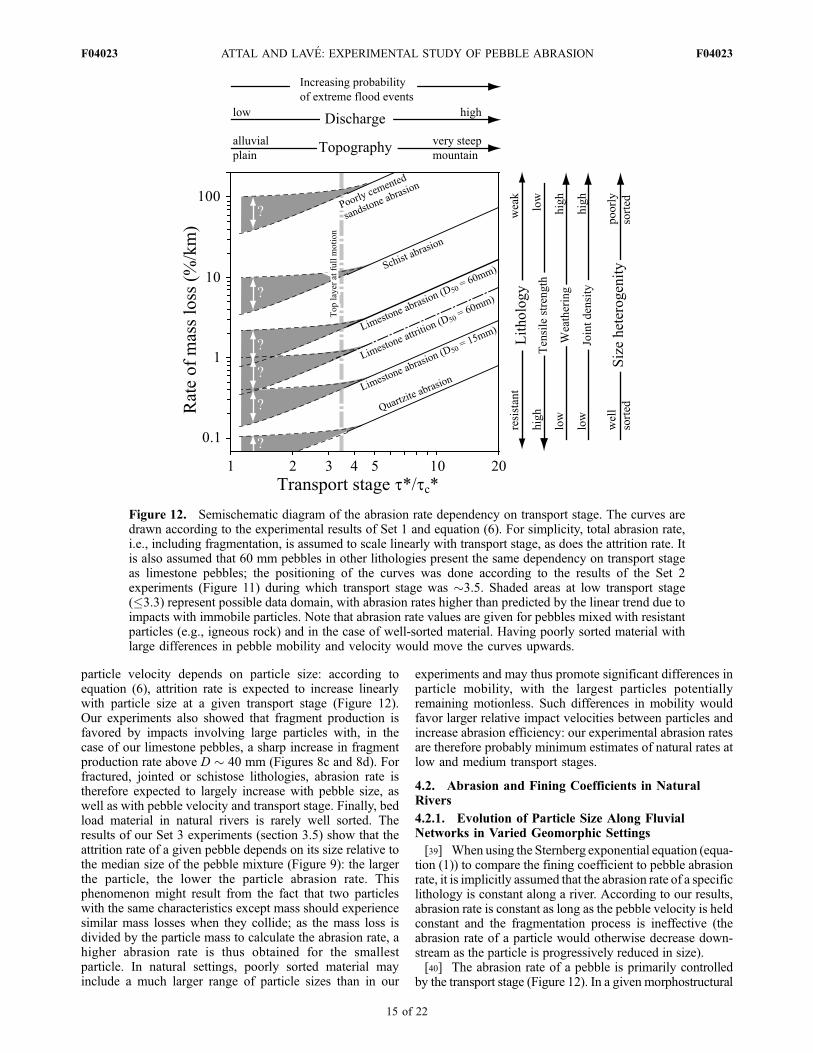
particle velocity depends on particle size: according toequation (6), attrition rate is expected to increase linearlywith particle size at a given transport stage (Figure 12).Our experiments also showed that fragment production isfavored by impacts involving large particles with, in thecase of our limestone pebbles, a sharp increase in fragmentproduction rate above D � 40 mm (Figures 8c and 8d). Forfractured, jointed or schistose lithologies, abrasion rate istherefore expected to largely increase with pebble size, aswell as with pebble velocity and transport stage. Finally, bedload material in natural rivers is rarely well sorted. Theresults of our Set 3 experiments (section 3.5) show that theattrition rate of a given pebble depends on its size relative tothe median size of the pebble mixture (Figure 9): the largerthe particle, the lower the particle abrasion rate. Thisphenomenon might result from the fact that two particleswith the same characteristics except mass should experiencesimilar mass losses when they collide; as the mass loss isdivided by the particle mass to calculate the abrasion rate, ahigher abrasion rate is thus obtained for the smallestparticle. In natural settings, poorly sorted material mayinclude a much larger range of particle sizes than in our
experiments and may thus promote significant differences inparticle mobility, with the largest particles potentiallyremaining motionless. Such differences in mobility wouldfavor larger relative impact velocities between particles andincrease abrasion efficiency: our experimental abrasion ratesare therefore probably minimum estimates of natural rates atlow and medium transport stages.
4.2. Abrasion and Fining Coefficients in NaturalRivers
4.2.1. Evolution of Particle Size Along FluvialNetworks in Varied Geomorphic Settings
[39] When using the Sternberg exponential equation (equa-tion (1)) to compare the fining coefficient to pebble abrasionrate, it is implicitly assumed that the abrasion rate of a specificlithology is constant along a river. According to our results,abrasion rate is constant as long as the pebble velocity is heldconstant and the fragmentation process is ineffective (theabrasion rate of a particle would otherwise decrease down-stream as the particle is progressively reduced in size).[40] The abrasion rate of a pebble is primarily controlled
by the transport stage (Figure 12). In a given morphostructural
Figure 12. Semischematic diagram of the abrasion rate dependency on transport stage. The curves aredrawn according to the experimental results of Set 1 and equation (6). For simplicity, total abrasion rate,i.e., including fragmentation, is assumed to scale linearly with transport stage, as does the attrition rate. Itis also assumed that 60 mm pebbles in other lithologies present the same dependency on transport stageas limestone pebbles; the positioning of the curves was done according to the results of the Set 2experiments (Figure 11) during which transport stage was �3.5. Shaded areas at low transport stage(�3.3) represent possible data domain, with abrasion rates higher than predicted by the linear trend due toimpacts with immobile particles. Note that abrasion rate values are given for pebbles mixed with resistantparticles (e.g., igneous rock) and in the case of well-sorted material. Having poorly sorted material withlarge differences in pebble mobility and velocity would move the curves upwards.
F04023 ATTAL AND LAVE: EXPERIMENTAL STUDY OF PEBBLE ABRASION
15 of 22
F04023

setting (e.g., sedimentary basin, mountainous area), the riverconcavity index q which is the exponent in the relationship
S / A�q (where S is river slope and A is drainage area) isgenerally invariable. In mountainous areas, q is typicallyclose to 0.5 [e.g., Sklar and Dietrich, 1998]. Assuming thatriver geometry obeys typical hydraulic scaling laws, i.e.,channel width scales with the square root of drainage area[e.g., Leopold and Maddock, 1953; Montgomery and Gran,2001] and width-to-depth ratio is approximately constantalong the river [e.g., Leopold and Maddock, 1953;Finnegan et al., 2005], it can be shown that fluvial shearstress and thus mean pebble velocity are roughly constantalong the river (note that these two assumptions have beenshown to not apply in various mountainous settings, inparticular in transient landscapes [e.g., Whittaker et al.,2007]). On the basis of the assumptions above, abrasionrate can thus be considered constant in first approximationin a given morphostructural setting, except for lithologiesprone to breaking in highly dynamic environments: in sucha case, a sharp decrease in abrasion rate would be expectedwhen a particle’s size is reduced below the size over whichfragmentation is dominant (section 4.1.4). However, abra-sion rate is expected to vary according to the setting: forexample, the abrasion rate of a pebble which traveled in asteep mountain river probably decreased significantly whenthe pebble arrived in a foreland basin characterized by muchlower transport stages.[41] In alluvial plain settings, rivers are characterized by
shallow slopes and the transport stage during sedimenttransport and channel form adjustment is believed to beclose to 1.5 [e.g., Ikeda et al., 1988]. In such rivers, theopposing effects of low pebble velocity and dominantimpacts between moving particles and immobile ones areexpected to produce abrasion rates higher than the relationattEd = k(Up)
2 would predict (Figure 12). However, becauseof the low particle velocity, pebbles would be reducedmostly by attrition rather than by fragmentation.[42] In contrast, abrasion rates are maximized in rivers
flowing across active mountains like the Central Range ofTaiwan or the Himalayas, particularly if pebble lithologiesare prone to breaking and splitting. In such rivers charac-terized by steep slopes, high pebble velocities would pro-mote high rates of attrition and fragment production [e.g.,Attal and Lave, 2006]. In the case of our 40–80 mmlimestone pebbles, attrition and abrasion rates could be ashigh as 4%/km and 10%/km respectively at transport stageof �10–15 (Figure 12). These rates are minimum estimates,given that high fragment production rates would in turnenhance all pebble abrasion processes since angular frag-ments can be up to five times more erodible than roundedfragments [Kuenen, 1956]. In addition, the range of grainsizes in such rivers is usually wide and includes bouldersthat remain motionless during most of the floods. In thiscase, impacts between moving pebbles and immobileboulders would lead to high abrasion rates, as emphasizedby the results of the subset 4b experiments with low amountof sediment and pebbles glued on the floor of the flume(section 3.6 and Figure 10).[43] Finally, it is to be noted that, because pebble abrasion
rate depends on the transport stage, it will vary with floodintensity (Figure 12). Estimating pebble abrasion rate duringfluvial transport therefore requires averaging its value over
the whole flood distribution. Abrasion rate will depend onclimate regime in a nonlinear fashion, where the preciserelation is determined by the interplay of the thresholddischarge for sediment transport and the magnitude-frequency distribution of floods.4.2.2. Evolution of Sediment Load CharacteristicsAlong Fluvial Networks and Implicationsfor Downstream Fining in Natural Rivers[44] Along natural streams, several studies have focused
on sediment transport and dispersion using tracers [e.g.,Ferguson et al., 1996]. But, to our knowledge, none hasfocused on the abrasion of these pebbles during theirtransport. In fact, most studies on abrasion along naturalrivers rely on the downstream evolution of the median grainsize in surface or subsurface of exposed gravel bars.However, is a direct comparison of experimental abrasionrates and downstream fining coefficients pertinent?[45] A few authors have emphasized that abrasion rates
and fining coefficients can be directly compared only whenthe sediment source is a point source localized in theheadwater of a catchment [e.g., Bradley, 1970; Fergusonet al., 1996; Heller et al., 2001]. In that case, the spatialfining along the river will reflect the fining by abrasion ofeach pebble during its journey along the river. If there is nosignificant downstream variation in flow stage or in thefragmentation-to-attrition ratio, these regional fining ratioswill follow Sternberg’s exponential relation (equation (1)),with the fining coefficient d being equal to Ed/3 (seeequation (3)). It has to be noted, however, that such anend-member requires specific conditions, in particular along river reach without active erosion or deposition(neutral bypass). This is probably the case of the Red DeerRiver (Alberta) [Shaw and Kellerhals, 1982] which origi-nates in the Canadian Rocky mountains and then drainsthrough a plain in which it is incised by 20 to 100 m. Thisembankment situation prevents major deposition or lateralinput of coarse sediment. The median grain size of thesediment is similar to those used in our experiments (10 to60 mm) [Shaw and Kellerhals, 1982] and the transport stageis �2 at Red Deer for the 100 year flood (Q = 1900 m3/s)[Alberta Infrastructure and Transportation, 2007]. Thefining rate values of d = 0.1 to 0.2%/km measured alongthe river [Shaw and Kellerhals, 1982] are consistent with ourexperimental size reduction rates (=Ed/3) of the dominantlithologies, i.e., 0.03–0.07, �0.1–0.2 and �0.2–0.4%/kmfor quartzite, granite and limestone pebbles respectively(Figures 11 and 12).[46] However, in many alluvial settings, streams drain
aggradational areas: efficient selective sorting can take placethere [Brierley and Hickin, 1985; Brewer and Lewin, 1993;Ferguson et al., 1996; Surian, 2002; Constantine et al.,2003] and the fining trend will no longer reflect abrasionprocesses alone. In such aggrading settings, size reductionrates frequently exceed 3%/km (which corresponds to a sizereduction by a factor of �2 after 20 km) [e.g., Surian, 2002]and abrasion would therefore be responsible for a signifi-cant part of the downstream fining only along rivers drain-ing lithologies with abrasion rates in excess of 9%/km: suchrates correspond to poorly resistant lithologies like poorlycemented sandstone, easily fragmented schists (Figure 12)or weathered pebbles in low gradient rivers characterized by
F04023 ATTAL AND LAVE: EXPERIMENTAL STUDY OF PEBBLE ABRASION
16 of 22
F04023
long periods of sediment storage [Bradley, 1970; Jones andHumphrey, 1997].[47] Conversely, if there is any significant sediment input
along the stream, addition of fresh material will also alterthe fining trend [Knighton, 1982; Parker, 1991; Heller etal., 2001; Attal and Lave, 2006; Sklar et al., 2006]. Attaland Lave [2006] showed for example that in the case of a
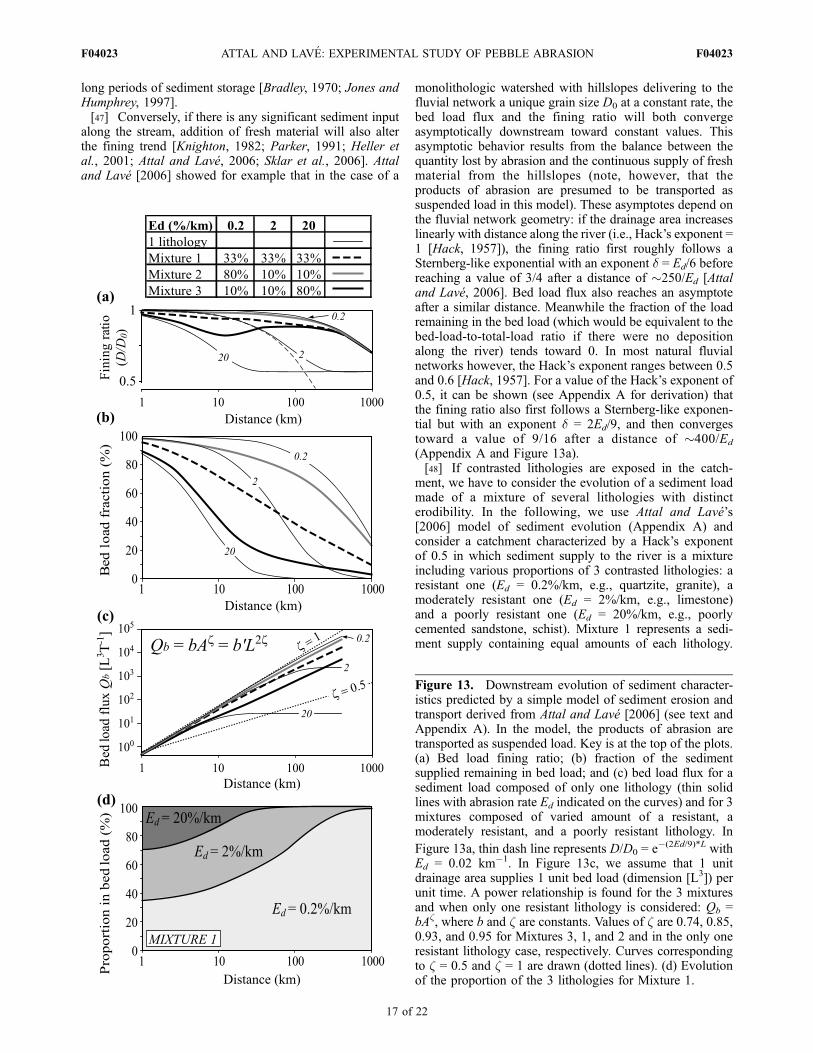
monolithologic watershed with hillslopes delivering to thefluvial network a unique grain size D0 at a constant rate, thebed load flux and the fining ratio will both convergeasymptotically downstream toward constant values. Thisasymptotic behavior results from the balance between thequantity lost by abrasion and the continuous supply of freshmaterial from the hillslopes (note, however, that theproducts of abrasion are presumed to be transported assuspended load in this model). These asymptotes depend onthe fluvial network geometry: if the drainage area increaseslinearly with distance along the river (i.e., Hack’s exponent =1 [Hack, 1957]), the fining ratio first roughly follows aSternberg-like exponential with an exponent d = Ed/6 beforereaching a value of 3/4 after a distance of �250/Ed [Attaland Lave, 2006]. Bed load flux also reaches an asymptoteafter a similar distance. Meanwhile the fraction of the loadremaining in the bed load (which would be equivalent to thebed-load-to-total-load ratio if there were no depositionalong the river) tends toward 0. In most natural fluvialnetworks however, the Hack’s exponent ranges between 0.5and 0.6 [Hack, 1957]. For a value of the Hack’s exponent of0.5, it can be shown (see Appendix A for derivation) thatthe fining ratio also first follows a Sternberg-like exponen-tial but with an exponent d = 2Ed/9, and then convergestoward a value of 9/16 after a distance of �400/Ed
(Appendix A and Figure 13a).[48] If contrasted lithologies are exposed in the catch-
ment, we have to consider the evolution of a sediment loadmade of a mixture of several lithologies with distincterodibility. In the following, we use Attal and Lave’s[2006] model of sediment evolution (Appendix A) andconsider a catchment characterized by a Hack’s exponentof 0.5 in which sediment supply to the river is a mixtureincluding various proportions of 3 contrasted lithologies: aresistant one (Ed = 0.2%/km, e.g., quartzite, granite), amoderately resistant one (Ed = 2%/km, e.g., limestone)and a poorly resistant one (Ed = 20%/km, e.g., poorlycemented sandstone, schist). Mixture 1 represents a sedi-ment supply containing equal amounts of each lithology.
Figure 13. Downstream evolution of sediment character-istics predicted by a simple model of sediment erosion andtransport derived from Attal and Lave [2006] (see text andAppendix A). In the model, the products of abrasion aretransported as suspended load. Key is at the top of the plots.(a) Bed load fining ratio; (b) fraction of the sedimentsupplied remaining in bed load; and (c) bed load flux for asediment load composed of only one lithology (thin solidlines with abrasion rate Ed indicated on the curves) and for 3mixtures composed of varied amount of a resistant, amoderately resistant, and a poorly resistant lithology. In
Figure 13a, thin dash line represents D/D0 = e�(2Ed/9)*L withEd = 0.02 km�1. In Figure 13c, we assume that 1 unitdrainage area supplies 1 unit bed load (dimension [L3]) perunit time. A power relationship is found for the 3 mixturesand when only one resistant lithology is considered: Qb =bAz, where b and z are constants. Values of z are 0.74, 0.85,0.93, and 0.95 for Mixtures 3, 1, and 2 and in the only oneresistant lithology case, respectively. Curves correspondingto z = 0.5 and z = 1 are drawn (dotted lines). (d) Evolutionof the proportion of the 3 lithologies for Mixture 1.
F04023 ATTAL AND LAVE: EXPERIMENTAL STUDY OF PEBBLE ABRASION
17 of 22
F04023
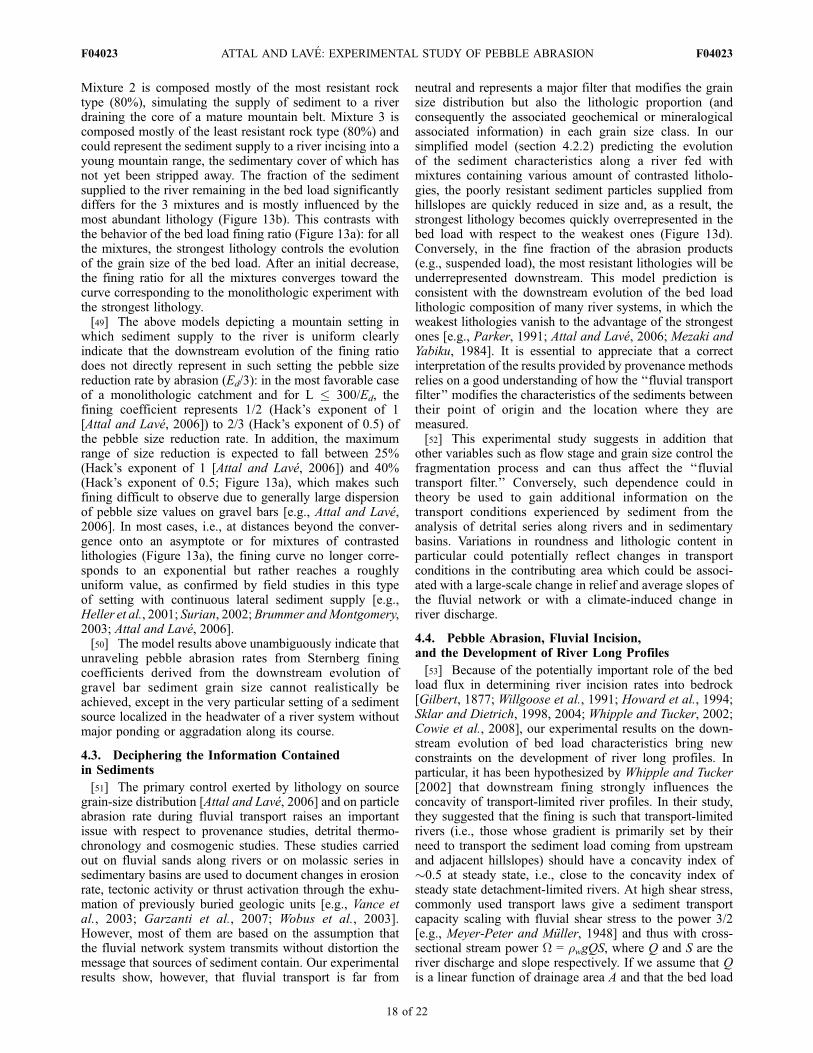
Mixture 2 is composed mostly of the most resistant rocktype (80%), simulating the supply of sediment to a riverdraining the core of a mature mountain belt. Mixture 3 iscomposed mostly of the least resistant rock type (80%) andcould represent the sediment supply to a river incising into ayoung mountain range, the sedimentary cover of which hasnot yet been stripped away. The fraction of the sedimentsupplied to the river remaining in the bed load significantlydiffers for the 3 mixtures and is mostly influenced by themost abundant lithology (Figure 13b). This contrasts withthe behavior of the bed load fining ratio (Figure 13a): for allthe mixtures, the strongest lithology controls the evolutionof the grain size of the bed load. After an initial decrease,the fining ratio for all the mixtures converges toward thecurve corresponding to the monolithologic experiment withthe strongest lithology.[49] The above models depicting a mountain setting in
which sediment supply to the river is uniform clearlyindicate that the downstream evolution of the fining ratiodoes not directly represent in such setting the pebble sizereduction rate by abrasion (Ed/3): in the most favorable caseof a monolithologic catchment and for L � 300/Ed, thefining coefficient represents 1/2 (Hack’s exponent of 1[Attal and Lave, 2006]) to 2/3 (Hack’s exponent of 0.5) ofthe pebble size reduction rate. In addition, the maximumrange of size reduction is expected to fall between 25%(Hack’s exponent of 1 [Attal and Lave, 2006]) and 40%(Hack’s exponent of 0.5; Figure 13a), which makes suchfining difficult to observe due to generally large dispersionof pebble size values on gravel bars [e.g., Attal and Lave,2006]. In most cases, i.e., at distances beyond the conver-gence onto an asymptote or for mixtures of contrastedlithologies (Figure 13a), the fining curve no longer corre-sponds to an exponential but rather reaches a roughlyuniform value, as confirmed by field studies in this typeof setting with continuous lateral sediment supply [e.g.,Heller et al., 2001; Surian, 2002; Brummer andMontgomery,2003; Attal and Lave, 2006].[50] The model results above unambiguously indicate that
unraveling pebble abrasion rates from Sternberg finingcoefficients derived from the downstream evolution ofgravel bar sediment grain size cannot realistically beachieved, except in the very particular setting of a sedimentsource localized in the headwater of a river system withoutmajor ponding or aggradation along its course.
4.3. Deciphering the Information Containedin Sediments
[51] The primary control exerted by lithology on sourcegrain-size distribution [Attal and Lave, 2006] and on particleabrasion rate during fluvial transport raises an importantissue with respect to provenance studies, detrital thermo-chronology and cosmogenic studies. These studies carriedout on fluvial sands along rivers or on molassic series insedimentary basins are used to document changes in erosionrate, tectonic activity or thrust activation through the exhu-mation of previously buried geologic units [e.g., Vance etal., 2003; Garzanti et al., 2007; Wobus et al., 2003].However, most of them are based on the assumption thatthe fluvial network system transmits without distortion themessage that sources of sediment contain. Our experimentalresults show, however, that fluvial transport is far from
neutral and represents a major filter that modifies the grainsize distribution but also the lithologic proportion (andconsequently the associated geochemical or mineralogicalassociated information) in each grain size class. In oursimplified model (section 4.2.2) predicting the evolutionof the sediment characteristics along a river fed withmixtures containing various amount of contrasted litholo-gies, the poorly resistant sediment particles supplied fromhillslopes are quickly reduced in size and, as a result, thestrongest lithology becomes quickly overrepresented in thebed load with respect to the weakest ones (Figure 13d).Conversely, in the fine fraction of the abrasion products(e.g., suspended load), the most resistant lithologies will beunderrepresented downstream. This model prediction isconsistent with the downstream evolution of the bed loadlithologic composition of many river systems, in which theweakest lithologies vanish to the advantage of the strongestones [e.g., Parker, 1991; Attal and Lave, 2006; Mezaki andYabiku, 1984]. It is essential to appreciate that a correctinterpretation of the results provided by provenance methodsrelies on a good understanding of how the ‘‘fluvial transportfilter’’ modifies the characteristics of the sediments betweentheir point of origin and the location where they aremeasured.[52] This experimental study suggests in addition that
other variables such as flow stage and grain size control thefragmentation process and can thus affect the ‘‘fluvialtransport filter.’’ Conversely, such dependence could intheory be used to gain additional information on thetransport conditions experienced by sediment from theanalysis of detrital series along rivers and in sedimentarybasins. Variations in roundness and lithologic content inparticular could potentially reflect changes in transportconditions in the contributing area which could be associ-ated with a large-scale change in relief and average slopes ofthe fluvial network or with a climate-induced change inriver discharge.
4.4. Pebble Abrasion, Fluvial Incision,and the Development of River Long Profiles
[53] Because of the potentially important role of the bedload flux in determining river incision rates into bedrock[Gilbert, 1877; Willgoose et al., 1991; Howard et al., 1994;Sklar and Dietrich, 1998, 2004; Whipple and Tucker, 2002;Cowie et al., 2008], our experimental results on the down-stream evolution of bed load characteristics bring newconstraints on the development of river long profiles. Inparticular, it has been hypothesized by Whipple and Tucker[2002] that downstream fining strongly influences theconcavity of transport-limited river profiles. In their study,they suggested that the fining is such that transport-limitedrivers (i.e., those whose gradient is primarily set by theirneed to transport the sediment load coming from upstreamand adjacent hillslopes) should have a concavity index of�0.5 at steady state, i.e., close to the concavity index ofsteady state detachment-limited rivers. At high shear stress,commonly used transport laws give a sediment transportcapacity scaling with fluvial shear stress to the power 3/2[e.g., Meyer-Peter and Muller, 1948] and thus with cross-sectional stream power W = rwgQS, where Q and S are theriver discharge and slope respectively. If we assume that Qis a linear function of drainage area A and that the bed load
F04023 ATTAL AND LAVE: EXPERIMENTAL STUDY OF PEBBLE ABRASION
18 of 22
F04023

flux Qb scales as a power law of drainage area (Qb / Az),the concavity index of transport limited rivers is (1-z). Anexponent z � 0.5 would thus be required to produce alandscape eroded uniformly by transport-limited rivers witha concavity index of �0.5.[54] In a uniformly eroding landscape, bed load flux
increases linearly with A in the absence of pebble abrasion,and thus z = 1. To consider the role of abrasion on thedownstream evolution of the bed load flux Qb, let usconsider the end-member examples presented in section4.2.2 of a fluvial network incising into a landscape at auniform rate (Appendix A and Figure 13). If pebbles areabraded at a constant rate along the fluvial network and inthe case of monolithologic watersheds, the bed load fluxconverges asymptotically toward a value which is a functionof the abrasion rate after a distance of �250/Ed (Figure 13c);the bed load fining ratio also reaches an asymptotic valueafter the same distance (Figure 13a). For poorly resistantlithologies, the downstream evolution of the bed load fluxcannot be approximated by a power law (Figure 13c):beyond the point where the asymptotic value is reached,the bed load flux is constant. For the most resistantlithologies, because river lengths across actively erodedmountains rarely exceed 400 km, the asymptotic value isnever reached (Figure 13c). In this case, the relationshipbetween the bed load flux and drainage area can beapproximated by a power law, but with an exponent closeto 1. The importance of the most resistant lithology on theevolution of the bed load characteristics is emphasizedwhen considering a mixture of poorly to highly resistantlithologies: even when it represents only 10% of thematerial supplied to the river, the most resistant lithologyprevents the asymptotic value of bed load flux to be reached(Mixture 3; Figure 13c). Consequently, the downstreamevolution of bed load flux for all three considered mixturescan also be reasonably fitted with a power law for distancesup to 400 km (Figure 13c): the exponent z varies between0.96 (one resistant lithology eroded at 0.2%/km) and 0.74(Mixture 3 with only 10% of resistant lithology). Anexponent z = 0.5 can only be achieved when consideringsome specific mixture made of poorly (10%/km) to verypoorly (100%/km) resistant lithologies but containing a fewpercent of moderately resistant pebbles to prevent theasymptotic behavior from being reached after a few tensof kilometers (result not displayed).[55] In most natural cases, our simplified model of bed
load evolution under the effect of pebble abrasion in auniformly eroding landscape suggests that the intrinsicconcavity index of purely transport-limited systems wouldrarely exceed 0.25 (corresponding to an exponent z of0.75). Our preliminary results thus indicate that pure trans-port-limited models should produce river profiles with alower concavity than detachment-limited models and there-fore challenge Whipple and Tucker’s [2002] conclusion thatmost fluvial incision models in the literature would producesimilar river profiles with a concavity index of �0.5 atsteady state. We have observed rivers with concavity indicesof �0.2 eroding the noncohesive conglomerates uplifted onthe backlimb of the Siwaliks range at the front of theHimalayas: such rivers would represent a good naturalexample of transport-limited systems, that is, systems whereeroding the bedrock does not require any additional work to
the work needed for transporting the bed load, and may thusprovide a counterexample to conventional scaling laws. Onthe other hand, Johnson et al. [2009] show evidence fortransport-limited bedrock rivers exhibiting concavity indi-ces of �0.6 in the Henry Mountains of Utah. However,Johnson et al. [2009] highlight that, in these rivers, thecoarse fraction of the bed load exerts a primary control onchannel slope by setting the bed roughness and thusinfluencing transport capacity during floods. In addition,the sources of this coarse material are located in the head-waters and are not distributed along the rivers. Furthermodeling including more complexities (e.g., bed armoring,flood variability, feedbacks between bed roughness andtransport capacity, role of fragmentation) is thereforerequired to provide definitive conclusions.
5. Conclusion
[56] In this study, we conducted series of experiments intwo annular flumes in order to unravel the respective rolesof the main factors controlling pebble abrasion rates andprocesses during fluvial transport. In those experiments,‘‘abrasion’’ is the sum of ‘‘attrition,’’ corresponding to theproduction of the finest abrasion products (<0.5 mm) whichtravel as suspended load, and ‘‘fragmentation’’ (breakingand splitting), associated with the production of angularfragments larger than 0.5 mm. Both processes are shown tobe efficient in reducing particle size during fluvial transport.In our experiments, the amount of sediment controls theprobability of impacts with the floor of the flume. Foramounts exceeding �30 to 70% of the amount required tocover the entire flume floor with pebbles and for a pebblevelocity held constant, abrasion rates are independent of theamount of sediment. For low amounts of sediment, anabrasive bed condition (simulating impacts with bedrockor immobile pebbles) can produce abrasion rates up to3.5 times higher than the abrasion rates produced solelyby impacts between moving pebbles. For well-sortedmaterial, particle size has a reduced influence on attritionrate but shows a clear positive control on fragment produc-tion rate, with large limestone pebbles (D > 40 mm) tendingto promote fragment production. The rate of fragmentproduction is highly variable, due to the stochasticity ofthe processes involved. For poorly sorted material, particleabrasion rate significantly decreases with increasing grainsize. Mass loss by attrition appears to scale with particlevelocity squared but additional experiments are required toconfirm this trend for all particle sizes. The influence ofvelocity on fragment production rate is unclear, due to thehigh variability of fragment production rates, but hightraveling velocities tend to promote fragmentation. Lithologyexerts the strongest control on abrasion rates and processes.Differences in abrasion rates between lithologies can exceed2 orders of magnitude and the ratio of mass loss by attritionto fragment production is highly lithology dependent. Whencompared to previously published experimental pebbleabrasion rates, our results are similar for massive or resistantlithologies (quartzite, gneiss, granite, limestone) but up toone order of magnitude higher for rock types prone tobreaking and splitting (schist, sandstone), our flume beingthe first one replicating the hydrodynamic conditions andhighly energetic impacts prevailing during floods in mountain
F04023 ATTAL AND LAVE: EXPERIMENTAL STUDY OF PEBBLE ABRASION
19 of 22
F04023

rivers. Based on our experimental results, we extrapolate apreliminary generic relationship between pebble attritionrate and transport stage (t*/t*c), where t* = fluvial Shieldsstress and t*c = critical Shields stress for incipient pebblemotion. This relationship predicts that attrition rates areindependent of transport stage for (t*/t*c) � 3 and increaselinearly with transport stage beyond this value.[57] Our simple model of evolution of sediment charac-
teristics along a river flowing across a uniformly erodinglandscape predicts that variations in the relative supply ofsediments from contrasted lithologies lead to contrastedevolution of sediment characteristics but that the mostresistant lithology exerts a strong control on sediment grainsize and bed load flux. The model also predicts that bedload flux can be described as a power law of drainage areawith an exponent varying between 0.75 and 1, providingthat a permanent supply of sediment from a resistant rocktype prevents the flux from reaching an asymptotic value.Such a result implies that the concavity index of riverprofiles produced using the transport-limited model offluvial erosion would rarely exceed 0.25 and thuschallenges the common view that the concavity indices oftransport-limited and detachment-limited rivers should beindistinguishable, �0.5. Our model results also emphasizethat abrasion itself should not lead to a major downstreamfining in most natural settings and that comparison of finingcoefficients with experimental pebble abrasion rates is thusgenerally incorrect, unless the sediment is mostly composedof pebbles from highly erodible lithologies. We emphasizehowever that additional experiments on particle abrasionrates at low transport stage must be carried out to improveour modeling of low energy rivers (e.g., alluvial rivers). Wealso highlight that some processes which have not beenfully investigated in this study (e.g., controls on fragmentproduction rates, effect of differences in particle mobilityfor sediments including a wide range of particle sizes, roleof weathering) must be integrated in the model in order tomake realistic detailed predictions of the evolution ofsediment characteristics along rivers. Such detailed predic-tions are essential if one wishes to efficiently modellandscape evolution or interpret the results of thermochro-nologic, cosmogenic or provenance studies carried out ondetrital sediments along fluvial networks or in sedimentarybasins.
Appendix A: Description of the Modelof Evolution of Sediment Characteristics Developedby Attal and Lave [2006] and Used in This Study(Section 4.2.2)
[58] Following the approach proposed by Attal and Lave[2006] for a simplified linear drainage geometry submittedto uniform erosion, we extend here the calculation to theparticular case of the Hack’s law with an exponent of 0.5,i.e., defined by the relation L/ A0.5 where A = drainage areaand L distance from source. We assume that each rockfragment delivered from the hillslopes to the river networkis reduced in size at a constant abrasion rate (equation (1)):
dV
V¼ �EddLt or
dD
D¼ �Ed
3dLt ; ðA1Þ
where Ed = particle abrasion rate, D and V = pebblediameter and volume respectively, and Lt = distance traveledby the particle. We also assume that the products of abrasionare fine materials that then transit as suspended load. If wenow consider a uniform erosion rate e and uniform sedimentsupply from the hillslopes and lateral tributaries with aunique fragment size D0, we can write for any point alongthe main river stem for the total sediment flux:
Qs Lð Þ ¼ eA ¼ eL
c
� �2
; ðA2Þ
for the bed load sediment flux:
Qb Lð Þ ¼ eZ L
0
e�EdxfA xð Þdx; ðA3Þ
for the mean pebble size:
D Lð Þ ¼ D0
R L0e�Edxe�
Ed3xfA xð ÞdxR L
0e�EdxfA xð Þdx
; ðA4Þ
where fA(x) is the area density of the drainage located at adistance x from the considered point. For simplicity, weassume that such distribution can be approximated byfA(x) = 2x
c2. Such distribution is compatible with Hack’s
law, since its integration between x = 0 (considered point)and x = L (source of the river main stem) leads to
A ¼Z L
0
fA xð Þdx ¼Z L
0
2x
c2dx ¼ L
c
� �2
: ðA5Þ
[59] Introducing above area density into (A3) and (A4)yields for the bed load sediment flux:
Qb Lð Þ ¼ 2ec2E2
d
1� 1þ EdLð Þe�EdL� �
; ðA6Þ
for the mean pebble size:
D Lð Þ ¼ 9
16D0
1� 1þ 43EdL
� �e�
4Ed3L
� �1� 1þ EdLð Þe�EdLð Þ : ðA7Þ
As for the linear drainage, an asymptotic behavior is rapidlyreached both for the flux of bed load and the meangrain size at great distances from the river source or forhigh values of the particle abrasion rate Ed. The asymptoticvalue for the mean pebble size D = 9/16 D0 is independentof Ed (it is 3/4 D0 for a linear drainage [Attal and Lave,2006]).
Notation
AIAS plateau refers to ‘‘plateau of Abrasion Independent ofAmount of Sediment’’ (see section 3.1)
xxx refers to average of xxxA drainage area [L2]Af total area of the flume floor [L2]
F04023 ATTAL AND LAVE: EXPERIMENTAL STUDY OF PEBBLE ABRASION
20 of 22
F04023

b coefficient [L3–2z T�1]D particle diameter [L]D0 initial particle diameter [L]D50 median sediment grain size [L]Ed abrasion rate expressed in percent mass loss per unit
traveled distance [L�1]attEd attrition rate expressed in percent mass loss per unit
traveled distance [L�1]frEd rate of fragment production expressed in percent
mass loss per unit traveled distance [L�1]Et abrasion rate expressed in percent mass loss per unit
time [T�1]attEt attrition rate expressed in percent mass loss per unit
time [T�1]g acceleration of gravity [LT�2]k coefficient in attEd = k(Up)
2 [T2L�3]L distance along river from source [L]Lt distance traveled by particles [L]m particle mass [M]m0 initial particle mass [M]Ms mass of sediment introduced into the flume [M]Msc mass of sediment required to cover the flume’s floor
with close-packed pebbles [M]np number of particles [dimensionless]p packing density [dimensionless]
pcp packing density corresponding to the full coverage ofthe floor of the flume with close-packed pebbles[dimensionless]
Q river discharge [L3T�1]Qb bed load flux [L3T�1]Qs total sediment flux [L3T�1]rm mean curvature radius of the flume [L]S river slope [dimensionless]Se surface covered by pebbles [L2]Ufl mean fluid velocity across a flume section [LT�1]Up mean particle traveling velocity [LT�1]up mean hop velocity [LT�1]w flume width [L]dZ height difference between the top and the bottom of
the vortex in the flume [L]d size reduction coefficient [L�1]e landscape erosion rate [LT�1]q river concavity index [dimensionless]rs sediment density [L�3M]rw water density [L�3M]t* Shields stress [dimensionless]t*c critical Shields stress for particle entrainment
[dimensionless]z exponent in power relationship between Qb and A
[dimensionless]W cross-sectional stream power [MT�3]
[60] Acknowledgments. French programs ‘‘Action coup de pouce’’and PNRH have financially supported this work. Part of this work has beendone at the University of Edinburgh (the postdoctoral support of the firstauthor was received through the University of Edinburgh and PatienceCowie’s NERC research grant NE/B504165/1). We are extremely gratefulto Rob Ferguson, Alex Densmore, Jens Turowski and an anonymousreviewer for thorough review and constructive comments on the differentversions of the manuscript, including the initial ‘‘long version.’’ We thankGreg Tucker and Alex Whittaker for providing constructive feedback onthe last version of the manuscript. We sincerely thank Mark Naylorfor providing valuable help for the statistical analysis of the results andJean-Paul Masson for his immense contribution to the development of theexperimental device.
ReferencesAdams, J. (1978), Data for New Zealand pebble abrasion studies, N. Z. J.Sci., 21, 607–610.
Alberta Infrastructure and Transportation (2007), Alberta flood envelopecurve analysis, report, , Edmonton, AB, Canada. (Available at http://www.transportation.alberta.ca/Content/docType30/Production/fldenvcurv.pdf)
Attal, M. (2003), Erosion des galets des rivieres de montagne au cours dutransport fluvial: Etude experimentale et application aux reseaux hydro-graphiques d’orogenes actifs, Ph.D. thesis, 279 pp., Univ. J. Fourier,Grenoble, France.
Attal, M., and J. Lave (2006), Changes of bedload characteristics along theMarsyandi River (central Nepal): Implications for understanding hillslopesediment supply, sediment load evolution along fluvial networks, anddenudation in active orogenic belts, Spec. Pap. Geol. Soc. Am., 398,143–171, doi:10.1130/2006.2398(09).
Attal, M., J. Lave, and J.-P. Masson (2006), New facility to study rivererosion processes, J. Hydrol. Eng., 132(6), 624 –628, doi:10.1061/(ASCE)0733-9429(2006)132:6(624).
Bradley, W. C. (1970), Effect of weathering on abrasion of granitic gravel,Colorado River (Texas), Geol. Soc. Am. Bull., 81, 61–80, doi:10.1130/0016-7606(1970)81[61:EOWOAO]2.0.CO;2.
Brewer, P. A., and J. Lewin (1993), In-transport modification of alluvialsediment: Field evidence and laboratory experiments, Spec. Publ. Int.Assoc. Sedimentol., 17, 23–35.
Brierley, G. J., and E. J. Hickin (1985), The downstream gradation ofparticle sizes in the Squamish River, British Colombia, Earth Surf. ProcessesLandforms, 10, 597–606, doi:10.1002/esp.3290100607.
Brummer, C. J., and D. R. Montgomery (2003), Downstream coarsening inheadwater channels, Water Resour. Res., 39(10), 1294, doi:10.1029/2003WR001981.
Bullows, W. L. (1939), Notes on the artificial production of pebbles by‘‘barreling,’’ Quarry Managers J., 21, 377–397.
Burbank, D. W., J. Leland, E. Fielding, R. S. Anderson, N. Brozovic, M. R.Reid, and C. Duncan (1996), Bedrock incision, rock uplift and thresholdhillslopes in the northwestern Himalayas, Nature, 379, 505 – 510,doi:10.1038/379505a0.
Burnham, K. P., and D. R. Anderson (2002), Model Selection and Multi-model Inference, 496 pp., Springer, New York.
Chang, H. H. (1988), Fluvial Processes in River Engineering, 425 pp., JohnWiley, New York.
Constantine, C. R., J. F. Mount, and J. L. Florsheim (2003), The effects oflongitudinal differences in gravel mobility on the downstream finingpattern in the Cosumnes River, California, J. Geol., 111, 233–241,doi:10.1086/345844.
Cowie, P. A., A. C. Whittaker, M. Attal, G. P. Roberts, G. E. Tucker,and A. Ganas (2008), New constraints on sediment-flux-dependent riverincision: Implications for extracting tectonic signals from river profiles,Geology, 36(7), 535–538, doi:10.1130/G24681A.1.
Daubree, A. (1879),Etudes Synthetiques deGeologie Experimentale, Dunod,Paris.
Ferguson, R., T. Hoey, S. Wathen, and A. Werritty (1996), Field evidencefor rapid downstream fining of river gravel through selective transport,Geology, 24(2), 179 – 182, doi:10.1130/0091-7613(1996)024<0179:FEFRDF>2.3.CO;2.
Finnegan, N. J., G. Roe, D. R. Montgomery, and B. Hallet (2005), Controlson the channel width of rivers: Implications for modeling fluvial incisionof bedrock, Geology, 33, 229–232, doi:10.1130/G21171.1.
Garzanti, E., G. Vezzoli, S. Ando, J. Lave, M. Attal, C. France-Lanord, andP. DeCelles (2007), Quantifying sand provenance and erosion (MarsyandiRiver, Nepal Himalaya), Earth Planet. Sci. Lett., 258(3–4), 500–515,doi:10.1016/j.epsl.2007.04.010.
Gilbert, G. K. (1877), Report on the Geology of the Henry Mountains:Geographical and Geological Survey of the Rocky Mountain Region,160 pp., U.S. Gov. Print. Off., Washington, D. C.
Hack, J. T. (1957), Studies of longitudinal profiles in Virginia and Maryland,U.S. Geol. Surv. Prof. Pap., 294-B, 97 pp.
Heller, P. L., P. E. Beland, N. F. Humphrey, S. K. Konrad, R. M. Lynds,M. E. McMillan, K. E. Valentine, Y. A. Widman, and D. J. Furbish(2001), Paradox of downstream fining and weathering-rind formationin the lower Hoh River, Olympic Peninsula, Washington, Geology, 29,971–974, doi:10.1130/0091-7613(2001)029<0971:PODFAW>2.0.CO;2.
Howard, A. D., W. E. Dietrich, and M. A. Seidl (1994), Modeling fluvialerosion on regional to continental scales, J. Geophys. Res., 99, 13,971–13,986, doi:10.1029/94JB00744.
Ikeda, S., G. Parker, and Y. Kimura (1988), Stable width and depth ofstraight gravel rivers with heterogeneous bed materials, Water Resour.Res., 24(5), 713–722, doi:10.1029/WR024i005p00713.
Johnson, J. P. L., K. X. Whipple, L. S. Sklar, and T. C. Hanks (2009),Transport slopes, sediment cover, and bedrock channel incision in the
F04023 ATTAL AND LAVE: EXPERIMENTAL STUDY OF PEBBLE ABRASION
21 of 22
F04023

Henry Mountains, Utah, J. Geophys. Res., 114, F02014, doi:10.1029/2007JF000862.
Jones, L. S., and N. F. Humphrey (1997), Weathering-controlled erosion ina coarse-grained, meandering reach of the Rio Grande: Implications forthe rock record, Geol. Soc. Am. Bull., 109, 1080–1088, doi:10.1130/0016-7606(1997)109<1080:WCAIAC>2.3.CO;2.
Knighton, A. D. (1982), Longitudinal changes in the size and shape ofstream bed material: Evidence of variable transport conditions, Catena,9, 25–34, doi:10.1016/S0341-8162(82)80003-9.
Kodama, Y. (1994a), Downstream changes in the lithology and grain size offluvial gravels, the Watarase River, Japan: Evidence of the role of erosionin downstream fining, J. Sediment. Res., Sect. A, 64, 68–75.
Kodama, Y. (1994b), Experimental study of erosion and its role in producingdownstream fining in gravel-bed rivers, J. Sediment. Res., Sect. A, 64,76–85.
Krumbein, W. C. (1941), The effects of abrasion on the size, shape androundness of rock fragments, J. Geol., 49, 482 –520, doi:10.1086/624985.
Kuenen, P. H. (1956), Experimental erosion of pebbles: 2. Rolling bycurrent, J. Geol., 64, 336–368, doi:10.1086/626370.
Kukal, Z. (ed.) (1990), The Rate of Geological Processes, Earth Sci. Rev.,28, 284 pp.
Leopold, L. B., and T. Maddock (1953), The hydraulic geometry of streamchannels and some physiographic implications, U.S. Geol. Surv. Prof.Pap., 252.
Lewin, J., and P. A. Brewer (2002), Laboratory simulation of clast abrasion,Earth Surf. Processes Landforms, 27, 145–164, doi:10.1002/esp.306.
Meyer-Peter, E., and R. Muller (1948), Formulas for bed-load transport,paper presented at 2nd Meeting, Int. Assoc. for Hydraul. Res., Delft,Netherlands.
Mezaki, S., and M. Yabiku (1984), Channel morphology of the Kali Gandakiand the Narayani rivers in central Nepal, J. Nepal Geol. Soc., 4, 161–176.
Mikos, M. (1994), The downstream fining of gravel-bed sediments in theAlpine Rhine River, inDynamics andGeomorphology of Mountain Rivers,edited by P. Ergenzinger and K.H. Schmidt, pp. 93–108, Springer, Berlin.
Mikos, M., and M. N. R. Jaeggi (1995), Experiments on motion of sedimentmixtures in a tumbling mill to study fluvial erosion, J. Hydraul. Res., 33,751–772.
Montgomery, D. R., and K. B. Gran (2001), Downstream variations in thewidth of bedrock channels, Water Resour. Res., 37, 1841 – 1846,doi:10.1029/2000WR900393.
Moussavi-Harami, R., A. Mahboubi, and M. Khanehbad (2004), Analysisof controls on downstream fining along three gravel-bed rivers in theBand-e-Golestan drainage basin NE Iran, Geomorphology, 61, 143–153,doi:10.1016/j.geomorph.2003.12.005.
Nino, Y., and M. Garcıa (1994), Gravel saltation: 2. Modeling, WaterResour. Res., 30(6), 1915–1924, doi:10.1029/94WR00534.
Nino, Y., M. Garcıa, and L. Ayala (1994), Gravel saltation: 1. Experiments,Water Resour. Res., 30(6), 1907–1914, doi:10.1029/94WR00533.
Paola, C., G. Parker, R. Seal, S. K. Sinha, J. B. Southard, and P. R.Wilcock (1992), Downstream fining by selective deposition in a laboratoryflume, Science, 258, 1757–1760, doi:10.1126/science.258.5089.1757.
Parker, G. (1991), Selective sorting and erosion of river gravel, II: Applica-tions, J. Hydrol. Eng., 117(2), 150–171.
Pearce, T. H. (1971), Short distance fluvial rounding of volcanic detritus,J. Sediment. Petrol., 41, 1069–1072.
Schoklitsch, A. (1933), Uber die verkleinerung der geschiebe in flusslaufen,Sitzungsber. Akad. Wiss. Wien, IIa, 142, 343–366.
Shaw, J., and R. Kellerhals (1982), The composition of recent alluvialgravels in Alberta river beds, Bull. 41, 151 pp., Alberta Geol. Surv.,Edmonton, AB, Canada.
Sklar, L., and W. E. Dietrich (1998), River longitudinal profiles and bed-rock incision models: Stream power and the influence of sediment supply,in Rivers Over Rock: Fluvial Processes in Bedrock Channels, Geophys.Monogr. Ser., vol. 107, edited by K. J. Tinkler and E. E. Wohl, pp. 237–260, AGU, Washington, D. C.
Sklar, L. S., and W. E. Dietrich (2001), Sediment and rock strength controlson river incision into bedrock, Geol. Soc. Am. Bull., 29, 1087–1090.
Sklar, L. S., and W. E. Dietrich (2004), A mechanistic model for riverincision into bedrock by saltating bed load, Water Resour. Res., 40,W06301, doi:10.1029/2003WR002496.
Sklar, L. S., W. E. Dietrich, E. Foufoula-Georgiou, B. Lashermes, andD. Bellugi (2006), Do gravel bed river size distributions record channelnetwork structure?, Water Resour. Res., 42, W06D18, doi:10.1029/2006WR005035.
Sternberg, H. (1875), Untersuchungen uber langen- und querprofilegeschiebfuhrender flusse, Z. Bauwes., 25, 483–506.
Surian, N. (2002), Downstream variation in grain size along an Alpineriver: Analysis of controls and processes, Geomorphology, 43, 137–149, doi:10.1016/S0169-555X(01)00127-1.
Vance, D., M. Bickle, S. Ivy-Ochs, and P. W. Kubik (2003), Erosion andexhumation in the Himalaya from cosmogenic isotope inventories of riversediments, Earth Planet. Sci. Lett., 206(3–4), 273–288, doi:10.1016/S0012-821X(02)01102-0.
Wentworth, C. K. (1919), A laboratory and field study of cobble abrasion,J. Geol., 27, 507–522, doi:10.1086/622676.
Whipple, K. X., and G. E. Tucker (2002), Implications of sediment-flux-dependent river incision models for landscape evolution, J. Geophys.Res., 107(B2), 2039, doi:10.1029/2000JB000044.
Whipple, K. X., E. Kirby, and S. Brocklehurst (1999), Geomorphic limits toclimatically induced increases in topography relief, Nature, 401, 39–43,doi:10.1038/43375.
Whittaker, A. C., P. A. Cowie, M. Attal, G. E. Tucker, and G. P. Roberts(2007), Contrasting transient and steady-state rivers crossing active normalfaults: New field observations from the central Apennines, Italy, BasinRes., 19, 529–556, doi:10.1111/j.1365-2117.2007.00337.x.
Willgoose, G., R. L. Bras, and J. Rodriguez-Iturbe (1991), A coupledchannel network growth and hillslope evolution model: 1. Theory, WaterResour. Res., 27, 1671–1684, doi:10.1029/91WR00935.
Wobus, C. W., K. V. Hodges, and K. X. Whipple (2003), Has focuseddenudation sustained active thrusting at the Himalayan topographicfront?, Geology, 31(10), 861–864, doi:10.1130/G19730.1.
�����������������������M. Attal, School of GeoSciences, University of Edinburgh, Drummond
St., Edinburgh EH8 9XP, UK. ([email protected])J. Lave, Centre de Recherches Petrographiques et Geochimiques, F-54501
Nancy, France.
F04023 ATTAL AND LAVE: EXPERIMENTAL STUDY OF PEBBLE ABRASION
22 of 22
F04023