peco energy universal services program
TRANSCRIPT

October 2012
PECO Energy
Universal Services Program
Final Evaluation Report

www.appriseinc.org Table of Contents
APPRISE Incorporated
Table of Contents
Executive Summary ................................................................................................................... i
Introduction .................................................................................................................... i
Customer Needs Assessment ....................................................................................... iv
PECO’s Universal Service Programs.............................................................................v
Customer Survey ........................................................................................................ xiii
CAP Impacts Analysis .................................................................................................xv
Key Findings .............................................................................................................. xvi
Recommendations ...................................................................................................... xix
I. Introduction ............................................................................................................................1
A. Background ..............................................................................................................1
B. Objectives of the Evaluation ....................................................................................2
C. Organization of the Report .......................................................................................3
II. Customer Needs Assessment ................................................................................................5
A. Methodology for Estimating the Population Eligible for CAP Benefits .................5
B. Estimating the Population Eligible for CAP Benefits..............................................6
C. Analysis of Customers Income Eligible for CAP ....................................................7
D. Analysis of Customers Targeted for CAP .............................................................11
E. Characteristics of CAP Recipients .........................................................................12
F. CAP Participation Rates ........................................................................................13
G. Summary of Customer Needs Assessment ............................................................16
III. PECO’s Universal Service Programs .................................................................................17
A. Program Overview .................................................................................................17
B. Customer Assistance Program (CAP) ....................................................................18
C. Low Income Usage Reduction Program (LIURP) .................................................32
D. Matching Energy Assistance Fund (MEAF) ..........................................................44
E. Customer Assistance Referral and Evaluation Services (CARES) ........................51
F. Education-Outreach Programs ...............................................................................55
G. External Grant Program Administration ................................................................55
www.appriseinc.org Table of Contents
APPRISE Incorporated
IV. Customer Surveys ..............................................................................................................57
A. Customer Survey Methodology .............................................................................57
B. Survey Findings .....................................................................................................59
C. Summary of Survey Findings ................................................................................85
V. CAP Impacts Analysis ........................................................................................................88
A. Goals ......................................................................................................................88
B. Methodology ..........................................................................................................88
C. Data Attrition .........................................................................................................91
D. CAP Participant Characteristics .............................................................................92
E. Retention Rates ......................................................................................................95
F. Arrearage Forgiveness ...........................................................................................97
G. Affordability ..........................................................................................................99
H. Bills and Payments ...............................................................................................108
I. Energy Assistance ................................................................................................113
J. Collections Impact ...............................................................................................114
K. Summary of CAP Data Analysis Findings ..........................................................115
VI. Summary of Findings and Recommendations .................................................................117
A. Key Findings ........................................................................................................117
B. Recommendations ................................................................................................121

www.appriseinc.org Executive Summary
APPRISE Incorporated Page i
Executive Summary
PECO has implemented Universal Service Programs to help low-income residential customers who express or demonstrate difficulty paying their monthly energy bills. APPRISE conducted a process and impact evaluation of the programs to assess how the programs are performing and how they can be modified to increase their efficiency and effectiveness. This report provides results from the evaluation of these programs.
Introduction
The Bureau of Consumer Services (BCS) of the Public Utility Commission (PUC) requires that PECO evaluate its Universal Service Programs, and has developed standard evaluation questions to guide Universal Service Programs evaluations. The evaluation questions are listed below with brief answers and referral to the relevant section of the report.
1. Is the appropriate population being served? The Customer Needs Assessment, Section II, showed that the appropriate population of low-income customers is served by PECO’s CAP. The Customer Surveys, Section IV, shows that customers who participated in CAP, had vulnerable members, had low education attainment, and were likely to be unemployed.
2. What is the customer distribution for each program by poverty guidelines? PECO’s Universal Service Programs, Section III, showed that in 2011, eight percent of CAP participants had income below 25 percent of the FPL, 13 percent had income between 26 and 50 percent of the FPL, 46 percent had income between 51 and 100 percent of the FPL, and 33 percent had income between 101 and 150 percent of the FPL. PECO’s Universal Service Programs, Section III, showed that in 2010 24 percent of LIURP participants had income below 50 percent of poverty, 48 percent had income between 51 and 100 percent of poverty, 24 percent had income between 101 and 150 percent of poverty, and five percent had income above 150 percent of poverty. PECO’s Universal Service Programs, Section III, showed that in 2011, 13 percent of MEAF participants had income below 50 percent of the poverty level, 25 percent had income between 51 and 100 percent of the poverty level, 17 percent had income between 101 and 150 percent of the poverty level, and 46 percent were not CAP participants, so their poverty level was unknown. Poverty statistics were not available for CARES participants.
3. What are the barriers to program participation? The Customer Surveys, Section IV, showed that most customers said that CAP enrollment was not difficult. Only six percent said it was somewhat difficult and only one percent said it

www.appriseinc.org Executive Summary
APPRISE Incorporated Page ii
was very difficult. Those who said that enrollment was difficult said that completing the application and providing proof of income were the difficult parts of enrollment.
4. What is the distribution of customers by payment plan? PECO’s Universal Service Programs, Section III, showed that in 2011, there was the following number of participants in each CAP tier.
Table ES-1 2011 CAP Participation, By Tier
CAP Tier Poverty Level Number Percent
A ≤25% 73 0%
B ≤25% 11,565 8%
C 26%-50% 18,235 13%
D 51%-75% 29,298 21%
D1 76%-100% 34,620 25%
E 101%-125% 25,981 19%
E1 126%-150% 18,972 14%
Total 138,744 100%
5. What are the barriers to program re-certification?
The Customer Surveys, Section IV, showed that only ten percent said it was somewhat difficult and two percent said it was very difficult to recertify for CAP. These respondents reported that providing proof of income and completing the application were the most difficult parts of re-certification.
6. What are the CAP retention rates and why? The CAP Impacts Analysis, Section V, showed that CAP retention rates were high. Most customers who continued to have a bill, continued to have a CAP bill. Ninety-six percent of the 2010 enrollees were still CAP participants twelve months after enrollment.
7. Is there an effective link between participation in CAP and participation in energy assistance programs? PECO’s Universal Service Programs, Section III, found that LIHEAP was one of the most common referrals made by the CAP call center. The CAP Impacts Analysis, Section V, showed that 51 percent of electric and gas CAP participants received LIHEAP in the year prior to enrollment, and 42 percent received LIHEAP in the year following enrollment.
8. How effective are CAP control features at limiting program costs? PECO’s Universal Service Programs, Section III, described PECO’s CAP design. Because the CAP is structured as a rate discount rather than as a percentage of income plan, PECO and its customers share in the cost of increased usage and increased prices. Additionally, PECO limits the maximum benefit to a $700 average. The discount cost is controlled by
www.appriseinc.org Executive Summary
APPRISE Incorporated Page iii
limiting the discount to the first 650 kWh of usage, except customers in CAP B and C receive a discount up to 750 kWh in July through September.
9. How effective is the CAP and LIURP link? PECO’s Universal Service Programs, Section III, showed that 97 percent of 2010 LIURP participants were CAP participants.
10. Does CAP participation improve payment behaviors? The CAP Impacts Analysis, Section V, showed that bill coverage rates improved for 2010 CAP enrollees in the year after they enrolled in the program. While 59 percent of this group paid at least 90 percent of their bill in the year prior to enrollment, 70 percent paid at least 90 percent of their bill in the year following enrollment. Cash and LIHEAP payments declined, but participants covered a greater percentage of their bill due to the large decline in charges after enrollment.
11. Does participation in Universal Service Programs reduce arrearages? The CAP Impacts Analysis, Section V, showed that CAP participants reduced their arrearages by $200. Mean arrearage forgiveness received was $242.
12. Does participation in Universal Service Programs decrease service terminations? The CAP Program Operations and Impacts Analysis, Section V, shows that there was not a meaningful change in service terminations following CAP enrollment. However, there were significant reductions in other, more common, collections actions.
13. Does participation in Universal Service Programs lower collections costs? The CAP Impacts Analysis, Section V, showed the gross reduction in collection costs was $84 and the net reduction was $191 after customers enrolled in the CAP. This was due to a reduction in the number of collections actions for CAP customers.
14. How can Universal Service Programs be more cost-effective and efficient? The Summary of Findings and Recommendations, Section VII, provides recommendations to improve PECO’s Universal Service Programs. Some of the key recommendations included increased outreach to CAP participants about LIHEAP, increased outreach to customers in the lowest poverty level groups, and increased targeting of LIURP to customers in CAP B.
To address the research issues, we conducted the following evaluation activities.
1. Background Research: Background research consisted of document review and interviews with PECO managers, staff, and contractors.
2. Customer Needs Assessment: We used data from the 2008-2010 American Community Survey and PECO’s customer database to develop information on the number of customers who were eligible for CAP, the overall program participation rate, and the participation rate for customers with energy burden above the Public Utility Commission’s guidelines.

www.appriseinc.org Executive Summary
APPRISE Incorporated Page iv
3. Customer Survey: We conducted a telephone survey with CAP participants and low-income nonparticipants to assess CAP understanding, bill payment difficulties faced by the population, CAP impact on affordability, and program satisfaction.
4. Impact Analysis: We used billing, payment, and collections data to assess the impact of the CAP on affordability, bill payment, and collections actions and costs.
Customer Needs Assessment
We developed information on the number and characteristics of PECO’s low-income population by extracting data from the 2008-2010 American Community Survey (ACS) three-year Public Use Microdata Sample (PUMS).
PECO provides utility service to a significant portion of the Pennsylvania’s low-income population. Approximately 287,000 households served by PECO had income at or below 150 percent of the federal poverty guidelines.
This analysis indicated that 46 percent of PECO’s eligible customers participated in the electric CAP and 49 percent participated in the gas CAP. Participation in the electric CAP was lowest in the group of households with income at or below 25 percent of the poverty level, but this participation has increased since PECO’s last Universal Service Program Evaluation. The rate for this group was 16 percent in 2005, and it was 25 percent in 2009. PECO should continue to work to increase participation among customers in this group.
Participation was higher among households identified as having energy burdens above the targets established by the PUC. Overall, 74 percent of targeted electric customers and 85 percent of targeted gas customers participated. However, because participation was not limited to customers with burdens above the target level, some of the participating customers were not in the targeted group.
PECO had higher CAP participation than other electric utilities in Pennsylvania. We estimated that 46 percent of PECO households who were income-eligible received CAP benefits, while only 25 percent of income-eligible households in other utilities’ service territories participated in CAP. CAP participation was also higher for households receiving gas service from PECO than for those served by other gas utilities in Pennsylvania. The PECO gas CAP participation rate was 49 percent, compared to 37 percent for other gas utilities.

www.appriseinc.org Executive Summary
APPRISE Incorporated Page v
PECO’s Universal Service Programs
This section provides an overview of PECO’s CAP, LIURP, CARES, and MEAF programs.
Customer Assistance Program
CAP Rate is a discounted residential tariff for PECO’s residential customers with income at or below 150 percent of the federal poverty level. PECO will enroll any low-income customer who expresses difficulty in paying his or her bill.
Program Costs Total CAP costs were projected to be over $122 million in 2012. These costs include operation and maintenance of the program, the CAP shortfall, and arrearage forgiveness. Actual CAP costs were over $100 million in 2010.
Administration PECO contracts with a CAP Call Center that is trained to handle all aspects of PECO’s Universal Service Programs. The CAP Call Center has the following responsibilities. Respond to customer questions about CAP. Process applications for enrollment or tier change. Process re-certifications. Remove customers who fail to respond to the recertification request. Make referrals to agencies or CARES. Receive, log, track, and store all mailed or faxed income verification documents. Respond to PUC complaints as required. Review LIHEAP lists for CAP eligibility and enroll customers in CAP if they have not
already done so. Process payment arrangements for CAP Rate customers.
Requirements Customers must abide by the following requirements to be in the CAP Rate. Application – Customers must complete an application or have been approved through
LIHEAP. Budget Billing – Customers in CAP Tiers A, B, C are required to have budget billing. Alternate Supplier – CAP customers cannot have an alternate supplier. Bill Payment – Customers must pay their bills on time and in full each month. Energy Usage – Customers must participate in LIURP if offered by PECO. LIHEAP – Customers must sign up for LIHEAP. Income changes – Customers must report any changes in household income to PECO. Re-certification – Customers must recertify on an annual or bi-annual basis.
CAP Discounts PECO has updated its CAP rates many times over the past several years as their electric and gas rates have changed, to provide approximately 90 percent of each tier of CAP customers with an energy burden that meets the Commission targets. PECO has seven electric CAP

www.appriseinc.org Executive Summary
APPRISE Incorporated Page vi
rates, with discounts ranging from 0 to 93 percent and six gas CAP Rates with discounts ranging from 0 to 79 percent.
Cost Controls PECO implemented a $700 maximum benefit cost control on an average basis. The discount cost is controlled by limiting the discount to the first 650 kWh of usage, except customers in CAP B and C receive a discount up to 750 kWh in July through September.
Arrearage Forgiveness PECO provides forgiveness of one twelfth of pre-program arrearages each month that the customer pays the PECO bill in full and on time. A CAP customer is eligible for pre-program arrearage forgiveness only once as a PECO customer.
In 2011, PECO introduced a one-time In-Program Arrearage Forgiveness Program (IPAF) for forgiveness of over $1,000 in arrearages accumulated while on CAP. The program forgave arrearages down to a level of $1,000, and then asked the customer to pay the rest of the arrearages over five years. There were approximately 16,000 customers who received this benefit and the total amount forgiven was approximately $25 million.
CAP Intake Customers must complete and sign a CAP application and provide proof of income within ten days to enroll in CAP rate. PECO’s contracted Universal Service call center handles all income verification for both enrollment and re-certification. The only exception is for CAP Rate A accounts, which are referred to CARES/Universal Services for processing. CAP Recertification The CAP requires recertification every two years (every year for Electric CAP A). If a customer has received assistance that is based upon the same income parameters as CAP, and the income verification procedures are acceptable to PECO, the customer may be re-certificated without completing a new CAP Rate application.
CAP Removal Customers may be removed from CAP for the following reasons. Over income guidelines Failure to meet program requirements Failure to accept program services Failure to submit to a LIURP audit Failure to complete CAP re-certification Fraud, theft of service, or other misappropriations of service
CAP Collections Strategy PECO begins collections actions as soon as customers are past due, with the goal of having customers keep up with bill payment obligations and avoiding large arrearages that are not manageable. CAP customers who do not pay their bills are subject to termination after proper notice procedures are followed.

www.appriseinc.org Executive Summary
APPRISE Incorporated Page vii
Program Participation PECO does not have an enrollment limit for the CAP. Enrollment in December 2011 was close to 139,000 customers.
Table ES-2 shows that only 73 customers were enrolled in CAP A, for customers with income below 25% and special circumstances. However, eight percent of CAP participants, over 11,500 customers, were enrolled in rate B for customers with income below 25 percent of the poverty level. The majority of CAP customers were enrolled in tiers D1, E, and E1 for customers with income between 76 and 150 percent of poverty.
Table ES-2 PECO CAP Participation, December 2011
By CAP Tier
CAP Tier Poverty Level 2011 CAP Participants
Number Percent
A ≤25% 73 0%
B ≤25% 11,565 8%
C 26%-50% 18,235 13%
D 51%-75% 29,298 21%
D1 76%-100% 34,620 25%
E 101%-125% 25,981 19%
E1 126%-150% 18,972 14%
Total 138,744 100%
Challenges PECO faces the following challenges with respect to the CAP. Identifying and enrolling customers who need assistance as soon as possible. Enrollment by customers with balances over $1,000 has increased. Participation by households with income at or below 50 percent of poverty continues to
be lower than the other poverty level groups. Providing the level of discount needed to bring customers to the affordability level while
maintaining appropriate cost controls is a difficult balance. Many customers continue to face difficulties paying their energy bills even while
receiving the CAP discounts, and they build up additional arrearages while on the program.
Getting participants to respond to recertification requests. CAP customers leaving CAP to go to an alternate energy supplier and then return after a
few months of non-CAP billings.
Successes PECO has continued to enhance and develop the CAP over the years. Accomplishments have included the following.
www.appriseinc.org Executive Summary
APPRISE Incorporated Page viii
Enhanced CAP outreach. Streamlined enrollment process. Online CAP application process. LIHEAP auto-enrollment and auto-recertification for CAP. Call center dedicated to CAP questions. Improved fax and mail capacity, processing time, and response time for CAP
enrollment, recertification, storage and retrieval of CAP applications, and question fielding at the CAP call center.
Exceeded the PUC CAP enrollment requirements for the past six years. Increased participation by the lowest poverty group customers since the previous
Universal Service Program evaluation. Additional payment agreements for CAP customers who experience a decrease in
income and move to a lower CAP tier. A one-time in program arrearage forgiveness program to assist customers who built up
additional arrearages while participating in CAP. Prioritization of high usage CAP customers for LIURP. Usage limits on CAP discounts to encourage conservation.
LIURP
PECO’s Low Income Usage Reduction Program (LIURP) provides education, conservation, and weatherization measures to assist customers to reduce the amount of electricity and/or natural gas used in their homes. LIURP targets high-usage, low-income CAP customers. While the program is mandatory for CAP customers, it is also available for other low-income customers with income below 200 percent of the poverty level.
LIURP Resources The LIURP budget was $7.825 million in 2009 and is planned to remain at that level through 2013.
Program Management and Administration PECO’s analyst is responsible for overseeing overall LIURP production, quality assurance, and the annual evaluation. PECO contracts with CMC Energy Services to implement the program. CMC staff members conduct the LIURP audits and develop work orders for additional measures to be installed on subsequent visit(s) by the program subcontractors.
Eligibility PECO customers must meet the following criteria to participate in the Program. Residential customer Income requirement
o Income at or below 150 percent of the Federal Poverty Level (FPL), or o Income between 150 and 200 percent of the FPL1
1 Since 1998, LIURP regulations have permitted companies to spend up to 20 percent of their annual Program budgets on customers with income between 150 and 200 percent of the FPL.
www.appriseinc.org Executive Summary
APPRISE Incorporated Page ix
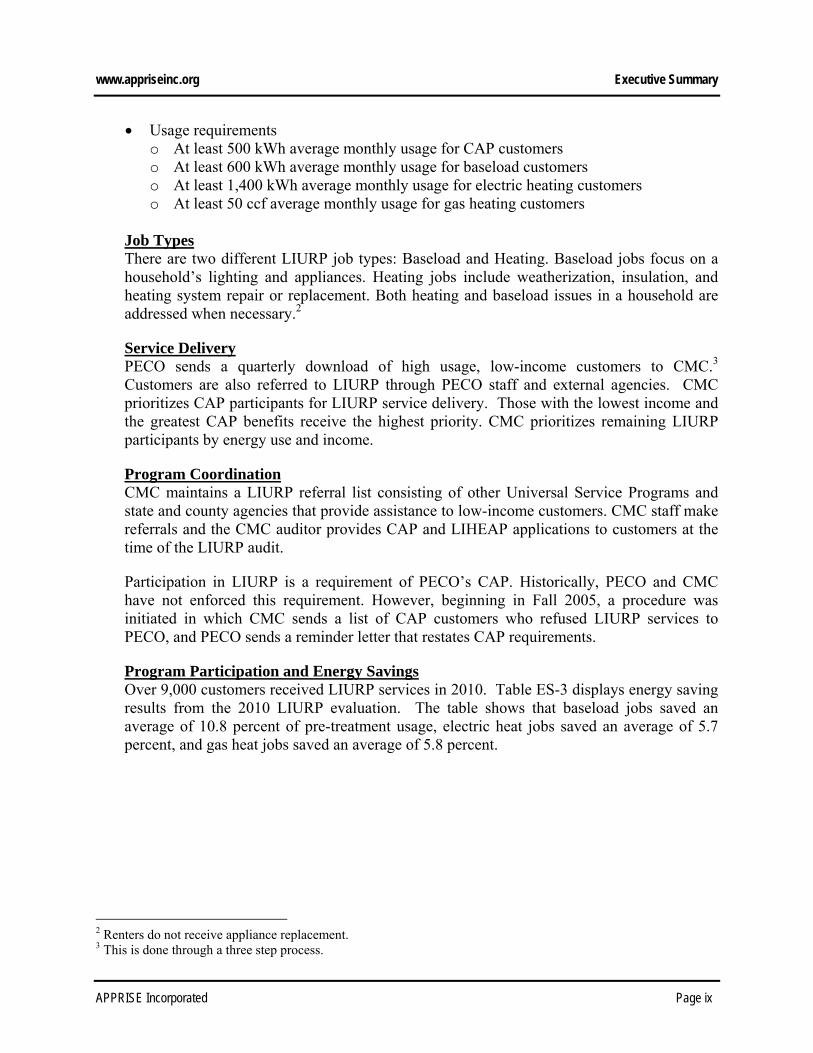
Usage requirements o At least 500 kWh average monthly usage for CAP customers o At least 600 kWh average monthly usage for baseload customers o At least 1,400 kWh average monthly usage for electric heating customers o At least 50 ccf average monthly usage for gas heating customers
Job Types There are two different LIURP job types: Baseload and Heating. Baseload jobs focus on a household’s lighting and appliances. Heating jobs include weatherization, insulation, and heating system repair or replacement. Both heating and baseload issues in a household are addressed when necessary.2
Service Delivery PECO sends a quarterly download of high usage, low-income customers to CMC.3 Customers are also referred to LIURP through PECO staff and external agencies. CMC prioritizes CAP participants for LIURP service delivery. Those with the lowest income and the greatest CAP benefits receive the highest priority. CMC prioritizes remaining LIURP participants by energy use and income.
Program Coordination CMC maintains a LIURP referral list consisting of other Universal Service Programs and state and county agencies that provide assistance to low-income customers. CMC staff make referrals and the CMC auditor provides CAP and LIHEAP applications to customers at the time of the LIURP audit.
Participation in LIURP is a requirement of PECO’s CAP. Historically, PECO and CMC have not enforced this requirement. However, beginning in Fall 2005, a procedure was initiated in which CMC sends a list of CAP customers who refused LIURP services to PECO, and PECO sends a reminder letter that restates CAP requirements.
Program Participation and Energy Savings Over 9,000 customers received LIURP services in 2010. Table ES-3 displays energy saving results from the 2010 LIURP evaluation. The table shows that baseload jobs saved an average of 10.8 percent of pre-treatment usage, electric heat jobs saved an average of 5.7 percent, and gas heat jobs saved an average of 5.8 percent.
2 Renters do not receive appliance replacement. 3 This is done through a three step process.

www.appriseinc.org Executive Summary
APPRISE Incorporated Page x
Table ES-3 LIURP Average Usage and Savings
Degree-Day Normalized
# Pre-Use Post-Use Savings % Savings
Electric Baseload (kWh) 4,055 11,370 10,147 1,223 10.8%
Electric Heat (kWh) 144 19,662 18,534 1,128 5.7%
Gas Heat (ccf) 1,166 1,052 991 61 5.8%
Challenges PECO’s has faced the following LIURP challenges. PECO has had difficulty continuing to find LIURP participants with high pre-program
usage because the program has identified and treated many of PECO’s highest users for so many years.
Customer refusals (reduced with LIURP participation requirement for CAP) and landlord refusals (reduced with landlord education).
Defacto heating, the use of electric heating instead of the household’s primary heating technology has been a challenge, especially for Philadelphia customers.4
Increased cost of efficiency measures, which reduced the number of customers who can be served.
Successes PECO has worked to provide high quality efficiency services to LIURP participants to improve energy affordability and health and safety. LIURP successes include the following. Proactive identification of high usage customers. LIURP contractor that is experienced, knowledgeable, and efficient. Successful energy education program for LIURP participants and post-delivery follow-
ups to ensure customers maintain reduction goals. In-home services that refer customers to other Universal Service programs. High savings for baseload LIURP participants.
MEAF
The Matching Energy Assistance Fund (MEAF) is PECO’s hardship fund program that provides emergency assistance grants to customers who have not paid their bills and have been shut off or are in danger of having services terminated. The maximum MEAF grant is $500 per fuel.
Resources MEAF is funded through ratepayer donations, other fundraising, and PECO contributions. Projected MEAF expenditures were $1.14 million in 2012. Actual program expenditures were $1.14 million in 2009 and $0.67 in 2010. Total program funds declined significantly
4 The 2011 LIURP program found that 716 of the 6,822 jobs that did not have electric heat (over ten percent) had defacto electric heating.

www.appriseinc.org Executive Summary
APPRISE Incorporated Page xi
from 2009 to 2010, likely a result of the economic conditions. There were a total of 1,442 MEAF grants in 2010, averaging $306, and this was reduced to a total of 528 grants in 2011, averaging $300.
Administration PECO contracts with a MEAF Call Center to conduct intake for MEAF, respond to CBO inquiries related to MEAF enrollment and donations, and conduct outreach for MEAF donations. PECO also contracts with six county fuel fund agencies to conduct intake for the program. One of these agencies, Torres Credit Services, is PECO’s MEAF Call Center.
The six county fuel fund agencies are responsible for screening clients for grant eligibility, assisting clients with the applications, contacting the MEAF Call Center to determine the customer’s past due amount, approving the grant, and contacting the MEAF Call Center to stop a pending shutoff.
Eligibility Residential PECO customers are eligible for MEAF if they meet the following criteria. Income at or below 175 percent of the federal poverty level Resident in county where they apply Imminent danger of service termination or have had their services terminated Grant must eliminate the total amount due, excluding pre-program arrearage Customer must make payment or solicit third party grants if MEAF grant does not cover
amount owed Customer has not received MEAF in the past two years
Challenges PECO faces the following challenges with MEAF. There has been a continued decline in customer giving since the downturn in the
economy. PECO has not been able to locate an agency in Chester County. There were some MEAF challenges that were reported by the MEAF call center and the MEAF agencies. The MEAF call center reported that they are sometimes asked by the agencies to make
exceptions to the guidelines and provide extra time to customers to prevent shutoff, but they are not able to do this.
Large balances are a challenge for many customers who cannot obtain the additional funds needed. One agency recommended that PECO assist the customer before the balance is too high for the customer to be able to pay.
A few agencies said that the small amount of money they receive in funding and the small amount they are able to provide for grants is a challenge. There is never enough money for all of the clients who need assistance.
One agency said that the short turn-around for some clients is a challenge. When a client calls with a 72-hour shut-off notice, it is a challenge to be able to respond that quickly.
www.appriseinc.org Executive Summary
APPRISE Incorporated Page xii
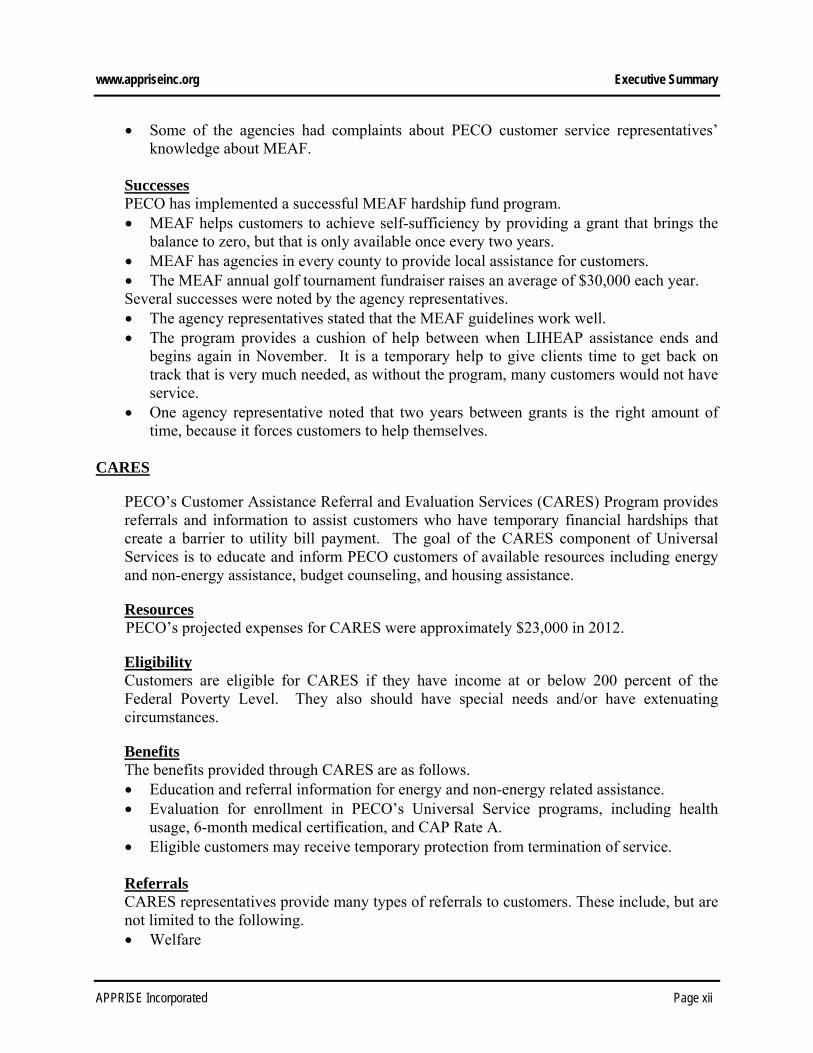
Some of the agencies had complaints about PECO customer service representatives’ knowledge about MEAF.
Successes PECO has implemented a successful MEAF hardship fund program. MEAF helps customers to achieve self-sufficiency by providing a grant that brings the
balance to zero, but that is only available once every two years. MEAF has agencies in every county to provide local assistance for customers. The MEAF annual golf tournament fundraiser raises an average of $30,000 each year. Several successes were noted by the agency representatives. The agency representatives stated that the MEAF guidelines work well. The program provides a cushion of help between when LIHEAP assistance ends and
begins again in November. It is a temporary help to give clients time to get back on track that is very much needed, as without the program, many customers would not have service.
One agency representative noted that two years between grants is the right amount of time, because it forces customers to help themselves.
CARES
PECO’s Customer Assistance Referral and Evaluation Services (CARES) Program provides referrals and information to assist customers who have temporary financial hardships that create a barrier to utility bill payment. The goal of the CARES component of Universal Services is to educate and inform PECO customers of available resources including energy and non-energy assistance, budget counseling, and housing assistance.
Resources PECO’s projected expenses for CARES were approximately $23,000 in 2012.
Eligibility Customers are eligible for CARES if they have income at or below 200 percent of the Federal Poverty Level. They also should have special needs and/or have extenuating circumstances.
Benefits The benefits provided through CARES are as follows. Education and referral information for energy and non-energy related assistance. Evaluation for enrollment in PECO’s Universal Service programs, including health
usage, 6-month medical certification, and CAP Rate A. Eligible customers may receive temporary protection from termination of service.
Referrals CARES representatives provide many types of referrals to customers. These include, but are not limited to the following. Welfare

www.appriseinc.org Executive Summary
APPRISE Incorporated Page xiii
Medical assistance Cash assistance Social services LIHEAP MEAF LIURP American Cancer Society
Challenges When asked about program challenges, the CARES supervisor and all three representatives reported that they would like to be able to assist more customers. The supervisor reported that in addition to situations where there is nothing they can do to help a customer, it is not always clear what needs to be done for a customer, because there are always unique cases that do not fit neatly into the CARES protocol.
Successes PECO provides customized care for customers through this program and has implemented new metrics, tracking, and reporting. The supervisor and representatives all reported that the CARES program is very successful in helping customers with special needs. While they cannot help everybody, they do make a large impact on customers’ lives.
Customer Survey
APPRISE conducted a survey with participants in PECO’s Customer Assistance Program and low-income nonparticipants to develop information on customer knowledge, understanding, and satisfaction with the CAP. The low-income nonparticipants were drawn from a sample of PECO’s customers who received LIHEAP but did not participate in CAP.
Key findings from the CAP Survey are highlighted below.
Vulnerable households – CAP participants were likely to have vulnerable household members. Twenty-five percent of participants had a child age five or younger in the home, 38 percent had an elderly member age 60 or older, and 41 percent had a disabled household member.
Income source – While 73 percent of CAP participants reported that they received non-cash benefits in the past year, 43 percent reported that they received public assistance, 28 percent reported that they received retirement income, and 26 percent reported that they received wages or self-employment income. Nonparticipants were less likely to report that they received non-cash benefits and public assistance.

www.appriseinc.org Executive Summary
APPRISE Incorporated Page xiv
Unemployment – When asked whether someone in the household was unemployed and looking for work in the past 12 months, 32 percent of CAP participants and 32 percent of nonparticipants said that someone in the home had experienced unemployment.
Annual household income – CAP participants were likely to report lower income than
nonparticipants. While 32 percent of CAP participants reported that the household’s annual income was below $10,000, 13 percent of nonparticipants reported that household income was this low. While 15 percent of nonparticipants reported that the annual household income was $30,000 or more, only six percent of participants reported income of $30,000 or more.
CAP awareness – About half of the nonparticipants were aware of the CAP Rate. Those
who were aware were most likely to say that they did not participate because their income was too high or they did not need energy assistance.
CAP understanding – Most CAP participants did not know the level of discount received
on their bill. When asked what percentage discount they received, 89 percent reported that they did not know. However, 88 percent said that they felt they had a good understanding of the CAP program and 81 percent reported that their responsibility was to keep up with their payments.
CAP enrollment – CAP participants were not likely to report that it was difficult to
enroll. Only seven percent said it was somewhat or very difficult to enroll, about the same as CAP program participants in other PA utility CAP programs.
CAP benefits – CAP participants were most likely to report that the most important
benefit of the program was lower energy bills, followed by the ability to keep their energy service, and then by even monthly payments.
CAP impact on affordability – CAP participants reported that the program has helped
with energy bill affordability and affordability of other expenses. While 56 percent of respondents said that it was very difficult to pay their PECO bill prior to CAP participation, only nine percent said it was very difficult while participating. While 31 percent said they had to delay medical or dental service prior to CAP participation, only 18 percent said they had to do so while participating in CAP.
CAP impact on energy bill and usage – When asked to compare their energy bill to
before CAP participation, 68 percent said that their bill was lower. When asked to compare usage, 36 percent said their usage was lower, 45 percent said there was no change, and 15 percent said it was higher.
LIHEAP – While 79 percent of participants reported that they applied for LIHEAP in
the past 12 months, 50 percent said that they received it. Those who did not apply were most likely to say the reason was that they did not need it, they forgot or did not get around to applying, or they missed the deadline.

www.appriseinc.org Executive Summary
APPRISE Incorporated Page xv
CAP importance and satisfaction – Participants were likely to report that the CAP was
very important. While 85 percent said it was very important in helping them to meet their needs, 9 percent said it was somewhat important. Ninety-five percent said that they were very or somewhat satisfied with the program.
CAP Impacts Analysis
The CAP Impacts Analysis showed that CAP had large positive impacts on energy affordability, CAP participants improved their payment coverage in comparison to the later enrollees and nonparticipants, and that collections actions and costs declined significantly. However, many CAP participants, especially those in the lowest poverty groups, had energy burdens above the PUC targeted level. Key findings from the data analysis are summarized below.
CAP Retention: Most customers who had a bill in a particular month continued to have a CAP bill, indicating that customers usually did not leave CAP because they found it not beneficial, they no longer needed assistance, or their income increased. Of the 2011 CAP participants, between 89 and 93 percent of those who had a bill each month participated in CAP. Of the 2010 enrollees, between 97 and 99 percent of those who had a bill each month continued to participate in CAP.
Arrearage Forgiveness: Among the 2010 CAP enrollees who had arrearages, 96 percent received arrearage forgiveness in the year following enrollment. They received an average of 7.4 forgiveness payments, and an average of $325 in forgiveness.
Affordability: The Pennsylvania PUC has set energy burden targets for CAP participants. The analysis showed that while 70 percent of full year 2011 CAP participants had an energy burden at or below the PUC target, 30 percent had an energy burden above the target. While 84 percent of those with income at or below 25 percent of the poverty level had an energy burden above the target, 17 percent of those with income between 126 and 150 percent of the poverty level had an energy burden above the target. While 33 percent of those with electric baseload service had an energy burden above the target, 17 percent of those with electric heating or electric and gas service had an energy burden above the target.
Affordability Impacts: The CAP had positive affordability impacts for the 2010 enrollees. Net reductions in total charges averaged $551 for electric baseload participants, $419 for electric heating participants, and $535 for electric and gas participants. Net reductions in energy burden were five percentage points for electric baseload customers, three percentage points for electric heating customers, and four percentage points for electric and gas customers. Customers with income below 25 percent of the poverty level had the greatest reduction in energy burdens.
Bill Payment Compliance: The analysis showed that 41 percent of 2011 CAP participants paid at least 90 percent of their full CAP bill. Bill coverage rates improved

www.appriseinc.org Executive Summary
APPRISE Incorporated Page xvi
for 2010 CAP enrollees in the year after they enrolled in the program. While 59 percent of this group paid at least 90 percent of their bill in the year prior to enrollment, 70 percent paid at least 90 percent of their bill in the year following enrollment. Customers made less cash payments and received less LIHEAP assistance, but they covered a greater percentage of their bill due to the large decline in charges after enrollment.
LIHEAP Assistance: Of the 2011 full year CAP participants, 11 percent of electric baseload customers, 40 percent of electric heating customers, and 39 percent of electric and gas customers received LIHEAP assistance in 2011. The 2010 enrollees were less likely to receive LIHEAP after enrolling in CAP. While 17 percent of electric baseload customers received LIHEAP in the year prior to enrollment, 10 percent received LIHEAP in the year following enrollment. While 50 percent of electric heating customers received LIHEAP in the year prior to enrollment, 40 percent received LIHEAP in the year following enrollment. While 51 percent of electric and gas customers received LIHEAP in the year prior to enrollment, 42 percent received it in the year following enrollment. However, there were large increases in the percent of the comparison groups that received LIHEAP. LIHEAP assistance averaged approximately $250 for customers who received grants in 2011.
Collections Impact: There was a significant reduction in the number of collections actions experienced by 2010 CAP enrollees in the year following enrollment. While these customers averaged a total of 24 collections actions in the year prior to enrollment, they experienced an average of 18 actions in the year following enrollment. The net change was a reduction of nine actions and a savings of $191.
Key Findings
Key findings relating to program coordination, CAP affordability, and PECO’s newly proposed rate changes5 are summarized below.
1. Program Coordination PECO’s Universal Service Programs and other low-income programs are coordinated to help their low-income customers achieve energy affordability. Some of the examples of how these programs are coordinated are as follows. High usage CAP customers are targeted for LIURP. LIHEAP recipients are auto-enrolled in CAP and auto-re-certified when the LIHEAP
program parameters allow for CAP eligibility determination. CARES customers are referred to all Universal Service Programs and additional
program and services for which they are eligible.
5 If approved, the rate changes would be implemented in 2013.

www.appriseinc.org Executive Summary
APPRISE Incorporated Page xvii
PECO views its programs as a portfolio of services that together help their low-income customers attain an affordable energy bill.
2. CAP Affordability One of the key findings in this report was that a significant percentage of lower tier CAP participants do not reach the PUC affordability targets after receiving the CAP discount. The reasons that many customers do not meet the PUC target are the structure of the CAP discount and the cost controls that limit the discount to the first 650 kWh or 750 kWh of usage. Because a usage analysis was not part of this evaluation, we cannot determine what percentage of the customers exceed the target due to high usage.
PECO chose the discount design and limited the discount to the first 650 or 750 kWh for the following reasons. PECO believes that customers should bear some responsibility for controlling their
usage. The fact that the discount is eliminated for usage above a certain level should provide a large incentive for customers to conserve energy and to participate in LIURP by positively responding to PECO contact attempts or by proactively requesting LIURP services.
PECO has a responsibility to their other ratepayers to control the costs of the CAP Rate. The annual cost for the average electric non-heater was $58 in 2011 and is projected to be $69 in 2013, and the average cost for the electric heater was $112 in 2011 and is projected to be $133 in 2013. PECO imposes the maximum usage limit to balance the benefits for the CAP customers with these costs that the other ratepayers bear.
However, PECO has taken several steps to increase affordability for CAP customers. These steps include the following. The usage limit for the CAP discount was increased from 500 kWh to 650 kWh (and
to 750 kWh for lower tier CAP Rate customers in the summer) in 2009. This change was in response to the 2006 Universal Services Program evaluation and general increases in usage over time. PECO continually monitors CAP costs to determine what adjustments need to be made. The analysis in this report showed that these changes did have a positive impact on affordability, as the 2011 participants were less likely to have energy burdens above the PUC target than the 2004 participants.
PECO introduced an In Program Arrearage Forgiveness Program (IPAF) in 2011. This program is in addition to the pre-program arrearage forgiveness that CAP participants receive. The IPAF was a one-time forgiveness for CAP customers who had in program arrearages of more than $1,000. The program forgave arrearages down to a level of $1,000, and then asked the customer to pay the rest of the arrearages at a rate of $16.67 per month over five years to pay back the remaining

www.appriseinc.org Executive Summary
APPRISE Incorporated Page xviii
$1,000 in arrearages. There were approximately 16,000 customers who received this benefit and the total amount forgiven was approximately $25 million.6
PECO piloted an in-home display pilot with 200 CAP participants in 2011. This
device enables customers to better monitor their usage. PECO will examine whether the program helps customers to control their usage.
PECO leverages other assistance programs and provides outreach efforts for internal and external programs and services to help customers attain energy affordability. Some examples of the other programs that PECO has recently provided are described below.
o Government Grant Assistance Program (GGAP) – PECO provides matching
toward governmental grants to help low-income households who are in danger of service termination or who have been terminated. This match serves to make up for funding that has been reduced as a result of customer MEAF contributions declining with the poor economy.
o LEAP – PECO used Act 129 funding to provide additional energy efficiency services to low-income customers. These services were modeled after PECO’s LIURP because of the success of that program in reducing energy usage.
o Default Service Provider Settlement Agreement Funding – PECO used funding from this settlement to provide additional energy efficiency services to low-income customers. These funds were not required to be spent according to LIURP requirements, so PECO provided this funding to other low-income properties, including multi-family properties, mass metered properties, community centers, and senior centers that serve low-income customers.
o Education and outreach events – PECO attends events that are targeted toward
low-income households, provides CFLs (funded through Act 129) and provides education and information about other programs and services.
o LIHEAP outreach – PECO has increased their outreach for LIHEAP and they have been working with DPW to try to increase the number of customers who receive grants.
3. Rate Changes
PECO began to phase out their Rate RH (electric heating) discount on generation charges for all customers for usage over 600 kWh per month in 2012. This discount will be completely eliminated by the end of 2012. The discount that was phased out was a
6 Approximately 60 percent of these customers are currently on a payment agreement.

www.appriseinc.org Executive Summary
APPRISE Incorporated Page xix
50 percent discount for monthly usage over 600 kWh that totaled between $2 and $3 million in revenue annually, depending on prices and weather. PECO has filed for a change to their 2013 rates to compensate for the elimination of the rate RH discount. This change would increase affordability for CAP customers, and would have the greatest impacts on affordability for the lowest poverty group, highest usage customers. This rate change, if approved, would apply the CAP discount up to a maximum usage level of 1,500 kWh in November through April (instead of the current 650 kWh discount limit). As such, the change would provide the greatest benefits to the lowest poverty group CAP customers, as these customers receive the greatest discounts on their usage. The intent of this rate change is to return the lost RH benefits back to the customers, with a redirection of benefits to the lowest income CAP customers.
Recommendations
Recommendations relating to policies and procedures and to program impacts are described below.
Policies and Procedures PECO has created valuable partnerships with local agencies and contractors to implement their Universal Service Programs. The programs are well operated and run efficiently and effectively. Customers receive services that improve affordability, reduce usage, provide emergency assistance, and inform them of other important assistance that is available.
Based on the research that was conducted, we have the following recommendations for improving program performance.
1. Attempt to increase CAP participation by the lowest poverty group households. Participation in CAP was lowest in the group of households with income at or below 25 percent of the poverty level, but this participation has increased since PECO’s last Universal Service Program Evaluation. PECO should continue to work to increase participation among customers in this group. One potential means is to provide increased outreach and application support to customers who indicate that they are in this group but who do not successfully complete the CAP application.
2. Work with CAP call center and agencies to increase LIHEAP penetration. One of the CAP requirements is that customers must sign up for LIHEAP. The CAP Impacts Analysis showed that electric baseload, electric heating, and electric and gas customers were less likely to receive LIHEAP in the year after CAP enrollment as compared to the year prior to CAP enrollment. PECO conducts extensive outreach to inform customers of the availability of LIHEAP. They may be able to increase participation among CAP participants by having the CAP call center check if customer received LIHEAP at the time of application and recertification, and to provide additional reminders to CAP participants about the CAP requirement for LIHEAP application.

www.appriseinc.org Executive Summary
APPRISE Incorporated Page xx
3. Require a budget bill for all customers. PECO currently requires a budget bill for CAP Rate A, B, and C customers, and encourages D and E participants. PECO should consider requiring all CAP participants to have a budget bill as this may increase payment regularity by those customers. The CAP Impacts Analysis showed that CAP D and E customers had lower energy burdens, but they were less likely to pay their full CAP bill.
4. Require all MEAF agencies to assist with CAP applications. The MEAF agencies reported that they had different policies with respect to CAP referrals. PECO should have all of the agencies assist customers with the CAP application so that there is a one-stop process for customers and they are more likely to be enrolled in CAP.
5. Require all MEAF agencies to assist with LIHEAP applications. Agencies also reported different practices with respect to LIHEAP application. All MEAF agencies should assist customers with the LIHEAP application to ensure that the customer follows up with the application.
6. Require all MEAF agencies to assist customers with referrals for needed services. MEAF agencies reported different emphasis on other program referrals. While some seemed to only refer customers to a local agency, others seemed to assess customers’ needs and refer them to specific programs that were most needed. All agencies should follow the latter approach to maximize the probability that customers receive needed services.
Program Impacts Survey research and data analysis showed that the CAP has had large positive impacts on energy affordability and customers’ ability to meet their energy needs. This section highlights opportunities for improved program impact.
1. Try to increase affordability for lowest poverty group participants. The CAP Impacts Analysis showed that CAP participants with income below 25 percent of the poverty level are most likely to exceed the PUC energy burden target. CAP B customers with income below 25 percent of the poverty level receive large CAP discounts. However, the electric customers face limits on the amount of usage that is discounted. PECO should investigate what percent of CAP B customers reach the maximum usage limit for the discount (a usage analysis was not part of this evaluation) and consider increasing that limit to increase affordability for this lowest income group.
2. Target lowest income CAP customers who exceed CAP usage discount limits for LIURP. PECO CAP customers are targeted for LIURP, and 97 percent of 2010 LIURP participants were CAP participants. PECO should particularly target the CAP B participants with usage that exceeds the amount that is discounted. Such additional targeting may help to reduce the percent of these customers that exceed the PUC energy burden target.
www.appriseinc.org Introduction
APPRISE Incorporated Page 1
I. Introduction
PECO has Universal Service Programs to help low-income residential customers who express or demonstrate difficulty paying their monthly energy bills. APPRISE conducted a process and impact evaluation of the programs to assess how the programs are performing and how they can be modified to increase their efficiency and effectiveness. This report provides results from the evaluation of these programs.
A. Background
PECO has implemented a set of Universal Service Programs to meet requirements set by Pennsylvania’s electric and gas restructuring legislation and various Public Utility Commission orders and agreements. The Universal Service goals are as follows.
To protect consumers’ health and safety by helping low-income customers maintain affordable utility service.
To provide for affordable utility service by making available payment assistance to low-income customers.
To help low-income customers conserve energy and reduce residential utility bills.
To ensure utilities operate Universal Service and energy conservation programs in a cost-effective and efficient manner.
The Universal Service Programs include:
A CAP payment assistance program that is designed to make energy bills more affordable by furnishing payment subsidies.
A LIURP program that is designed to make energy bills more affordable by helping to reduce usage.
A CARES program that is designed to assist households in developing appropriate strategies for maintaining energy service.
A MEAF hardship fund program that is designed to furnish emergency payments to households that cannot pay their energy bills.
www.appriseinc.org Introduction
APPRISE Incorporated Page 2
B. Objectives of the Evaluation
The Bureau of Consumer Services (BCS) of the Public Utility Commission (PUC) has developed standard evaluation questions to guide Universal Service Programs evaluations.
1. Is the appropriate population being served? 2. What is the customer distribution for each program by poverty guidelines? 3. What are the barriers to program participation? 4. What is the distribution of customers by payment plan? 5. What are the barriers to program re-certification? 6. What are the CAP retention rates and why? 7. Is there an effective link between participation in CAP and participation in energy
assistance programs? 8. How effective are CAP control features at limiting program costs? 9. How effective is the CAP and LIURP link? 10. Does CAP participation improve payment behaviors? 11. Does participation in Universal Service Programs reduce arrearages? 12. Does participation in Universal Service Programs decrease service terminations? 13. Does participation in Universal Service Programs lower collections costs? 14. How can Universal Service Programs be more cost-effective and efficient? To address the research issues, we conducted the following evaluation activities.
1. Background Research: Background research consisted of document review and interviews with PECO managers, staff, and contractors.
Document Review – we reviewed all documents related to PECO’s Universal Service programs. This included the following information. o Advisory committee presentations o Call center training and program documentation o CAP participation reports o CAP rate schedules for the past three years o Contractor reviews o Contracts for USP contractors o Customer outreach materials o Management reports and program statistics o Program applications o Reports to the Public Utility Commission o Universal Service Three Year Plan
Interviews – we conducted interviews with managers, staff, and contractors for the
Universal Service Programs. o CAP – We conducted interviews with the CAP call center manager and three
CAP call center representatives. APPRISE randomly picked five representatives from the list of 50 representatives that the call center provided. The call center
www.appriseinc.org Introduction
APPRISE Incorporated Page 3
manager then selected three representatives from this list of five to present a range of experiences. One of the representatives was a team leader in the back office where most of the application processing is done. One was the longest-tenured representative in the front office where the calls are handled, and one was a new representative who just started a few weeks ago.
o LIURP – We conducted interviews with PECO’s LIURP manager and the implementation contractor.
o MEAF – We conducted interviews with representatives at the six MEAF
agencies.
o CARES – We conducted interviews with PECO’s CARES manager and PECO’s three CARES representatives.
2. Customer Needs Assessment: We used data from the 2008-2010 American Community
Survey and PECO’s customer database to develop information on the number of customers who are eligible for CAP, the overall program participation rate, and the participation rate for customers with energy burden above the Public Utility Commission’s guidelines.
3. Customer Survey: We conducted a telephone survey with CAP participants and low-income nonparticipants to assess CAP understanding, bill payment difficulties faced by the population, CAP impact on affordability, and program satisfaction.
4. Impact Analysis: We used billing, payment, and collections data to assess the impact of CAP on affordability, bill payment, and collections actions and costs.
C. Organization of the Report
Five sections follow this introduction. Section II – Customer Needs Assessment: This section provides data and statistics from
the American Community Survey and PECO’s customer and program databases. We provide an analysis of the number of customers who are eligible for CAP and the number of customers who participate in the programs.
Section III – PECO’s Universal Service Programs: This section provides a detailed review of the design and implementation of PECO’s Universal Service Programs.
Section IV – Customer Survey: This section provides a summary of the CAP participant and nonparticipant survey.
Section V – CAP Impacts Analysis: This section provides data and statistics from our analysis of CAP participant and comparison group data. We provide analysis of CAP customer characteristics, CAP retention rates, and arrearage forgiveness. We analyze the

www.appriseinc.org Introduction
APPRISE Incorporated Page 4
impact of the CAP on affordability, bill coverage, energy assistance, and collections actions.
Section VIII – Summary of Findings and Recommendations: This section provides a summary of the key findings and provides recommendations for PECO’s Universal Service programs based on the analyses in this report.
APPRISE prepared this report under contract to PECO. PECO facilitated this research by furnishing program data to APPRISE. Any errors or omissions in this report are the responsibility of APPRISE. Further, the statements, findings, conclusions, and recommendations are solely those of analysts from APPRISE and do not necessarily reflect the views of PECO.

www.appriseinc.org Customer Needs Assessment
APPRISE Incorporated Page 5
II. Customer Needs Assessment
In this section of the report, we assess the eligibility and penetration of PECO’s Customer Assistance Program (CAP).
A. Methodology for Estimating the Population Eligible for CAP Benefits
We developed information on the number and characteristics of PECO’s low-income population by extracting data from the 2008-2010 American Community Survey (ACS) 3-year Public Use Microdata Sample (PUMS).
The following procedures were implemented. Data: We used the 2008-2010 ACS 3-year PUMS. These data include information on
household size, income, and energy bills for areas with 20,000 or more individuals.
Geography: We extracted households from six counties – Philadelphia, Montgomery, Delaware, Chester, Bucks, and York – to represent the PECO customer base.
Electric and Gas Service – We used the ACS data to identify those households that paid an electric or gas bill to a utility company.7
Income Eligible Customers – We used ACS data on household size and income, in conjunction with federal poverty guideline data, to construct the poverty ratio for each household and identify those households that were income eligible for CAP benefits.
Energy Bills – We used ACS data on electric and gas costs.
Energy Burden – We estimated the energy burden for each household by comparing the energy bill to an estimate of income.
Targeted Customers – We compared energy burdens for income-eligible households with the PUC targeted energy burden thresholds to identify households that should be targeted by the CAP program.8
These procedures furnished a dataset that allowed us to examine the population of PECO customers that are income-eligible for CAP and that should be targeted for the CAP program according to PUC guidelines. In addition to the PECO population, we also prepared similar data for the remaining low-income households in Pennsylvania so that the CAP penetration rates for PECO could be compared to CAP penetration rates for the rest of Pennsylvania’s low-income customers.
7 We excluded those households that reported that they did not pay an electric or gas bill. 8 The energy burden targets vary by poverty level and fuel type. For electric nonheating customers, we used burden targets of 3.5% for households at 0-50 percent of poverty, 5.0% for households at 51-100 percent of poverty, and 6.5% for households at 101 to 150 percent of poverty.
www.appriseinc.org Customer Needs Assessment
APPRISE Incorporated Page 6
B. Estimating the Population Eligible for CAP Benefits
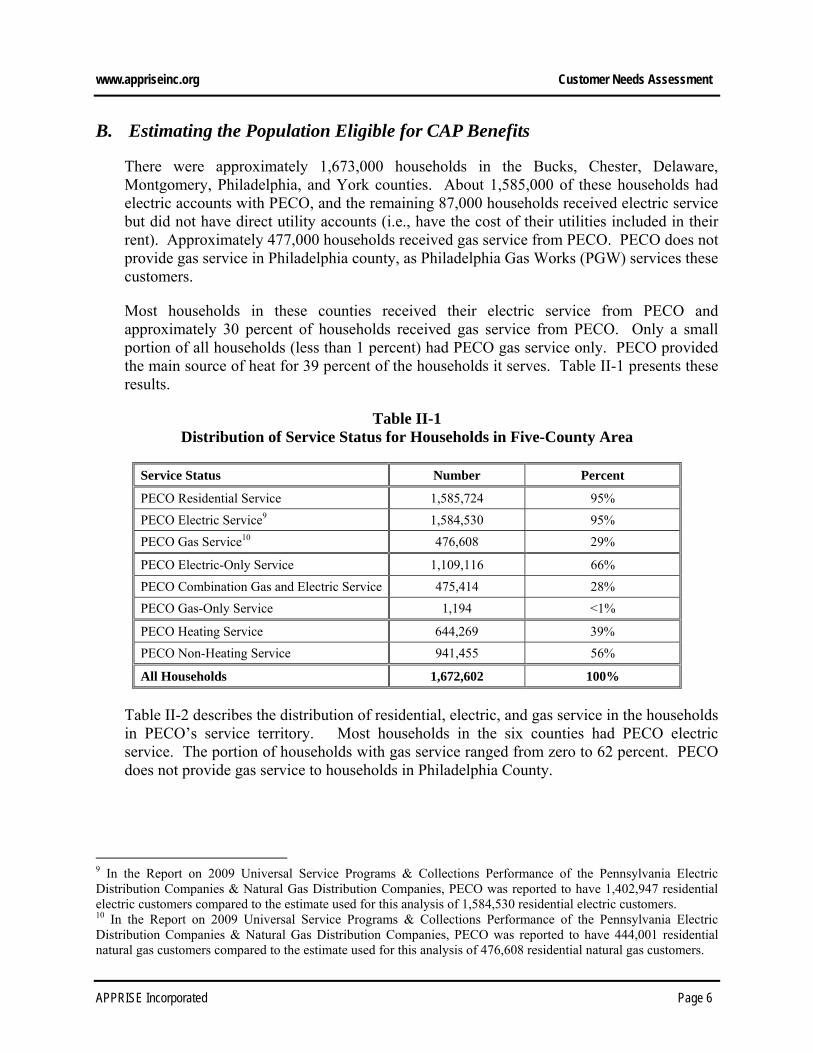
There were approximately 1,673,000 households in the Bucks, Chester, Delaware, Montgomery, Philadelphia, and York counties. About 1,585,000 of these households had electric accounts with PECO, and the remaining 87,000 households received electric service but did not have direct utility accounts (i.e., have the cost of their utilities included in their rent). Approximately 477,000 households received gas service from PECO. PECO does not provide gas service in Philadelphia county, as Philadelphia Gas Works (PGW) services these customers.
Most households in these counties received their electric service from PECO and approximately 30 percent of households received gas service from PECO. Only a small portion of all households (less than 1 percent) had PECO gas service only. PECO provided the main source of heat for 39 percent of the households it serves. Table II-1 presents these results.
Table II-1 Distribution of Service Status for Households in Five-County Area
Service Status Number Percent
PECO Residential Service 1,585,724 95%
PECO Electric Service9 1,584,530 95%
PECO Gas Service10 476,608 29%
PECO Electric-Only Service 1,109,116 66%
PECO Combination Gas and Electric Service 475,414 28%
PECO Gas-Only Service 1,194 <1%
PECO Heating Service 644,269 39%
PECO Non-Heating Service 941,455 56%
All Households 1,672,602 100%
Table II-2 describes the distribution of residential, electric, and gas service in the households in PECO’s service territory. Most households in the six counties had PECO electric service. The portion of households with gas service ranged from zero to 62 percent. PECO does not provide gas service to households in Philadelphia County.
9 In the Report on 2009 Universal Service Programs & Collections Performance of the Pennsylvania Electric Distribution Companies & Natural Gas Distribution Companies, PECO was reported to have 1,402,947 residential electric customers compared to the estimate used for this analysis of 1,584,530 residential electric customers. 10 In the Report on 2009 Universal Service Programs & Collections Performance of the Pennsylvania Electric Distribution Companies & Natural Gas Distribution Companies, PECO was reported to have 444,001 residential natural gas customers compared to the estimate used for this analysis of 476,608 residential natural gas customers.

www.appriseinc.org Customer Needs Assessment
APPRISE Incorporated Page 7
Table II-2 Distribution of Service Type for Households in PECO Service Territory
By County
County
All Households
PECO Residential Service
PECO Electric Service
PECO Gas Service
N N % N % N %
Bucks 228,447 221,838 97% 221,624 97% 77,554 34%
Chester 183,183 177,886 97% 177,602 97% 69,513 38%
Delaware 206,126 197,957 96% 197,736 96% 95,066 46%
Montgomery 308,218 295,297 96% 295,122 96% 129,998 42%
Philadelphia 578,990 530,329 92% 530,329 92% 0 0%
York 167,638 162,417 97% 162,117 97% 104,477 62%
Total Service Territory
1,672,602 1,585,724 95% 1,584,530 95% 476,608 29%
PECO provided heating service for approximately half of the customers served in Bucks Chester, and Delaware counties and almost 60 percent of those in Montgomery county. In Philadelphia county, PECO provided heating service for only 12 percent of households. PECO provided heating service for approximately 644,000 households in its territory. Table II-3 describes this distribution.
Table II-3 Distribution of Heating Service for Households in PECO Service Territory
By County
County
PECO Residential
Service
PECO Heating Service
PECO Non-Heating
Service
Number Number Percent Number Percent
Bucks 221,838 107,395 48% 114,443 52%
Chester 177,886 88,880 50% 89,006 50%
Delaware 197,957 105,841 53% 92,116 47%
Montgomery 295,297 166,844 57% 128,453 44%
Philadelphia 530,329 65,088 12% 465,241 88%
York 162,417 110,221 68% 52,196 32%
Total Service Territory
1,585,724 644,269 41% 941,455 59%
C. Analysis of Customers Income Eligible for CAP
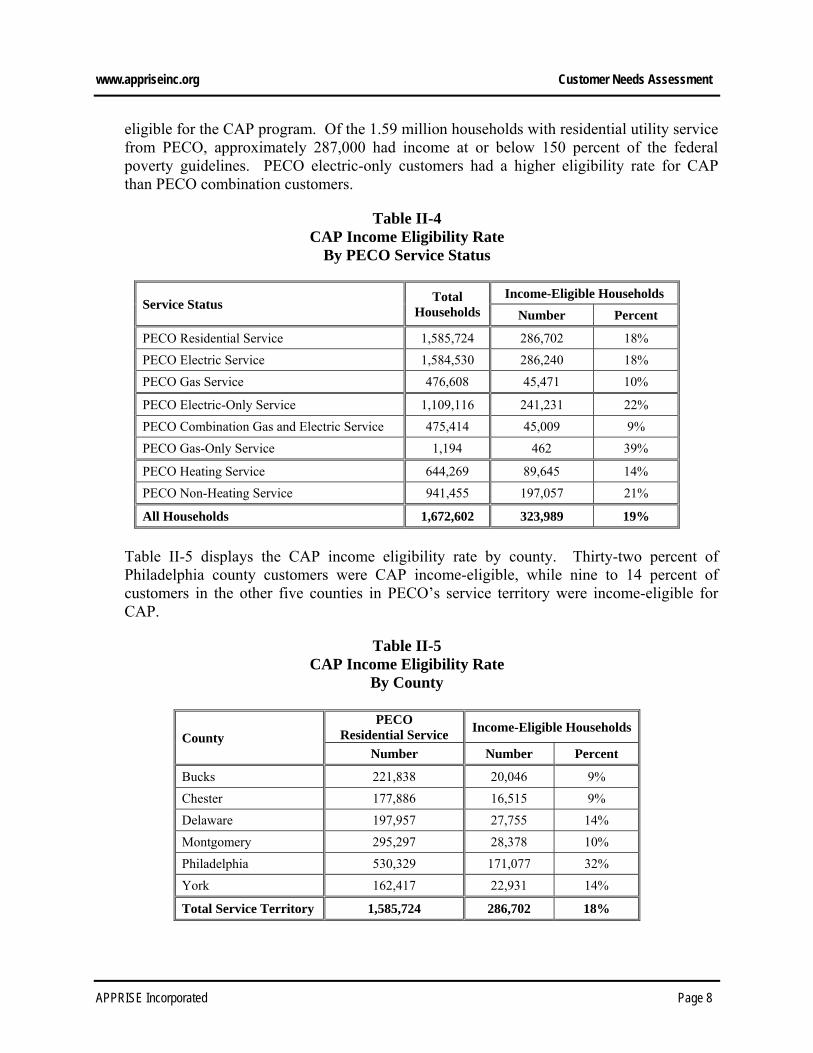
Table II-4 presents data on income-eligible households by service type and heating service. We estimated that 18 percent of all households with PECO residential service were income-
www.appriseinc.org Customer Needs Assessment
APPRISE Incorporated Page 8
eligible for the CAP program. Of the 1.59 million households with residential utility service from PECO, approximately 287,000 had income at or below 150 percent of the federal poverty guidelines. PECO electric-only customers had a higher eligibility rate for CAP than PECO combination customers.
Table II-4 CAP Income Eligibility Rate
By PECO Service Status
Service Status Total
Households
Income-Eligible Households
Number Percent
PECO Residential Service 1,585,724 286,702 18%
PECO Electric Service 1,584,530 286,240 18%
PECO Gas Service 476,608 45,471 10%
PECO Electric-Only Service 1,109,116 241,231 22%
PECO Combination Gas and Electric Service 475,414 45,009 9%
PECO Gas-Only Service 1,194 462 39%
PECO Heating Service 644,269 89,645 14%
PECO Non-Heating Service 941,455 197,057 21%
All Households 1,672,602 323,989 19%
Table II-5 displays the CAP income eligibility rate by county. Thirty-two percent of Philadelphia county customers were CAP income-eligible, while nine to 14 percent of customers in the other five counties in PECO’s service territory were income-eligible for CAP.
Table II-5 CAP Income Eligibility Rate
By County
County
PECO Residential Service
Income-Eligible Households
Number Number Percent
Bucks 221,838 20,046 9%
Chester 177,886 16,515 9%
Delaware 197,957 27,755 14%
Montgomery 295,297 28,378 10%
Philadelphia 530,329 171,077 32%
York 162,417 22,931 14%
Total Service Territory 1,585,724 286,702 18%

www.appriseinc.org Customer Needs Assessment
APPRISE Incorporated Page 9
Table II-6 displays the poverty distribution for CAP-eligible households. The table shows that about 27 percent of electric only and 22 percent of combination customers who were eligible for CAP had income at or below 50 percent of the poverty level.
Table II-6 Distribution of Households
By Service Type and Poverty Group
Poverty Group (Cap Tier)
Electric-Only Combination Gas-Only
Number Percent Number Percent Number Percent
0% -25% (A,B) 40,301 17% 5,204 12% 0 0%
26% -50% (C) 24,724 10% 4,716 10% 0 0%
51% -75% (D) 36,583 15% 5,327 12% 65 14%
76%-100% (D1) 46,055 19% 9,126 20% 209 45%
101%-125% (E) 48,229 20% 9,811 22% 78 17%
126% - 150% (E1) 45,339 19% 10,825 24% 110 24%
Total Income Eligible 241,231 100% 45,009 100% 462 100%
Of all CAP income-eligible households with electric service, 26 percent had income at or below 50 percent of the poverty level, 34 percent between 51 and 100 percent of the poverty level, and 40 percent between 101 and 150 percent of the poverty level. These results are presented in Table II-7.
Table II-7 Distribution of Households with Electric Service
By Poverty Group
Poverty Group (Cap Tier) Households With Electric Service
Number Percent
0% -25% (A,B) 45,505 16%
26% -50% (C) 29,440 10%
51% -75% (D) 41,910 15%
76%-100% (D1) 55,181 19%
101%-125% (E) 58,040 20%
126% - 150% (E1) 56,164 20%
Total Income Eligible 286,240 100%
Table II-8 displays the distribution of households with electric service by poverty group and county. The table shows that 18 percent of CAP-eligible households in Bucks and York counties had income below 50 percent of the poverty level, compared to 23 to 25 percent in Chester, Delaware, and Montgomery, and 29 percent in Philadelphia county.

www.appriseinc.org Customer Needs Assessment
APPRISE Incorporated Page 10
Table II-8 Distribution of Households with Electric Service
By Poverty Group and County
Poverty Group (Cap Tier)
County
Bucks Chester Delaware Montgomery Philadelphia York
N % N % N % N % N % N %
0% -25% (A,B) 2,176 11% 1,974 12% 3,877 14% 4,698 17% 30,596 18% 2,184 10%
26% -50% (C) 1,302 7% 1,773 11% 3,018 11% 2,254 8% 19,227 11% 1,866 8%
51% -75% (D) 2,519 13% 1,852 11% 2,834 10% 3,363 12% 28,848 17% 2,494 11%
76%-100% (D1) 3,975 20% 2,449 15% 5,733 21% 4,632 16% 33,619 20% 4,773 21%
101%-125% (E) 4,864 24% 4,063 25% 6,782 24% 5,879 21% 30,979 18% 5,473 24%
126% - 150% (E1) 5,106 26% 4,331 26% 5,479 20% 7,515 27% 27,808 16% 5,925 26%
Total Income Eligible
19,942 100% 16,442 100% 27,723 100% 28,341 100% 171,077 100% 22,715 100%
Table II-9 displays the percentage of households with gas service within six CAP tier groups. Twenty-one percent of gas households had annual income at or below 50 percent of the poverty level, 33 percent had income between 51 and 100 percent, and 46 percent had income between 101 and 150 percent.
Table II-9 Distribution of Households with Gas Service
By Poverty Group
Poverty Group (Cap Tier) Households With Gas Service
Number Percent
0% -25% (A,B) 5,204 11%
26% -50% (C) 4,716 10%
51% -75% (D) 5,392 12%
76%-100% (D1) 9,335 21%
101%-125% (E) 9,889 22%
126% - 150% (E1) 10,935 24%
TOTAL Income Eligible 45,471 100%
Table II-10 displays the poverty level distribution by county for households with gas service. Nineteen to 24 percent of low-income households had income below 50 percent of poverty.

www.appriseinc.org Customer Needs Assessment
APPRISE Incorporated Page 11
Table II-10 Distribution of Households with Gas Service
By Poverty Group and County
Poverty Group (Cap Tier)
County
Bucks Chester Delaware Montgomery York
N % N % N % N % N %
0% -25% (A,B) 363 6% 705 16% 1,251 10% 1,306 15% 1,579 11%
26% -50% (C) 714 13% 337 7% 1,508 12% 761 9% 1,396 10%
51% -75% (D) 663 12% 686 15% 1,391 11% 1,097 13% 1,555 11%
76%-100% (D1) 1,623 29% 837 19% 2,631 22% 1,393 16% 2,851 20%
101%-125% (E) 1,038 18% 735 16% 2,665 22% 1,967 22% 3,484 24%
126% - 150% (E1) 1,265 22% 1,204 27% 2,672 22% 2,250 26% 3,544 25%
Total Income Eligible
5,666 100% 4,504 100% 12,118 100% 8,774 100% 14,409 100%
D. Analysis of Customers Targeted for CAP
A household’s energy burden is the ratio of total home energy costs to total income. Energy burden is an indicator of the affordability of a household’s energy costs. This section presents data on the energy expenditures and burden for households served by PECO who were income-eligible for CAP. The energy costs and burden described in the following tables is the ratio of the cost of electric and/or gas service from PECO to a household’s income.
The Pennsylvania Public Utility Commission has established standards for appropriate energy burdens for CAP participants.
Electric nonheating o 0 - 50% of poverty: 2%-5% of income o 51 - 100% of poverty: 4%-6% of income o 101 - 150% of poverty: 6%-7% of income
Gas heating
o 0 - 50% of poverty: 5%-8% of income o 51 - 100% of poverty: 7%-10% of income o 101 - 150% of poverty: 9%-10% of income.
Electric heating or gas heating and electric nonheating combined
o 0 - 50% of poverty: 7%-13% of income o 51 - 100% of poverty: 11%-16% of income o 101 - 150% of poverty: 15%-17% of income

www.appriseinc.org Customer Needs Assessment
APPRISE Incorporated Page 12
This section uses the midpoint of these standards in presenting the number and percentage of CAP income-eligible households exceeding the “target energy burden.”
For households with electric-only baseload service, the number and percentage presented includes those above 3.5 percent, 5.0 percent, and 6.5 percent, for the three groups (0-50%, 51-100%, and 101-150% of the federal poverty guidelines), respectively. For households with electric heating or combination electric and gas service from PECO, the targets are 10.0 percent, 13.5 percent, and 16.0 percent, respectively. For households with only gas service from PECO, the targets are 6.5 percent, 8.5 percent, and 9.5 percent, respectively.
Table II-11 displays the median energy costs and burden for all households with PECO residential service who were income-eligible for CAP. CAP income-eligible households with gas and electric service had annual energy costs of $2,710, while those with electric heat reported spending $1,453.
The mean expenditures for the CAP income-eligible households with electric-only baseload service (this includes households with neither gas nor electric heat from PECO) were $1,258. Annual costs for these households created a burden which exceeded the highest BCS target for electric-only service for over half of CAP income-eligible households.
Table II-11 Distribution of Energy Bills and Expenditures for
CAP Income-Eligible PECO Households By Service Status
Service Status
Number of Income-Eligible
Households
PECO Energy Expenditures Median PECO
Energy Burden Mean Median
Electric-Only Baseload 189,429 $1,258 $960 9%
Electric-Only Heating 51,802 $1,453 $1,200 12%
Combination Gas and Electric 45,009 $2,710 $2,280 17%
Gas Only 462 $1,601 $976 6%
All Households 286,702 $1,522 $1,098 10%
E. Characteristics of CAP Recipients
Beginning in 2005, PECO used Department of Public Welfare (DPW) verified LIHEAP data to automatically enroll qualified customers into CAP. They continued to conduct this enrollment when income eligibility for LIHEAP in Pennsylvania was at or below the CAP eligibility limit of 150 percent of poverty. Therefore, PECO was able to automatically enroll customers in CAP in FY 2010, when the LIHEAP eligibility limit was 150 percent of poverty, but not in FY 2009 or FY 2011, when it was greater.

www.appriseinc.org Customer Needs Assessment
APPRISE Incorporated Page 13
Table II-12 shows that the CAP program was serving nearly 139,000 PECO households by December 2011. This was down somewhat from nearly 142,000 in December 2010, possibility due to the change in LIHEAP eligibility. Most of the CAP customers were in CAP Tier D (46% in 2011) and Tier E (33% in 2011). However, there were over 30,000 in CAP Tiers B and C, for customers with income below 50 percent of the poverty level.
Table II-12 Beginning-of-Year CAP Participants
By CAP Rate Tier
CAP Tier
Electric CAP Combination CAP Total CAP (including gas only)
2009 2010 2011 2009 2010 2011 2009 2010 2011
A 33 46 58 0% 12 5 14 0% 45 51 73 0%
B 9,561 8,684 9,905 9% 1,835 1,601 1,630 7% 11,430 10,306 11,565 8%
C 16,273 16,580 15,509 14% 2,699 2,815 2,700 11% 19,015 19,425 18,235 13%
D 52,278 54,378
25,263 22% 9,102 9,302
4,001 17% 61,513 63,794
29,298 21%
D1 29,231 25% 5,316 23% 34,620 25%
E 30,620 36,183
20,277 18% 8,206 11,653
5,599 24% 38,957 48,045
25,981 19%
E1 14,558 13% 4,360 18% 18,972 14%
Total 108,765 115,871 114,801 100% 21,854 25,376 23,620 100% 130,960 141,621 138,744 100%
F. CAP Participation Rates
Overall, 46 percent of eligible households participated in PECO’s CAP in 2009. Approximately 131,000 PECO customers participated in the CAP program, while 287,000 PECO customers were eligible for some level of CAP benefit.
Table II-13 describes the participation rates for each CAP rate tier. CAP program participation was lowest amongst households with income below 25 percent of the poverty level. Twenty-five percent of eligible households with annual income below 25 percent of the federal poverty guidelines participated in the CAP; however, 65 percent of households between 25 percent and 50 percent of the federal poverty guidelines, and 63 percent of households between 50 percent and 100 percent of the federal poverty guidelines participated in the CAP.
Table II-13 Participation Rate By Poverty Level
Poverty Level (Cap Tier)
2009 CAP Participants
CAP Eligible PECO Residential Households
Participation Rates
0% -25% (A,B) 11,475 45,505 25%
26% -50% (C) 19,015 29,440 65%

www.appriseinc.org Customer Needs Assessment
APPRISE Incorporated Page 14
Poverty Level (Cap Tier)
2009 CAP Participants
CAP Eligible PECO Residential Households
Participation Rates
51% -75% (D) 61,513
41,975 63%
76%-100% (D1) 55,390
101%-125% (E) 38,957
58,118 34% 126% - 150%
(E1) 56,274
Total 130,960 286,702 46%
Participation rates for electric and gas customers were quite similar. Table II-14 shows that 22,000 of 45,000 eligible gas customers received CAP benefits and 131,000 of 286,000 eligible electric service customers participated in CAP.
Table II-14 Participation Rate By Service Type
Service Type 2009 CAP
Participants CAP Eligible PECO
Residential Households Participation
Rates
Electric 130,619 286,240 46%
Gas 22,195 45,471 49%
Table II-15 describes the participation rates for CAP eligible households that were identified as having energy burdens greater than targets set forth by the BCS. CAP program participation for targeted households was lowest amongst households with income below 25 percent of federal poverty guidelines. Twenty-five percent of eligible households with annual income below 25 percent of the federal poverty guidelines participated in the CAP, while 67 percent of targeted households between 25 percent and 50 percent of the federal poverty guidelines participated in the CAP.
Table II-15 also shows that more than 100 percent of targeted households between 100 percent and 150 percent of the federal poverty guidelines participated in the CAP. This may result from the structure of PECO’s CAP program, which does not target customers by energy burden. Consequently, many CAP participants, especially those in higher poverty groups, may participate in CAP despite having energy burdens that fall below the PUC targets.
Table II-15 Participation Rate for Targeted Households
By Poverty Level
Poverty Level (Cap Tier)
2009 CAP Participants
CAP Eligible PECO Targeted Residential
Households
Participation Rates
0% -25% (A,B) 11,475 45,423 25%

www.appriseinc.org Customer Needs Assessment
APPRISE Incorporated Page 15
Poverty Level (Cap Tier)
2009 CAP Participants
CAP Eligible PECO Targeted Residential
Households
Participation Rates
26% -50% (C) 19,015 28,195 67%
51% -75% (D) 61,513
31,740 93%
76%-100% (D1) 34,701
101%-125% (E) 38,957
20,670 109%
126% - 150% (E1) 15,146
Total 130,960 175,875 74%
Table II-16 displays participation rates for both electric and gas customers who had energy burdens that exceeded the BCS targets. The table shows that 74 percent of targeted electric customers and 85 percent of targeted gas customers participated.
Table II-16 Participation Rate for Targeted Households
By Service Type
Service Type 2009 CAP
Participants
CAP Eligible PECO Targeted Residential
Households
Participation Rates
Electric 130,619 175,741 74%
Gas 22,195 26,194 85%
Table II-17 shows that PECO has higher CAP participation than other electric utilities in Pennsylvania. Using ACS estimates on the number of households in Pennsylvania with income at or below 150 percent of the FPL and data reported to the PUC on the number of households served by electric utilities in December 2009, we estimated that 46 percent of PECO households who were income-eligible received CAP benefits, while only 25 percent of income-eligible households in other utilities’ service territories participated in CAP.
Table II-17 Participation Rates for Pennsylvania Electric Utilities
Service Type CAP Electric
Service Households CAP Income
Eligible Households Participation
Rates
PECO 130,619 286,240 46%
Other Electric Utilities 150,066 589,883 25%
Total 280,685 876,123 32%
Table II-18 shows that CAP participation was also higher for households receiving gas service from PECO than for those served by other gas utilities in Pennsylvania. The PECO gas CAP participation rate was 49 percent, compared to 37 percent for other gas utilities.

www.appriseinc.org Customer Needs Assessment
APPRISE Incorporated Page 16
Table II-8 Participation Rates for Pennsylvania Gas Utilities
Service Type CAP Gas Service
Households CAP Income
Eligible Households Participation
Rates
PECO 22,195 45,471 49%
Other Gas Utilities 168,774 455,285 37%
Total 190,969 500,756 38%
G. Summary of Customer Needs Assessment
PECO provides utility service to a significant portion of the Pennsylvania’s low-income population. Approximately 287,000 households served by PECO had income at or below 150 percent of the federal poverty guidelines.
This analysis indicated that 46 percent of PECO’s eligible customers participated in the electric CAP and 49 percent participated in the gas CAP. Participation in the electric CAP was lowest in the group of households with income at or below 25 percent of the poverty level, but this participation has increased since PECO’s last Universal Service Program Evaluation. The rate for this group was 16 percent in 2005, and it was 25 percent in 2009. PECO should continue to work to increase participation among customers in this group.
Participation was higher among households identified as having energy burdens above the targets established by the PUC. Overall, 74 percent of targeted electric customers and 85 percent of targeted gas customers participated. However, because participation was not limited to customers with burdens above the target level, some of the participating customers were not in the targeted group.

www.appriseinc.org PECO’s Universal Service Programs
APPRISE Incorporated Page 17
III. PECO’s Universal Service Programs
PECO implemented a set of Universal Service Programs to comply with Public Utility Commission Regulations. The programs are designed for low-income, residential customers who express or demonstrate difficulty paying for their monthly energy bill.
A. Program Overview
PECO’s Universal Service Program includes six components.
1. Customer Assistance Program (CAP) – The Customer Assistance Program, referred to as CAP or CAP Rate, is a discounted residential tariff for low-income, payment-troubled residential customers. Customers with total gross household income less than or equal to 150 percent of the federal poverty level are eligible for the CAP.
2. Low Income Usage Reduction Program (LIURP) – The Low Income Usage Reduction Program (LIURP) provides education, conservation, and weatherization measures to reduce electric and gas usage for customers with income up to 200 percent of the federal poverty level.
3. Matching Energy Assistance Fund (MEAF) – The Matching Energy Assistance Fund (MEAF) is a hardship fund that provides grants to customers who have had their service terminated or who are in danger of termination. Customers are eligible for MEAF grants of no greater than $500 per fuel if their income is at or below 175 percent of the federal poverty level.
4. Customer Assistance and Referral Evaluation Services (CARES) – Customer Assistance and Referral Evaluation Services (CARES) is a referral and information service designed to assist customers who have a temporary personal or financial hardship that prevents the payment of their utility bill. Customers with special needs including senior citizens and customers who receive government-based income (e.g., SSI, SSD) are eligible for CARES.
5. Education-Outreach Programs – PECO conducts outreach to ensure awareness of program benefits. Their methods for outreach include referrals between different Universal Service programs offered by PECO, information on PECO’s website, and staff training at community organizations and health providers. PECO also works with Philadelphia-based community organizations to provide referrals services.
6. External Grant Program Administration (LIHEAP, FEMA, etc.) – PECO helps to support external grant programs and manages a Fuel Fund Hotline that provides information and referrals to customers in crisis. External programs include LIHEAP, PA Area Agencies on Aging, Federal Emergency Management Agency, and other Special Interest Grants.
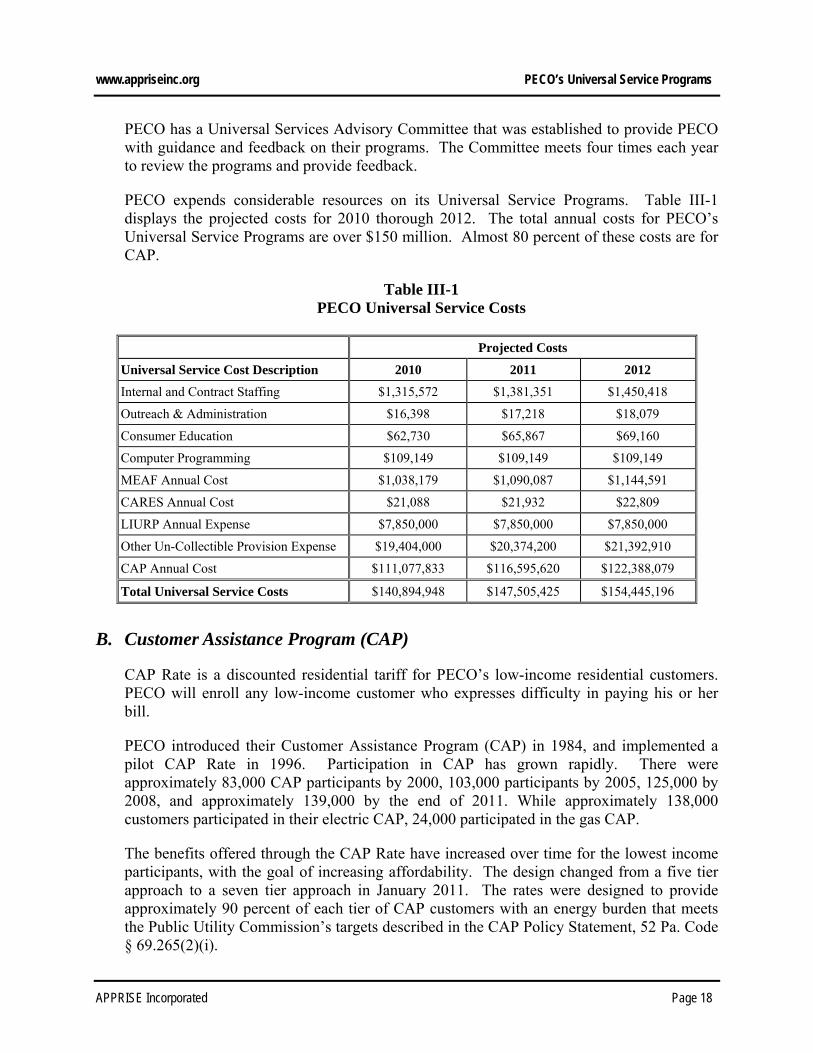
www.appriseinc.org PECO’s Universal Service Programs
APPRISE Incorporated Page 18
PECO has a Universal Services Advisory Committee that was established to provide PECO with guidance and feedback on their programs. The Committee meets four times each year to review the programs and provide feedback.
PECO expends considerable resources on its Universal Service Programs. Table III-1 displays the projected costs for 2010 thorough 2012. The total annual costs for PECO’s Universal Service Programs are over $150 million. Almost 80 percent of these costs are for CAP.
Table III-1 PECO Universal Service Costs
Projected Costs
Universal Service Cost Description 2010 2011 2012
Internal and Contract Staffing $1,315,572 $1,381,351 $1,450,418
Outreach & Administration $16,398 $17,218 $18,079
Consumer Education $62,730 $65,867 $69,160
Computer Programming $109,149 $109,149 $109,149
MEAF Annual Cost $1,038,179 $1,090,087 $1,144,591
CARES Annual Cost $21,088 $21,932 $22,809
LIURP Annual Expense $7,850,000 $7,850,000 $7,850,000
Other Un-Collectible Provision Expense $19,404,000 $20,374,200 $21,392,910
CAP Annual Cost $111,077,833 $116,595,620 $122,388,079
Total Universal Service Costs $140,894,948 $147,505,425 $154,445,196
B. Customer Assistance Program (CAP)
CAP Rate is a discounted residential tariff for PECO’s low-income residential customers. PECO will enroll any low-income customer who expresses difficulty in paying his or her bill.
PECO introduced their Customer Assistance Program (CAP) in 1984, and implemented a pilot CAP Rate in 1996. Participation in CAP has grown rapidly. There were approximately 83,000 CAP participants by 2000, 103,000 participants by 2005, 125,000 by 2008, and approximately 139,000 by the end of 2011. While approximately 138,000 customers participated in their electric CAP, 24,000 participated in the gas CAP.
The benefits offered through the CAP Rate have increased over time for the lowest income participants, with the goal of increasing affordability. The design changed from a five tier approach to a seven tier approach in January 2011. The rates were designed to provide approximately 90 percent of each tier of CAP customers with an energy burden that meets the Public Utility Commission’s targets described in the CAP Policy Statement, 52 Pa. Code § 69.265(2)(i).

www.appriseinc.org PECO’s Universal Service Programs
APPRISE Incorporated Page 19
Program Costs Table III-2A displays the projected CAP costs for 2010 through 2012. Total CAP costs were projected to be over $122 million in 2012. These costs include operation and maintenance of the program, the CAP shortfall, and arrearage forgiveness.
Table III-2A 2010-2012 Projected CAP Costs
Cost Component Projected Costs ($ Millions)
2010 2011 2012
CAP Operation and Maintenance $2.22 $2.29 $2.37
CAP Credits (Shortfall) $88.20 $92.61 $97.24
Arrearage Forgiveness $20.66 $21.69 $22.78
Total CAP Rate Costs $111.08 $116.60 $122.39
Table III-2B displays actual CAP costs for 2009 and 2010. The table shows that the program costs were over $100 million in 2010.
Table III-2B 2009-2010 Actual CAP Costs
2009 CAP Costs ($Millions) 2010 CAP Costs ($Millions)
Electric Gas Total Electric Gas Total
Administration $2.34 $0.48 $2.83 $2.67 $0.51 $3.18
CAP Credits $68.71 $8.39 $77.10 $75.52 $6.67 $82.19
Arrearage Forgiveness $26.84 $0.11 $26.95 $12.65 $2.19 $14.84
Total $97.90 $8.98 $106.87 $90.85 $9.37 $100.22
Administration PECO contracts with a CAP Call Center that is trained to handle all aspects of PECO’s Universal Service Programs. This call center employs approximately 50 staff members, including supervisors, call consultants, and back office personnel. The CAP Call Center has the following responsibilities. Respond to customer questions about CAP. Process applications for enrollment or tier change. Process re-certifications. Remove customers who fail to respond to the recertification request. Make referrals to agencies or CARES. Receive, log, track, and store all mailed or faxed income verification documents. Respond to PUC complaints as required. Review LIHEAP lists for CAP eligibility and enroll customers in CAP if they have not
already done so.

www.appriseinc.org PECO’s Universal Service Programs
APPRISE Incorporated Page 20
Process payment arrangements for CAP Rate customers.
The customer service representative will provide the following information to new CAP customers. Program description Enrollment requirements CAP application PECO’s website
Once a customer enrolls, the customer service representative will send a letter that explains the customer’s tier and discount, and the requirements for staying in the program.
The call center conducts internal quality control reviews. Their quality assurance specialist conducts audits of the customer service representatives. Each representative has a minimum of two audits per week that is completed on their work. Team leaders conduct less formal audits of the representatives. These audits are usually conducted twice per month. Team leaders also conduct monthly coaching sessions with each representative. During the audits, accuracy, performance productivity, and the handling of work items are evaluated. Customer service representatives who are struggling may be placed on an action plan or a performance improvement plan. PECO conducts additional quality assurance reviews on the call center’s income verification process for CAP enrollment and re-certification on a periodic basis and submits written reports that summarize the findings of these reviews. APPRISE reviewed 22 monthly reports that were conducted between March 2010 and December 2011. Each report reviewed between five and 18 verifications. Three of the 22 reports found one or more discrepancies, and 19 found no discrepancies. The discrepancies that were found were as follows. June 2010 – 1 of the 5 reviewed cases had a discrepancy. The Social Security benefit
amount was entered incorrectly, but would not affect the CAP tier.
July 2010 – 2 of the 10 reviewed cases had discrepancies. Both cases involved an error in the amount of Social Security benefits recorded that would not affect the CAP tier.
November 2011 – 2 of 10 reviewed cases had discrepancies. In one case the customer’s
contacts were not updated regarding a CAP reinstatement, and in another case a financial statement was not issued based on income verification received at the time of CAP enrollment.
In all cases recommendations were made to coach the CAP representatives. Eligibility Customers with verified total household gross income at or below 150 percent of the federal poverty level (FPL) are eligible for PECO’s CAP.
www.appriseinc.org PECO’s Universal Service Programs
APPRISE Incorporated Page 21
Requirements Customers must abide by the following requirements to be in the CAP Rate. Application – Customers must complete an application or have been approved through
LIHEAP. They must provide PECO with permission to verify their income with state agencies. PECO may use the Pennsylvania Department of Public Welfare (DPW), the Pennsylvania Department of Revenue, and the Matching Energy Assistance Fund (MEAF) agencies for income verification.
Budget Billing – Customers in certain tiers are required to have budget billing. o Electric CAP A, B, C customers must be on a budget. Electric CAP D and E
customers are encouraged to have a budget. o Gas CAP A/B and C customers must be on a budget. Gas CAP D and E customers
are encouraged to have a budget. Alternate Supplier – CAP customers cannot have an alternate supplier.
Bill Payment – Customers must pay their bills on time and in full each month. If they
do not do so, late charges will be assessed and service may be terminated. Customers are not subject to termination between December 1 and April 1. Customers who accumulate CAP program arrearages are offered a payment arrangement. PECO initiated a new arrearage forgiveness program component in 2011 for arrearages accumulated while on CAP.
Energy Usage – Customers must participate in LIURP if offered by PECO.
LIHEAP – Customers must sign up for LIHEAP.
Income changes – Customers must report any changes in household income to PECO.
Re-certification – Customers must recertify on an annual or bi-annual basis, depending on their CAP tier.
CAP Discounts PECO has updated its CAP rates many times over the past several years as their electric and gas rates have changed, to provide approximately 90 percent of each tier of CAP customers with an energy burden that meets the Commission’s targets.
PECO has seven electric CAP rates. These rates were implemented in January 2011 and have been updated periodically. The rates are described below and shown in Table III-3A.
CAP A: This rate is offered to customers with income at or below 25 percent of the poverty level who have extenuating circumstances. Customers in this CAP tier have a fixed monthly payment ($12 for electric non-heating customers and $30 for electric heating customers) for up to 1,000 kWh in the summer (July, August, and September) and up to 2,000 kWh in the winter if they heat with electricity.

www.appriseinc.org PECO’s Universal Service Programs
APPRISE Incorporated Page 22
Extenuating circumstances are defined as the following. o Health related Injury or illness High medical bills Medically-related usage Death in the family
o Sudden loss of employment o Households containing at-risk individuals Children below 8 Disabled persons Infirm elderly
o Inability to maintain at least two CAP B payment arrangements o High usage related to shelter conditions that are not treatable by LIURP
CAP A enrollment is limited to 7,500 customers.
CAP B: This rate is offered to customers with income at or below 25 percent of the poverty level who do not have extenuating circumstances. These non-heating customers receive a discount of 93 percent on the first 650 kWh of usage and up to 750 kWh of usage in the summer. CAP B heating customers receive a discount of 88 percent up to the same usage limits. All other usage is billed at the regular rates. The minimum bill is $12 for electric non-heaters, $30 for electric heaters, and $12 for electric heaters in the summer.
CAP C: This rate is offered to customers with income between 26 and 50 percent of the poverty level. Non-heating customers receive a discount of 86 percent on the first 650 kWh of usage and up to 750 kWh of usage in the summer. Heating customers receive a discount of 77 percent with the same usage limits. All other usage is billed at the regular rates.
CAP D: This rate is offered to customers with income between 51 and 75 percent of the poverty level. Electric non-heating customers receive a discount of 70 percent and electric heaters receive a discount of 49 percent on the first 650 kWh of usage. All other usage is billed at the regular rates.
CAP D1: This rate is offered to customers with income between 76 and 100 percent of the poverty level. Electric non-heating customers receive a discount of 63 percent and electric heaters receive a discount of 36 percent on the first 650 kWh of usage. All other usage is billed at the regular rates.
CAP E: This rate is offered to customers with income between 101 and 125 percent of the poverty level. Electric non-heaters receive a discount of 39 percent and electric heaters receive a discount of 3 percent on the first 650 kWh of usage. All other usage is billed at the regular rates.

www.appriseinc.org PECO’s Universal Service Programs
APPRISE Incorporated Page 23
CAP E1: This rate is offered to customers with income between 126 and 150 percent of the poverty level. Electric non-heaters receive a discount of 27 percent on the first 650 kWh of usage. All other usage is billed at the regular rates. Electric heaters do not receive a discount.
Table III-3A Electric CAP Discounts
Tier FPL Electric Rate Monthly
Payment or Discount %
Maximum Discount
$ Discount* Usage Discount**
A ≤25%
Extenuating Circumstances
Non-Heating $12.00/Month -- 1,000 kWh
Heating $30.00/Month -- 2,000 kWh (Oct-June)
-- 1,000 kWh (July-Sept)
B ≤25%
Non-Heating 93%
$102.66 (Oct-May) 650 kWh (Oct-June)
$103.53 (June)
$118.87 (July-Sept) 750 kWh (July-Sept)
Heating 88%
$85.57 (Oct-May) 650 kWh (Oct-June)
$98.48 (June)
$113.08 (July-Sept) 750 kWh (July-Sept)
C 26%-50%
Non-Heating 86%
$94.94 (Oct-May) 650 kWh (Oct-June)
$95.74 (June)
$109.93 (July-Sept) 750 kWh (July-Sept)
Heating 77%
$74.87 (Oct-May) 650 kWh (Oct-June)
$86.17 (June)
$98.65 (July-Sept) 750 kWh (July-Sept)
D 51%-75%
Non-Heating 70% $72.27 (Oct-May)
650 kWh $77.92 (June-Sept)
Heating 49% $47.65 (Oct-May)
$54.84 (June-Sept)
D1 76%-100%
Non-Heating 63% $69.55 (Oct-May)
650 kWh $70.13 (June-Sept)
Heating 36% $35.01 (Oct-May)
$40.29 (June-Sept)
E 101%-125%
Non-Heating 39% $43.05 (Oct-May)
650 kWh $43.41 (June-Sept)
Heating 3% $2.92 (Oct-May)
$3.36 (June-Sept)
E1 126%-150% Non-Heating 27% $29.82 (Oct-May) 650 kWh

www.appriseinc.org PECO’s Universal Service Programs
APPRISE Incorporated Page 24
Tier FPL Electric Rate Monthly
Payment or Discount %
Maximum Discount
$ Discount* Usage Discount**
$30.06 (June-Sept)
Heating 0% $0 -- *CAP Rate B non-heating customers have a minimum bill of $12.00 and heating customers have a minimum bill of $30 in October to June and $12 in July through September. **CAP Rate A customers are billed at CAP Rate D rates when then exceed the usage discount maximum. All other customers are billed at regular PECO rates when they exceed the usage discount maximum.
PECO has six gas CAP Rates. They are described below and displayed in Table III-3B.
CAP A/B: This rate is offered to customers with income at or below 25 percent of the poverty level. These customers receive a discount of 79 percent on all charges. Customers have a minimum monthly payment of $25 per month for heating customers and $10 per month for non-heating customers.
CAP C: This rate is offered to customers with income between 26 and 50 percent of the poverty level. These customers receive a discount of 69 percent on all gas charges.
CAP D: This rate is offered to customers with income between 51 and 75 percent of the poverty level. These customers receive a discount of 29 percent on all gas charges.
CAP D1: This rate is offered to customers with income between 76 and 100 percent of the poverty level. These customers receive a discount of 14 percent on all gas charges.
CAP E: This rate is offered to customers with income between 101 and 125 percent of the poverty level. These customers do not receive a gas discount.
CAP E1: This rate is offered to customers with income between 126 and 150 percent of the poverty level. These customers do not receive a gas discount.
Table III-3B Gas CAP Discounts
CAP Tier FPL Discount %
A ≤25% and Extenuating
Circumstances 79%
B ≤25% 79%
C 26%-50% 69%
D 51%-75% 29%
D1 76%-100% 14%
E 101%-125% 0%
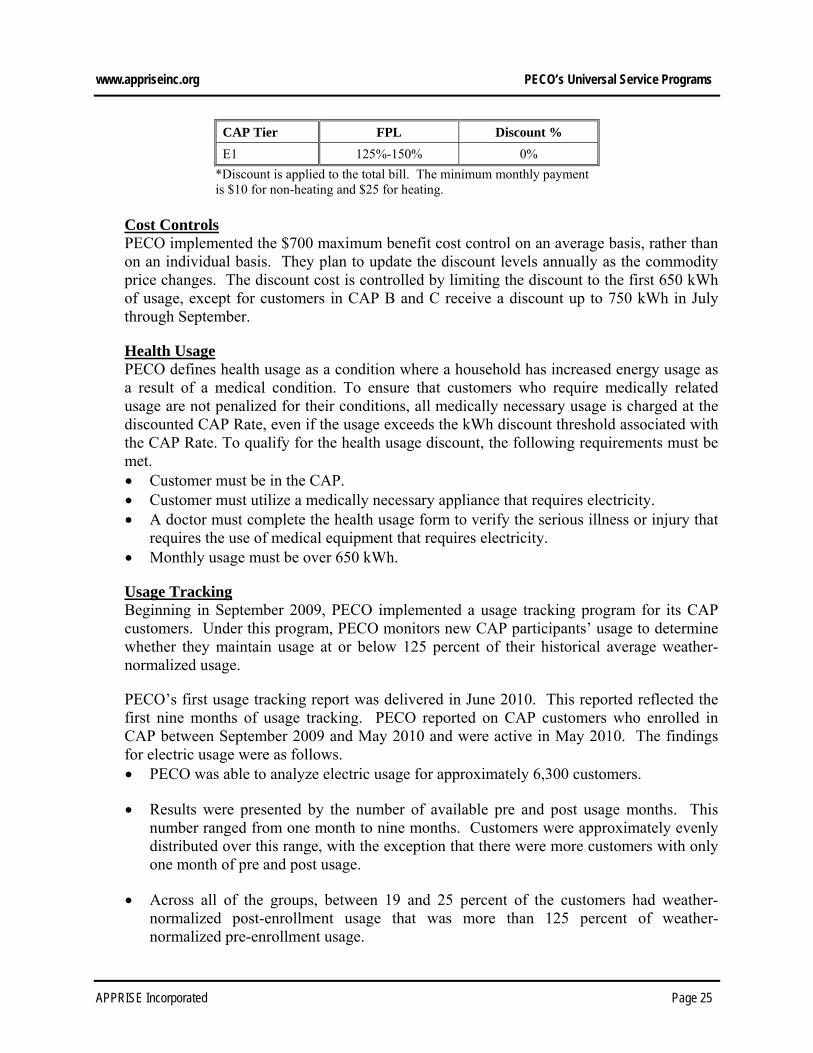
www.appriseinc.org PECO’s Universal Service Programs
APPRISE Incorporated Page 25
CAP Tier FPL Discount %
E1 125%-150% 0%
*Discount is applied to the total bill. The minimum monthly payment is $10 for non-heating and $25 for heating.
Cost Controls PECO implemented the $700 maximum benefit cost control on an average basis, rather than on an individual basis. They plan to update the discount levels annually as the commodity price changes. The discount cost is controlled by limiting the discount to the first 650 kWh of usage, except for customers in CAP B and C receive a discount up to 750 kWh in July through September.
Health Usage PECO defines health usage as a condition where a household has increased energy usage as a result of a medical condition. To ensure that customers who require medically related usage are not penalized for their conditions, all medically necessary usage is charged at the discounted CAP Rate, even if the usage exceeds the kWh discount threshold associated with the CAP Rate. To qualify for the health usage discount, the following requirements must be met. Customer must be in the CAP. Customer must utilize a medically necessary appliance that requires electricity. A doctor must complete the health usage form to verify the serious illness or injury that
requires the use of medical equipment that requires electricity. Monthly usage must be over 650 kWh.
Usage Tracking Beginning in September 2009, PECO implemented a usage tracking program for its CAP customers. Under this program, PECO monitors new CAP participants’ usage to determine whether they maintain usage at or below 125 percent of their historical average weather-normalized usage.
PECO’s first usage tracking report was delivered in June 2010. This reported reflected the first nine months of usage tracking. PECO reported on CAP customers who enrolled in CAP between September 2009 and May 2010 and were active in May 2010. The findings for electric usage were as follows. PECO was able to analyze electric usage for approximately 6,300 customers.
Results were presented by the number of available pre and post usage months. This number ranged from one month to nine months. Customers were approximately evenly distributed over this range, with the exception that there were more customers with only one month of pre and post usage.
Across all of the groups, between 19 and 25 percent of the customers had weather-normalized post-enrollment usage that was more than 125 percent of weather-normalized pre-enrollment usage.

www.appriseinc.org PECO’s Universal Service Programs
APPRISE Incorporated Page 26
The findings for gas usage were as follows. PECO was able to analyze gas usage for approximately 1,700 customers.
Results were presented by the number of available pre and post usage months. This number ranged from one month to nine months. Almost 40 percent of these customers had only one month of pre and post usage.
Across all of the groups, between 12 and 42 percent of the customers had weather-normalized post-enrollment usage that was more than 125 percent of weather-normalized pre-enrollment usage.
These results should be reviewed with the following caveats about usage analysis. When examining energy usage over time, there are always some customers who increase
usage and some who reduce usage. PECO should assess the average change in usage to determine whether usage is increasing on average across all CAP customers.
It is difficult to weather normalize usage for a particular customer with only a few months of usage data available, as one cannot look across all weather patterns. The fact that the analysis is between one and nine months before and after a certain date means that the comparison is across different seasons, and this is a difficult comparison to make.
Use of a comparison group could improve understanding of actual changes in energy usage, controlling for other exogenous factors in addition to weather.
Arrearage Forgiveness PECO provides forgiveness of pre-program arrearages (funds owed to PECO from before the customer enrolled in CAP) if the customer pays the CAP bill on time each month. For each month that the customer pays the PECO bill in full and on time, one-twelfth of their pre-program arrearages is forgiven. A CAP customer is eligible for pre-program arrearage forgiveness only once as a PECO customer. If a customer drops out of CAP, builds up additional arrearages, and then re-enrolls, the customer’s arrearages must be paid off with a deferred payment agreement.
In 2011, PECO introduced an additional In-Program Arrearage Forgiveness Program (IPAF) for forgiveness of arrearages accumulated while on CAP. This was a one-time forgiveness for CAP customers who had in program arrearages of more than $1,000. The program forgave arrearages down to a level of $1,000, and then asked the customer to pay the rest of the arrearages at a rate of $16.67 per month over five years to pay back the remaining $1,000 in arrearages.
There were three different groups targeted for this program. Active CAP Customers – these customers received a letter that explained that their
balance was reduced to $1,000 and that they were placed on the affordable payment plan.

www.appriseinc.org PECO’s Universal Service Programs
APPRISE Incorporated Page 27
Charged off CAP Customers – these customers received a letter that explained that their balance was reduced to $1,000 and that they could contact PECO to be restored if they wanted to do so.
Meter Move CAP Customers – these customers received a letter that explained that they could receive the arrearage forgiveness and affordable payment plan if they allowed PECO to move their meter outside. Despite several attempts, there was very low response to this letter.
There were approximately 16,000 customers who received this benefit and the total amount forgiven was approximately $25 million.
Recruitment and Outreach PECO utilizes a variety of methods to identify low-income residential customers. These strategies include the following. Response to customer telephone inquiries Asking new customers who apply for services if they are interested in information about
Universal Service Programs Reaching out to customers who receive energy assistance Referrals from community groups, utilities, or state agencies Outreach sessions Energy conservation workshops
Community Based Organizations help PECO to promote its CAP.
CAP Intake Customers must complete and sign a CAP application and provide proof of income within ten days to enroll in CAP rate. The customer can complete an application on line, fill it out at PECO, or mail or fax the application. Customers must provide the following information. Social security number for the customer and all household members Proof of income for each household member Completed and signed CAP Rate enrollment PECO’s contracted Universal Service call center handles all income verification for both enrollment and re-certification. The only exception is for CAP Rate A accounts, which are referred to CARES/Universal Services for processing. Acceptable forms of income documentation include the following. SSI, Social Security, and/or Social Security Retirement Award Letter Recent pay stubs (consecutive pay stubs for the past 30 days) Social Security disability award letter Child Support court order or court print out Unemployment determination letter (or last 30 days of check stubs)

www.appriseinc.org PECO’s Universal Service Programs
APPRISE Incorporated Page 28
Previous year’s W-2 or 1040 SE form (if seasonally or self-employed) Employment verification letter DPW award letter Workman’s compensation award letter Social Security Survivors benefit award letter Veterans benefits award letter If the customer does not provide the required information, a CAP Refusal letter is sent to the customer. If the customer provides partial information, a letter is mailed requesting that they provide the missing information, and a 15-day collection exception is issued. After the 15 days have expired, the account is reviewed to determine if the missing information was received. If not, the account is refused for CAP and a system generated letter is sent to the customer advising they did not qualify. If information is received, it is processed and the customer is enrolled in CAP. PECO has worked with the Department of Public Welfare to utilize data of the Commonwealth that can identify and verify program eligibility and participation. In 2005, PECO established parameters for verifying the eligibility of customers who were not already enrolled in CAP. PECO used DPW verified LIHEAP data to automatically enroll qualified customers into CAP Rate and provided notification to each new CAP Rate customer. This contributed to the growth of the CAP Rate population from less than 99,000 to more than 111,000 in less than 12 months.
In years when LIHEAP income eligibility is the same as CAP, 150 percent of the poverty level, PECO will automatically enroll LIHEAP recipients in CAP Rate E. PECO will then notify these customers of the following. Income re-certification requirements LIURP Requirement to report income changes Arrearage forgiveness Consumption limits CAP removal procedures CAP tiers and eligibility based on household size Notice that customers who believe they are eligible for another tier may request CAP
placement review
Pennsylvania increased LIHEAP eligibility to 210 percent of poverty in 2008, which is higher than the CAP 150 percent eligibility limit, so PECO was no longer able to provide this automatic enrollment. The LIHEAP limit was again 150 percent of poverty in FY 2010 and FY 2012 (but was 160 percent in FY 2011), so PECO could implement the automatic enrollment again during these time frames.
Referrals The CAP call center refers customers to agencies that provide funding. The most common referrals are LIHEAP, the United Way, and the Salvation Army. If a customer has a serious

www.appriseinc.org PECO’s Universal Service Programs
APPRISE Incorporated Page 29
medical condition requiring equipment usage or an extreme financially challenging situation, they are referred to PECO’s CARES program. CAP Recertification The CAP requires recertification every year or every two years, depending on the customer’s CAP tier. Electric CAP A customers must have annual income verification. Electric CAP B, C, D, E customers must have income verification every two years. Gas CAP customers must have income verification every two years. The customer is sent a letter 30 days before the CAP enrollment anniversary. The letter informs the customer of the documentation that is required for re-certification. The customer must submit the CAP application and verification of total gross household income. Customers who respond with complete documentation and remain CAP-eligible, are sent a letter confirming that the re-certification process is complete, and reminding the customer of the Universal Service Program requirements. If the customer responds with incomplete information, PECO will send another letter that requests the missing information. If there is no response to the first re-certification letter, PECO sends a second letter that explains the risk of removal from the CAP. Customers who do not complete the re-certification process within 45 days are removed from CAP and returned to the appropriate residential rate. If a customer has received assistance, such as LIHEAP, that is based upon the same income parameters as CAP, and the income verification procedures are acceptable to PECO, the customer may be re-certificated without completing a new CAP Rate application. CAP Removal Customers may be removed from CAP for the following reasons. Over income guidelines Failure to meet program requirements Failure to accept program services Failure to submit to a LIURP audit Failure to complete CAP re-certification Fraud, theft of service, or other misappropriations of service
CAP Collections Strategy PECO begins collections actions as soon as customers are past due, with the goal of having customers keep up with bill payment obligations and avoiding large arrearages that are not manageable. CAP customers who do not pay their bills are subject to termination for non- payment after proper notice procedures are followed. Benefits and safeguards that are provided solely for low-income customers include the following. No deposit is charged for customers with income below 150 percent of the poverty level. CAP customers are provided with more than one payment agreement while on CAP.

www.appriseinc.org PECO’s Universal Service Programs
APPRISE Incorporated Page 30
Low-income customers not on CAP who enter a payment agreement must be enrolled in a monthly budget. Customers at or below 150 percent FPL have a 60-month payback window and customers at or below 200 percent FPL have a 24-month payback window.
PECO does not terminate service to confirmed low-income customers during the winter period (December 1 – April 1).
Program Participation PECO does not have an enrollment limit for the CAP. While the PECO/Unicom merger settlement agreement provided for an initial “provisional maximum participation level” of 125,000 customers, PECO’s Universal Services Advisory Committee recommended that PECO continue to enroll customers beyond this limit.
PECO’s CAP participation targets set in its most recent three-year Universal Services Program plan are displayed in Table III-4. The table shows that actual participation exceeded the targets in 2010 and 2011.
Table III-4 PECO CAP Target Enrollment Levels
Year Enrollment Goal December
Participation
2010 130,000 141,621
2011 135,000 138,744
2012 140,000 --
Table III-5 displays PECO’s CAP participation by CAP tier, as of December 2011. The table shows that only 73 customers were enrolled in CAP A, for customers with income below 25% and special circumstances. However, eight percent of CAP participants, over 11,500 customers were enrolled in rate B for customers with income below 25 percent of the poverty level. The majority of CAP customers were enrolled in tiers D1, E, and E1 for customers with income between 76 and 150% of poverty.
Table III-5 PECO CAP Participation, December 2011
By CAP Tier
CAP Tier Poverty Level Number Percent
A ≤25% 73 0%
B ≤25% 11,565 8%
C 26%-50% 18,235 13%
D 51%-75% 29,298 21%
D1 76%-100% 34,620 25%
E 101%-125% 25,981 19%

www.appriseinc.org PECO’s Universal Service Programs
APPRISE Incorporated Page 31
CAP Tier Poverty Level Number Percent
E1 126%-150% 18,972 14%
Total 138,744 100%
Table III-6 displays participation rates by service type and CAP tier for 2009, 2010, and 2011. The table shows that CAP participation increased in most tiers and overall from 2009 to 2010, but declined slightly in 2011.
Table III-6 PECO CAP Participation
By CAP Tier and Service Type
CAP Tier
December Participation
Electric Combination Gas
2009 2010 2011 2009 2010 2011 2009 2010 2011
A 33 46 58 12 5 14 0 0 1
B 9,561 8,684 9,905 1,835 1,601 1,630 34 21 30
C 16,273 16,580 15,509 2,699 2,815 2,700 43 30 26
D 52,278 54,378
25,263 9,102 9,302
4,001 133 114
34
D1 29,231 5,316 73
E 30,620 36,183
20,277 8,206 11,653
5,599 131 209
105
E1 14,558 4,360 54
Total 108,765 115,871 114,801 21,854 25,376 23,620 341 374 323
Challenges PECO faces the following challenges with respect to the CAP. Identifying and enrolling customers who need assistance as soon as possible. Enrollment by customers with balances over $1,000 has increased. Participation by households with income at or below 50 percent of poverty continues to
be lower than the other poverty level groups. Providing the level of discount needed to bring customers to the affordability level while
maintaining appropriate cost controls is a difficult balance. Many customers continue to face difficulties paying their energy bills even while
receiving the CAP discounts, and they build up additional arrearages while on the program.
Getting participants to respond to recertification requests. CAP customers leaving CAP to go to an alternate energy supplier and then return after a
few months of non-CAP billings.
Successes PECO has continued to enhance and develop the CAP over the years. Accomplishments have included the following.

www.appriseinc.org PECO’s Universal Service Programs
APPRISE Incorporated Page 32
Enhanced CAP outreach. Streamlined enrollment process. Online CAP application process. LIHEAP auto-enrollment and auto-recertification for CAP. Call center dedicated to CAP questions. Improved fax and mail capacity, processing time, and response time for CAP
enrollment, recertification, storage and retrieval of CAP applications, and question fielding at the CAP call center.
Exceeded the PUC CAP enrollment requirements for the past six years. Increased participation by the lowest poverty group customers since the previous
Universal Service Program evaluation. Additional payment agreements for CAP customers who experience a decrease in
income and move to a lower CAP tier. A one-time in-program arrearage forgiveness program to assist customers who built up
additional arrearages while participating in CAP. Prioritization of high usage CAP customers for LIURP. Usage limits on CAP discounts to encourage conservation.
Recommendations The CAP call center representatives had the following recommendations for the CAP. Customers should be given a better initial explanation of the requirements for the
program so that they send the correct information with their application. They suggested an automated telephone system that provides information to customers.
Add telephone attempts before removing vulnerable elderly or fixed-income customers from the program for failure to recertify.
C. Low Income Usage Reduction Program (LIURP)
PECO’s Low Income Usage Reduction Program (LIURP) provides education, conservation, and weatherization measures to assist customers in reducing the amount of electricity and/or gas used in their homes. LIURP targets high-usage, low-income CAP customers. While the program is mandatory for CAP customers, it is also available for other low-income customers with income below 200 percent of the FPL.
LIURP Resources The LIURP budget was $7.825 million in 2009 and is planned to remain at that level through 2013.
Table III-7 PECO LIURP Budget ($Millions)
Year Electric Gas Total
2009 $5.6 $2.225 $7.825
2010 $5.6 $2.225 $7.825

www.appriseinc.org PECO’s Universal Service Programs
APPRISE Incorporated Page 33
Year Electric Gas Total
2011 $5.6 $2.225 $7.825 2012 $5.6 $2.225 $7.825 2013 $5.6 $2.225 $7.825
Table III-8 displays LIURP expenditures by category for 2010. Weatherization measures were 66 percent of the program expenditures and audit and education costs were 26 percent, together making up 92 percent of program costs.
Table III-8 2010 LIURP Expenditures
By Category
Category Amount Spent Percent of Funds
Weatherization Measures $5,212,426 66%
Audit/Education $2,076,924 26%
PECO Administration $553,577 7%
Solar Water Maintenance $7,075 <1%
TOTAL $7,850,002 100%
Program Management and Administration LIURP managers and staff have many years of experience with LIURP. PECO’s analyst is responsible for overseeing overall LIURP production, quality assurance, and the annual Program evaluation. She is also responsible for managing the LIURP budget, refining the Program, and analyzing CMC reports.
CMC has a total of 33 staff members who work on PECO’s LIURP. The following are the key CMC staff. LIURP Manager: The LIURP Manager has 18 years of PECO LIURP experience. She is
responsible for monitoring Program performance, including training, sub-contractor performance and customer satisfaction. She is also responsible for coordinating Program activities, making recommendations for and implementing Program improvements, analyzing Program data, reporting to PECO, financial tracking, and implementation and management of special projects.
LIURP Administrative Project Manager: The LIURP Administrative Project Manager has 17 years of PECO LIURP experience. She is responsible for supervising daily LIURP work activities. She is also responsible for ensuring accurate and timely data input, evaluating training and performance, managing customer service calls, and following up on referrals.

www.appriseinc.org PECO’s Universal Service Programs
APPRISE Incorporated Page 34
LIURP Technical Project Manager: The LIURP Technical Project Manager has 12 years of PECO LIURP experience. He is responsible for managing subcontractors, providing technical assistance to field technicians and customer service representatives, resolution of customer service issues, and monitoring of the audit and quality control procedures.
LIURP Quality Control Supervisor: The LIURP Quality Control Supervisor is responsible for providing training and technical support to field staff and sub-contractors.
CMC meets with PECO monthly for performance reviews and bi-monthly for Program review meetings. PECO conducts monthly site visits and inspections and has regular telephone and/or e-mail contact with CMC.
CMC staff conduct the LIURP audit and develop a work order for additional measures to be installed on subsequent visit(s) by the program subcontractors who assist in the implementation of LIURP. Premier Contractors completes weatherization work, air sealing, insulation, and air
conditioner replacements. Davis Modern Heating completes house heating and water heating repair and
replacement work. McCann Company completes house heating and water heating repair and replacement
work. Kinkaid completes house heating and water heating repair and replacement work. Colonial Electrical installs water heater timers and line voltage thermostats. General Electric delivers energy efficient refrigerators.
Eligibility PECO customers must meet the following criteria to participate in the Program. Residential customer Income requirement
o Income at or below 150 percent of the Federal Poverty Level (FPL), or o Income between 150 and 200 percent of the FPL11
Usage requirements o At least 500 kWh average monthly usage for CAP customers o At least 600 kWh average monthly usage for baseload customers o At least 1,400 kWh average monthly usage for electric heating customers o At least 50 ccf average monthly usage for gas heating customers
Benefits LIURP provides weatherization and conservation measures to promote usage reduction. Energy education tailored to the individual household’s energy use is also provided to facilitate usage reduction.
11 Since 1998, LIURP regulations have permitted companies to spend up to 20 percent of their annual Program budgets on customers with income between 150 and 200 percent of the FPL.

www.appriseinc.org PECO’s Universal Service Programs
APPRISE Incorporated Page 35
The following measures may be provided. Insulation Air sealing Heating system repair or replacement Air conditioner replacement Refrigerator replacement Water heater timer installation Water heater and pipe wraps Line voltage thermostats Faucet aerators Showerheads Smoke detectors Carbon monoxide detectors CFL bulbs
Qualification of Leads PECO sends a quarterly download of high usage, low-income customers to CMC.12 Customers are also referred to LIURP through the following mechanisms. PECO Universal Services staff CAP call center Community Based Organizations (CBOs) Government agencies Prior Program recipients Universal Services Cares Unit
The electronic file downloaded from PECO contains high energy users who are also LIHEAP recipients, Customer Assistance Program (CAP) participants, payment-troubled customers, or customers with multiple payment agreements. CMC reviews the lists and eliminates customers who have received LIURP within the past two years, refused Program services, or moved within the past six months. Typically, after these removals, the remaining customers on the downloaded file are eligible for and receive services from LIURP.
CMC screens all referrals from other sources to determine Program eligibility. If income and usage history are available and the customer is determined to be eligible, CMC enrolls the customer immediately. If income eligibility cannot be determined from PECO’s system, CMC mails income documentation forms to the customer. Typically, 25 to 30 percent of customers referred through other sources are determined to be eligible for and receive services from LIURP.
Referred customers may not receive LIURP services because the customer: Refused LIURP services. Has insufficient usage history.13
12 This is done through a three step process.

www.appriseinc.org PECO’s Universal Service Programs
APPRISE Incorporated Page 36
Has an inactive account. Has income over the eligibility limit. Is non-responsive to contacts by CMC. Has recently, or is planning, to move. Is deceased. Has usage below the required level.14 Is a tenant and has a landlord who will not provide consent.
CMC is required to obtain consent from the landlord to provide services to a tenant. A landlord may not provide approval because he or she wants to choose Program measures or is evicting the tenant. 15 Some landlords never respond to CMC inquiries.
Approximately 90 percent of customers who receive LIURP services are identified through the downloaded list, and about 10 percent through other referrals.
Customer Outreach CMC’s customer service representatives contact potential Program participants by telephone to explain Program services, obtain customer information, and confirm or determine eligibility. If the customer is eligible, an appointment is scheduled for the energy audit. CMC will attempt to make this contact 25 to 30 times by telephone and a minimum of one time by mail over a 90-day period. Information collected during this contact includes the following. Name of person responsible for bill payment Age of each household member Income sources for each household member Income amounts for each household member Property status and, if applicable, landlord contact information Monthly amount of mortgage or rent Housing type Occupation Employment status, marital status and level of education
Job Types There are two different LIURP job types: Baseload and Heating. Baseload jobs focus on a household’s lighting and appliances. Heating jobs include weatherization, insulation, and heating system repair or replacement. Both heating and baseload issues in a household are addressed when necessary.16
13This may be the case if the customer recently moved into the home. 14 There are some hardship cases where PECO makes exceptions to the usage requirement. 15 Landlords are not required to contribute to the cost of LIURP services. 16 Renters do not receive appliance replacement.

www.appriseinc.org PECO’s Universal Service Programs
APPRISE Incorporated Page 37
Service Delivery CMC prioritizes CAP participants for LIURP service delivery. All CAP participants with monthly usage above 500 kWh are considered for LIURP. Those with the lowest income and the greatest CAP benefits receive the highest priority. CMC prioritizes remaining LIURP participants by energy use and income.
The first step in direct service delivery is the Program audit, performed by CMC staff. The auditor verifies the previously reported household characteristics, including income, number of household occupants, age of home, and years of occupancy. The auditor also calculates the average household energy use per day, the energy use for each household appliance, temperature settings, and water temperature. Based on this information, the auditor may wrap the water heater and pipes, and install aerators, smoke detectors, showerheads, and CFLs during this initial audit visit.
CMC schedules the appropriate sub-contractors to complete any necessary major measures, such as insulation, heating system repair or replacement, or new appliances. A work order is sent to the subcontractor to communicate the work that is needed. CMC requires that measures be installed within 30 days of the initial audit.
PECO and the PUC have pre-approved all of the LIURP measures. They have placed no cap on the amount of money spent per home. Smoke detectors and CFLs are much more commonly provided than some of the more costly measures.
Energy Education PECO and CMC designed the energy education portion of LIURP to facilitate customers’ clear understanding of the reasons for high energy use, and to communicate how their behaviors contribute to energy use and energy bills. The auditor provides the primary LIURP energy education session during the initial audit visit. This session lasts at least 30 minutes. Further education is often provided by subcontractors when measures are installed, and by other CMC quality control inspectors during quality control inspections and follow-up telephone calls.
During the initial education session, the educator reviews the customer’s audit results and identifies ways that the customer can modify the behaviors of household members to save energy and money. The auditor and the customer set a monthly usage and bill reduction goal for the household. The educator also provides the customer with an education package, which includes the following materials. Tips for saving energy An energy calculator ‘Hazards of Space Heating’ pamphlet Energy Savers calendar Energy cost estimate form Energy saving recommendations list based on the household’s energy use ‘Does Your Money Run Out’ booklet Referrals to CAP rate and other programs that the customer may be eligible for

www.appriseinc.org PECO’s Universal Service Programs
APPRISE Incorporated Page 38
The auditor reviews these educational materials with the customer, and compares the household’s energy cost estimate form to the household’s actual energy bill. Additionally, the educator refers the customer to programs and agencies that might help him or her meet household needs, and answers any questions the customer may have about the Program or the education session. The educator reviews the measures that have been installed and those that will be installed by subcontractors. In addition, the educator reviews the LIURP follow-up procedures that the customer can expect.
For one year after LIURP services have been provided, PECO and CMC monitor the customer’s energy usage monthly. CMC mails monthly progress letters to customers to highlight any changes in monthly usage, as compared to the customer’s individual goal. Each quarter CMC revises the letters to emphasize energy saving tips that are specific to the current season. CMC provides an additional telephone energy education session to customers who do not meet their monthly average usage goal (MAU) after they receive LIURP services. In some cases an auditor is sent back to the home for reinforcement.
Quality Control Three methods are primarily used for LIURP quality control. An annual evaluation, conducted by an independent program evaluator. Customer satisfaction surveys administered by CMC. Inspections by the CMC Quality Control Manager and PECO’s LIURP Manager.
Additionally, in 2010, PECO hired Pure Energy to conduct quality control inspections on a sample of approximately 300 completed jobs. The findings from the inspections were generally good, within industry standards.
CMC conducts customer satisfaction surveys during post delivery site inspections, by telephone, and by mail. CMC reported that the surveys show customers increased their knowledge of energy conservation through Program participation. Customers reported that they were satisfied with LIURP and with the new appliances that the Program provided.
CMC has two field Quality Control Inspectors who are supervised by the Quality Control Supervisor, who reports to the Quality Control Manager. The Quality Control Manager is also responsible for managing the auditor. A minimum of five percent of the baseload audits are inspected. All of the heating audits are inspected.
The inspector works from an inspection checklist, and has the customer satisfaction survey, the home’s audit results, and the completed work order to assist in the inspection. The inspector also conducts blower door, heating, and carbon monoxide testing, and confirms the presence of all invoiced measures. In addition to post-completion inspections, the inspector sometimes accompanies CMC staff on audits, and sub-contractor staff on installations.
When the inspector finds missed opportunities or small mistakes, he fixes the problem and provides feedback to the individual who performed the work. For larger mistakes, or discrepancies in quantities invoiced and quantities received, the inspector fails the job and

www.appriseinc.org PECO’s Universal Service Programs
APPRISE Incorporated Page 39
allows CMC or subcontractor staff 10 business days to fix the problems and send written confirmation of resolution to the inspector. Depending on the nature of the problem, the inspector may return to the site to re-inspect.
The PECO LIURP manager also randomly selects homes for visits. She visits these homes and confirms that the work listed on the invoice was performed in the home. She also randomly selects and validates LIURP invoices.
The LIURP inspection process helps to ensure high quality work, and highlights areas for potential improvement. Inspection findings led to the addition of LIURP measures including central AC maintenance and an anti-spill switch for heating systems.
Data and Reporting LIURP databases contain the following information. Personal and household demographics Landlord contact information Audit results Quantity and costs of installed measures Referrals made to other programs Post treatment follow-up outreach results Completion dates and usage history Performance scorecard
CMC conducts data entry every week. CMC and PECO check the database for completeness and accuracy. These data are used to generate regular reports, including the following. Completed jobs compared to projected jobs Program costs by category Average cost per job Completed jobs by type Outreach call volume Customer demographics
CMC and PECO monitor Program data monthly and the independent evaluator monitors Program data annually. In addition to this report, CMC and PECO produce an annual report to the PUC.
LIURP Training PECO states in their contract with CMC that they require LIURP staff members to be adequately trained. CMC’s Quality Control Manager assesses the training needs of the CMC field and sub-contractor staff. The CMC Office Manager assesses the training needs of the CMC administrative staff. CMC provides full training to each LIURP staff member at the time of hire, and additional training as needed.

www.appriseinc.org PECO’s Universal Service Programs
APPRISE Incorporated Page 40
CMC provides LIURP staff with diagnostic training through the Pennsylvania College of Technology, state certification, and auditor certification. CMC also sends staff members to Affordable Comfort conferences and provides field technicians with BPI training. PECO provides LIURP staff with training on mainframe connection and procedures, the Universal Service Programs, customer service procedures, and safety hazards. PECO also provides LIURP staff with the opportunity to attend conferences.
Subcontractors only attend trainings that are relevant to the Program measures that they install. CMC provides subcontractors with in-field training as needed.
Program Coordination CMC maintains a LIURP referral list consisting of other Universal Service Programs and state and county agencies that provide assistance to low-income customers. CMC staff make referrals during the initial energy audit, as well as during inspection and post treatment follow-up calls. During the follow-up call, CMC staff members ask customers whether they were able to obtain any benefits from the referrals they were given. Additionally, the CMC auditor provides CAP and LIHEAP applications to customers at the time of the LIURP audit.
Participation in LIURP is a requirement of PECO’s CAP. Historically, PECO and CMC have not enforced this requirement. However, beginning in Fall 2005, a procedure was initiated in which CMC sends a list of CAP customers who refused LIURP services to PECO, and PECO sends a reminder letter that restates CAP requirements. Most customers who received the letter have agreed to receive LIURP services.
One potential method by which PECO could improve program cost effectiveness may be to integrate delivery of baseload services with the publicly funded Weatherization Assistance Program (WAP) or other utility programs. By reducing the total number of visits needed, this coordination could reduce the program costs.17
Program Participation and Services Delivered LIURP service delivery is based upon costs for service delivery and program budgets. LIURP participation for 2010 is shown in the table below.
Table III-9A 2010 LIURP Service Delivery and Expenditures
By Job Type
Job Type # of Jobs % of Jobs Total Cost % of Costs Average Job Cost
Baseload 7,097 78% $1,324,296 26% $187
Electric Heating 221 2% $532,047 10% $2,407
Gas Heating 1,484 16% $3,283,791 64% $2,213
17 PECO attempted to provide coordinated services, but was not able to reach an agreement. CMC currently makes referrals to WAP.

www.appriseinc.org PECO’s Universal Service Programs
APPRISE Incorporated Page 41
Job Type # of Jobs % of Jobs Total Cost % of Costs Average Job Cost
No LIURP Job Costs1 318 4% $0 0% $0
Total 9,120 100% $5,140,135 100% $564
1There were 315 accounts that received education only, and three accounts that received only CFLs from LEEP.
Table III-9B displays 2010 LIURP service delivery by poverty level. The table shows that 24 percent of participants had income below 50 percent of poverty, 48 percent had income between 51 and 100 percent of poverty, 24 percent had income between 101 and 150 percent of poverty, and five percent had income above 150 percent of poverty.
Table III-9B 2010 LIURP Service Delivery
By Poverty Level
Number of Jobs % of Jobs
<=25% 737 8%
26% - 50% 1,459 16%
51% - 100% 4,342 48%
101% - 150% 2,182 24%
151% -175% 257 3%
>175% 143 2%
Mean 79%
Table III-9C displays 2010 LIURP service delivery by account type. The table shows that 97 percent of LIURP participants were CAP participants.
Table III-9C Account Type
Number of Jobs % of Jobs
CAP 8,867 97%
Customer Choice 340 4%
Off Peak 346 4%
Energy Savings The 2010 LIURP evaluation estimated weather-normalized usage for the pre and post-treatment periods and the average energy savings. Table III-10 displays these results by job type. The table shows the following degree-day normalized savings. Baseload jobs had average savings of approximately 1,223 kWh, or 10.8 percent of pre-
treatment usage.

www.appriseinc.org PECO’s Universal Service Programs
APPRISE Incorporated Page 42
Electric heat jobs had average savings of approximately 1,128 kWh, or 5.7 percent of pre-treatment usage.
Gas heat jobs had average savings of approximately 61 ccf, or 5.8 percent of pre-treatment usage.
Table III-10 Average Usage and Savings
# Pre-Use Post-Use Savings % Savings
Electric Baseload (kWh)
Non Normalized 4,055 11,153 10,792 361 3.2%
Degree Day Normalized 4,055 11,370 10,147 1,223 10.8%
Prism Normalized 2,586 11,064 10,097 967 8.7%
Electric Heat (kWh)
Non Normalized 144 17,846 17,779 67 0.4%
Degree Day Normalized 144 19,662 18,534 1,128 5.7%
Prism Normalized 68 18,910 17,756 1,154 6.1%
Gas Heat (ccf)
Non Normalized 1,166 1,060 990 70 6.6%
Degree Day Normalized 1,166 1,052 991 61 5.8%
Prism Normalized 725 1,046 980 66 6.3%
Table III-10 showed that there was a large weather normalization adjustment made to savings estimates for the electric baseload and electric heating jobs. While non normalized electric baseload savings were only 3.2 percent, the degree day normalized savings were 10.8 percent.
The reason for the large adjustment was a warm summer following program treatments. The pre-treatment cooling degree days for these customers were very similar to the 19-year cooling degree day average, but the post-treatment cooling degree days were much greater than the 19-year average (a warmer than normal summer following the LIURP service delivery). The warmer weather resulted in increased cooling usage following LIURP services, and a non-normalized electric saving estimate that underestimated the savings from LIURP. This led to the large weather-normalization adjustment to savings for the electric baseload and electric heating analyses.
Further analysis of the electric baseload participants, by whether air conditioning was used, provided additional evidence for the fact that the large adjustment was caused by a warm summer. While participants without air conditioning only had an adjustment in savings

www.appriseinc.org PECO’s Universal Service Programs
APPRISE Incorporated Page 43
from 7.5 percent to 9.0 percent, those who did have air conditioning had an adjustment in savings from 3.1 percent to 10.8 percent.18
A historical comparison of energy savings by job type showed that electric baseload savings were high in 2010, but heating savings were lower than in previous years. The 2010 electric baseload jobs had higher savings than the 1999-2009 average.
Savings were 10.8 percent in 2010 compared to the historical average of 9.1 percent.
Electric heat jobs had average savings that were somewhat lower than the 1999-2009 average. Savings were 5.7 percent in 2010 compared to 8.1 percent for the 11-year average. While job costs were somewhat higher in 2010, the pre-treatment usage of 18,534 kWh was lower than the 11-year average pre-treatment usage of 20,367 kWh.
Gas heat jobs also had pre-treatment usage and savings that were lower than the 1999-2009 average. Pre-treatment usage was 1,052 compared to the eleven-year average of 1,186, approximately 11 percent lower. Gas savings were 5.8 percent in 2010, as compared to 10.7 percent for the 11-year average. Gas heat measure costs were greater than the 11-year average.
Challenges PECO’s has faced the following LIURP challenges. PECO has had difficulty continuing to find LIURP participants with high pre-program
usage. Customer refusals (reduced with LIURP participation requirement for CAP) and
landlord refusals (reduced with landlord education). Defacto heating, the use of electric heating instead of the household’s primary heating
technology has been a challenge, especially for Philadelphia customers.19 Increased cost of efficiency measures, which reduced the number of customers who can
be served.
Successes PECO has worked to provide high quality efficiency services to LIURP participants to improve energy affordability and health and safety. Successes include the following. Proactive identification of high usage customers. LIURP contractor that is experienced, knowledgeable, and efficient. Successful energy education program for LIURP participants and post-delivery follow-
ups to ensure customers maintain reduction goals. In-home services that refer customers to other Universal Service programs. High savings for baseload LIURP participants.
18 Additional analyses are presented in PECO’s 2010 LIURP Evaluation Report. 19 The 2011 LIURP program found that 716 of the 6,822 jobs that did not have electric heat (over ten percent) had defacto electric heating.

www.appriseinc.org PECO’s Universal Service Programs
APPRISE Incorporated Page 44
D. Matching Energy Assistance Fund (MEAF)
The Matching Energy Assistance Fund (MEAF) is PECO’s hardship fund program that provides emergency assistance grants to customers who have not paid their bills and have been shut off or are in danger of having services terminated.
Resources MEAF is funded through ratepayer donations, other fundraising, and PECO contributions. Ratepayers can pledge donations through monthly bill payment or a one-time donation.
PECO uses the following methods to raise funds for MEAF. Bill inserts Check-off box on bill stub Golf fundraiser
Projected MEAF resources are shown in the table below. Grants were projected at $1.14 million in 2012.
Table III-11A MEAF Projected and Actual Costs
2010 2011 2012
Projected MEAF Resources $1,038,179 $1,090,087 $1,144,591
Table III-11B displays annual MEAF funding for 2009 and 2010. The table shows that total program funds declined significantly from 2009 to 2010, likely a result of the economic conditions.
Table III-11B Annual MEAF Funding
2009 2010
Electric Gas Total Electric Gas Total
Ratepayer/Employee $167,278 $34,262 $201,540 $155,066 $29,536 $184,602
Fundraisers $26,477 $5,417 $31,894 $32,770 $6,242 $39,012
PECO $373,337 $76,467 $449,804 $187,493 $35,713 $223,206
Total $567,092 $116,146 $683,238 $375,329 $71,491 $446,820
Intake agencies had different reports with respect to the adequacy of MEAF funding. One stated that they have enough funding and unused funds are carried over to the next
year, and another stated that they can usually manage the funds on a monthly basis so they do not have to turn clients away.

www.appriseinc.org PECO’s Universal Service Programs
APPRISE Incorporated Page 45
Four agencies said that they have many more applicants than they can help and that they tell customers when they expect to have additional assistance, refer these customers to PECO, or try to provide other forms of assistance.
Administration PECO contracts with a MEAF Call Center, Torres Credit Services, to conduct intake for MEAF, respond to CBO inquiries related to MEAF enrollment and donations, and conduct outreach for MEAF donations. The MEAF Call Center has approximately eight employees.
PECO also contracts with six county fuel fund agencies to conduct intake for the program. Torres Credit Services serves as an intake agency and as PECO’s MEAF Call Center. Utility Emergency Services Fund (UESF)
UESF works with 13 neighborhood organizations that serve as MEAF intake sites, in addition to the intake that is done at their central office. These intake sites conduct the initial eligibility review and then send the application to the central UESF office. Staff at the central UESF office complete the application processing.
Montgomery County Action Development Commission – Project Reach
Chester County – Torres Credit Services
Bucks County Opportunity Council (BOCC), Inc. BOCC has three client intake sites.
Community Action Agency of Delaware County
Maxon-Dixon Cares The six county fuel fund agencies are responsible for screening clients for grant eligibility, assisting clients with the applications, contacting the MEAF Call Center to determine the customer’s past due amount, approving the grant, and contacting the MEAF Call Center to stop a pending shutoff.
PECO reviews agencies’ records to ensure that only eligible customers are approved and that account balances are brought to zero. They visit agencies once per year to perform quality control. The agencies also have internal quality control procedures to ensure accurate application processing.
All of the agency representatives reported that they have a good relationship with PECO’s staff and that PECO provides excellent support on the program. The agencies also reported that they have a good relationship with the MEAF Call Center. Likewise, the MEAF Call Center staff reported that they work very well with the local agencies.
Additional Resources As customers cannot receive the grant unless it eliminates their balance, and many have a balance above the maximum grant amount, customers need to find other sources of

www.appriseinc.org PECO’s Universal Service Programs
APPRISE Incorporated Page 46
assistance. Some of these sources are recommended by the agencies, including the following. Salvation Army (4 agencies) Local churches (4 agencies) Agency’s emergency fund or internal program (4 agencies) Other utility assistance programs (1 agency) Catholic Social Service (1 agency) Two agencies also reported that many clients rely on family members to make up the difference and four agencies reported that some clients are able to come up with the difference themselves. One agency reported that they hold the grant approval open as long as the client is eligible to give the client time to obtain the additional funds needed to bring their balance to $0. Another agency reported that clients often need to raise $1,500 or more, and that the agency gives the clients five days to pay the additional funds. After that time, they move to the next person on the list. One agency reported that they require the customer to have a goal plan and usually to contribute between $5 and $50, depending on their situation. The steps in the goal plan that was reviewed related to the steps required for MEAF application. Agencies had different policies with respect to CAP referrals, as displayed in Table III-12 Two agencies reported that PECO handles the application. One additional agency reported that PECO told the agency not to handle the application. Two agencies reported that they have the customer fill out an application and they fax
the application to PECO. One agency said that they require the customer to fill out a CAP application before the
MEAF application, assist them with any questions, and they send the application to PECO.
Table III-12
CAP Linkage
Number of Agencies
PECO contacts customer 3
Agency assists customer and sends CAP application to PECO
3
Agencies also reported different practices with respect to LIHEAP application, summarized in Table III-13. Two agencies said clients are required to apply for LIHEAP before applying for MEAF,
and that they have the applications in their office.

www.appriseinc.org PECO’s Universal Service Programs
APPRISE Incorporated Page 47
1 agency said that they keep LIHEAP applications in the office and that beginning in October, every client that comes in is given a LIHEAP application to complete. If they are unable to complete it, she does it for them.
One agency said that they take the application, scan it, send it to the county office, and can usually receive an answer in a few hours.
One agency mails a LIHEAP application to the client if it is LIHEAP season. One agency said that they do not keep LIHEAP applications in their office, but they
refer the client to a local LIHEAP office if they have not received assistance.
Table III-13 LIHEAP Linkage
Number of Agencies
Customers apply in agency office. 4
LIHEAP application mailed to customer. 1
Customers referred to local LIHEAP office. 1
When asked about other referrals that are made, the agencies varied in the response, as shown in Table III-14. The agencies varied in the number and types of referrals mentioned. One agency stated that they refer customers to other local agencies. One agency stated that customers are referred, based on their individual issues, to
housing programs, water assistance, or SNAP (offered in the same office). One agency said that they refer customers to SNAP, PA Careerlink (state run
employment center), food pantries, and other referrals depending on client needs. One agency said that they provide referrals at almost every intake. Common referrals
are the Heater Hotline, WAP, and other energy programs. Another agency said that they always provide referrals, after asking clients questions
about loss of income and energy conservation actions. Another agency said that almost everyone who comes in with a shutoff notice has other
issues, and they refer customers to case management, rental assistance, and WIC.
Table III-14 Agency Referrals
Number of Agencies
SNAP/food assistance 3
Housing 2
Energy efficiency programs 1
Water assistance 1
Employment assistance 1
Case management 1
Other local agencies 1

www.appriseinc.org PECO’s Universal Service Programs
APPRISE Incorporated Page 48
The agencies varied in the number of programs offered. While one agency offered comprehensive services including other utility, housing food, medical and tax assistance, another agency only mentioned LIHEAP, and another only mentioned a water assistance program. Other services that were reported by agencies to be provided at the agency were as follows. Other utility assistance, rent and mortgage assistance, food assistance, PGW CRP, food
stamps, LIHEAP, CHIP, Medicaid, EITC application help, and tax help. Homeless Assistance Program, Economic Self-Sufficiency Program – coach to offer
assistance on how to move forward (less than 5 MEAF customers per year). Rental assistance and oil assistance. LIHEAP assistance. Water assistance program. Eligibility Residential PECO customers are eligible for MEAF if they meet the following criteria. Income at or below 175 percent of the federal poverty level Resident in county where they apply Imminent danger of service termination or have had their services terminated Grant must eliminate the total amount due, excluding pre-program arrearage Customer must make payment or solicit third party grants if MEAF grant does not cover
amount owed Customer has not received MEAF in the past two years.
Benefits The maximum MEAF grant is $500 per fuel. This was increased from $500 per customer in PECO’s last three-year Universal Services plan.
Application Application varies by agency. Five of the agencies reported that the clients are required to come to the office. Two of these agencies reported that if the client is disabled or has some other type of hardship, they would make an exception. One agency reported that they take applications over the phone and documentation by fax. Participation Table III-15 displays annual MEAF grants for 2008 through 2011. There were a total of 1,442 MEAF grants in 2010, averaging $306. The total number of grants declined to 528 in 2011.
Table III-15 MEAF Grants
2008 2009 2010 2011
Number of Grant Recipients 1,217 1,028 1,442 528

www.appriseinc.org PECO’s Universal Service Programs
APPRISE Incorporated Page 49
Total Grant Dollars Awarded $347,264 $275,407 $441,816 $158,500
Average Grant $281 $261 $306 $300
Table III-16 displays annual MEAF grants for 2008 through 2011 by CAP tier. The table shows that approximately half of the customers who received MEAF were enrolled in CAP. Of those who were enrolled in CAP, the grants were fairly even distributed across poverty level groups, with somewhat fewer households with income below 25 percent of poverty receiving grants.
Table III-16 CAP Tier of MEAF Grantees
CAP Tier Poverty Level 2008 2009 2010 2011
A ≤25% 0% <1% <1% 0%
B ≤25% 5% 4% 5% 4%
C 26%-50% 9% 8% 10% 9%
D 51%-75% 22% 22% 26%
12%
D1 76%-100% 13%
E 101%-125% 11% 12% 17%
9%
E1 126%-150% 8%
Not in CAP 53% 53% 43% 46%
TOTAL 100% 100% 100% 100%
Challenges PECO faces the following challenges with MEAF. There has been a continued decline in customer giving since the downturn in the
economy. PECO has not been able to locate an agency in Chester County. There were some MEAF challenges that were reported by the MEAF call center and the MEAF agencies. The MEAF call center reported that they are sometimes asked by the agencies to make
exceptions to the guidelines and provide extra time to customers to prevent shutoff, but they are not able to do this.
Large balances are a challenge for many customers who cannot obtain the additional funds needed. One agency recommended that PECO assist the customer before the balance is too high for the customer to be able to pay.
A few agencies said that the small amount of money they receive in funding and the small amount they are able to provide for grants is a challenge. There is never enough money for all of the clients who need assistance.
One agency said that the short turn-around for some clients is a challenge. When a client calls with a 72-hour shut-off notice, it is a challenge to be able to respond that quickly.

www.appriseinc.org PECO’s Universal Service Programs
APPRISE Incorporated Page 50
Some of the agencies had complaints about PECO customer service representatives. o Three agencies noted that PECO staff members need more education on MEAF.
They stated that the PECO customer service representatives refer clients to the agency even when the customer is not in their service territory. They were also concerned that the PECO customer service representatives don’t know the program rules or regulations. While it is not clear if they explain the program incorrectly or customers do not understand the explanation, the agencies stated that the PECO representatives tell clients that they need to get their shut-off amount eliminated, rather the total balance, in order to receive the MEAF grant.
o Two agency representatives stated that many clients report that they are not treated respectively by the PECO customer service representatives, and that the representatives need to be more sensitive to low-income customers.
o One agency representative stated that PECO representatives do not always refer customers to CAP or MEAF.
Successes PECO has implemented a successful MEAF hardship fund program. MEAF helps customers to achieve self-sufficiency by providing a grant that brings the
balance to zero, but that is only available once every two years. MEAF has agencies in every county to provide local assistance for customers. The MEAF annual golf tournament fundraiser raises an average of $30,000 each year. Several successes were noted by the agency representatives. The agency representatives stated that the MEAF guidelines work well. The program provides a cushion of help between when LIHEAP assistance ends and
begins again in November. It is a temporary help to give clients time to get back on track that is very much needed, as without the program, many customers would not have service.
One agency representative noted that two years between grants is the right amount of time, because it forces customers to help themselves.
Recommendations The agencies had some recommendations for the MEAF program. One agency representative recommended that more customer awareness was needed
because many customers do not know about the program. This was one of the agencies that had more than sufficient funding.
One agency stated that customers have a hard time only being able to receive the grant every two years and that many would benefit from being able to receive a grant annually.
Planned Changes PECO is exploring how funding is distributed across the six counties. PECO recently added new contribution methods including on-line contributions, MEAF
brochures, and outreach to previous MEAF donors.

www.appriseinc.org PECO’s Universal Service Programs
APPRISE Incorporated Page 51
E. Customer Assistance Referral and Evaluation Services (CARES)
PECO’s Customer Assistance Referral and Evaluation Services (CARES) Program provides referrals and information to assist customers who have temporary financial hardships that create a barrier to utility bill payment. These may include family emergencies, divorce, unemployment, and medical emergencies.
The goal of the CARES component of Universal Services is to educate and inform PECO customers of available resources including energy and non-energy assistance, budget counseling, and housing assistance.
Resources PECO’s projected expenses for CARES are shown in the table below.
Table III-17A CARES Projected Costs
2010 2011 2012
Projected Costs $21,088 $21,932 $22,809
Costs for CARES, including CARES administration and LIHEAP outreach expenditures, are displayed in Table III-17B. Total costs were $1.53 million in 2010.
Table III-17B 2009-2010 CARES Costs
2009 2010
Electric Gas Total Electric Gas Total
Costs $1,010,933 $207,071 $1,218,004 $1,284,449 $244,657 $1,529,106
PECO has three CARES representatives and a supervisor who are responsible for implementing the program. The CARES representatives are responsible for reaching out to CARES customers and assessing their needs. Based on the individual needs of each customer, the representatives provide referral and information services designed to assist customers with financial or personal hardships. The supervisor is responsible for managing and overseeing the CARES representatives.
As part of their on-the-job training, each of the CARES representatives shadowed other representatives. The supervisor participated in a four-week development program that provided training in supervisory and managerial skills. Each of the CARES representatives has a CARES manual and a CAP manual to assist them with their work. The CARES representatives have monthly one-on-one meetings with the supervisor. They also have monthly group CARES meetings, during which the supervisor and all representatives are in attendance.
www.appriseinc.org PECO’s Universal Service Programs
APPRISE Incorporated Page 52
PECO maintains a referral network of community organizations, government agencies, and social service agencies that assist low-income customers.
Eligibility Customers are eligible for CARES if they have income at or below 200 percent of the Federal Poverty Level. They also should have special needs and/or have extenuating circumstances.
Customers are not eligible for CARES if they have an active dispute, they have been referred to CARES within the past 12 months, they were dismissed from CAP for non-compliance within the past six months, or they have not made a payment in the past three months.
Benefits The benefits provided through CARES are as follows. Education and referral information for energy and non-energy related assistance. Evaluation for enrollment in PECO’s Universal Service programs, including health
usage, 6-month medical certification, and CAP Rate A. Eligible customers may receive temporary protection from termination of service.
CARES representatives are responsible for ensuring that CARES participants receive all assistance that they are eligible for. Representatives ask customers to provide pertinent information to help determine what programs the customer is eligible for. For example, if there is a medical concern, the representative will request a health usage form for the doctor to fill out. Or, if a customer has an extenuating circumstance, the representative will request documentation of that circumstance.
Customers who have health-related treatments or appliances that increase the household energy usage may receive the CAP Rate discount on their total monthly usage.
Outreach and Intake Most CARES referrals originate from the CAP call center. PECO also receives CARES referrals from the following sources. Social service agencies Bureau of Consumer Services Community Based Organizations PECO’s Call Center PECO’s Customer Service employees State representatives County offices City agencies Senior centers Religious organizations Program Implementation
www.appriseinc.org PECO’s Universal Service Programs
APPRISE Incorporated Page 53
The CARES supervisor divides CARES cases evenly among the three representatives, and the representatives each manage several CARES cases. A representative’s monthly caseload typically ranges from twenty to forty cases.
Representatives call the customers to initiate contact about CARES. If the call attempt is unsuccessful and the customer does not call back, the representative sends a letter asking the customer to call the representative. If the CARES representative does not receive a response from the customer within ten days, the representative sends another letter. This final letter explains that the customer’s file will be closed in five more days (fifteen total days) if no response is received.
When asked about program participation, representatives and the supervisor reported that it is very rare for a customer who qualifies for CARES to refuse CARES services. However, it is more common that customers will not respond to contact attempts.
PECO addresses CARES customers’ language barriers in two ways. One of the CARES representatives speaks Spanish, so Spanish-speaking customers are often referred to this case manager. Additionally, PECO has a language line for any customers with a language barrier.
While some CARES cases are closed right away, some cases are kept open for a long period because a customer needs continued assistance. The CARES representatives estimated that customers remain on CARES for about two weeks on average. The amount of time spent with a CARES customer also varies widely. One CARES representative estimated that she averages ten minutes per customer, while another representative estimated twenty minutes per customer.
A CARES case is closed if the customer does not respond after multiple contact attempts, when the representative has made all available referrals for the customer, or when the customer’s needs have been met.
Referrals CARES representatives learn about the programs available for referral from the CARES manual. The representatives also attend monthly outreach events, where they present information and field questions about CARES. After these events, CARES representatives share information about any new programs they have learned about. CARES has an extensive network of agencies that staff communicate with, so they have up to date information on changes to available programs. Additionally, CARES staff learn about program changes via email or through internet research.
CARES representatives provide many types of referrals to customers. These include, but are not limited to the following. Welfare Medical assistance Cash assistance Social services

www.appriseinc.org PECO’s Universal Service Programs
APPRISE Incorporated Page 54
LIHEAP MEAF LIURP American Cancer Society
On average, two to four referrals are made per customer.
When making a referral, representatives provide the customer with an agency name, address, and phone number, as well as program forms that are required for benefit application. In most cases, the customer is instructed to contact an agency on his or her own accord, but in some cases, representatives may contact the program or agency on behalf of the customer. CARES representatives reported that they are usually not able to assess whether customers follow up on the referrals, although there are exceptions, such as when financial resources are directed to the customer’s account, or if a customer calls back and informs the case manager about the outcome of the referral.
CARES Data Information that is particular to a customer, such as that included on PECO’s CARES intake form, is recorded on paper. Intake forms contain the following information. Income CAP tier Customer balance Food stamps receipt Child support receipt
Information about each case is recorded in a CARES Excel spreadsheet, which contains the following information. Date received referral Source of referral Account number Customer name Extension required or granted Payment arrangement required or granted CARES representative’s actions Referrals made
CARES representatives do not record information on whether the customer received services or benefits, except in certain cases where financial resources are concerned or if that information is otherwise offered by the customer. Neither the CARES representatives nor the CARES supervisor receives any system-generated reports.
Challenges When asked about program challenges, the CARES supervisor and all three representatives reported that they would like to be able to assist more customers. The supervisor reported

www.appriseinc.org PECO’s Universal Service Programs
APPRISE Incorporated Page 55
that in addition to situations where there is nothing they can do to help a customer, it is not always clear what needs to be done for a customer, because there are always unique cases that do not fit neatly into the CARES protocol.
Successes PECO provides customized care for customers through this program and has implemented new metrics, tracking, and reporting. The supervisor and representatives all reported that the CARES program is very successful in helping customers with special needs. While they cannot help everybody, they do make a large impact on people’s lives.
F. Education-Outreach Programs
PECO’s education and outreach programs aim to inform all customers in their service territory about program benefits and enrollment, and to act as a partner in the community. Outreach and direct enrollment measures include the following. Referral of LIHEAP recipients to the CAP call center for enrollment. Automatic enrollment of LIHEAP recipients in CAP rate when LIHEAP income
eligibility is equal or less than CAP income eligibility. Referral of MEAF recipients to the CAP call center for enrollment. Description and contact information for CAP, LIURP, MEAF, LIHEAP, and CARES on
PECO’s Universal Services Website. Printable CAP application on PECO’s Universal Services Website.
PECO also provides training sessions to staff members of community organizations and health providers to inform them about the availability of PECO’s Universal Service programs.
G. External Grant Program Administration
PECO’s Universal Service department manages external grant administration and PECO has a Fuel Fund Hotline that provides information and referral assistance to agency representatives that assist customers to resolve crises.
Some of the programs that PECO supports include the following. Pennsylvania Low Income Home Energy Assistance Program (LIHEAP) – Assistance
payments to utility vendors, preventing shutoff and restoring service, and winter emergencies including leaking pipes and broken furnaces. Table III-18 displays the number of LIHEAP grants received by PECO customers and the total dollars received. The table shows that over 111,000 customers received grants totaling over $23 million in 2011.
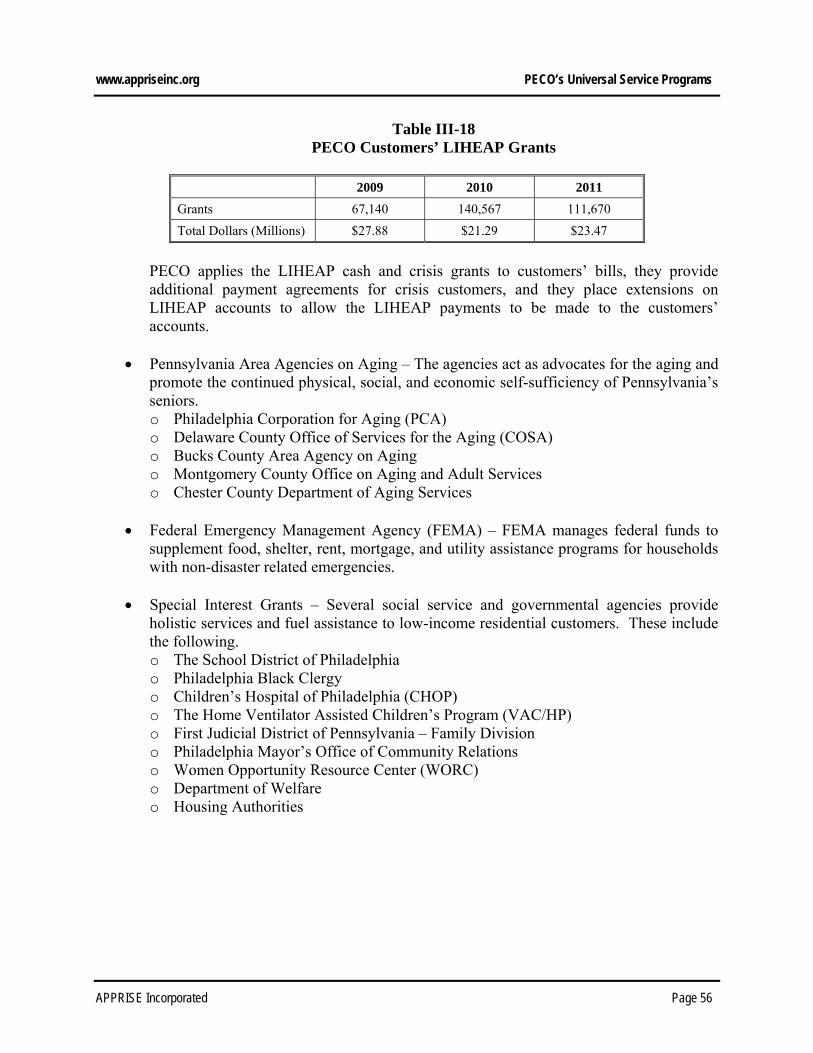
www.appriseinc.org PECO’s Universal Service Programs
APPRISE Incorporated Page 56
Table III-18 PECO Customers’ LIHEAP Grants
2009 2010 2011
Grants 67,140 140,567 111,670
Total Dollars (Millions) $27.88 $21.29 $23.47
PECO applies the LIHEAP cash and crisis grants to customers’ bills, they provide additional payment agreements for crisis customers, and they place extensions on LIHEAP accounts to allow the LIHEAP payments to be made to the customers’ accounts.
Pennsylvania Area Agencies on Aging – The agencies act as advocates for the aging and promote the continued physical, social, and economic self-sufficiency of Pennsylvania’s seniors. o Philadelphia Corporation for Aging (PCA) o Delaware County Office of Services for the Aging (COSA) o Bucks County Area Agency on Aging o Montgomery County Office on Aging and Adult Services o Chester County Department of Aging Services
Federal Emergency Management Agency (FEMA) – FEMA manages federal funds to
supplement food, shelter, rent, mortgage, and utility assistance programs for households with non-disaster related emergencies.
Special Interest Grants – Several social service and governmental agencies provide holistic services and fuel assistance to low-income residential customers. These include the following. o The School District of Philadelphia o Philadelphia Black Clergy o Children’s Hospital of Philadelphia (CHOP) o The Home Ventilator Assisted Children’s Program (VAC/HP) o First Judicial District of Pennsylvania – Family Division o Philadelphia Mayor’s Office of Community Relations o Women Opportunity Resource Center (WORC) o Department of Welfare o Housing Authorities

www.appriseinc.org Customer Surveys
APPRISE Incorporated Page 57
IV. Customer Surveys
APPRISE conducted a survey with participants in PECO’s Customer Assistance Program and low-income nonparticipants to develop information on customer knowledge, understanding, and satisfaction with the CAP. The low-income nonparticipants were drawn from a sample of PECO’s customers who received LIHEAP but did not participate in CAP.
A. Customer Survey Methodology
This section describes the methodology for the customer surveys, including survey implementation and sample selection.
Survey Implementation APPRISE retained Issues & Answers (I&A) to conduct the telephone survey through its call center. A researcher from APPRISE trained I&A’s employees on the survey instrument and monitored survey implementation. I&A’s manager in charge of the survey instructed interviewers how to use the computerized version of the survey to record customer responses.
Interviewer training provided interviewers with an overview of the project, purpose behind questions asked, and strategies to provide accurate clarification and elicit acceptable responses through neutral probing techniques.
Interviewer monitoring allowed APPRISE researchers to both listen to the way interviewers conducted surveys and see the answers they chose on the computerized data entry form. I&A’s manager facilitated open communication between the monitors and interviewers, which allowed the monitors to instruct interviewers on how to implement the survey and accurately record customer responses.
Telephone interviews were conducted in March and April 2012. During this time period, 398 interviews were completed.
Sample Selection and Response Rates The survey sample was designed to furnish data on CAP participants and nonparticipants.
Table IV-1 details the number of customers selected to complete the survey, the number of completed interviews, cooperation rates, and response rates for each of the two groups. The table presents the following information for the sample.
Number selected: There were 800 participants and 597 nonparticipants chosen for the survey sample.
Unusable: There were 208 participant cases and 294 nonparticipant cases deemed unusable because no one was present in the home during the survey who was able to
www.appriseinc.org Customer Surveys
APPRISE Incorporated Page 58
answer questions related to the household electric bills and the CAP, or because phone numbers were unavailable, disconnected, or incorrect. These households are not included in the denominator of the response rate or the cooperation rate. They are included in the denominator of the completed interview rate.
Non-Interviews: There were 71 participant cases and 71 nonparticipant cases classified
as non-interviews because the qualified respondent refused to complete the interview, or because the respondent asked the interviewer to call back to complete the interview at a later time, but did not complete the interview during the field period. These households are included in the denominator of the cooperation rate, the response rate, and the completed interview rate.
Unknown eligibility: There were 222 participant cases and 133 nonparticipant cases that were determined to have unknown eligibility to complete the interview, due to answering machines, no answers, and language barriers. These households are not included in the denominator of the cooperation rate. They are included in the denominator of the response rate and the completed interview rate.
Completed interviews: The completed interviews are households that were reached and that answered the full set of survey questions. There were 299 interviews with participants and 99 interviews with nonparticipants.
Cooperation rate: The cooperation rate is the percent of eligible households contacted who completed the survey. This is calculated as the number of completed interviews divided by the interviews plus the number of non-interviews (refusals plus non-completed call backs20). Overall, this survey achieved an 81 percent cooperation rate for participants and a 58 percent cooperation rate for nonparticipants.
Response rate: The response rate is the number of completed interviews divided by the number of completed interviews plus the number of non-interviews (refusals plus non-completed call backs) plus all cases of unknown eligibility (due to answering machines and language barriers). This survey attained a 51 percent response rate for participants and a 33 percent response rate for nonparticipants.
20 Non-completed callbacks include respondents who asked the interviewer to call back at a later time to complete the interview, but did not complete the interview by the end of the field period.

www.appriseinc.org Customer Surveys
APPRISE Incorporated Page 59
Table IV-1 Sample and Response Rates
By Participation Status
Participants Non Participants
Selected 800 597
Completed 299 99
# % # %
Unusable 208 26% 294 49%
Non-Interviews 71 9% 71 12%
Unknown eligibility 222 28% 133 22%
Completed interviews 299 37% 99 17%
Cooperation rate 81% 58%
Response rate 51% 33%
B. Survey Findings
This section presents detailed findings from the customer survey.
Demographic Characteristics This section examines the demographic characteristics of the survey respondents. The following issues were covered. Own or rent home Number of household members Number of children, elderly, and disabled Education Types of income and benefits Unemployment Annual household income
Table IV-2 displays information on home ownership. The table shows that 44 percent of participants and 46 percent of nonparticipants owned their homes.
Table IV-2 Own or Rent Home
Do you own or rent your home?
Participant Non Participant
Respondents 299 99
Rent 56% 54%
Own 44% 46%

www.appriseinc.org Customer Surveys
APPRISE Incorporated Page 60
Table IV-3 displays the number of household members reported by participant and nonparticipant respondents. The table shows that about one third lived in single-person households, about 25 percent lived in two-person households, and 28 percent lived in three or four-person households.
Table IV-3 Number of Household Members
Including you, how many people normally live in this household?
Participant Non Participant
Respondents 299 99
1 36% 37%
2 23% 29%
3 16% 19%
4 12% 9%
5 or more 11% 5%
Refused 1% 0%
Don’t Know 0% 1%
Respondents were asked to report the number of children five or younger in the home. Table IV-4 shows that 21 to 25 percent of respondents reported that they had one or more young children in the home.
Table IV-4 Number of Young Children in Household
How many people in this household are 5 years of age or under?
Participant Non Participant
Respondents 299 99
0 75% 79%
1 16% 14%
2 7% 6%
3 2% 0%
Refused 1% 0%
Don’t Know 0% 1%

www.appriseinc.org Customer Surveys
APPRISE Incorporated Page 61
Table IV-5 shows that about 40 percent of respondents reported that there was one or more people living in the household who were 60 years or older.
Table IV-5 Number of Elderly Individuals in Household
Including you, how many people in this household are 60 years of age or older?
Participant Non Participant
Respondents 299 99
0 62% 60%
1 31% 33%
2 7% 7%
Respondents were asked whether anyone in the household was disabled. Table IV-6 shows that 41 percent of participants and 35 percent of nonparticipants reported that there was a disabled household member.
Table IV-6 Number of Disabled Individuals in Household
Is anyone in your home disabled?
Participant Non Participant
Respondents 299 99
Yes 41% 35%
No 58% 65%
Don’t Know 1% 0%
Table IV-7 shows that the CAP participants reported lower levels of education than the comparison group. While 60 percent of participants reported that the highest level of education reached by anyone in the household was a high school education or less, 48 percent of nonparticipants reported that this was the highest education level in the household. Additionally, 37 percent of participants reported that they had some college or a bachelor’s or master’s degree, compared to 51 percent of nonparticipants.
Table IV-7 Education Level
What is the highest level of education reached by you or any member of your household?
Participant Non Participant
Respondents 299 99
Less Than High School 18% 11%

www.appriseinc.org Customer Surveys
APPRISE Incorporated Page 62
What is the highest level of education reached by you or any member of your household?
Participant Non Participant
High School Diploma Or Equivalent 42% 37%
Some College/Associates Degree 28% 35%
Vocational Training 2% 1%
Bachelor’s Degree 7% 12%
Master’s Degree Or Higher 2% 4%
Refused 1% 0%
Respondents were asked whether they received several different types of income and benefits in the past twelve months. Table IV-8 shows that non-cash benefits, i.e. food stamps or public/subsidized housing was the most common form of income or benefits received. While 73 percent of participants reported that they received these benefits, 57 percent of nonparticipants reported that they received this type of benefits. Only 26 percent of participants and 31 percent of nonparticipants reported that someone in the household received wages or self-employment income. An additional 28 percent of participants and 32 percent of nonparticipants reported that someone in the household received retirement income.
Table IV-8 Types of Income and Benefits Received
In the past 12 months, did you or any member of your household receive: Food stamps or live in public/subsidized housing? Benefits from Temporary Assistance for Needy Families (TANF),
Supplemental Security Income (SSI), or general assistance or public assistance?
Retirement income from Social Security or pensions and other retirement funds?
Employment income from wages and salaries or self-employment income from a business or farm?
Participant Non Participant
Respondents 299 99
Non-Cash Benefits 73% 57%
Public Assistance 43% 26%
Retirement Income 28% 32%
Wages or Self-Employment Income 26% 31%
Respondents were asked whether anyone in the household was unemployed and looking for work in the past 12 months. Table IV-9 shows that 32 percent said that someone in the household was unemployed. There was no difference between CAP participants and nonparticipants.
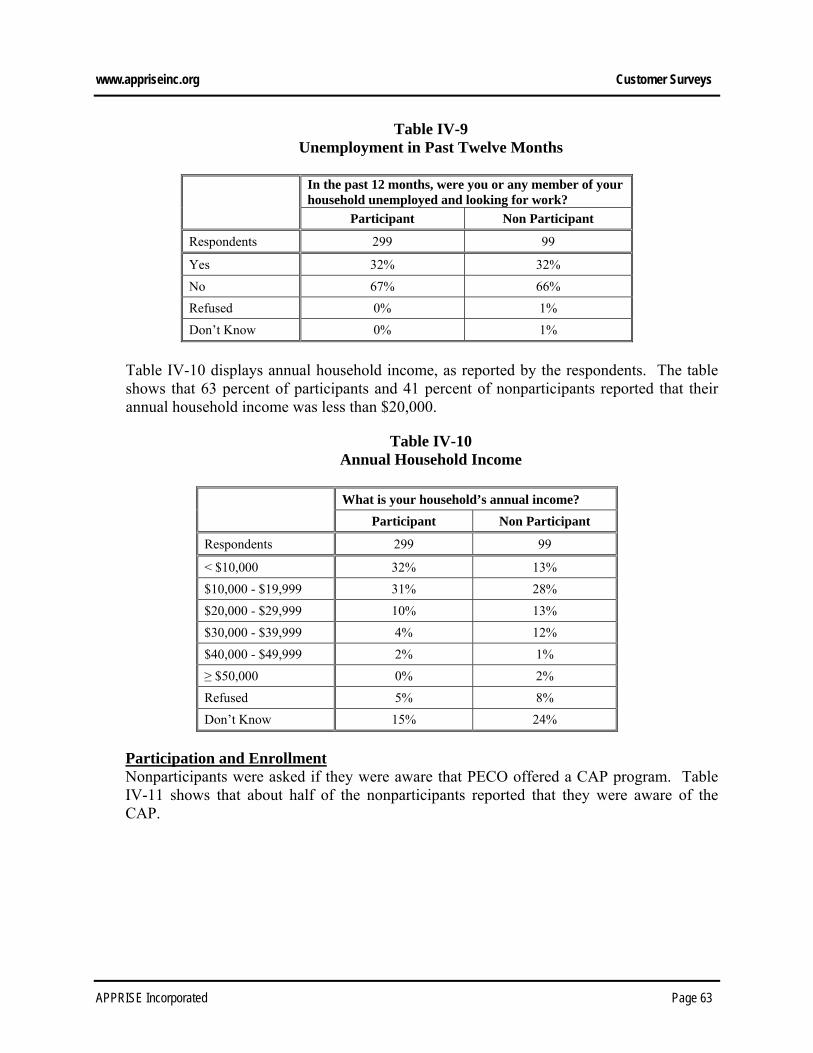
www.appriseinc.org Customer Surveys
APPRISE Incorporated Page 63
Table IV-9 Unemployment in Past Twelve Months
In the past 12 months, were you or any member of your household unemployed and looking for work?
Participant Non Participant
Respondents 299 99
Yes 32% 32%
No 67% 66%
Refused 0% 1%
Don’t Know 0% 1%
Table IV-10 displays annual household income, as reported by the respondents. The table shows that 63 percent of participants and 41 percent of nonparticipants reported that their annual household income was less than $20,000.
Table IV-10 Annual Household Income
What is your household’s annual income?
Participant Non Participant
Respondents 299 99
< $10,000 32% 13%
$10,000 - $19,999 31% 28%
$20,000 - $29,999 10% 13%
$30,000 - $39,999 4% 12%
$40,000 - $49,999 2% 1%
≥ $50,000 0% 2%
Refused 5% 8%
Don’t Know 15% 24%
Participation and Enrollment Nonparticipants were asked if they were aware that PECO offered a CAP program. Table IV-11 shows that about half of the nonparticipants reported that they were aware of the CAP.

www.appriseinc.org Customer Surveys
APPRISE Incorporated Page 64
Table IV-11 Awareness of CAP
Are you aware that PECO offers a program called the Customer Assistance Program, or CAP, to help make electric and gas bills more affordable for customers?
Non Participant
Respondents 99
Yes 53%
No 44%
Don’t Know 3%
Participants were asked what percent discount they received on their PECO bill because of their participation in CAP. The table shows that most respondents did not know what percent discount they received. Eighty-nine percent reported that they did not know what the discount was.
Table IV-12 CAP Discount
Because you participate in CAP, you receive a discount on your energy bill. What percentage discount do you receive?
Participant
Respondents 299
0% 0%
1-20% 3%
21-40% 1%
41-60% 3%
61-80% 1%
81-99% 0%
100% 1%
Other 2%
Don’t Know 89%
CAP participants and nonparticipants who reported that they knew about CAP were asked how they found out about the program. Table IV-13 shows that both groups were most likely to report that they learned about the program from a PECO representative and then from someone that they knew. Agencies were another common source of information about the program.

www.appriseinc.org Customer Surveys
APPRISE Incorporated Page 65
Table IV-13 CAP Knowledge
How did you find out about the Customer Assistance Program, or CAP?
Participant Non Participant
Respondents 299 99
PECO Representative 52% 18%
Friend Or Relative Or Word Of Mouth 24% 17%
Local or Government Agency 12% 6%
Advertisement (TV, Online, Radio, Newspaper) 6% 4%
Bill Insert Or Mailing 5% 6%
LIHEAP 2% 1%
Had Been Previously Enrolled 2% 0%
Electric Or Gas Company 2% 0%
Community Workshop 1% 0%
Other 1% 1%
Did Not Know About CAP 0% 47%
Don’t Know 5% 6%
* Note: The sum of the percentages exceeds 100% as some of the respondents provided more than one response.
When asked why they decided to enroll in CAP, participants were most likely to report that they wanted to reduce their energy bills. Other common responses were to reduce arrearages and the household’s low income or need for assistance.
Table IV-14 Reason for CAP Participation
Why did you decide to enroll in CAP?
Participant
Respondents 299
Reduce Energy Bills 59%
Reduce Amount Owed To PECO/Reduce Arrearages 17%
Low/Fixed Income Or Finances 17%
Needed Help 9%
Told To Enroll 4%
Unemployed/Lost Job/Lost Income 4%
Other 1%

www.appriseinc.org Customer Surveys
APPRISE Incorporated Page 66
Why did you decide to enroll in CAP?
Participant
Don’t Know 1%
* Note: The sum of the percentages exceeds 100% as some of the respondents provided more than one response.
Nonparticipants were asked why they did not enroll in CAP. Table IV-15 shows that the most common responses were that their income was too high, they did not need energy assistance, or that they misunderstood or did not trust the program.
Table IV-15 Reason for CAP Non-Participation
What are the reasons that you have not enrolled in PECO’s CAP?
Non Participant
Respondents 52
Income Is Too High 21%
Do Not Need Energy Assistance 13%
Misunderstand/Don’t Trust Program 12%
Too Difficult To Enroll 10%
Do Not Want Assistance 6%
Do Not Know How To Enroll 4%
Cannot Provide Proof Of Income 4%
Do Not Have Time To Enroll 1%
Other 15%
Don’t Know 17%
* Note: The sum of the percentages exceeds 100% as some of the respondents provided more than one response.
Participants were asked how difficult it was to enroll in CAP. Table IV-16A shows that most respondents said it was not difficult to enroll. Only six percent said it was somewhat difficult and only one percent said it was very difficult.
Table IV-16A Difficulty of CAP Enrollment
How difficult was it to enroll in CAP? Would you say it was very difficult, somewhat difficult, not too difficult, or not at all difficult?
Participant
Respondents 299
Very Difficult 1%
Somewhat Difficult 6%

www.appriseinc.org Customer Surveys
APPRISE Incorporated Page 67
How difficult was it to enroll in CAP? Would you say it was very difficult, somewhat difficult, not too difficult, or not at all difficult?
Participant
Not Too Difficult 26%
Not At All Difficult 65%
Don’t Know 1%
Table IV-16B provides a comparison to responses to the same question asked about CAP programs offered by other utilities in Pennsylvania. The table shows that PECO’s participants rated the ease of enrollment approximately the same as these other programs.
Table IV-16B Difficulty of CAP Enrollment – Comparison Table
How difficult was it to enroll in the program? Would you say it is very difficult, somewhat difficult, not too difficult, or not at all difficult?
PECO Allegheny PPL PG Energy
Respondents 299 133 103 54
Very Difficult 1% 2% 1% 2%
Somewhat Difficult 6% 4% 5% 4%
Not Too Difficult 26% 20% 29% 22%
Not At All Difficult 65% 73% 65% 72%
Don’t Know 1% 2% 0% 0%
Respondents were asked to provide information on the parts of enrollment that were most difficult. Table IV-17 shows that they reported it was completing the application or providing proof of income.
Table IV-17 Difficult Parts of CAP Enrollment
What parts of enrollment in CAP were most difficult?
Participant
Respondents 299
Completing the Application 5%
Providing Proof Of Income 2%
None 0%
Other 1%
Enrollment Not Difficult 93%

www.appriseinc.org Customer Surveys
APPRISE Incorporated Page 68
What parts of enrollment in CAP were most difficult?
Participant
Don’t Know 1%
* Note: The sum of the percentages exceeds 100% as some of the respondents provided more than one response.
Table IV-18 shows that 64 percent of respondents reported that they recertified for CAP.
Table IV-18 CAP Recertification
Have you ever re-certified for CAP?
Participant
Respondents 299
Yes 64%
No 33%
Don’t Know 4%
Table IV-19A shows that most respondents said that it was not difficult to recertify. Only ten percent said it was somewhat difficult and two percent said it was very difficult.
Table IV-19A Difficulty of CAP Recertification
How difficult was it to re-certify for CAP? Would you say it was very difficult, somewhat difficult, not too difficult, or not at all difficult?
Participant
Respondents 185
Very Difficult 2%
Somewhat Difficult 10%
Not Too Difficult 22%
Not At All Difficult 65%
Don’t Know 1%
Table IV-19B shows that PECO respondents reported similarly to other CAP program survey respondents about the difficulty of CAP recertification.

www.appriseinc.org Customer Surveys
APPRISE Incorporated Page 69
Table IV-19B Difficulty of CAP Recertification – Comparison Table
How difficult was it to recertify for the program?
PECO Allegheny PPL
Respondents 185 102 71
Very Difficult 2% 3% 0%
Somewhat Difficult 10% 6% 8%
Not Too Difficult 22% 14% 25%
Not At All Difficult 65% 77% 66%
Don’t Know 1% 0% 0%
When asked to report the parts of recertification that were difficult, respondents were most likely to say that it was providing their proof of income.
Table IV-20 Difficult Parts of CAP Recertification
What parts of re-certification were most difficult?
Participant
Respondents 185
Providing Proof Of Income 6%
Completing the Application 4%
Paying Arrearages 2%
None/Nothing 1%
Other 2%
Recertification Was Not Difficult 88%
* Note: The sum of the percentages exceeds 100% as some of the respondents have given more than one response.
Understanding of CAP Respondents were asked whether they felt they had a good understanding of the services provided by CAP. Table IV-21A shows that 88 percent of the respondents said they felt they had a good understanding of the program.
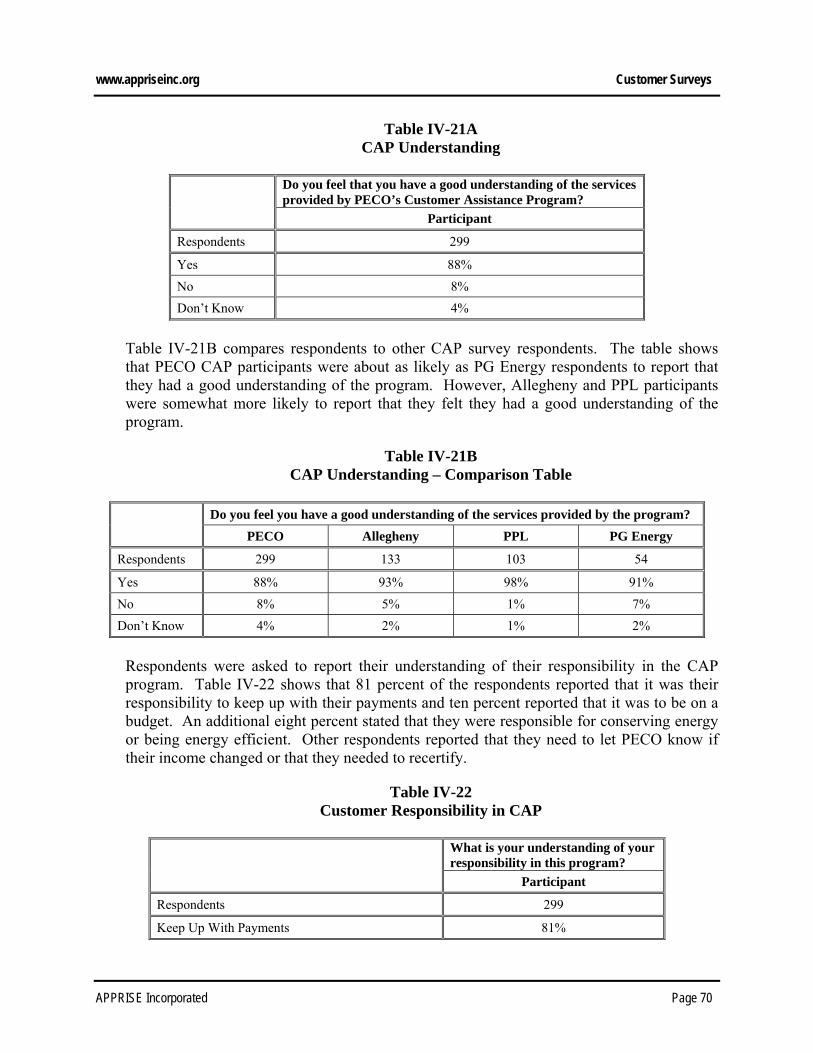
www.appriseinc.org Customer Surveys
APPRISE Incorporated Page 70
Table IV-21A CAP Understanding
Do you feel that you have a good understanding of the services provided by PECO’s Customer Assistance Program?
Participant
Respondents 299
Yes 88%
No 8%
Don’t Know 4%
Table IV-21B compares respondents to other CAP survey respondents. The table shows that PECO CAP participants were about as likely as PG Energy respondents to report that they had a good understanding of the program. However, Allegheny and PPL participants were somewhat more likely to report that they felt they had a good understanding of the program.
Table IV-21B CAP Understanding – Comparison Table
Do you feel you have a good understanding of the services provided by the program?
PECO Allegheny PPL PG Energy
Respondents 299 133 103 54
Yes 88% 93% 98% 91%
No 8% 5% 1% 7%
Don’t Know 4% 2% 1% 2%
Respondents were asked to report their understanding of their responsibility in the CAP program. Table IV-22 shows that 81 percent of the respondents reported that it was their responsibility to keep up with their payments and ten percent reported that it was to be on a budget. An additional eight percent stated that they were responsible for conserving energy or being energy efficient. Other respondents reported that they need to let PECO know if their income changed or that they needed to recertify.
Table IV-22 Customer Responsibility in CAP
What is your understanding of your responsibility in this program?
Participant
Respondents 299
Keep Up With Payments 81%

www.appriseinc.org Customer Surveys
APPRISE Incorporated Page 71
What is your understanding of your responsibility in this program?
Participant
Be On A Budget 10%
Energy Conservation/Energy Efficiency 8%
Recertify/Verify Income Every One Or Two Years 6%
Notify PECO If Income Changes 5%
Accept Weatherization/LIURP Services 2%
Apply For LIHEAP 2%
Other 2%
Don’t Know 6%
* Note: The sum of the percentages exceeds 100% as some of the respondents provided more than one response.
When asked what they were required to do if their income changed, 80 percent reported that they were supposed to notify PECO and ten percent reported that they were supposed to provide new proof of income.
Table IV-23 Income Change
What do you need to do if your income changes while you are enrolled in the program?
Participant
Respondents 299
Notify PECO 80%
Provide New Proof Of Income 10%
Nothing/Income Won’t Change 3%
Reapply For The Program 3%
Other 2%
Don’t Know 11%
* Note: The sum of the percentages exceeds 100% as some of the respondents provided more than one response.
Respondents were asked what they felt were the benefits of CAP. Table IV-24A shows that respondents were most likely to report lower energy bills, followed by budget billing, not having their service shut off, and reduced arrearages.

www.appriseinc.org Customer Surveys
APPRISE Incorporated Page 72
Table IV-24A Benefits of CAP (Unprompted)
What do you feel are the benefits of the program?
Participant
Respondents 299
Lower Energy Bills 51%
Budget Billing/Even Payments 23%
Keeping Energy Service/Not Having Service Turned Off 14%
Provides Assistance 11%
Reduced Money Owed To PECO/Reduced Arrearages 10%
Helps Pay My Other Bills 6%
None/Not Good/No Benefits 1%
Other 2%
Don’t Know 6%
* Note: The sum of the percentages exceeds 100% as some of the respondents provided more than one response.
Table IV-24B shows that the respondents were even more likely to report that the program provided important benefits when prompted specifically about the potential benefits. When asked specifically whether they felt the program provided certain benefits, 96 percent agreed that the program provided lower energy bills, 87 percent agreed that it helped maintain their energy service, and 75 percent agreed that it helped to reduce arrearages. The table also shows that when asked to report the most important benefit of the program, respondents were most likely to cite lower energy bills, followed by the ability to maintain their energy service.
Table IV-24B Prompted Benefits and Most Important Benefit of CAP
Do you feel _____ is a benefit of the program? Lower energy bills? Not having your energy service turned off? A reduction in your past due balance or in
the amount of past bills that were not paid?
What do you feel is the single most important benefit of the program?
Participant
Respondents 299
Lower Energy Bills 96% 39%
Keeping Energy Service 87% 29%
Reduced Arrearages 75% 6%
Budget Billing/Even Payments 10%
Provides Assistance 9%

www.appriseinc.org Customer Surveys
APPRISE Incorporated Page 73
Do you feel _____ is a benefit of the program? Lower energy bills? Not having your energy service turned off? A reduction in your past due balance or in
the amount of past bills that were not paid?
What do you feel is the single most important benefit of the program?
Participant
None/Not Good/No Benefits 1%
Other 2%
Don’t Know 4%
Table IV-24C compares responses to the question about the most important benefit of CAP across different utility CAP respondents. The table shows that responses were fairly similar across the programs. Respondents in all programs were most likely to report that the most important benefit was either lower energy bills or keeping their energy service.
Table IV-24C Most Important Benefit of CAP – Comparison Table
What do you feel is the most important benefit of the program?
PECO Allegheny PPL PG Energy
Respondents 299 133 103 54
Lower Energy Bills 39% 33% 28% 22%
Keeping Energy Service 29% 32% 28% 37%
Even Payments 10% 15% 11% 19%
Reduced Arrearages 6% 5% 8% 7%
Other 12% 11% 19% 16%
Don’t Know 4% 5% 6% 0%
Table IV-25 displays responses to a question about participant requirements to have PECO forgive past due balances. Twenty-one percent of respondents said that they had to pay their CAP Rate bill on time. Other respondents said that they had to pay the bill on time and in full or to pay the bill in full. Forty percent reported that they did not know what they had to do to receive arrearage forgiveness.
Table IV-25 Arrearage Forgiveness
What do you need to do to have PECO forgive past due balances or arrearages?
Participant
Respondents 299
Pay CAP Rate Bill On Time 21%
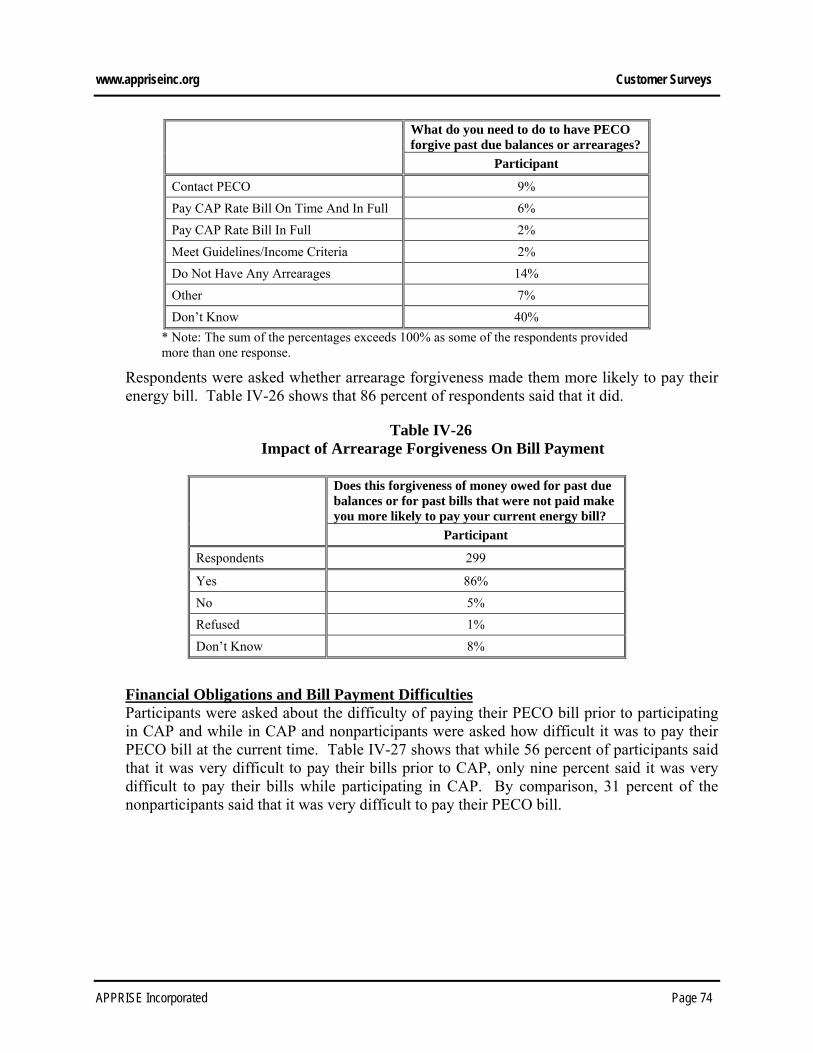
www.appriseinc.org Customer Surveys
APPRISE Incorporated Page 74
What do you need to do to have PECO forgive past due balances or arrearages?
Participant
Contact PECO 9%
Pay CAP Rate Bill On Time And In Full 6%
Pay CAP Rate Bill In Full 2%
Meet Guidelines/Income Criteria 2%
Do Not Have Any Arrearages 14%
Other 7%
Don’t Know 40%
* Note: The sum of the percentages exceeds 100% as some of the respondents provided more than one response.
Respondents were asked whether arrearage forgiveness made them more likely to pay their energy bill. Table IV-26 shows that 86 percent of respondents said that it did.
Table IV-26 Impact of Arrearage Forgiveness On Bill Payment
Does this forgiveness of money owed for past due balances or for past bills that were not paid make you more likely to pay your current energy bill?
Participant
Respondents 299
Yes 86%
No 5%
Refused 1%
Don’t Know 8%
Financial Obligations and Bill Payment Difficulties Participants were asked about the difficulty of paying their PECO bill prior to participating in CAP and while in CAP and nonparticipants were asked how difficult it was to pay their PECO bill at the current time. Table IV-27 shows that while 56 percent of participants said that it was very difficult to pay their bills prior to CAP, only nine percent said it was very difficult to pay their bills while participating in CAP. By comparison, 31 percent of the nonparticipants said that it was very difficult to pay their PECO bill.
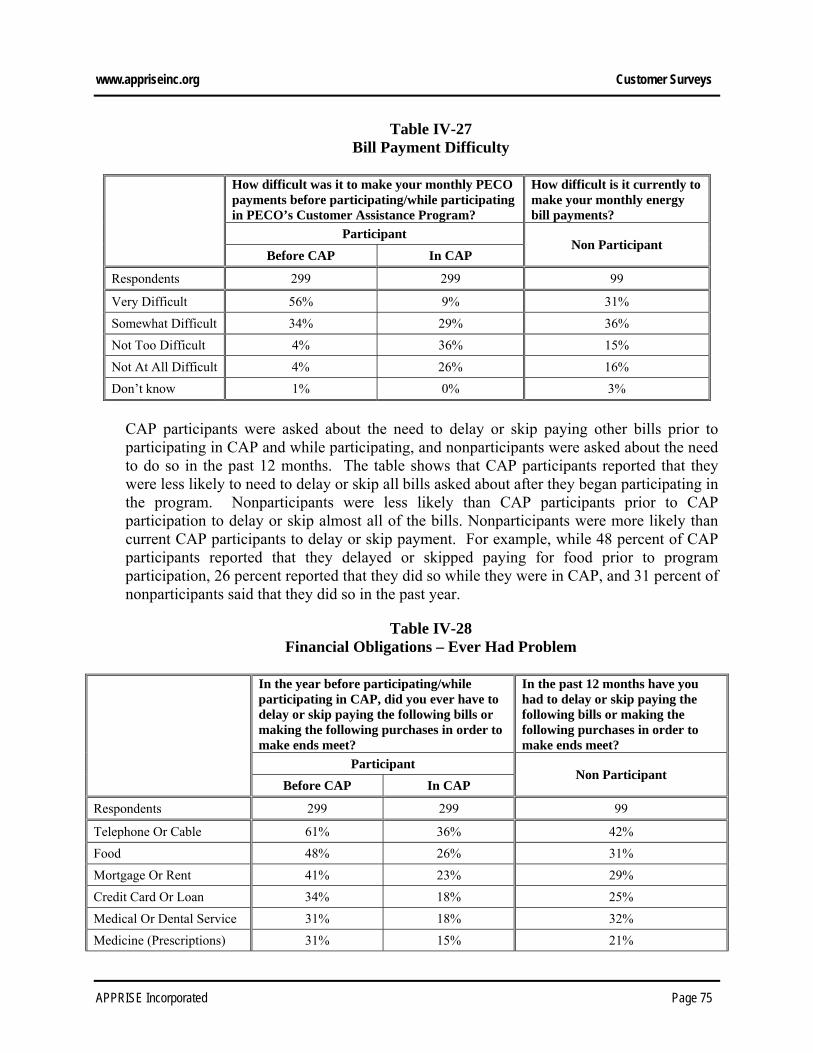
www.appriseinc.org Customer Surveys
APPRISE Incorporated Page 75
Table IV-27 Bill Payment Difficulty
How difficult was it to make your monthly PECO payments before participating/while participating in PECO’s Customer Assistance Program?
How difficult is it currently to make your monthly energy bill payments?
Participant Non Participant
Before CAP In CAP
Respondents 299 299 99
Very Difficult 56% 9% 31%
Somewhat Difficult 34% 29% 36%
Not Too Difficult 4% 36% 15%
Not At All Difficult 4% 26% 16%
Don’t know 1% 0% 3%
CAP participants were asked about the need to delay or skip paying other bills prior to participating in CAP and while participating, and nonparticipants were asked about the need to do so in the past 12 months. The table shows that CAP participants reported that they were less likely to need to delay or skip all bills asked about after they began participating in the program. Nonparticipants were less likely than CAP participants prior to CAP participation to delay or skip almost all of the bills. Nonparticipants were more likely than current CAP participants to delay or skip payment. For example, while 48 percent of CAP participants reported that they delayed or skipped paying for food prior to program participation, 26 percent reported that they did so while they were in CAP, and 31 percent of nonparticipants said that they did so in the past year.
Table IV-28 Financial Obligations – Ever Had Problem
In the year before participating/while participating in CAP, did you ever have to delay or skip paying the following bills or making the following purchases in order to make ends meet?
In the past 12 months have you had to delay or skip paying the following bills or making the following purchases in order to make ends meet?
Participant Non Participant
Before CAP In CAP
Respondents 299 299 99
Telephone Or Cable 61% 36% 42%
Food 48% 26% 31%
Mortgage Or Rent 41% 23% 29%
Credit Card Or Loan 34% 18% 25%
Medical Or Dental Service 31% 18% 32%
Medicine (Prescriptions) 31% 15% 21%
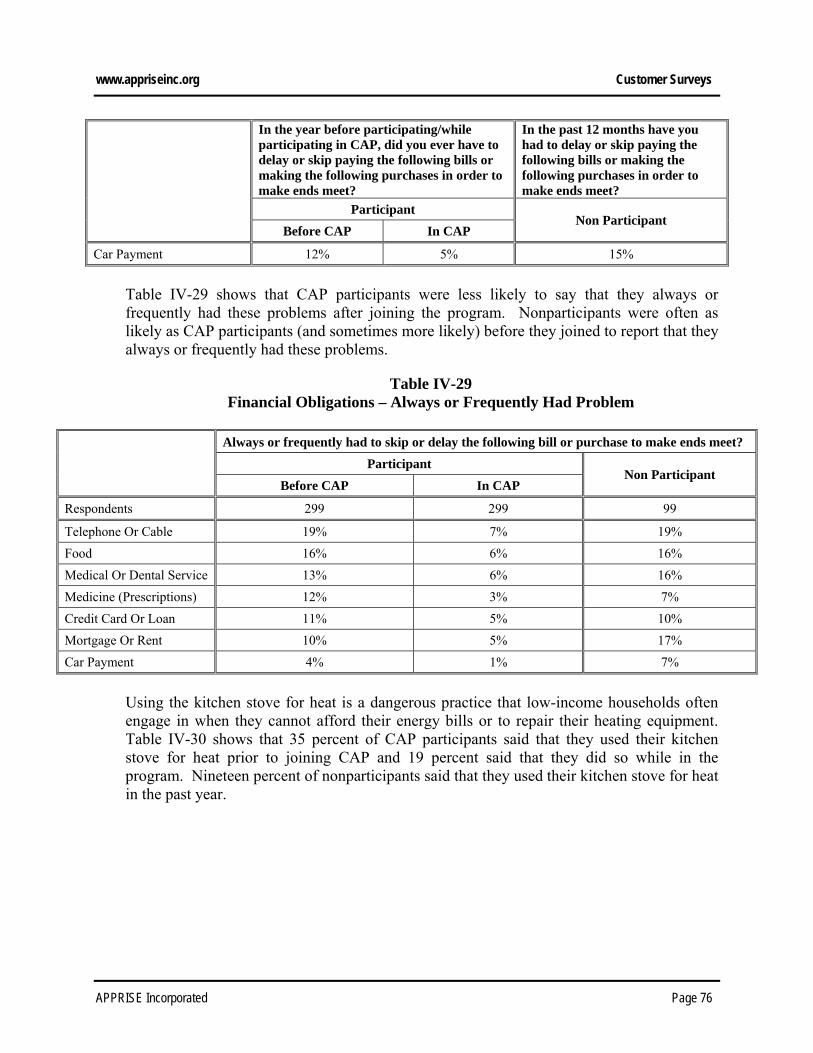
www.appriseinc.org Customer Surveys
APPRISE Incorporated Page 76
In the year before participating/while participating in CAP, did you ever have to delay or skip paying the following bills or making the following purchases in order to make ends meet?
In the past 12 months have you had to delay or skip paying the following bills or making the following purchases in order to make ends meet?
Participant Non Participant
Before CAP In CAP
Car Payment 12% 5% 15%
Table IV-29 shows that CAP participants were less likely to say that they always or frequently had these problems after joining the program. Nonparticipants were often as likely as CAP participants (and sometimes more likely) before they joined to report that they always or frequently had these problems.
Table IV-29 Financial Obligations – Always or Frequently Had Problem
Always or frequently had to skip or delay the following bill or purchase to make ends meet?
Participant Non Participant
Before CAP In CAP
Respondents 299 299 99
Telephone Or Cable 19% 7% 19%
Food 16% 6% 16%
Medical Or Dental Service 13% 6% 16%
Medicine (Prescriptions) 12% 3% 7%
Credit Card Or Loan 11% 5% 10%
Mortgage Or Rent 10% 5% 17%
Car Payment 4% 1% 7%
Using the kitchen stove for heat is a dangerous practice that low-income households often engage in when they cannot afford their energy bills or to repair their heating equipment. Table IV-30 shows that 35 percent of CAP participants said that they used their kitchen stove for heat prior to joining CAP and 19 percent said that they did so while in the program. Nineteen percent of nonparticipants said that they used their kitchen stove for heat in the past year.

www.appriseinc.org Customer Surveys
APPRISE Incorporated Page 77
Table IV-30 Used Kitchen Stove for Heat
In the year before participating in CAP, did you use your kitchen stove or oven to provide heat? While participating in CAP, have you used your kitchen stove or oven to provide heat?
In the past 12 months, have you used your kitchen stove or oven to provide heat?
Participant Non Participant
Before CAP In CAP
Respondents 299 299 99
Yes 35% 19% 19%
No 65% 81% 81%
Table IV-31 shows that CAP participants reported they were less likely to always or frequently use their kitchen stove for heat after they joined the program. Nonparticipants were also less likely to report that they always or frequently needed to use their kitchen stove for heat than CAP participants prior to joining the program.
Table IV-31 Frequency of Kitchen Stove Use
Did you/ do you always, frequently, or sometimes use your kitchen stove or oven for heat?
Participant Non Participant
Before CAP In CAP
Respondents 299 299 99
Always 5% 3% 2%
Frequently 6% 1% 1%
Sometimes 23% 14% 16%
Did Not Use For Heat 65% 81% 81%
Don’t Know 1% 0% 0%
Respondents were asked whether there was a time that they wanted to use their main source of heat, but could not because their heating system was broken and they could not afford to pay for its repair or replacement. Table IV-32 shows that 24 percent of CAP participants reported that they experienced this problem prior to CAP enrollment and 16 percent experienced this problem while participating in the program. Fourteen percent of nonparticipants said that they experienced this problem in the past year.
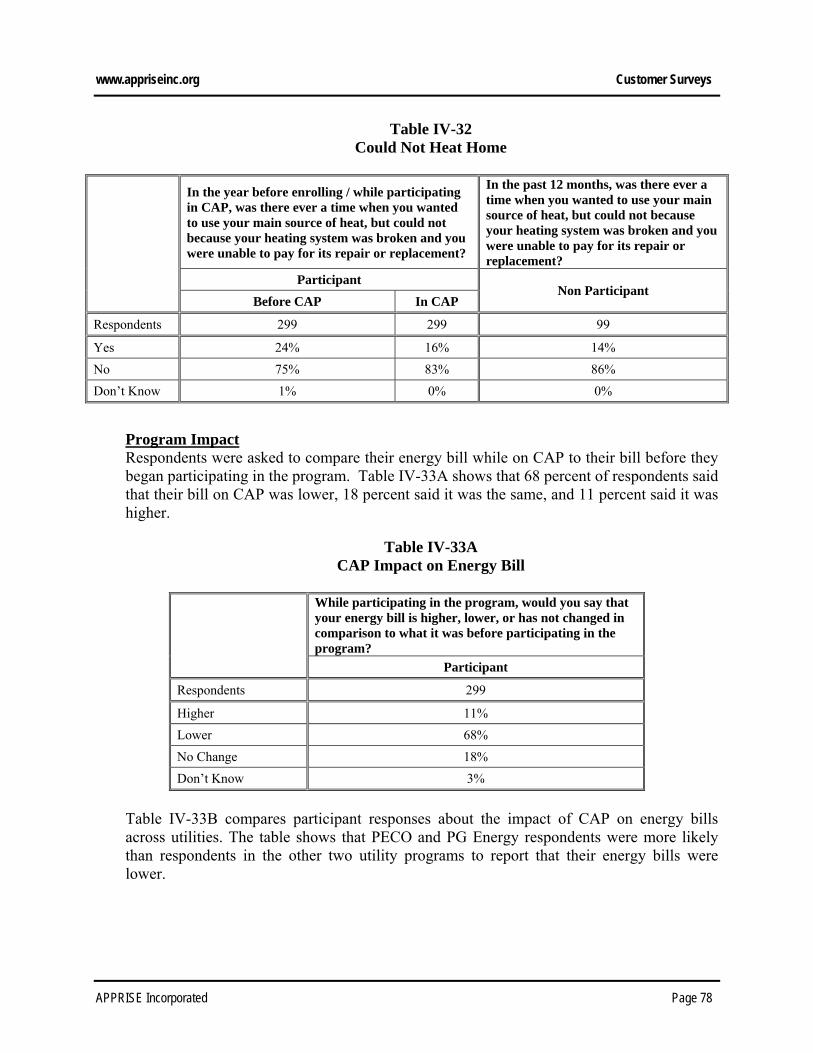
www.appriseinc.org Customer Surveys
APPRISE Incorporated Page 78
Table IV-32 Could Not Heat Home
In the year before enrolling / while participating in CAP, was there ever a time when you wanted to use your main source of heat, but could not because your heating system was broken and you were unable to pay for its repair or replacement?
In the past 12 months, was there ever a time when you wanted to use your main source of heat, but could not because your heating system was broken and you were unable to pay for its repair or replacement?
Participant Non Participant
Before CAP In CAP
Respondents 299 299 99
Yes 24% 16% 14%
No 75% 83% 86%
Don’t Know 1% 0% 0%
Program Impact Respondents were asked to compare their energy bill while on CAP to their bill before they began participating in the program. Table IV-33A shows that 68 percent of respondents said that their bill on CAP was lower, 18 percent said it was the same, and 11 percent said it was higher.
Table IV-33A CAP Impact on Energy Bill
While participating in the program, would you say that your energy bill is higher, lower, or has not changed in comparison to what it was before participating in the program?
Participant
Respondents 299
Higher 11%
Lower 68%
No Change 18%
Don’t Know 3%
Table IV-33B compares participant responses about the impact of CAP on energy bills across utilities. The table shows that PECO and PG Energy respondents were more likely than respondents in the other two utility programs to report that their energy bills were lower.

www.appriseinc.org Customer Surveys
APPRISE Incorporated Page 79
Table IV-33B CAP Impact on Energy Bill – Comparison Table
While participating in the program, would you say that your energy bill is higher, lower, or has not changed in comparison to what it was before participating in the program?
PECO Allegheny PPL PG Energy
Respondents 299 133 103 54
Higher 11% 17% 12% 13%
Lower 68% 52% 60% 70%
No Change 18% 23% 21% 7%
Don’t Know 3% 8% 7% 9%
One concern that program stakeholders often have is that reducing the cost of energy will result in increased energy usage. Respondents were asked whether their energy usage was higher, lower, or had not changed as compared to before they participated in CAP. Table IV-34A shows that 45 percent said their usage had not changed, 36 percent said it was lower, and 15 percent said it was higher.
Table IV-34A CAP Impact on Energy Usage
While participating in the program, would you say that your energy usage was higher, lower, or has not changed in comparison to what it was before participating in the program? By energy usage, we mean the amount of electricity and/or natural gas that you use, not the dollar amount on your bill.
Participant
Respondents 299
Higher 15%
Lower 36%
No Change 45%
Don’t Know 5%
Table IV-34B compares responses across utilities to the question about changes in energy usage after participating in CAP. The table shows that PECO CAP respondents were more likely than participants in other utilities’ programs to report that their energy usage was lower after participating in CAP. While 36 percent of PECO’s respondents said that their energy usage was lower, between 22 and 27 percent of respondents to the other utilities’ surveys said that their energy usage was lower.
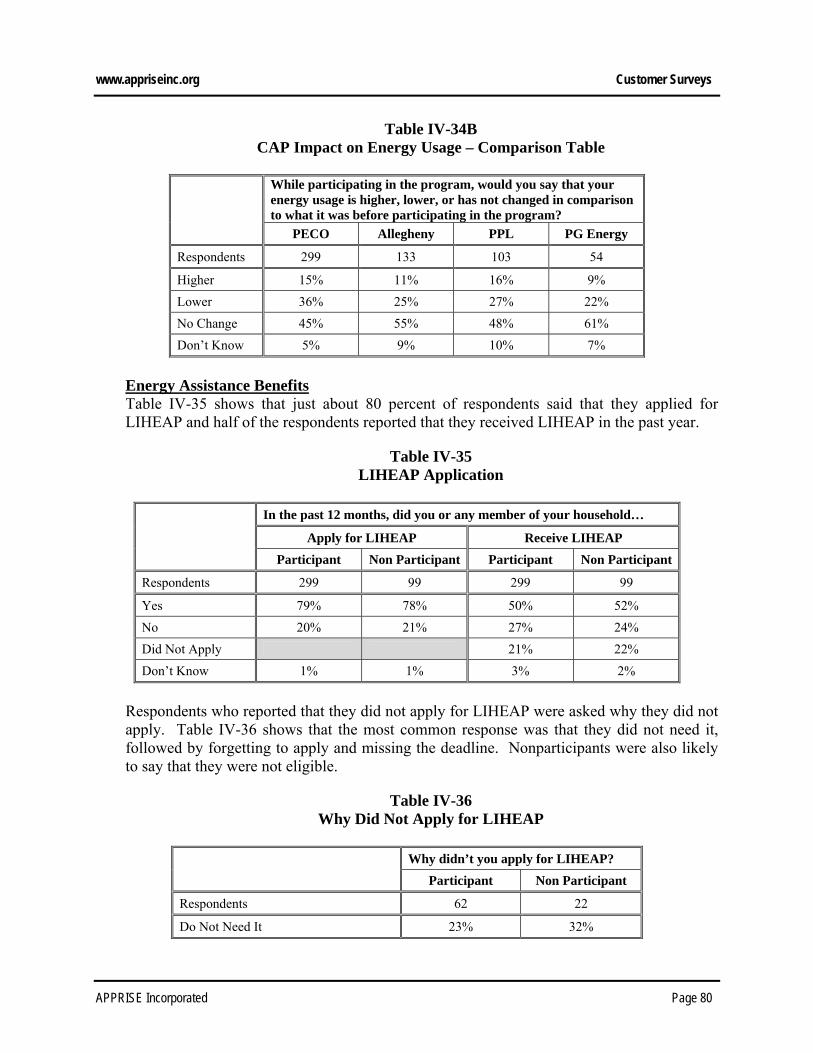
www.appriseinc.org Customer Surveys
APPRISE Incorporated Page 80
Table IV-34B CAP Impact on Energy Usage – Comparison Table
While participating in the program, would you say that your energy usage is higher, lower, or has not changed in comparison to what it was before participating in the program?
PECO Allegheny PPL PG Energy
Respondents 299 133 103 54
Higher 15% 11% 16% 9%
Lower 36% 25% 27% 22%
No Change 45% 55% 48% 61%
Don’t Know 5% 9% 10% 7%
Energy Assistance Benefits Table IV-35 shows that just about 80 percent of respondents said that they applied for LIHEAP and half of the respondents reported that they received LIHEAP in the past year.
Table IV-35 LIHEAP Application
In the past 12 months, did you or any member of your household…
Apply for LIHEAP Receive LIHEAP
Participant Non Participant Participant Non Participant
Respondents 299 99 299 99
Yes 79% 78% 50% 52%
No 20% 21% 27% 24%
Did Not Apply 21% 22%
Don’t Know 1% 1% 3% 2%
Respondents who reported that they did not apply for LIHEAP were asked why they did not apply. Table IV-36 shows that the most common response was that they did not need it, followed by forgetting to apply and missing the deadline. Nonparticipants were also likely to say that they were not eligible.
Table IV-36 Why Did Not Apply for LIHEAP
Why didn’t you apply for LIHEAP?
Participant Non Participant
Respondents 62 22
Do Not Need It 23% 32%

www.appriseinc.org Customer Surveys
APPRISE Incorporated Page 81
Why didn’t you apply for LIHEAP?
Participant Non Participant
Forgot/Did Not Get To It/Didn’t Bother 18% 0%
Missed Deadline 11% 0%
Not Eligible 9% 24%
Did Not Know About The Program 8% 16%
Applied In The Past 8% 5%
Did Not Have Documentation 4% 14%
Did Not Know How/Where To Apply 2% 0%
Other 12% 4%
Don’t Know 7% 5%
Program Success Nonparticipants were asked whether they would be interested in enrolling in CAP if they were currently eligible. Table IV-37 shows that 75 percent of nonparticipants said that they would be interested in enrolling.
Table IV-37 Interest in CAP Enrollment
If you were currently eligible under program rules, would you be interested in enrolling in PECO’s Customer Assistance Program?
Non Participant
Respondents 99
Yes 75%
No 22%
Don’t Know 3%
CAP participants were asked how likely they thought they were to continue to participate in CAP. Table IV-38A shows that 89 percent said that they were very likely to continue to participate and eight percent said they were somewhat likely.
Table IV-38A Continued CAP Participation
How likely are you to continue to participate in the Customer Assistance Program? Would you say you are very likely, somewhat likely, not too likely, or not at all likely?
Participant
Respondents 299
Very Likely 89%

www.appriseinc.org Customer Surveys
APPRISE Incorporated Page 82
How likely are you to continue to participate in the Customer Assistance Program? Would you say you are very likely, somewhat likely, not too likely, or not at all likely?
Participant
Somewhat Likely 8%
Not Too Likely 0%
Not At All Likely 1%
Don’t Know 2%
Table IV-38 compares responses about likelihood of continued CAP participation across utilities. The table shows that responses are very similar across the utilities.
Table IV-38B Continued CAP Participation
How likely are you to continue to participate in the program? Would you say you are very likely, somewhat likely, not too likely, or not at all likely?
PECO Allegheny PPL PG Energy
Respondents 299 133 103 54
Very Likely 89% 87% 92% 91%
Somewhat Likely 8% 7% 6% 7%
Not Too Likely 0% 2% 0% 0%
Not At All Likely 1% 2% 1% 2%
Don’t Know 2% 2% 1% 0%
CAP Assistance and Satisfaction When asked how important PECO’s CAP has been in helping them meet their needs, 85 percent of respondents said it was very important and nine percent said it was somewhat important. Only four percent said it was of little importance and only one percent said it was not at all important.
Table IV-39A Importance of CAP
How important has PECO’s Customer Assistance Program been in helping you to meet your needs? Would you say it has been very important, somewhat important, of little importance, or not at all important?
Participant
Respondents 299
Very Important 85%
Somewhat Important 9%

www.appriseinc.org Customer Surveys
APPRISE Incorporated Page 83
How important has PECO’s Customer Assistance Program been in helping you to meet your needs? Would you say it has been very important, somewhat important, of little importance, or not at all important?
Participant
Of Little Importance 4%
Not At All Important 1%
Don’t Know 1%
Table IV-39A compares responses across utilities to the question about the importance of CAP. The table shows that responses were very similar across the utilities.
Table IV-39A Importance of CAP – Comparison Table
How important has the program been in helping you to meet your needs? Would you say it has been very important, somewhat important, of little importance, or not at all important?
PECO Allegheny PPL PG Energy
Respondents 299 133 103 54
Very Important 85% 87% 91% 87%
Somewhat Important 9% 9% 8% 11%
Not Too Important 4% 2% 0% 0%
Not At All Important 1% 2% 1% 2%
Don’t Know 1% 1% 0% 0%
When asked whether they feel that they need additional assistance to pay their energy bill, 54 percent of participants and 70 percent of nonparticipants said that they did need additional assistance.
Table IV-40A Additional Assistance Needed to Pay Energy Bills
Do you feel that you need additional assistance to pay your energy bill?
Participant Non Participant
Respondents 299 99
Yes 54% 70%
No 46% 27%
Refused 0% 1%
Don’t Know 0% 2%

www.appriseinc.org Customer Surveys
APPRISE Incorporated Page 84
Table IV-40B compares responses across utility programs to whether additional assistance was needed. The table shows that a higher percentage of PECO and PG Energy participants than those in the other programs said that they needed additional assistance. PECO respondents may be more likely to say that additional assistance was needed because of the higher cost of living in the Philadelphia area and surrounding counties than in other parts of Pennsylvania.
Table IV-40B Additional Assistance Needed to Pay Energy Bills – Comparison Table
Do you feel you need additional assistance to pay your energy bill?
PECO Allegheny PPL PG Energy
Respondents 299 133 103 54
Yes 54% 40% 36% 52%
No 46% 60% 63% 44%
Don’t Know 0% 0% 1% 4%
Respondents were asked what types of additional assistance were needed. Table IV-41 shows that the most common responses were more bill payment assistance and a lower energy bill.
Table IV-41 Type of Additional Assistance Needed to Pay Energy Bills
What additional assistance do you need to pay your bill?
Participant Non Participant
Respondents 159 69
More Bill Payment Assistance 32% 32%
Lower Bill 12% 10%
LIHEAP 3% 8%
Anything/Whatever Is Out There 3% 4%
More Time To Pay The Bill 2% 1%
Want To Enroll In CAP 1% 8%
Other 4% 5%
Do Not Need Additional Assistance 46% 30%
Don’t Know 6% 13%
Respondents were asked how satisfied they were with the CAP program overall. Table IV-42A shows that 77 percent said that they were very satisfied and 18 percent said that they were somewhat satisfied. Only four percent said they were dissatisfied.

www.appriseinc.org Customer Surveys
APPRISE Incorporated Page 85
Table IV-42A CAP Satisfaction
Overall, how satisfied are you with the Customer Assistance Program? Would you say that you are very satisfied, somewhat satisfied, somewhat dissatisfied, or very dissatisfied?
Participant
Respondents 299
Very Satisfied 77%
Somewhat Satisfied 18%
Somewhat Dissatisfied 2%
Very Dissatisfied 2%
Don’t Know 1%
Table IV-42B compares satisfaction across utility programs. The table shows that PECO respondents were somewhat less likely to report that they were very satisfied with the program than the other utility respondents.
Table IV-42B CAP Satisfaction – Program Comparison
Overall, how satisfied were you with the program? Would you say that you are very satisfied, somewhat satisfied, somewhat dissatisfied, or very dissatisfied?
PECO Allegheny PPL PG Energy
Respondents 299 133 103 54
Very Satisfied 77% 87% 91% 87%
Somewhat Satisfied 18% 8% 8% 9%
Somewhat Dissatisfied 2% 1% 1% 0%
Very Dissatisfied 2% 4% 0% 2%
Don’t Know 1% 1% 0% 2%
C. Summary of Survey Findings
Key findings from the CAP Survey are highlighted below.
Vulnerable households – CAP participants were likely to have vulnerable household members. Twenty-five percent of participants had a child age five or younger in the home, 38 percent had an elderly member age 60 or older, and 41 percent had a disabled household member.
Income source – While 73 percent of CAP participants reported that they received non-cash benefits in the past year, 43 percent reported that they received public assistance,

www.appriseinc.org Customer Surveys
APPRISE Incorporated Page 86
28 percent reported that they received retirement income, and 26 percent reported that they received wages or self-employment income. Nonparticipants were less likely to report that they received non-cash benefits and public assistance.
Unemployment – When asked whether someone in the household was unemployed and
looking for work in the past 12 months, 32 percent of CAP participants and 32 percent of nonparticipants said that someone in the home had experienced unemployment.
Annual household income – CAP participants were likely to report lower income than
nonparticipants. While 32 percent of CAP participants reported that the household’s annual income was below $10,000, 13 percent of nonparticipants reported that household income was this low. While 15 percent of nonparticipants reported that the annual household income was $30,000 or more, only six percent of participants reported income of $30,000 or more.
CAP awareness – About half of the nonparticipants were aware of the CAP Rate. Those
who were aware were most likely to say that they did not participate because their income was too high or they did not need energy assistance.
CAP understanding – Most CAP participants did not know the level of discount received
on their bill. When asked what percentage discount they received, 89 percent reported that they did not know. However, 88 percent said that they felt they had a good understanding of the CAP program and 81 percent reported that their responsibility was to keep up with their payments.
CAP enrollment – CAP participants were not likely to report that it was difficult to
enroll. Only seven percent said it was somewhat or very difficult to enroll, about the same as CAP program participants in other PA utility CAP programs.
CAP benefits – CAP participants were most likely to report that the most important
benefit of the program was lower energy bills, followed by the ability to keep their energy service, and then by even monthly payments.
CAP impact on affordability – CAP participants reported that the program has helped
with energy bill affordability and affordability of other expenses. While 56 percent of respondents said that it was very difficult to pay their PECO bill prior to CAP participation, only nine percent said it was very difficult while participating. While 31 percent said they had to delay medical or dental service prior to CAP participation, only 18 percent said they had to do so while participating in CAP.
CAP impact on energy bill and usage – When asked to compare their energy bill to
before CAP participation, 68 percent said that their bill was lower. When asked to compare usage, 36 percent said their usage was lower, 45 percent said there was no change, and 15 percent said it was higher.

www.appriseinc.org Customer Surveys
APPRISE Incorporated Page 87
LIHEAP – While 79 percent of participants reported that they applied for LIHEAP in the past 12 months, 50 percent said that they received it. Those who did not apply were most likely to say the reason was that they did not need it, they forgot or did not get around to applying, or they missed the deadline.
CAP importance and satisfaction – Participants were likely to report that the CAP was
very important. While 85 percent said it was very important in helping them to meet their needs, 9 percent said it was somewhat important. Ninety-five percent said that they were very or somewhat satisfied with the program.

www.appriseinc.org CAP Impacts Analysis
APPRISE Incorporated Page 88
V. CAP Impacts Analysis
This section describes the methodology and results from the analysis of CAP program, billing and payment data, and collections data. The available data were used to develop gross and net performance statistics for the CAP program and answer many of the evaluation questions.
A. Goals
There were several goals for the CAP impacts analysis. Characterize the CAP participants. Analyze CAP retention rates. Assess the impact of CAP on energy affordability. Determine whether CAP improves participants’ bill payment compliance. Ascertain the impact of CAP participation on LIHEAP receipt. Evaluate whether CAP impacts collections actions and costs.
B. Methodology
This section describes the evaluation data and the selection of participants for the impact analysis.
Evaluation Data PECO provided APPRISE with household demographic data, CAP program data, billing and payment data, and collections data for CAP participants and low-income customers who did not participate in the CAP.
Selected Participants: Study Groups Customers who enrolled in CAP between January 1, 2010 and December 31, 2010 and did not participate in CAP in the year prior to enrollment were included as potential members of the study group. This group was chosen for the analysis, as one full year of post-program data is required for an analysis of program impacts.
Customers who participated in the CAP in the year prior to enrollment were excluded from the analysis, to allow for a comparison of data while not participating and while participating in the CAP. Customers who did not have a full year of data prior to joining the program or a full year of data following the program start date were not included in the impact analysis. The subject of data attrition is addressed more fully below.
Selected Participants: Comparison Groups Comparison groups were constructed for the CAP data analysis to control for exogenous factors. The comparison groups were designed to be as similar as possible to the treatment group, those who received services and who we are evaluating, so that the exogenous changes for the comparison groups are as similar as possible to those of the treatment group.

www.appriseinc.org CAP Impacts Analysis
APPRISE Incorporated Page 89
When measuring the impact of an intervention, it is necessary to recognize other exogenous factors that can impact changes in outcomes. Changes in a client’s payment behavior and bill coverage rate, between the year preceding CAP enrollment and the year following enrollment, may be affected by many factors other than program services received. Some of these factors include changes in household composition or health of family members, changes in utility prices, changes in weather, and changes in the economy.
The ideal way to control for other factors that may influence payment behavior would be to randomly assign low-income customers to a treatment or control group. The treatment group would be given the opportunity to participate in the program first. The control group would not be given an opportunity to participate in the program until one full year later. This would allow evaluators to determine the impact of the program by subtracting the change in behavior for the control group from the change in behavior for the treatment group. Such random assignment is rarely done in practice because of a desire to include all eligible customers in the benefits of the program or to target a program to those who are most in need.
In the evaluation of the CAP, we were able to obtain two good comparison groups. Each comparison group is described below.
2011 CAP Enrollee Comparison Group: We use customers who last enrolled in the CAP in 2011 and who did not receive CAP discounts in the two years preceding enrollment as a comparison group. We require that they have no discounted bills in the two years preceding enrollment to ensure that they are nonparticipants in both periods. These participants serve as a good comparison because they are lower income households who were eligible for the program and chose to participate. We use data for these participants for the two years preceding CAP enrollment, to compare their change in payment behavior in the years prior to enrolling to the treatment group’s change in payment behavior after enrolling. Because these customers did not participate in the CAP in both analysis years, changes in bills and behavior should be related to factors that are exogenous to the program.
Low-Income Nonparticipant Comparison Group: We obtained a sample of customers who PECO identified as low-income and had not enrolled in the CAP, to utilize as a comparison group. The group of customers was replicated to represent customers who enrolled in the program in each quarter of 2010. A quasi intervention date of the middle of the quarter was chosen for each group to compare to the participating customers who enrolled in that quarter.
The actual impact of the CAP on customer affordability and payment is estimated as the average of the estimates using the two comparison groups. The 2011 enrollees are probably worse off in their quasi-post year because it is the year prior to program enrollment, when they probably need more assistance in paying their bills. The low-income nonparticipants are probably somewhat better off than the 2010 enrollees, because they have not needed to enroll in the program.

www.appriseinc.org CAP Impacts Analysis
APPRISE Incorporated Page 90
For the CAP program impact analysis, we examined pre and post-treatment statistics. The difference between the pre and post-treatment statistics for the treatment group is considered the gross change. This is the actual change in behaviors and outcomes for those participants who were served by the program. Some of these changes may be due to the program, and some of these changes are due to other exogenous factors, but this is the customer’s actual experience. The net change is the difference between the change for the treatment group and the change for the comparison group, and represents the actual impact of the program, controlling for other exogenous changes.
The data that were used for the study and comparison groups were as follows:
2010 CAP enrollee treatment group data extended from one year before the customer joined the CAP to one year after the customer joined the CAP.
2011 CAP enrollee comparison group data extended two years before the customer joined the CAP.
Low-income nonparticipant comparison group data included one year of data before the mid-point of the first quarter of 2010 to one year of data after the mid-point of the last quarter of 2010.
Table V-1 describes the treatment and comparison groups that are included in the analyses in this section.
Table V-1 Treatment and Comparison Groups
2010 Enrollee
Treatment Group 2011 Enrollee
Comparison Group Nonparticipant
Comparison Group
Group 2010 CAP Enrollees 2011 CAP Enrollees Nonparticipants
Enrollment Requirement
Last enrollment date is in 2010
Last enrollment date is in 2011 Did not participate
in CAP
CAP Participation Requirement
Did not participate in the CAP in the year prior to
enrollment
Did not participate in the CAP in the two years prior to
enrollment
Did not participate in CAP
Pre-participation Dates
1 year prior to enrollment 2 years prior to enrollment One year prior to the quasi
enrollment dates of 2/15/10, 5/15/10, 7/15/10, 11/15/10
Post-participation Dates
1 year after enrollment 1 year prior to enrollment One year after the quasi
enrollment dates of 2/15/10, 5/15/10, 7/15/10, 11/15/10
2011 CAP Participants In addition to examining CAP statistics and impact for the 2010 enrollees and comparison groups, we furnish information on all 2011 CAP participants to provide a more comprehensive understanding of the program characteristics of the CAP participants as a whole.

www.appriseinc.org CAP Impacts Analysis
APPRISE Incorporated Page 91
C. Data Attrition
Table V-2A provides the attrition analysis for the treatment and comparison groups. Many of the 2010 enrollees could not be included in the analysis group because they did not have close to a full year of pre-enrollment billing data. Customers were also eliminated from the analysis group because they did not have pre-enrollment payment data, they did not have close to a full year of post-enrollment billing or payment data, they had very high or low values for the billing and/or payment statistics, and they had fewer than 11 or more than 13 bills in the one-year pre and/or post periods examined. After eliminating these cases, 33 percent of the treatment group could be included in the analysis.
The 2011 enrollee comparison group was less likely to have sufficient data for inclusion in the analysis. These customers were required to have two years of pre-enrollment billing and payment data available and only 19 percent could be included in the analysis.
The 2010 nonparticipant comparison group was more likely to have the necessary data to be included in the analysis. After eliminating cases for the same reasons, between 55 and 57 percent of these customers could be included in the analysis.
Table V-2A Attrition Analysis
2010 Enrollees and Comparison Groups
2010 Enrollee
Treatment Group
2011 Enrollee Comparison
Group
Nonparticipant Comparison Group
Quasi Enrollment Date
2010 Q1 2010 Q2 2010 Q3 2010 Q4
Billing and Payment Data 46,345 33,504 1,150 1,150 1,149 1,144
No CAP bill in Pre Period 37,640 32,946
No CAP Bill in Post Period 4,660
All Eligible 37,640 4,660 1,150 1,150 1,149 1,144
Sufficient Pre Billing Data 15,393 1,075 658 703 740 787
Sufficient Pre Payment Data 15,230 1,059 658 703 740 785
Sufficient Post Billing Data 12,886 958 651 673 673 676
Sufficient Post Payment Data 12,867 952 651 673 673 676
Outliers Removed 12,611 927 631 654 655 659
11-13 Pre and Post Bills 12,372 907 627 650 647 648
% of Total 33% 19% 55% 57% 56% 57%
Table V-2B displays the attrition analysis for all 2011 participants. The table shows that customers were most likely to be eliminated from the analysis group because they did not have sufficient data for 2011. We were able to include 62 percent of the 2011 participants in the analysis group. Of those in the analysis group, 58 percent participated in CAP for the full year.

www.appriseinc.org CAP Impacts Analysis
APPRISE Incorporated Page 92
Table V-2B Attrition Analysis 2011 Participants
2011 CAP Participants
All 2011 CAP Participants 139,956
Billing and Payment Data 134,896
Sufficient 2011 Billing Data 93,879
Sufficient 2011 Payment Data 93,879
Outliers Removed 89,579
12-13 Bills 87,053
2011 Analysis Group 86,143
% of Total 62%
2011 Full Year CAP 50,333
% of Analysis Group 58%
D. CAP Participant Characteristics
Table V-3 displays the CAP tier of customers who are studied in this section. The table shows that the lower poverty group households were less likely to be included in the analysis group than in the population overall. These households are often less stable and are less likely to maintain utility service with the same account over the two year period needed for the impact analysis. While 22 percent of all 2010 enrollees who did not participate in CAP in the year prior to enrollment had income at or below 50 percent of the poverty level, only 13 percent of those included in the analysis group had income this low. Conversely, while 40 percent of the 2010 enrollees had income above 100 percent of the poverty level, 55 percent of the analysis group had income above the poverty level.
Table V-3 CAP Tier
2011 CAP Participants
2010 Enrollee Treatment Group
All Analysis Group
Full Year CAP
All Analysis Group
Observations 134,896 86,143 50,333 37,640 12,372
Tier Poverty Level
A <25% <1% <1% <1% <1% <1%
B <25% 7% 6% 3% 8% 6%
C 25% - 50% 12% 10% 6% 14% 7%
D 51% - 75% 22% 21% 23% 19% 13%
D1 76% - 100% 25% 27% 31% 18% 19%

www.appriseinc.org CAP Impacts Analysis
APPRISE Incorporated Page 93
2011 CAP Participants
2010 Enrollee Treatment Group
All Analysis Group
Full Year CAP
All Analysis Group
E 101% - 125% 19% 20% 21% 25% 33%
E1 126% – 150% 15% 16% 16% 15% 22%
Total 100% 100% 100% 100% 100%
Table V-4 displays the service type for the customers studied. The table shows that electric baseload customers were more heavily represented in all 2011 participants than in the 2010 enrollee groups.
Table V-4 Service Type
All 2011 CAP Participants
2010 Enrollee Treatment Group
All Analysis Group
Full Year CAP
All Analysis Group
Observations 134,896 86,143 50,333 37,640 12,372
Electric Baseload 74% 76% 78% 65% 62%
Electric Heating 9% 8% 7% 12% 9%
Electric and Gas 17% 16% 15% 19% 23%
Other <1% <1% <1% 4% 6%
Total 100% 100% 100% 100% 100%
Table V-5A displays the CAP tier for electric baseload customers. Sixteen percent of the 2010 analysis group had income at or below 50 percent of poverty, 37 percent had income between 51 and 100 percent, and 48 percent had income above 100 percent of the poverty level.
Table V-5A CAP Tier
Electric Baseload Customers
All 2011 CAP Participants
2010 Enrollee Treatment Group
All Analysis Group
Full Year CAP
All Analysis Group
Observations 99,741 65,836 39,112 24,498 7,715
Tier Poverty Level
A <25% <1% <1% <1% <1% <1%
B <25% 8% 6% 3% 9% 7%
C 25% - 50% 13% 11% 7% 16% 9%

www.appriseinc.org CAP Impacts Analysis
APPRISE Incorporated Page 94
All 2011 CAP Participants
2010 Enrollee Treatment Group
All Analysis Group
Full Year CAP
All Analysis Group
D 51% - 75% 23% 22% 24% 21% 16%
D1 76% - 100% 25% 27% 32% 19% 21%
E 101% - 125% 18% 19% 20% 21% 27%
E1 126% – 150% 13% 15% 14% 14% 21%
Total 100% 100% 100% 100% 100%
Table V-5B displays the CAP tier for electric heating customers. These customers were more likely to have income above the poverty level. Eleven percent of the 2010 analysis group had income at or below 50 percent of poverty, 24 percent had income between 51 and 100 percent, and 66 percent had income above 100 percent of the poverty level.
Table V-5B CAP Tier
Electric Heating Customers
All 2011 CAP Participants
2010 Enrollee Treatment Group
All Analysis Group
Full Year CAP
All Analysis Group
Observations 12,480 6,672 3,571 4,491 1,134
Tier Poverty Level
A <25% <1% <1% 0% <1% <1%
B <25% 7% 6% 3% 7% 5%
C 25% - 50% 11% 8% 4% 11% 6%
D 51% - 75% 20% 18% 19% 19% 8%
D1 76% - 100% 24% 27% 31% 18% 16%
E 101% - 125% 21% 23% 25% 30% 43%
E1 126% – 150% 16% 18% 18% 15% 23%
Total 100% 100% 100% 100% 100%
Table V-5C displays the CAP tier for electric and gas customers. These customers were also more likely than the electric baseload customers to have income above the poverty level. Eight percent of the 2010 analysis group had income at or below 50 percent of poverty, 22 percent had income between 51 and 100 percent, and 70 percent had income above 100 percent of the poverty level.

www.appriseinc.org CAP Impacts Analysis
APPRISE Incorporated Page 95
Table V-5C CAP Tier
Electric and Gas Customers
All 2011 CAP Participants
2010 Enrollee Treatment Group
All Analysis Group
Full Year CAP
All Analysis Group
Observations 22,350 13,413 7,522 7,082 2,841
Tier Poverty Level
A <25% <1% <1% 0% <1% <1%
B <25% 6% 5% 2% 6% 4%
C 25% - 50% 10% 9% 5% 9% 4%
D 51% - 75% 18% 16% 17% 15% 8%
D1 76% - 100% 22% 23% 27% 16% 14%
E 101% - 125% 23% 25% 27% 36% 46%
E1 126% – 150% 20% 22% 22% 19% 24%
Total 100% 100% 100% 100% 100%
E. Retention Rates
Table V-6A displays CAP retention for 2011 CAP participants. The first set of rows displays participation for all customers who participated in CAP at any point in 2011. There were 134,896 customers who participated in CAP at some point in the year. However, the number with bills in any particular month of the year ranged from 82,941 to 112,518. Between 90 and 93 percent of all 2011 participants with bills participated in CAP by month in 2011. We also examined bills and CAP bills for the 2011 analysis group and 2011 full year CAP participants. The 2011 analysis group is those customers who participated in CAP at some point in 2011 and who had close to a full year of billing and payment data available in 2011 to allow annual billing and payment statistics to be examined. The table shows that between 89 and 93 percent participated in CAP in a particular month of 2011. Last, the table displays 2011 participants who were in CAP for the full year, and the number of those participants who had a bill each month. The table shows that 37 percent (50,333 of the 134,896) of customers who participated in CAP were in the program for the full year.

www.appriseinc.org CAP Impacts Analysis
APPRISE Incorporated Page 96
Table V-6A CAP Participation
2011 CAP Participants
Obs. Calendar Year 2011
Jan Feb Mar Apr May Jun Jul Aug Sep Oct Nov Dec
All 2011 Participants
Has Bill
134,896
110,562 108,308 112,518 111,418 109,748 107,555 102,348 101,092 96,806 94,528 88,376 82,941
CAP Bill-#
100,382 98,629 103,025 101,953 100,171 98,408 94,345 93,569 89,328 86,576 80,782 74,884
CAP Bill-%
91% 91% 92% 92% 91% 92% 92% 93% 92% 92% 91% 90%
2011 Analysis Group
Has Bill
86,143
81,548 78,150 80,643 79,609 78,512 77,344 73,981 73,573 65,871 70,066 66,429 64,784
CAP Bill-#
73,815 71,526 74,623 73,912 72,779 71,707 68,853 68,476 71,254 63,985 60,260 57,853
CAP Bill-%
91% 92% 93% 93% 93% 93% 93% 93% 92% 91% 91% 89%
2011 Full Year CAP
Has Bill
50,333
50,239 48,070 50,332 50,310 50,318 50,327 49,113 50,328 50,317 50,321 48,542 49,135
CAP Bill-#
50,239 48,070 50,332 50,310 50,318 50,327 49,113 50,328 50,317 50,321 48,542 49,135
CAP Bill-%
100% 100% 100% 100% 100% 100% 100% 100% 100% 100% 100% 100%
Table V-6B displays CAP retention for 2010 CAP enrollees, for the 12 months following enrollment. The table shows that most customers who had a bill in a particular month continued to have a CAP bill, indicating that customers usually did not leave CAP because they found it not to be beneficial, they no longer needed assistance, or their income increased. By the end of the year following enrollment, 96 percent were still participating in CAP.
Table V-6B CAP Participation
2010 Enrollees
Obs. Months After Enrollment
1 2 3 4 5 6 7 8 9 10 11 12
2010 Enrollees
Has Bill
19,162
19,046 18,601 18,131 17,641 17,137 16,625 16,138 15,656 15,196 14,723 14,251 13,090
CAP Bill-#
18,628 18,181 17,703 17,173 16,650 16,141 15,648 15,163 14,701 14,203 13,761 12,611
CAP Bill-%
98% 98% 98% 97% 97% 97% 97% 97% 97% 96% 97% 96%

www.appriseinc.org CAP Impacts Analysis
APPRISE Incorporated Page 97
Obs. Months After Enrollment
1 2 3 4 5 6 7 8 9 10 11 12
2010 Enrollee Analysis Group
Has Bill
6,460
6,460 6,460 6,460 6,460 6,460 6,460 6,460 6,460 6,460 6,460 6,460 6,355
CAP Bill-#
6,401 6,391 6,389 6,380 6,374 6,369 6,359 6,355 6,354 6,342 6,334 6,181
CAP Bill-%
99% 99% 99% 99% 99% 99% 98% 98% 98% 98% 98% 97%
F. Arrearage Forgiveness
Table V-7A displays the percent of 2011 CAP participants who received arrearage forgiveness in 2011, and statistics on the number of times arrearage forgiveness was received. The table shows that 32 percent of all 2011 CAP participants, 31 percent of the analysis group, and 26 percent of the full year CAP participants received arrearage forgiveness. They received an average of 1.3 arrearage forgiveness payments and an average of $64 to $77 in forgiveness. These customers are likely to have received arrearage forgiveness prior to 2011 as well.
Table V-7A 2011 CAP Participants
Arrearage Forgiveness Received in 2011
Obs.
% Received
Arrearage Forgiveness
Mean # of Arrearage
Forgiveness Payments
Mean $ Forgiven
Median $ Forgiven
All 2011 Participants 134,896 32% 1.3 $77 $0
2011 Analysis Group 86,143 31% 1.4 $73 $0
2011 Full Year CAP 50,333 26% 1.3 $64 $0
Table V-7B displays the percent of 2010 CAP enrollees who received arrearage forgiveness in the year after enrollment, and statistics on the number of times arrearage forgiveness was received. Customers who enrolled in 2010 were more likely to receive arrearage forgiveness than the 2011 participants, even when comparing the full year participants. The table shows that 66 percent of all 2010 enrollees and 72 percent of those in the analysis group received arrearage forgiveness. The mean number of forgiveness payments received was 5.5 for the enrollee treatment group, and the mean amount forgiven was $242.
Approximately 25 percent of the 2010 enrollee treatment group did not have arrearages at the time of enrollment and would not be eligible for arrearage forgiveness. Table V-7B displays arrearage forgiveness statistics for only those 2010 enrollees that had pre-program arrearages. This analysis shows that 96 percent of those eligible for forgiveness received it at some point during the year, they received an average of 7.4 forgiveness payments, and $325 in forgiveness.

www.appriseinc.org CAP Impacts Analysis
APPRISE Incorporated Page 98
Table V-7B 2010 CAP Enrollees
Arrearage Forgiveness Received in the Year After Enrollment
Obs.
% Received
Arrearage Forgiveness
Mean # of Arrearage
Forgiveness Payments
Mean $ Forgiven
Median $ Forgiven
2010 Enrollees 37,640 66% 4.3 $209 $53
2010 Enrollee Analysis Group 12,372 72% 5.5 $242 $107
2010 Enrollee Analysis Group With Pre-Program Arrearages
9,205 96% 7.4 $325 $183
Table V-8A displays the percent of 2011 CAP participants who received arrearage forgiveness each month of 2011. The table shows that each month about 11 to 15 percent of CAP participants received forgiveness. Again, many of these participants received arrearage forgiveness prior to 2011.
Table V-8A 2011 CAP Participants
Arrearage Forgiveness Received by Month in 2011
Obs. Calendar Year 2011
Jan Feb Mar Apr May Jun Jul Aug Sep Oct Nov Dec
All 2011 Participants 134,896 9% 9% 11% 12% 12% 13% 12% 12% 13% 13% 13% 14%
2011 Analysis Group 86,143 11% 11% 14% 15% 15% 15% 14% 13% 13% 13% 13% 12%
2011 Full Year CAP 50,333 13% 13% 15% 16% 15% 15% 13% 11% 11% 10% 10% 9%
Table V-8B displays the percent of 2010 CAP enrollees who received arrearage forgiveness each month following enrollment. The table shows that except in month 12, 44 to 57 percent of participants received arrearage forgiveness. Looking only at those who had pre-program arrearages, between 59 and 76 percent received forgiveness in most months.
Table V-8B 2010 CAP Enrollees
Arrearage Forgiveness Received by Month
Obs. Months After Enrollment
1 2 3 4 5 6 7 8 9 10 11 12
2010 Enrollees 37,474# 48% 45% 44% 42% 40% 38% 37% 35% 34% 33% 32% 23%
2010 Enrollee Analysis Group
12,372 57% 52% 52% 51% 48% 48% 48% 46% 45% 45% 44% 32%

www.appriseinc.org CAP Impacts Analysis
APPRISE Incorporated Page 99
Obs. Months After Enrollment
1 2 3 4 5 6 7 8 9 10 11 12
2010 Enrollee Analysis Group With Pre-Program Arrearages
9,205 76% 70% 69% 68% 65% 64% 64% 62% 60% 61% 59% 43%
#166 accounts were excluded because they did not have bills in the post-period.
G. Affordability
The Pennsylvania Public Utility Commission (PUC) has established standards for energy burdens for CAP participants. This section assesses affordability for CAP participants, as measured by program bills, energy burdens, and energy burden relative to the PUC targets. The tables in this section exclude customers with zero or missing income.
The PUC energy burden targets are displayed in Table V-9. The burden targets vary based on poverty level and service type.
Table V-9 PUC Energy Burden Targets
Poverty Level Energy Burden Targets
Electric Baseload Electric Heating Gas Heating
≤50% 2%-5% 7%-13% 5%-8%
51% - 100% 4%-6% 11%-16% 7%-10%
101% - 150% 6%-7% 15%-17% 9%-10%
Table V-10A displays energy burden relative to the PUC target for 2011 CAP participants. The table shows that while 70 percent of full year 2011 CAP participants had energy burden that was within or below the PUC target range, 30 percent had an energy burden above the target range. The table also provides a comparison with the 2004 participants, and shows that the percent that was above the target declined since the previous evaluation, indicating that the changes PECO made resulted in improved affordability for some customers. While 44 percent were above the target in 2004, 30 percent were above the target in 2011.
Table V-10A 2011 CAP Participants
Energy Burden Relative to PUC Target
Obs. Below Target Within Target Range Above Target
2011 Analysis Group 85,462 44% 16% 39%
2011 Full Year CAP 49,842 53% 17% 30%

www.appriseinc.org CAP Impacts Analysis
APPRISE Incorporated Page 100
Obs. Below Target Within Target Range Above Target
2004 Analysis Group 63,511 36% 19% 45%
2004 Full Year CAP 53,517 36% 19% 44%
Table V-10B displays energy burden relative to the PUC target by CAP tier for 2011 CAP participants. The table shows that lower poverty level groups were more likely to have energy burden above the PUC target. While 84 percent of 2011 full year CAP participants with income less than 25 percent of the poverty level had an energy burden above the target, 17 percent of those with income between 126 and 150 percent of the poverty level had an energy burden above the PUC target.
Table V-10B also shows the percent above the PUC target by poverty level for 2004 full year CAP participants. The table shows that CAP participants in tiers C and D were less likely to have a burden that was above the PUC target in 2011 than in 2004. For example, while 89 percent of tier C CAP participants in 2004 had a burden above the PUC target, 50 percent of tier C CAP participants in 2011 had a burden above the PUC target.
Table V-10B 2011 CAP Participants, By CAP Tier
Energy Burden Relative to PUC Target
2011 Analysis Group 2011 Full Year CAP 2004 Full Year
Obs. Below Target
Within Target Range
Above Target
Obs. Below Target
Within Target Range
Above Target
Obs. Above Target
Tier Poverty Level
A <25% 31 6% 13% 81% 2 0% 50% 50% 13 85%
B <25% 5,293 3% 9% 88% 1,504 5% 11% 84% 1,482 87%
C 25% - 50% 8,731 10% 25% 65% 3,171 16% 34% 50% 4,376 89%
D 51% - 75% 17,836 34% 21% 45% 11,211 41% 22% 36% 36,511 45%
D1 76% - 100% 22,688 43% 22% 34% 15,415 50% 23% 27%
E 101% - 125% 17,150 66% 8% 26% 10,648 71% 7% 22% 11,135 19%
E1 126% – 150% 13,733 72% 7% 21% 7,891 76% 6% 17%
Total 85,462 44% 16% 39% 49,842 53% 17% 30% 53,517 44%
Table V-10C displays energy burden relative to the PUC target by service type for 2011 CAP participants. The table shows that electric baseload customers were most likely to have a burden above the PUC target. While 33 percent of electric baseload customers had a burden above the PUC target, 17 percent of electric heating and electric and gas customers had a burden above the PUC target.

www.appriseinc.org CAP Impacts Analysis
APPRISE Incorporated Page 101
Table V-10C also shows the percent of 2004 full year CAP participants with burdens above the PUC target by service type. The table shows that electric baseload and electric heating participants were less likely to have a burden above the PUC target in 2011 than in 2004. For example, while 48 percent of electric baseload participants had a burden above the PUC target in 2004, 33 percent had a burden above the target in 2011.
Table V-10C 2011 CAP Participants, By Service Type Energy Burden Relative to PUC Target
2011 Analysis Group 2011 Full Year CAP 2004 Full Year
Obs. Below Target
Within Target Range
Above Target
Obs. Below Target
Within Target Range
Above Target
Obs. Above Target
Electric Baseload
65,445 40% 17% 44% 38,801 49% 18% 33% 43,470 48%
Electric Heating
6,635 59% 15% 27% 3,546 68% 15% 17% 7,196 32%
Electric and Gas
13,382 61% 14% 24% 7,495 69% 15% 17% 2,851 20%
Total 85,462 44% 16% 39% 49,842 53% 17% 30% 53,517 44%
Table V-11A displays energy burden relative to the PUC target by CAP tier for 2011 CAP participants with electric baseload service. As with customers overall, electric baseload customers in lower poverty level groups were more likely to have energy burden above the PUC target. While 87 percent of 2011 full year electric baseload CAP participants with income less than 25 percent of the poverty level had an energy burden above the target, 21 percent of those with income between 126 and 150 percent of the poverty level had an energy burden above the PUC target.21
Table V-11A 2011 Electric Baseload CAP Participants, By CAP Tier
Energy Burden Relative to PUC Target
2011 Analysis Group 2011 Full Year CAP
Obs. Below Target
Within Target Range
Above Target
Obs. Below Target
Within Target Range
Above Target
Tier Poverty Level
A <25% 17 12% 18% 71% 2 0% 50% 50%
B <25% 4,251 2% 8% 90% 1,225 4% 9% 87%
C 25% - 50% 7,032 8% 25% 66% 2,647 15% 34% 51%
D 51% - 75% 14,456 31% 21% 48% 9,271 39% 22% 39%
21 As shown in Table V-11A, there were only two CAP customers who remained on the CAP for all of 2011 in Tier A. Thus, there are too few observations to draw any conclusions about this group.

www.appriseinc.org CAP Impacts Analysis
APPRISE Incorporated Page 102
2011 Analysis Group 2011 Full Year CAP
Obs. Below Target
Within Target Range
Above Target
Obs. Below Target
Within Target Range
Above Target
D1 76% - 100% 17,801 39% 22% 38% 12,291 47% 23% 31%
E 101% - 125% 12,263 61% 9% 30% 7,722 66% 8% 25%
E1 126% – 150% 9,625 66% 9% 26% 5,643 71% 8% 21%
Total 65,445 40% 17% 44% 38,801 49% 18% 33%
Table V-11B displays energy burden relative to the PUC target by CAP tier for 2011 CAP participants with electric heating service. These customers were less likely to have burden above the PUC target than the electric baseload customers. However, they also have higher burdens for lower poverty level groups. While 74 percent of 2011 full year electric heating CAP participants with income less than 25 percent of the poverty level had an energy burden above the target, only 7 percent of those with income between 126 and 150 percent had burden above the PUC target.
Table V-11B 2011 Electric Heating CAP Participants, By CAP Tier
Energy Burden Relative to PUC Target
2011 Analysis Group 2011 Full Year CAP
Obs. Below Target
Within Target Range
Above Target
Obs. Below Target
Within Target Range
Above Target
Tier Poverty Level
A <25% 8 0% 13% 88% 0 - - -
B <25% 380 6% 9% 84% 93 10% 16% 74%
C 25% - 50% 556 15% 20% 64% 152 20% 27% 53%
D 51% - 75% 1,207 43% 26% 31% 671 50% 27% 23%
D1 76% - 100% 1,790 57% 22% 20% 1,122 65% 21% 14%
E 101% - 125% 1,509 81% 5% 14% 887 84% 4% 12%
E1 126% - 150% 1,185 88% 3% 10% 621 91% 2% 7%
Total 6,635 59% 15% 27% 3,546 68% 15% 17%
Table V-11C displays energy burden relative to the PUC target by CAP tier for 2011 CAP participants with electric and gas service. These customers also had higher burdens for lower poverty level groups. While 70 percent of 2011 full year CAP participants with income less than 25 percent of the poverty level had an energy burden above the target, nine percent of those with income between 126 and 150 percent had burden above the PUC target.

www.appriseinc.org CAP Impacts Analysis
APPRISE Incorporated Page 103
Table V-11C 2011 Electric and Gas CAP Participants, By CAP Tier
Energy Burden Relative to PUC Target
2011 Analysis Group 2011 Full Year CAP
Obs. Below Target
Within Target Range
Above Target
Obs. Below Target
Within Target Range
Above Target
Tier Poverty Level
A <25% 6 0% 0% 100% 0 - - -
B <25% 662 8% 13% 79% 186 12% 18% 70%
C 25% - 50% 1,143 15% 29% 55% 372 22% 38% 40%
D 51% - 75% 2,173 44% 25% 31% 1,269 52% 25% 23%
D1 76% - 100% 3,097 58% 23% 20% 2,002 63% 22% 15%
E 101% - 125% 3,378 81% 5% 15% 2,039 83% 5% 13%
E1 126% – 150% 2,923 86% 4% 10% 1,627 88% 4% 9%
Total 13,382 61% 14% 24% 7,495 69% 15% 17%
Table V-12A displays affordability statistics for 2010 CAP enrollees with electric baseload service. The table shows that total charges for these customers declined significantly, as did energy burden and the percent above the PUC target. The net decline in bills was a decline of $551, while energy burden declined by five percentage points and the percentage above the PUC target declined by 32 percentage points. Statistics on burden relative to the PUC target are not shown for the nonparticipant comparison group, as poverty level data were not available for these customers.
Table V-12A Affordability
2010 Enrollees and Comparison Groups Electric Baseload Customers
2010 Enrollee Treatment Group
2011 Enrollee Comparison Group
Nonparticipant Comparison Group Net
Change Pre Post Change Pre Post Change Pre Post Change
Observations 7,697 454 758
Total Charges $1,249 $884 -$365# $1,188 $1,448 $261# $1,172 $1,284 $112# -$551#
Energy Burden 13% 9% -4%# 15% 17% 3%# 14% 15% 1%# -5%#
Above PUC Target (% of customers)
61% 40% -22%# 66% 76% 10%# - - - -32%#
#Denotes significance at the 99 percent level. **Denotes significance at the 95 percent level. *Denotes significance at the 90 percent level.
Table V-12B displays energy burden by poverty group for 2010 CAP enrollees with electric baseload service. The table shows that CAP had the greatest impact on energy burden for
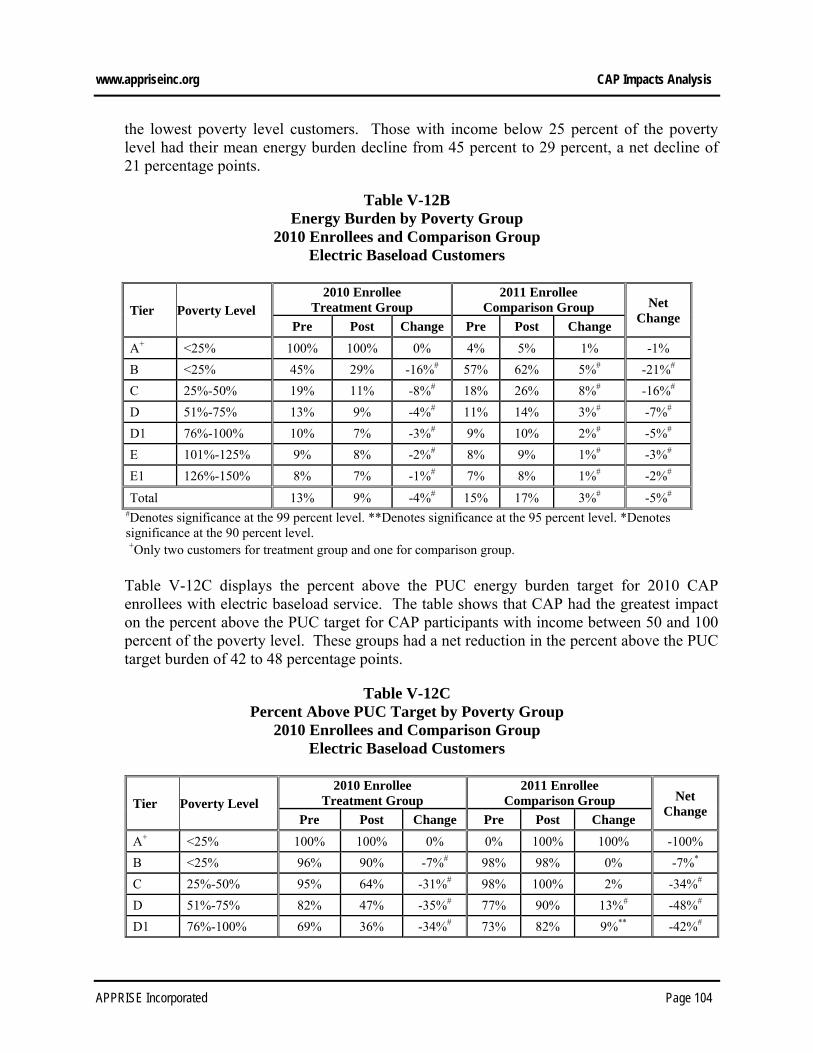
www.appriseinc.org CAP Impacts Analysis
APPRISE Incorporated Page 104
the lowest poverty level customers. Those with income below 25 percent of the poverty level had their mean energy burden decline from 45 percent to 29 percent, a net decline of 21 percentage points.
Table V-12B Energy Burden by Poverty Group
2010 Enrollees and Comparison Group Electric Baseload Customers
Tier Poverty Level 2010 Enrollee
Treatment Group 2011 Enrollee
Comparison Group Net Change
Pre Post Change Pre Post Change
A+ <25% 100% 100% 0% 4% 5% 1% -1%
B <25% 45% 29% -16%# 57% 62% 5%# -21%#
C 25%-50% 19% 11% -8%# 18% 26% 8%# -16%#
D 51%-75% 13% 9% -4%# 11% 14% 3%# -7%#
D1 76%-100% 10% 7% -3%# 9% 10% 2%# -5%#
E 101%-125% 9% 8% -2%# 8% 9% 1%# -3%#
E1 126%-150% 8% 7% -1%# 7% 8% 1%# -2%#
Total 13% 9% -4%# 15% 17% 3%# -5%# #Denotes significance at the 99 percent level. **Denotes significance at the 95 percent level. *Denotes significance at the 90 percent level. +Only two customers for treatment group and one for comparison group.
Table V-12C displays the percent above the PUC energy burden target for 2010 CAP enrollees with electric baseload service. The table shows that CAP had the greatest impact on the percent above the PUC target for CAP participants with income between 50 and 100 percent of the poverty level. These groups had a net reduction in the percent above the PUC target burden of 42 to 48 percentage points.
Table V-12C Percent Above PUC Target by Poverty Group
2010 Enrollees and Comparison Group Electric Baseload Customers
Tier Poverty Level 2010 Enrollee
Treatment Group 2011 Enrollee
Comparison Group Net Change
Pre Post Change Pre Post Change
A+ <25% 100% 100% 0% 0% 100% 100% -100%
B <25% 96% 90% -7%# 98% 98% 0% -7%*
C 25%-50% 95% 64% -31%# 98% 100% 2% -34%#
D 51%-75% 82% 47% -35%# 77% 90% 13%# -48%#
D1 76%-100% 69% 36% -34%# 73% 82% 9%** -42%#

www.appriseinc.org CAP Impacts Analysis
APPRISE Incorporated Page 105
E 101%-125% 43% 29% -14%# 42% 52% 10%** -24%#
E1 126%-150% 34% 25% -9%# 37% 54% 17%# -27%#
Total 61% 40% -22%# 66% 76% 10%# -32%#
#Denotes significance at the 99 percent level. **Denotes significance at the 95 percent level. *Denotes significance at the 90 percent level. +Only two customers for the treatment group, and one for the comparison group.
Table V-13A displays affordability statistics for 2010 CAP enrollees with electric heating service. The table shows that total charges, burden, and the percent above the PUC target for these customers also declined significantly. The net decline in bills was a decline of $419, while energy burden declined by three percentage points and the percentage above the PUC target declined by seven percentage points.
Table V-13A Affordability
2010 Enrollees and Comparison Groups Electric Heating Customers
2010 Enrollee Treatment Group
2011 Enrollee Comparison Group
Nonparticipant Comparison Group Net
Change Pre Post Change Pre Post Change Pre Post Change
Observations 1,130 42 281
Total Charges $1,695 $1,530 -$165# $1,661 $2,012 $351# $1,670 $1,828 $158# -$419#
Energy Burden 16% 14% -1%# 26% 28% 2%# 17% 18% 1%# -3%#
Above PUC Target (% of customers)
22% 20% -2%# 43% 48% 5% - - - -7%
#Denotes significance at the 99 percent level. **Denotes significance at the 95 percent level. *Denotes significance at the 90 percent level.
Table V-13B displays energy burden by poverty group for 2010 CAP enrollees with electric heating service. The table shows that CAP had the greatest impact on energy burden for the lowest poverty level customers. Those with income below 25 percent of the poverty level had their energy burden decline from 55 percent to 48 percent, a net decline of 12 percentage points.
Table V-13B Energy Burden by Poverty Group
2010 Enrollees and Comparison Group Electric Heating Customers
Tier Poverty Level 2010 Enrollee
Treatment Group 2011 Enrollee
Comparison Group Net Change
Pre Post Change Pre Post Change
A+ <25% 100% 100% 0% -- -- -- --
B <25% 55% 48% -8%# 69% 74% 4% -12%*
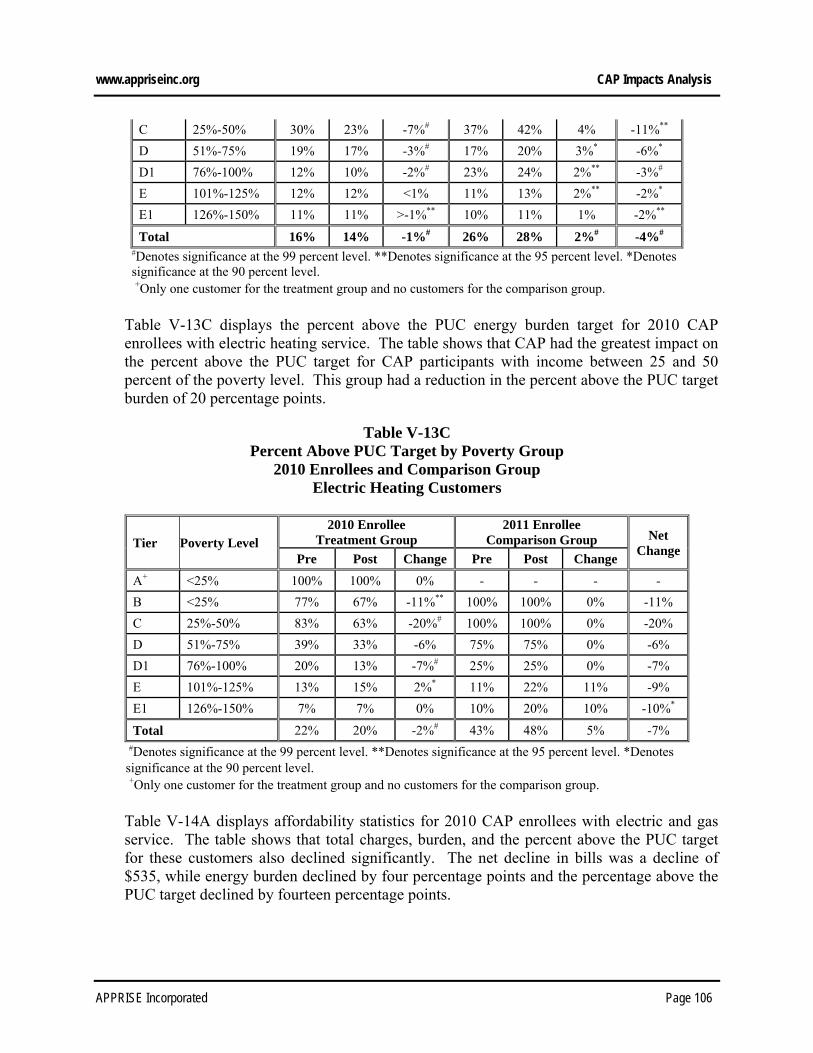
www.appriseinc.org CAP Impacts Analysis
APPRISE Incorporated Page 106
C 25%-50% 30% 23% -7%# 37% 42% 4% -11%**
D 51%-75% 19% 17% -3%# 17% 20% 3%* -6%*
D1 76%-100% 12% 10% -2%# 23% 24% 2%** -3%#
E 101%-125% 12% 12% <1% 11% 13% 2%** -2%*
E1 126%-150% 11% 11% >-1%** 10% 11% 1% -2%**
Total 16% 14% -1%# 26% 28% 2%# -4%#
#Denotes significance at the 99 percent level. **Denotes significance at the 95 percent level. *Denotes significance at the 90 percent level. +Only one customer for the treatment group and no customers for the comparison group.
Table V-13C displays the percent above the PUC energy burden target for 2010 CAP enrollees with electric heating service. The table shows that CAP had the greatest impact on the percent above the PUC target for CAP participants with income between 25 and 50 percent of the poverty level. This group had a reduction in the percent above the PUC target burden of 20 percentage points.
Table V-13C Percent Above PUC Target by Poverty Group
2010 Enrollees and Comparison Group Electric Heating Customers
Tier Poverty Level 2010 Enrollee
Treatment Group 2011 Enrollee
Comparison Group Net Change
Pre Post Change Pre Post Change
A+ <25% 100% 100% 0% - - - -
B <25% 77% 67% -11%** 100% 100% 0% -11%
C 25%-50% 83% 63% -20%# 100% 100% 0% -20%
D 51%-75% 39% 33% -6% 75% 75% 0% -6%
D1 76%-100% 20% 13% -7%# 25% 25% 0% -7%
E 101%-125% 13% 15% 2%* 11% 22% 11% -9%
E1 126%-150% 7% 7% 0% 10% 20% 10% -10%*
Total 22% 20% -2%# 43% 48% 5% -7%
#Denotes significance at the 99 percent level. **Denotes significance at the 95 percent level. *Denotes significance at the 90 percent level. +Only one customer for the treatment group and no customers for the comparison group.
Table V-14A displays affordability statistics for 2010 CAP enrollees with electric and gas service. The table shows that total charges, burden, and the percent above the PUC target for these customers also declined significantly. The net decline in bills was a decline of $535, while energy burden declined by four percentage points and the percentage above the PUC target declined by fourteen percentage points.

www.appriseinc.org CAP Impacts Analysis
APPRISE Incorporated Page 107
Table V-14A Affordability
2010 Enrollees and Comparison Groups Electric and Gas Customers
2010 Enrollee
Treatment Group 2011 Enrollee
Comparison Group Nonparticipant
Comparison Group Net Change
Pre Post Change Pre Post Change Pre Post Change
Number of Customers
2,835 107 617
Total Charges $2,219 $1,783 -$436# $2,380 $2,513 $133# $2,049 $2,114 $65# -$535#
Energy Burden 18% 15% -3%# 25% 26% 1%# 15% 15% <1%# -4%#
Above PUC Target (% of customers)
31% 21% -10%# 47% 50% 4% - - - -14%#
#Denotes significance at the 99 percent level. **Denotes significance at the 95 percent level. *Denotes significance at the 90 percent level.
Table V-14B displays energy burden by poverty group for 2010 CAP enrollees with electric and gas service. The table shows that CAP had the greatest impact on energy burden for the lowest poverty level customers. Those with income below 25 percent of the poverty level had their energy burden decline from 71 percent to 53 percent, and those with income between 25 and 50 percent of the poverty level had their energy burden decline from 35 percent to 19 percent.
Table V-14B Energy Burden by Poverty Group
2010 Enrollees and Comparison Group Electric and Gas Customers
Tier Poverty Level 2010 Enrollee
Treatment Group 2011 Enrollee
Comparison Group Net Change
Pre Post Change Pre Post Change
A+ <25% 100% 100% 0% - - - -
B <25% 71% 53% -18%# 72% 74% 2% -20%#
C 25%-50% 35% 19% -16%# 38% 41% 3%# -19%#
D 51%-75% 21% 15% -6%# 24% 24% <1% -6%#
D1 76%-100% 16% 12% -4%# 15% 18% 2%** -7%#
E 101%-125% 15% 13% -2%# 13% 13% <1% -2%#
E1 126%-150% 13% 11% -1%# 12% 13% <1% -1%#
Total 18% 15% -3%# 25% 26% 1%# -5%# #Denotes significance at the 99 percent level. **Denotes significance at the 95 percent level. *Denotes significance at the 90 percent level. +Only one customer for the treatment group and no customers for the comparison group.
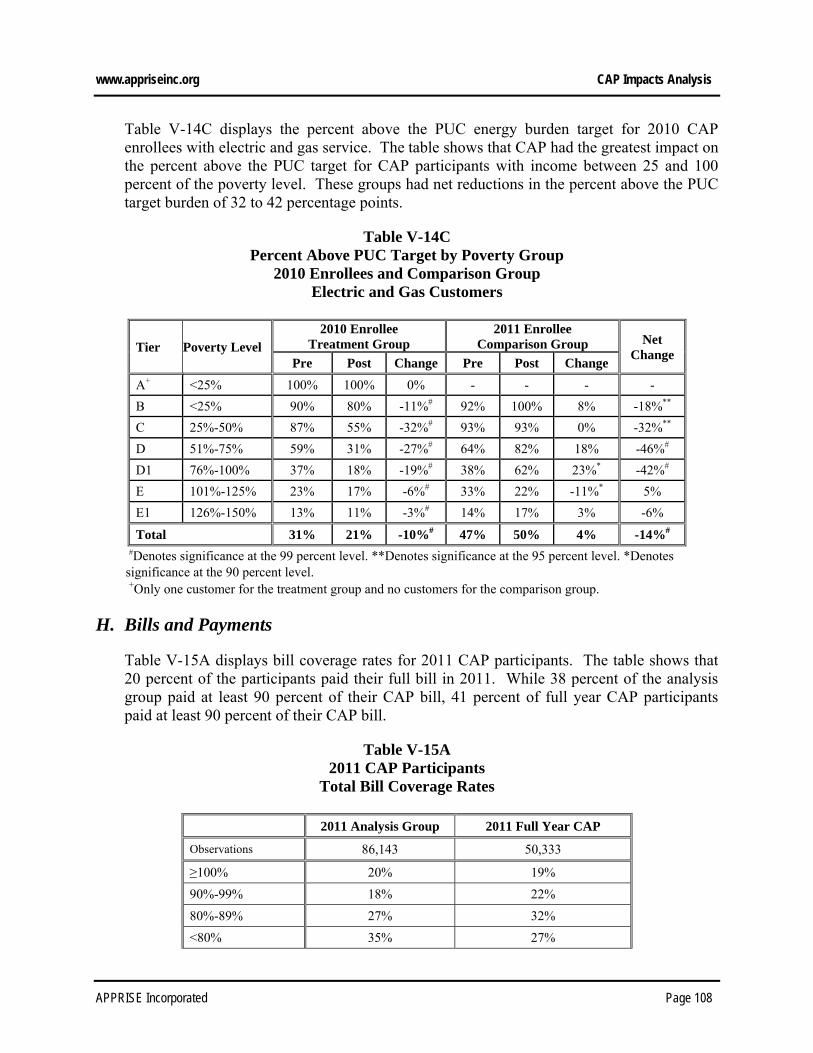
www.appriseinc.org CAP Impacts Analysis
APPRISE Incorporated Page 108
Table V-14C displays the percent above the PUC energy burden target for 2010 CAP enrollees with electric and gas service. The table shows that CAP had the greatest impact on the percent above the PUC target for CAP participants with income between 25 and 100 percent of the poverty level. These groups had net reductions in the percent above the PUC target burden of 32 to 42 percentage points.
Table V-14C Percent Above PUC Target by Poverty Group
2010 Enrollees and Comparison Group Electric and Gas Customers
Tier Poverty Level 2010 Enrollee
Treatment Group 2011 Enrollee
Comparison Group Net Change
Pre Post Change Pre Post Change
A+ <25% 100% 100% 0% - - - -
B <25% 90% 80% -11%# 92% 100% 8% -18%**
C 25%-50% 87% 55% -32%# 93% 93% 0% -32%**
D 51%-75% 59% 31% -27%# 64% 82% 18% -46%#
D1 76%-100% 37% 18% -19%# 38% 62% 23%* -42%#
E 101%-125% 23% 17% -6%# 33% 22% -11%* 5%
E1 126%-150% 13% 11% -3%# 14% 17% 3% -6%
Total 31% 21% -10%# 47% 50% 4% -14%#
#Denotes significance at the 99 percent level. **Denotes significance at the 95 percent level. *Denotes significance at the 90 percent level. +Only one customer for the treatment group and no customers for the comparison group.
H. Bills and Payments
Table V-15A displays bill coverage rates for 2011 CAP participants. The table shows that 20 percent of the participants paid their full bill in 2011. While 38 percent of the analysis group paid at least 90 percent of their CAP bill, 41 percent of full year CAP participants paid at least 90 percent of their CAP bill.
Table V-15A 2011 CAP Participants
Total Bill Coverage Rates
2011 Analysis Group 2011 Full Year CAP
Observations 86,143 50,333
≥100% 20% 19%
90%-99% 18% 22%
80%-89% 27% 32%
<80% 35% 27%

www.appriseinc.org CAP Impacts Analysis
APPRISE Incorporated Page 109
2011 Analysis Group 2011 Full Year CAP
Total 100% 100%
Table V-15B displays bill coverage rates for 2011 CAP participants. The table shows that CAP tier B and C participants were more likely to pay their full bill than CAP tier D and E participants.
Table V-15B 2011 CAP Participants, By CAP Tier
Total Bill Coverage Rates
2011 Analysis Group 2011 Full Year CAP
A B C D E A B C D E
Observations 33 5,329 8,791 40,832 31,158 3 1,522 3,210 26,860 18,738
≥100% 33% 28% 33% 20% 16% 0% 35% 42% 18% 14%
90% - 99% 12% 11% 13% 19% 20% 33% 16% 16% 22% 22%
80% - 89% 15% 14% 15% 29% 31% 67% 18% 18% 33% 35%
<80% 39% 48% 40% 32% 34% 0% 31% 24% 27% 29%
Total 100% 100% 100% 100% 100% 100% 100% 100% 100% 100%
Table V-16 displays total bill coverage rates for the treatment and comparison groups. The table shows that bill coverage rates improved for CAP enrollees in the year after they enrolled in the program. The percent that paid 90 percent or more of the bill increased from 59 percent in the year prior to enrollment to 70 percent in the year following enrollment. The nonparticipant comparison group experienced an improvement in coverage rates, but the 2011 enrollee comparison group had a large decline in the percent of customers who paid at least 90 percent of their bill, from 86 percent two years prior to CAP enrollment to 60 percent one year prior to CAP enrollment.
Table V-16 2010 Enrollees and Comparison Groups
Total Bill Coverage Rates
2010 Enrollee Treatment Group
2011 Enrollee Comparison Group
Nonparticipant Comparison Group
Pre Post Pre Post Pre Post
Observations 12,372 907 2,572
≥100% 42% 44% 71% 30% 65% 72%
90% - 99% 17% 26% 15% 30% 18% 17%
80% - 89% 13% 12% 7% 17% 7% 5%
<80% 28% 18% 7% 24% 10% 6%

www.appriseinc.org CAP Impacts Analysis
APPRISE Incorporated Page 110
2010 Enrollee Treatment Group
2011 Enrollee Comparison Group
Nonparticipant Comparison Group
Pre Post Pre Post Pre Post
Total 100% 100% 100% 100% 100% 100%
Table V-17 displays the number of missed payments for the treatment and comparison groups. The table shows that the treatment group had only a marginal reduction in the number of missed payments, as the percent with no missed payments increased from 14 to 17 percent. However, the comparison groups had a large reduction in the percent with no missed payments, so the net change was a large improvement for CAP participants.
Table V-17 2010 Enrollees and Comparison Groups
Number of Missed Payments
2010 Enrollee Treatment Group
2011 Enrollee Comparison Group
Nonparticipant Comparison Group Net
Change Pre Post Change Pre Post Change Pre Post Change
No Payments Missed 14% 17% 3%# 43% 14% -29%# 35% 4% -31%# 33%#
1-3 Missed Payments 32% 31% >-1% 37% 52% 14%# 31% 37% 5%# -10%#
4-6 Missed Payments 28% 24% -4%# 13% 24% 11%# 17% 29% 13%# -16%#
7-12 Missed Payments 26% 28% 1%# 6% 10% 4%# 17% 29% 13%# -7%#
>12 Missed Payments <1% <1% 0% - - - <1% 0% >-1% <1%
#Denotes significance at the 99 percent level. **Denotes significance at the 95 percent level. *Denotes significance at the 90 percent level.
Table V-18A displays billing and payment statistics for electric baseload treatment and comparison groups. The table shows that bills and total charges declined significantly, cash and LIHEAP payments declined, coverage rates increased, and balances declined. The total coverage rate for the 2010 enrollees increased from 85 percent in the year prior to enrollment to 90 percent in the year following enrollment. Balances at the end of the treatment period were significantly lower than at the end of the pre-enrollment period. While balances increased on average during the treatment period, the increase during CAP participation was lower than the increase prior to enrollment.

www.appriseinc.org CAP Impacts Analysis
APPRISE Incorporated Page 111
Table V-18A Bills and Payments
2010 Enrollees and Comparison Groups Electric Baseload Customers
2010 Enrollee Treatment Group
2011 Enrollee Comparison Group
Nonparticipant Comparison Group Net
Change Pre Post Change Pre Post Change Pre Post Change
Observations 7,715 457 1,072
Bill $1,203 $870 -$332# $1,169 $1,422 $253# $1,043 $1,143 $100# -$509#
Other Charges $46 $14 -$32# $16 $22 $6# $31 $38 $6** -$39#
Total Charges $1,248 $884 -$365# $1,186 $1,444 $259# $1,075 $1,181 $106# -$547#
# of Cash Payments 8 8 >-1 10 9 -1# 8 6 -2# 2#
Cash Payment $905 $641 -$264# $1,067 $1,067 -$1 $840 $755 -$85# -$222#
LIHEAP Assistance $42 $18 -$24# $1 $9 $9# $46 $136 $90# -$73#
Other Assistance $1 <$1 -$1# $0 $0 $0 <$1 $0 >-$1 -$1
Other Credits $85 $118 $34# $87 $184 $97# $114 $291 $177# -$103#
Total Credits $1,032 $777 -$255# $1,155 $1,260 $105# $999 $1,182 $183# -$399#
Cash Coverage Rate 73% 71% -1%# 91% 76% -15%# 78% 56% -22%# 17%#
Total Coverage Rate 85% 90% 5%# 98% 89% -10%# 94% 102% 8%# 6%**
Ending Balance $389 $100 -$290# $83 $15 -$68# $143 $168 $25* -$268#
Balance Change $234 $92 -$142# $32 -$72 -$104# $51 $39 -$11 -$85# #Denotes significance at the 99 percent level. **Denotes significance at the 95 percent level. *Denotes significance at the 90 percent level.
Table V-18B displays billing and payment statistics for electric heating treatment and comparison groups. The table shows that bills and total charges declined significantly, cash and LIHEAP payments declined, coverage rates increased as compared to the comparison group, and balances declined.
Table V-18B Bills and Payments
2010 Enrollees and Comparison Groups Electric Heating Customers
2010 Enrollee Treatment Group
2011 Enrollee Comparison Group
Nonparticipant Comparison Group
Net Change
Pre Post Change Pre Post Change Pre Post Change
Observations 1,134 42 399
Bill $1,648 $1,511 -$137# $1,650 $1,989 $339# $1,643 $1,799 $156# -$385#
Other Charges $44 $17 -$27# $11 $22 $12** $28 $24 -$4 -$31#
Total Charges $1,692 $1,528 -$165# $1,661 $2,012 $351# $1,671 $1,823 $152# -$416#

www.appriseinc.org CAP Impacts Analysis
APPRISE Incorporated Page 112
2010 Enrollee Treatment Group
2011 Enrollee Comparison Group
Nonparticipant Comparison Group
Net Change
Pre Post Change Pre Post Change Pre Post Change
# of Cash Payments 8 7 -1# 10 9 -1* 10 8 -2# 1#
Cash Payment $1,185 $953 -$232# $1,409 $1,524 $115 $1,446 $1,244 -$201# -$188*
LIHEAP Assistance $126 $78 -$47# $10 $34 $24 $40 $152 $112# -$116#
Other Assistance $1 <$1 -$1 $0 $0 $0 <$1 <$1 >-$1 -$1
Other Credits $210 $324 $114# $215 $226 $11 $152 $385 $233# -$8#
Total Credits $1,521 $1,356 -$165# $1,633 $1,784 $151 $1,637 $1,781 $144# -$313#
Cash Coverage Rate 68% 57% -11%# 85% 74% -12%** 87% 63% -24%# 7%#
Total Coverage Rate 93% 91% -1% 99% 87% -12%** 99% 100% <1% 4%
Ending Balance $353 $134 -$219# $138 $62 -$76 $127 $199 $73# -$218#
Balance Change $191 $127 -$64# $17 -$32 -$49 $24 $80 $57** -$67# #Denotes significance at the 99 percent level. **Denotes significance at the 95 percent level. *Denotes significance at the 90 percent level.
Table V-18C displays billing and payment statistics for electric and gas treatment and comparison groups. The table shows that bills and total charges declined significantly, payments declined, coverage rates stayed approximately the same, and balances declined.
Table V-18C Bills and Payments
2010 Enrollees and Comparison Groups Electric and Gas Customers
2010 Enrollee Treatment Group
2011 Enrollee Comparison Group
Nonparticipant Comparison Group Net
Change Pre Post Change Pre Post Change Pre Post Change
Observations 2,841 107 849
Bill $2,167 $1,767 -$400# $2,354 $2,470 $116** $2,020 $2,094 $74# -$495#
Other Charges $52 $17 -$35# $26 $43 $17 $27 $22 -$5* -$41#
Total Charges $2,219 $1,784 -$435# $2,380 $2,513 $133# $2,047 $2,116 $69# -$536#
# of Cash Payments 9 8 -1# 10 9 -1# 10 9 -1# 1#
Cash Payment $1,697 $1,285 -$413# $2,170 $1,973 -$197# $1,827 $1,605 -$221# -$203#
LIHEAP Assistance $129 $82 -$47# $9 $34 $24** $51 $171 $120# -$119#
Other Assistance $1 <$1 >-$1 $4 $0 -$4 $1 $0 -$1 $2
Other Credits $209 $281 $71# $145 $280 $135# $141 $404 $263# -$128#
Total Credits $2,036 $1,648 -$389# $2,329 $2,286 -$43 $2,019 $2,181 $162# -$448#
Cash Coverage Rate 76% 69% -7%# 91% 79% -12%# 89% 72% -17%# 8%#
Total Coverage Rate 93% 93% >-1% 97% 92% -5% 99% 104% 5%# <1%#

www.appriseinc.org CAP Impacts Analysis
APPRISE Incorporated Page 113
2010 Enrollee Treatment Group
2011 Enrollee Comparison Group
Nonparticipant Comparison Group Net
Change Pre Post Change Pre Post Change Pre Post Change
Ending Balance $419 $116 -$303# $145 $16 -$129** $110 $106 -$4 -$237#
Balance Change $218 $108 -$110# $58 -$83 -$141** $5 -$3 -$8 -$36# #Denotes significance at the 99 percent level. **Denotes significance at the 95 percent level. *Denotes significance at the 90 percent level.
I. Energy Assistance
This section examines the percent of CAP participants who received LIHEAP and the amount of LIHEAP received. Table V-19 displays the percent of 2011 CAP participants who received LIHEAP. The table shows that 11 percent of baseload CAP participants, 40 percent of electric heating CAP participants and 39 percent of electric and gas CAP participants received LIHEAP in 2011. Mean grants were about $250 for customers who received LIHEAP.
Table V-19
LIHEAP Assistance 2011 CAP Participants who Received LIHEAP
2011 Analysis Group 2011 Full Year CAP
Electric Baseload Customers 65,836 39,112
Percent Received LIHEAP 12% 11%
Mean LIHEAP Grant $289 $267
Electric Heating Customers 6,672 3,571
Percent Received LIHEAP 37% 40%
Mean LIHEAP Grant $269 $247
Electric and Gas Customers 13,413 7,522
Percent Received LIHEAP 35% 39%
Mean LIHEAP Grant $258 $231
Table V-20 displays LIHEAP grants for the 2010 enrollees and comparison groups. All types of customers were less likely to receive LIHEAP after enrolling in CAP. While 51 percent of electric and gas customers received LIHEAP in the year prior to enrollment, 42 percent received LIHEAP in the year following enrollment. Mean grants for customers who received LIHEAP in the pre and post period declined from $260 to $191 for electric and gas customers. Other customer types saw similar declines.

www.appriseinc.org CAP Impacts Analysis
APPRISE Incorporated Page 114
Table V-20+ LIHEAP Assistance
2010 Enrollees and Comparison Groups
2010 Enrollee Treatment Group
2011 Enrollee Comparison Group
Nonparticipant Comparison Group Net
Change Pre Post Change^ Pre Post Change^ Pre Post Change^
Observations 12,372 907 2,572
Electric Baseload Customers 7,715 457 1,072
Percent Received LIHEAP 17% 10% -7%# 1% 4% 4%# 21% 62% 42%# -29%#
Mean LIHEAP Grant – Received in Pre or Post Period
$245 $177 -$68# $80 $214 $133* $222 $219 -$3 -$133
Mean LIHEAP Grant – All Cases
$42 $18 -$24# $1 $9 $9# $46 $136 $90# -$73#
Mean LIHEAP Grant – Received in Both Pre and Post Period
$277 $166 -$111# $61 $229 $168 $247 $243 -$4 -$193#
Electric Heating Customers 1,134 42 399
Percent Received LIHEAP 50% 40% -10%# 2% 19% 17%** 17% 69% 52%# -45%#
Mean LIHEAP Grant – Received in Pre or Post Period
$249 $195 -$54# $407 $179 -$228 $240 $221 -$18 $69
Mean LIHEAP Grant – All Cases
$126 $78 -$47# $10 $34 $24 $40 $152 $112# -$116#
Mean LIHEAP Grant – Received in Both Pre and Post Period
$265 $185 -$80# - - - $192 $231 $38 -$119#
Electric and Gas Customers 2,841 107 849
Percent Received LIHEAP 51% 42% -9%# 3% 11% 8%** 19% 69% 50%# -38%#
Mean LIHEAP Grant – Received in Pre or Post Period
$255 $197 -$59# $333 $299 -$34 $265 $247 -$18 -$33
Mean LIHEAP Grant – All Cases
$129 $82 -$47# $9 $34 $24** $51 $171 $120# -$119#
Mean LIHEAP Grant – Received in Both Pre and Post Period
$260 $191 -$70# $300 $200 -$100 $261 $259 -$2 -$18#
^The change in mean LIHEAP grant is calculated as the difference of the mean. #Denotes significance at the 99 percent level. **Denotes significance at the 95 percent level. *Denotes significance at the 90 percent level. #Significance level cannot be determined.
J. Collections Impact
This section examines the impact of CAP on collections actions and costs. Table V-21 shows that there were significant declines in all types of collections actions after customers enrolled in the program. The net reduction in the total number of collections actions was 8.8 actions. While customers averaged 8.2 phone calls from collections in the year prior to enrollment, they averaged 4.2 in the year following enrollment. Mean collections costs declined by $191 per customer.

www.appriseinc.org CAP Impacts Analysis
APPRISE Incorporated Page 115
Table V-21 Collections Actions
2010 Enrollees and Comparison Groups
2010 Enrollee Treatment Group
2011 Enrollee Comparison Group
Nonparticipant Comparison Group Net
Change Pre Post Change Pre Post Change Pre Post Change
Number of Customers 12,372 907 2,572
Field Visit 1.7 0.6 -1.0# 0.5 0.5 <0.1 0.9 0.9 >-0.1 -1.0#
Mail 2.6 1.0 -1.5# 0.8 0.8 0 1.2 1.0 -0.2# -1.4#
Office Work 11.5 12.4 0.9# 4.9 10.5 5.6# 6.8 7.3 0.5# -2.2#
Phone 8.2 4.2 -4.0# 2.5 2.7 0.2 4.0 3.9 -0.1 -4.1#
Termination 0.1 0.1 >-0.1# <0.1 <0.1 <0.1 0.1 0.1 <0.1** -0.1#
Total Actions 24.1 18.3 -5.8# 8.6 14.5 5.9# 13.0 13.3 0.2 -8.8#
Total Cost $594 $511 -$84# $224 $423.71 $200# $346 $361 $15* -$191# #Denotes significance at the 99 percent level. **Denotes significance at the 95 percent level. *Denotes significance at the 90 percent level.
K. Summary of CAP Data Analysis Findings
The analysis in this section showed that CAP had large positive impacts on energy affordability, some CAP participants improved their payment coverage in comparison to the later enrollees and nonparticipants, and that collections actions and costs declined significantly. However, many CAP participants, especially those in the lowest poverty groups, had energy burdens above the PUC targeted level. Key findings from the data analysis are highlighted below.
CAP Retention: Most customers who had a bill in a particular month continued to have a CAP bill, indicating that customers usually did not leave CAP because they found it not be beneficial, they no longer needed assistance, or their income increased. Of the 2011 CAP participants, between 89 and 93 percent of those who had a bill each month participated in CAP. Of the 2010 enrollees, between 97 and 99 percent of those who had a bill each month continued to participate in CAP.
Arrearage Forgiveness: Among the 2010 CAP enrollees who had arrearages, 96 percent received arrearage forgiveness in the year following enrollment. They received an average of 7.4 forgiveness payments, and an average of $325 in forgiveness.
Affordability: The Pennsylvania PUC has set energy burden targets for CAP participants. The analysis showed that while 70 percent of full year 2011 CAP participants had energy burden at or below the target, 30 percent had energy burden above the PUC target. While 84 percent of those with income at or below 25 percent of the poverty level had energy burden above the PUC target, 17 percent of those with energy burden between 126 and 150 percent of the poverty level had energy burden above the PUC
www.appriseinc.org CAP Impacts Analysis
APPRISE Incorporated Page 116
target. While 33 percent of those with electric baseload service had energy burden above the PUC target, 17 percent of those with electric heating or electric and gas service had energy burden above the PUC target.
Affordability Impacts: The CAP has positive affordability impacts for the 2010 enrollees. Net reductions in total charges averaged $551 for electric baseload participants, $419 for electric heating participants, and $535 for electric and gas participants. Net reductions in energy burden were five percentage points for electric baseload customers, three percentage points for electric heating customers, and four percentage points for electric and gas customers. Customers with income below 25 percent of the poverty level had the greatest reductions in energy burdens.
Bill Payment Compliance: The analysis showed that 41 percent of 2011 CAP participants paid at least 90 percent of their full CAP bill. Bill coverage rates improved for 2010 CAP enrollees in the year after they enrolled in the program. While 59 percent of this group paid at least 90 percent of their bill in the year prior to enrollment, 70 percent paid at least 90 percent of their bill in the year following enrollment. Customers made less cash payments and received less LIHEAP assistance, but they covered a greater percentage of their bill due to the large decline in charges after enrollment.
LIHEAP Assistance: Of the 2011 full year CAP participants, 11 percent of electric baseload customers, 40 percent of electric heating customers, and 39 percent of electric and gas customers received LIHEAP assistance in 2011. The 2010 enrollees were less likely to receive LIHEAP after enrolling in CAP. While 17 percent of electric baseload customers received LIHEAP in the year prior to enrollment, 10 percent received LIHEAP in the year following enrollment. While 50 percent of electric heating customers received LIHEAP in the year prior to enrollment, 40 percent received LIHEAP in the year following enrollment. While 51 percent of electric and gas customers received LIHEAP in the year prior to enrollment, 42 percent received it in the year following enrollment. There were large increases in the percent of the comparison group that received LIHEAP. LIHEAP assistance averaged approximately $250 for customers who received grants in 2011.
Collections Impact: There was a significant reduction in the number of collections actions experienced by 2010 CAP enrollees in the year following enrollment. While these customers averaged a total of 24 collections actions in the year prior to enrollment, they experienced an average of 18 in the year following enrollment. The net change was a reduction of nine actions and a savings of $191.

www.appriseinc.org Summary of Findings and Recommendations
APPRISE Incorporated Page 117
VI. Summary of Findings and Recommendations
This section of the report summarizes the findings and recommendations from the evaluation activities.
A. Key Findings
Key findings relating to program coordination, CAP affordability, and PECO’s newly proposed rate changes22 are summarized below.
1. Program Coordination PECO’s Universal Service Programs and other low-income programs are coordinated to help their low-income customers achieve energy affordability. Some of the examples of how these programs are coordinated are as follows. High usage CAP customers are targeted for LIURP. LIHEAP recipients are auto-enrolled in CAP and auto-re-certified when the LIHEAP
program parameters allow for CAP eligibility determination. CARES customers are referred to all Universal Service Programs and additional
program and services for which they are eligible. PECO views its programs as a portfolio of services that together help their low-income customers attain an affordable energy bill.
2. CAP Affordability One of the key findings in this report was that a significant percentage of lower tier CAP participants do not reach the PUC affordability targets after receiving the CAP discount. The reasons that many customers do not meet the PUC target are the structure of the CAP discount and the cost controls that limit the discount to the first 650 kWh or 750 kWh of usage. Because a usage analysis was not part of this evaluation, we cannot determine what percentage of the customers exceed the target due to high usage. However, the two reasons that customers exceed the PUC target are explained more fully below. Structure of CAP discount – PECO’s CAP is structured as a rate discount.
Customers receive a discounted rate for each kWh used, until they reach 650 kWh or 750 kWh. Therefore, depending on the customer’s income, poverty level, and usage, the customer may have an energy burden that is below, within, or above the PUC energy burden target. The only way that a utility company can achieve the PUC target for all CAP participants is to set the customer’s payment as a fixed percentage
22 If approved, the rate changes would be implemented in 2013.

www.appriseinc.org Summary of Findings and Recommendations
APPRISE Incorporated Page 118
of the customer’s income, with no limit on the maximum discount. All other utilities that do not have a Percentage of Income Payment Plan (PIPP), and those that have a PIPP with a discount limit, will have a subset of CAP participants who do not meet the PUC affordability targets.
Cost controls – PECO has delineated maximum monthly usage amounts for which customers can receive the CAP discount. Customers who exceed those monthly usage levels pay the full retail rate for all usage beyond that limit. The table below provides examples of how the discount may not be affordable for customers with monthly usage beyond the discounted amount.
The table shows examples of customers in CAP Tiers B, C, and D with lower and higher usage levels. The table shows that at lower usage levels, the customers have energy burdens that are within or below the PUC target range, but customers with higher usage levels have energy burdens that are above the PUC target range. For example, a CAP Tier C customer with monthly usage of 500 kWh receives the CAP discount on all usage, and has an annual energy burden of two percent, within the two to five percent energy burden range set by the PUC. However, a CAP Tier C customer with monthly usage of 1,000 kWh does not receive the discount on all usage, and has an energy burden of nine percent, above the PUC target range.
Table VI-1
Illustration of CAP Discount Limits Impact on Energy Burden
Income Poverty Level
CAP Tier
CAP Discount
Monthly Usage (kWh)
Non-heating Electric Rate
Monthly Bill for Electric
Usage Fixed
Monthly Charge
Annual Bill
Energy Burden
PUC Target
Retail Rate*
CAP Rate
Oct-June
July-Sept
$6,000 <25% B 93% 500 $0.1638 $0.0115 $5.73 $5.73 $7.20 $155 3% 2%-5%
$6,000 <25% B 93% 800 $0.1638 $0.0115 $32.02 $16.79 $7.20 $425 7% 2%-5%
$10,000 26%-50% C 86% 500 $0.1638 $0.0229 $11.47 $11.47 $7.20 $224 2% 2%-5%
$10,000 26%-50% C 86% 1000 $0.1638 $0.0229 $72.24 $58.15 $7.20 $911 9% 2%-5%
$17,000 51%-75% D 70% 500 $0.1638 $0.0491 $24.57 $24.57 $7.20 $381 2% 4%-6%
$17,000 51%-75% D 70% 1000 $0.1638 $0.0491 $89.27 $89.27 $7.20 $1,158 7% 4%-6% *To simplify the analysis, the retail rate shown in the table was not increased from $.1638 to $.1765 in the summer for usage over 500 kWh.
PECO chose the discount design and limited the discount to the first 650 or 750 kWh for the following reasons. PECO believes that customers should bear some responsibility for controlling their
usage. The fact that the discount is eliminated for usage above a certain level should

www.appriseinc.org Summary of Findings and Recommendations
APPRISE Incorporated Page 119
provide a large incentive for customers to conserve energy and to participate in LIURP by positively responding to PECO contact attempts or by proactively requesting LIURP services.
PECO has a responsibility to their other ratepayers to control the costs of the CAP Rate. Table VI-2 displays the cost that other PECO ratepayers bear for the CAP program. The table shows that the annual cost for the average electric non-heater is projected to be $69 in 2013, and the average cost for the electric heater is projected to be $133. PECO imposes the maximum usage limit to balance the benefits for the CAP customers with these costs that the other ratepayers bear.
Table VI-2
Cost to Ratepayers for CAP Rate
Year CAP Cost
$/kWh
Rate R Rate RH
3-Year Average
Monthly Usage (kWh)
Monthly Cost
Annual Cost
3-Year Average
Monthly Usage (kWh)
Monthly Cost
Annual Cost
2011 $ 0.0068 714 $4.86 $58.26 1372 $9.33 $111.96
2012 $ 0.0063 714 $4.50 $53.98 1372 $8.64 $103.72
2013 $ 0.0081 714 $5.78 $69.40 1372 $11.11 $133.36
However, PECO has taken several steps to increase affordability for CAP customers. These steps include the following. The usage limit for the CAP discount was increased from 500 kWh to 650 kWh (and
to 750 kWh for lower tier CAP Rate customers in the summer) in 2009. This change was in response to the 2006 Universal Services Program evaluation and general increases in usage over time. PECO continually monitors CAP costs to determine what adjustments need to be made. The analysis in this report showed that these changes did have a positive impact on affordability, as the 2011 participants were less likely to have energy burdens above the PUC target than the 2004 participants.
PECO introduced an In Program Arrearage Forgiveness Program (IPAF) in 2011. This program is in addition to the pre-program arrearage forgiveness that CAP participants receive. The IPAF was a one-time forgiveness for CAP customers who had in program arrearages of more than $1,000. The program forgave arrearages down to a level of $1,000, and then asked the customer to pay the rest of the arrearages at a rate of $16.67 per month over five years to pay back the remaining $1,000 in arrearages. There were approximately 16,000 customers who received this benefit and the total amount forgiven was approximately $25 million.23
23 Approximately 60 percent of these customers are currently on a payment agreement.
www.appriseinc.org Summary of Findings and Recommendations
APPRISE Incorporated Page 120
PECO piloted an in-home display pilot with 200 CAP participants in 2011. This device enables customers to better monitor their usage. PECO will examine whether the program helps customers to control their usage.
PECO leverages other assistance programs and provides outreach efforts for internal and external programs and services to help customers attain energy affordability. Some examples of the other programs that PECO has recently provided are described below.
o Government Grant Assistance Program (GGAP) – PECO provides matching
toward governmental grants to help low-income households who are in danger of service termination or who have been terminated. This match serves to make up for funding that has been reduced as a result of customer MEAF contributions declining with the poor economy.
o LEAP – PECO used Act 129 funding to provide additional energy efficiency services to low-income customers. These services were modeled after PECO’s LIURP because of the success of that program in reducing energy usage.
o Default Service Provider Settlement Agreement Funding – PECO used funding from this settlement to provide additional energy efficiency services to low-income customers. These funds were not required to abide by LIURP requirements, so PECO provided this funding to other low-income properties, including multi-family properties, mass metered properties, community centers, and senior centers that serve low-income customers.
o Education and outreach events – PECO attends events that are targeted toward
low-income households, provides CFLs (funded through Act 129) and provides education and information about other programs and services.
o LIHEAP outreach – PECO has increased their outreach for LIHEAP and they have been working with DPW to try to increase the number of customers who receive grants.
3. Rate Changes
PECO began to phase out their Rate RH (electric heating) discount on generation charges for all customers for usage over 600 kWh per month in 2012. This discount will be completely eliminated by the end of 2012. The discount that was phased out was a 50 percent discount for monthly usage over 600 kWh that totaled between $2 and $3 million in revenue annually, depending on prices and weather. PECO has filed for a change to their 2013 rates to compensate for the elimination of the rate RH discount. This change would increase affordability for CAP customers, and would have the greatest impacts on affordability for the lowest poverty group, highest

www.appriseinc.org Summary of Findings and Recommendations
APPRISE Incorporated Page 121
usage customers. This rate change, if approved, would apply the CAP discount up to a maximum usage level of 1,500 kWh in November through April (instead of the current 650 kWh discount limit). As such, the change would provide the greatest benefits to the lowest poverty group CAP customers, as these customers receive the greatest discounts on their usage. The intent of this rate change is to return the lost RH benefits back to the customers, with a redirection of benefits to the lowest income CAP customers.
B. Recommendations
Recommendations relating to policies and procedures and to program impacts are described below.
Policies and Procedures
PECO has created valuable partnerships with local agencies and contractors to implement their Universal Service Programs. The programs are well operated and run efficiently and effectively. Customers receive services that improve affordability, reduce usage, provide emergency assistance, and inform them of other important assistance that is available.
Based on the research that was conducted, we have the following recommendations for improving program performance.
1. Attempt to increase CAP participation by the lowest poverty group households. The Needs Assessment shows that 46 percent of PECO’s eligible customers participated in the CAP. Participation in CAP was lowest in the group of households with income at or below 25 percent of the poverty level, but this participation has increased since PECO’s last Universal Service Program Evaluation. The rate for this group was 16 percent in 2005, and it was 25 percent in 2009.
PECO should continue to work to increase participation among customers in this group. One potential means is to provide increased outreach and application support to customers who indicate that they are in this group but who do not successfully complete the CAP application.
2. Work with CAP call center and agencies to increase LIHEAP penetration. One of the CAP requirements is that customers must sign up for LIHEAP. The CAP Impacts Analysis showed that 11 percent of baseload CAP participants, 40 percent of electric heating CAP participants and 39 percent of electric and gas CAP participants received LIHEAP in 2011. Electric baseload, electric heating, and electric and gas customers were less likely to receive LIHEAP in the year after CAP enrollment as compared to the year prior to CAP enrollment. While 51 percent of electric and gas customers received LIHEAP in the year prior to enrollment, 42 percent received LIHEAP in the year following enrollment. PECO conducts extensive outreach to inform customers of the availability of LIHEAP. They may be able to increase participation among CAP participants by having the CAP

www.appriseinc.org Summary of Findings and Recommendations
APPRISE Incorporated Page 122
call center check if customer received LIHEAP at the time of application and recertification, and to provide additional reminders to CAP participants about the CAP requirement for LIHEAP application.
3. Require a budget bill for all customers. PECO currently requires a budget bill for CAP Rate A, B, and C customers, and encourages D and E participants. PECO should consider requiring all CAP participants to have a budget bill as this may increase payment regularity by those customers. The CAP Impacts Analysis showed that CAP D and E customers had lower energy burdens, but they were less likely to pay their full CAP bill.
4. Require all MEAF agencies to assist with CAP applications. The MEAF agencies reported that they had different policies with respect to CAP referrals. Three of the agencies reported that they assist the customer and send the application to PECO and the other three agencies reported that PECO handles the CAP application. PECO should have all of the agencies assist customers with the CAP application so that there is a one-stop process for customers and they are more likely to be enrolled in CAP.
5. Require all MEAF agencies to assist with LIHEAP applications. Agencies also reported different practices with respect to LIHEAP application. While four of the agencies reported that they assist clients to apply for LIHEAP in their office, one said that they mail the application to the customer, and one stated that they refer the customer to the local LIHEAP office. All MEAF agencies should assist customers with the LIHEAP application to ensure that the customer follows up with the application.
6. Require all MEAF agencies to assist customers with referrals for needed services. MEAF agencies reported different emphasis on other program referrals. While some seemed to only refer customers to a local agency, others seemed to assess customers’ needs and refer them to specific programs that were most needed. All agencies should follow the latter approach to maximize the probability that customers receive needed services.
Program Impacts
Survey research and data analysis showed that the CAP has had large positive impacts on energy affordability and customers’ ability to meet their energy needs. This section highlights opportunities for improved program impact.
1. Try to increase affordability for lowest poverty group participants. The CAP Impacts Analysis showed that CAP participants with income below 25 percent of the poverty level are most likely to exceed the PUC energy burden target. While 87 percent of under 25 percent of poverty electric baseload participants exceed the burden target,74 of under 25 percent electric heating, and 70 of electric and gas heating participants exceeded the target.
www.appriseinc.org Summary of Findings and Recommendations
APPRISE Incorporated Page 123
CAP B customers with income below 25 percent of the poverty level receive large CAP discounts. Non heating customers in this CAP Tier receive an electric discount of 93 percent on the first 650 kWh of usage and up to 750 kWh of usage in the summer. Electric heating customers receive an electric discount of 88 percent up to the same usage limits. Gas CAP customers in this poverty level group receive a discount of 79 percent on all charges.
PECO should investigate what percent of CAP B customers reach the maximum usage limit for the discount (a usage analysis was not part of this evaluation) and consider increasing that limit to increase affordability for this lowest income group.
2. Target lowest income CAP customers who exceed CAP usage discount limits for LIURP. PECO CAP customers are targeted for LIURP, and 97 percent of 2010 LIURP participants were CAP participants. PECO should particularly target the CAP B participants with usage that exceeds the amount that is discounted. Such additional targeting may help to reduce the percent of these customers that exceed the PUC energy burden target.