pecvd growth of carbon nanotubes - nasa · one way to possibly achieve this is to use plasma...
TRANSCRIPT
PECVD Growth of Carbon Nanotubes
Ian M_Aninch
Ames Research Center
July 31,2001
.
it
Reviewed by NASA-USRP MentorLance Delzeit
SSX
https://ntrs.nasa.gov/search.jsp?R=20020042339 2018-06-22T03:53:41+00:00Z
Abstract
Plasmaenhancedchemicalvapordeposition(PECVD),usinginductively coupledplasma,hasbeenusedto grow carbonnanombes(CNTs)andgraphiticcarbonfibers(GCF) onsubstratessputteredwith aluminumandiron catalyst. Thecapacitiveplasma'spowerhasbeenshownto causeatransitionfrom nanombesto nanofibers,dependingonthe strengthof theplasma. Thetemperature,placement,andotherfactorshavebeenshownto affecttheheightanddensityof thetubeandfibergrowth.
Introduction
Carbonnanotubes(CNTs)haverecentlybeenreceivingmuchattentiondueto theirextraord'maryproperties,bothmechanicalandelectrical. Theyhavepotentialto beof
great use in nanoelectronics, biosensors, field emission devices, high strength composites
and other applications. Various methods have been used to grow CNTs including laser
vaporization [1 ], arc-evaporation of graphite electrodes [2], and chemical vapor
deposition (CVD) [3]. Of these only CVD has the ability to grow CNTs on patterned
substrates, however, for some applications (flat displays for one) highly aligned CNTs are
desirable. One way to possibly achieve this is to use plasma enhanced CVD (PECVD).
The plasma reduces the temperature needed for growth and also adds other parameters,
such as the bias across the substrate, which influence the growth. It is thought that this
field will lead to the growth of vertically aligned CNTs. In this paper, we report the
findings of an investigation into the parameters influencing CNT growth in an inductivelycoupled plasma reactor.
Experimental
Samples are grown using an inductively coupled plasma reactor. The samples are silicon
substrates (N-doped, <100>) sputtered with a metal catalyst (A1 and Fe) and sometimes
an underlayer of lr or Mo. The catalyst metals and the underlayers are 99.9+% pure andsputtered using a VRC Group Inc. Ion Beam Sputterer, model IBS/TM200S. The
chamber is continuously flushed with argon (99.999% pure) as the sample is inserted into
the chamber. Once the sample is in place, the chamber is evacuated down to.0.1 torr (±0.1 torr). The chamber is then heated up to 800°C (except in the instance where
temperature is variable), allowing 5 minutes, once 800°C is reached, for the temperature
to equilibrate. Then a gas mixture of 1-20% methane in hydrogen (both 99.999% pure,Scott Specialty Gases), with a total flow rate of 100 sccm, is turned on and the reactor
pressure is adjusted to 1-20 torr. The capacitive and inductive plasmas are then turned
on, each adjusted to the desired power output (0-250W) and the sample is allowed to
grow, typically for 10 minutes (total range observed" 5-40 minutes). Once the allotted
time has elapsed, the plasma, the heater and the gas flows are turned off and the reactor is
evacuated. The chamber is allowed to cool down to below 300°C under vacuum to
prevent damage to the CNTs from air. The chamber is once again flushed with argon asthe sample is removed.

ResultsandDiscussion
To startwith, weusedacatalystformulationthat hasshowneffectivein thermalCVD(Ref to bepublished)andalsoworkedwell in PECVDgrowth: 10nm AI underneath10nmFe.
First we investigatedthetemperaturedependenceon thegrowth. Two sampleswith theabovementionedcatalystweregrownunderthesameconditions(10 torr, 20%methane,10minutes,100Winductivepowerand70Wcapacitivepower)exceptoneat 800°Candoneat 700°C. As seenin Figure1,the800°Csamplegrewtaller fibersthanthe700°C.In all subsequentruns,800° wasusedasthereactortemperature.
Next we variedthegaspressurein thechamberfrom 1to 20 torr (figure2), againusing20% metlmn.e,10minutes,100Winductivepower,70Wcapacitivepowerand800°C. Athighpressure(20 torr) a largeamountof carboncontaminationwasdeposited(figure 2d),obscuringanytubesthat mayhavealsogrown. As expectedtheoppositehappenedatlow pressure.Little amorphouscarbonwasdepositedandtherewasalow densityoffibersgrown. A pressureof 3torr yieldedfibersthathaduniform heightanddensityandappearedto havelittle carboncontamination;sofrom this point on,apressureof 3 torrwasused.
Thecapacitivepowerwasvariedfrom 0 up to 120W,asseenin figure 3. It wasfoundthat at low power(0-20W)maginally-alignedCNTsweregrown(3a). From30-40Wthereis atransitionphasewheretheseCNTsweremixed with graphiticcarbonfibers(GCFs). Past50W, thealignedGCFsarethepredominatefeatureseen.However,oncethepowerexceeded70W,thedensitybeganto decrease.Growthatpowersgreaterthan140Wwerenot investigateddueto thelargeamountsof reflectedpowerthatwereexperiencedin oursystematthosepowers. Ourwork showsthatapowerof 70WprovidesstraightGCFswithout sacrificingtheoverall density;thispowerwasusedinfurther trials.
Theinductivepowerwasals0a/teredto seeits effect. Asthe inductivepowerchangedfrom 0 to 250W,very little changewasseenin thegrownfibers(Figure4). In subsequentnms, the inductivepowerwaskeptat 100Waspreviouslyhadbeenused.
In orderto increasetheconductivityof thesubstrate,anunderlayerof Ir or Mo wasadded. It wasfoundthat if theA1wasreplacedwith anequallayerof Ir, eithertherewasvery shortgrowth (<50nm) or a layerof carboncontaminationwasdeposited.If Mo wasused,therewasgrowth of about250nmbut thefiberswereextremelysparse.WhentheIr andMo weredepositedbeneaththelayerof A1,theresultswereverysimilar, Both hadamix of theGCFsalongwith CNTs,verysimilar to thegrowthusingacapacitivepowerof 40W with theAI/Fe catalyst.Followingthetrendfoundin thecapacitivepower,increasingthepowercompletesthetransitionfrom thenanotubesto thegraphiticfibers.At 100Wit wasseenfor boththeIr/Al/Fe andMo/A1/Fecatalyststhat thegrowth iscomparableto thegrowth at70Wwith only AI/Fe asthecatalyst.

Wethenvariedthethicknessof theFelayer(usingonly AI and Fe) from 1-40 nm (figure6). As expected, the diameter of the fibers increased as the Fe layer increased, from
about 20nm for the 50nm layer to over 75nm for the 40nm thick layer. Below 5nm, no
CNTs or GCFs formed, showing the lower limit of catalyst thickness.
The percentage of methane in the gas mixture was then varied from 1 to 20% (figure 7).When there was less than 5% methane, no tubes or fibers grew, even after 40 minutes.
As the percentage increased from 5%, to 10% finally to 20%, little change was noted.
The diameters of the fibers remained the same. The 5% sample yielded fibers 150-200
nm taller than the 10% and 20%, which were the same height; however, in another trial at
5%, the growth was not of uniform height, so no clear conclusions can be drawn until
fiwther investigated. Since there was no obvious better choice than 20% methane, it wascontinued to be used.
As mentioned previously, the samples were allowed to grow for 10 minutes. We
discovered that if the samples are allowed to continue to grow, the growth continues; it
does not become poisoned at any point up to 40 minutes (figure 8). The samples
continue to grow, but not at a linear rate. Growth of 300 nm was achieved after 5
minutes, 450 nm after 10 minutes, 500 nm after 15 minutes, 750 nm after 20 minutes and
1200 nm after 40 minutes. It can be extrapolated that growth will continue for longerperiods of time.
By growing a sample that spanned over half of the electrode, a growth profile was found;the type of growth was not affected, only the height. At the center of the electrode 350
nm tall fibers were grown. On the edge of the blackened spot, fibers 250 nm tall were
grown. The shortest fibers were grown in the area closest to the very edge of the
electrode and were 100 nm tall. Also of interest is the color of the sample, as seen in
figure 9. The colors seen correspond to the fiber heights.
Samples of both the fibers that were typically grown and the CNTs (grown at low
capacitive power) were imaged using a high-resolution transmission electron microscope(TEM). The TEM results indic_tte that the larger stuctures seen are not CNTs but are
GCFs instead. The smaller tubes seen at lower capacitive powers are CNTs though
defective ones. Unfommately no TEM images are available in this paper.
Conclusions
There are many factors that affect PECVD growth of carbon nanotubes and all of their
effects are not well known. We investigated the effects caused by changes in
temperature, pressure, capacitive power, inductive power, various additional underlayers,
catalyst thickness, gas mixtures, time, and placement. Of these only the capacitive power
and the additional underlayers affected the type of growth (CNTs versus GCFs). Also,
only the capacitive power affected the alignment of the tubes and fibers. The others
affected the height grown, density of growth, and sometimes, as in the case of thin layers
of iron, the presence or absence of growth. This type of PECVD can be used to grow

GCFsof variousdiameters(dependingoncatalystlayerthickness)that arewell alignedandof uniform density.
Acknowledgement
I thankLanceDelzeit for hisdirectionandassistance,BrettCrudenfor hisplasmaexpertiseandreactorassistanceandM. Meyyappan.
References:
[1][2][3]
T. Guo et al, Chemical Physics Letters 243 (1995) 49-54.
C.H. Kiang et al, Carbon 33 (1995) 903.
A.M. Cassell, S. Verma, L. Delzeit, M. Meyyappan, Langmuir 17 (2001) 260.
tz

Figure 1" SEM images of growth at a) 700°C and b) 800 °.
Figure 2" SEM images of a) 0.5 torr, b) 3 torr, c). 10 torr, and d) 20 torr of total pressure,while keeping all other parameters the same.

Figure3"SEM imagesof tubesandfibersgrownata)20W, b) 40W, c) 70W andd)120Wcapacitivepower,all underthesameconditions.
Figure4" SEM imagesof a) 0W,b) 50W,c) 100W,andd)250 W inductivepower.

Figure5" SEM imagesof sampleswith theA1layerreplacedby a) Ir andb) Mo. Hereanadditionalunderlayerof c) Ir andd)Mo wereaddedundertheA1andgrownat 70Wandthenalsoat 100Wfor e) Ir/A1/Feandf) Mo/A1/Fe.

Figure6" SEM imagesof growthwith the iron layervaryingfrom a) 1nm,b) 25nm, c)50nm, d) 75nm,e) 100nm, to f) 400nm.

Figure 7" SEM images with/t methane percentage of a) 1%, b) 2.5%, c) 5%, d) 10%, ande) 20%.
10
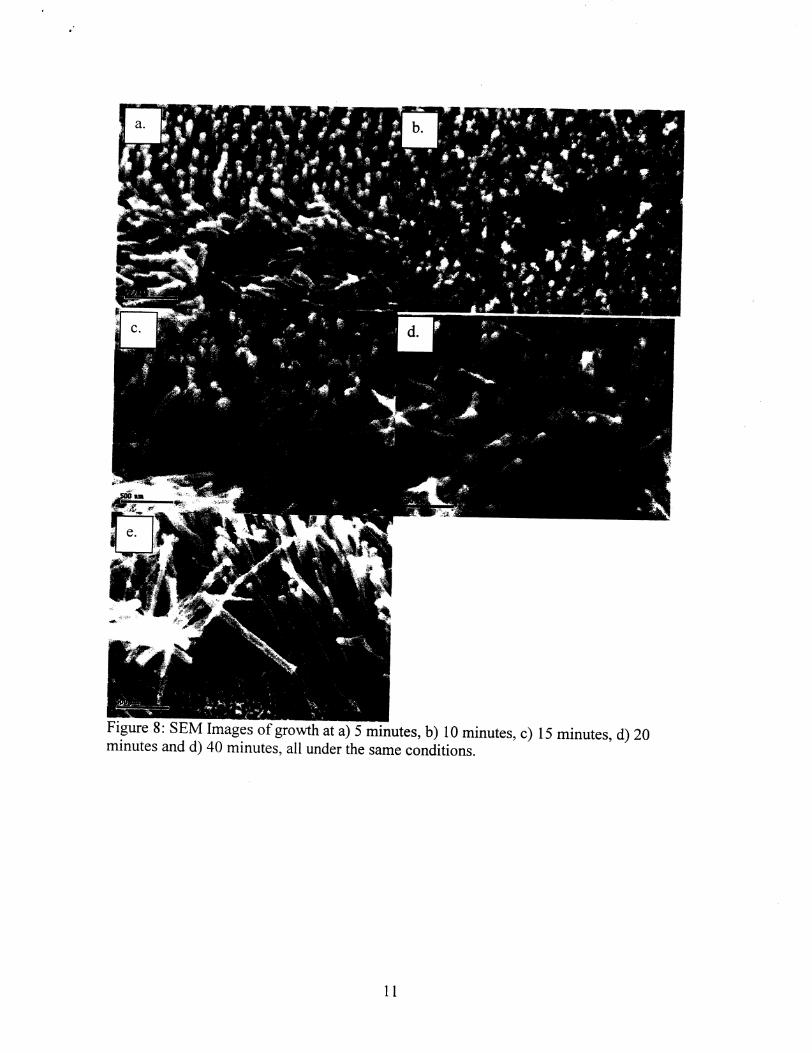
Figure 8" SEM Images of growth at a) 5 minutes, b) 10 minutes, c) 15 minutes, d) 20minutes and d) 40 minutes, all under the same conditions.
11

.. p*
350 nm 250 nm 1O0 nm
Figure 9: The lower electrode with the color and height profile of fibers. The height
depends on the location on the lower electrode, and the color reflects the heights, as in athin film.
t
12