pedestrian crosswalk case studies: … · study was part of a larger federal highway administration...
TRANSCRIPT
Pedestrian Crosswalk CaseStudies: Richmond, Virginia;Buffalo, New York; Stillwater,MinnesotaREPORT NO. FHWA-RD-00-103 August 2001
U.S. Department of TransportationFederal Highway AdministrationResearch, Development, and TechnologyTurner-Fairbank Highway Research Center6300 Georgetown PikeMcLean, VA 22101-2296
FOREWORD The FHWA’s Pedestrian and Bicycle Safety Research Program’s overall goal is to increase pedestrian and bicycle safety and mobility. From better crosswalks, sidewalks and pedestrian technologies to growing educational and safety programs, the FHWA’s Pedestrian and Bicycle Safety Research Program strives to pave the way for a more walkable future. Crosswalks are among the treatments used to help pedestrians cross streets safely. This study was part of a larger Federal Highway Administration research study investigating the safety effectiveness of crosswalks for pedestrians. This study focused on the effect of crosswalk markings on both pedestrian and driver behavior at unsignalized intersections. It is hoped that readers also will review the reports documenting the results of the related pedestrian crossing studies. The results of this research will be useful to transportation engineers, planners, and safety professionals who are involved in improving pedestrian safety and mobility.
Michael F. Trentacoste
Director, Office of Safety Research and Development
NOTICE This document is disseminated under the sponsorship of the Department of Transportation in the interest of information exchange. The United States Government assumes no liability for its content of use thereof. This report does not constitute a standard, specification or regulation. The United States Government does not endorse products or manufactures. Trade and manufactures’ names appear in this report only because they are considered essential to the object of the document.
Technical Report Documentation Page
1. Report No.
FHWA-RD-00-103
2. Government Accession No. 3 Recipient’s Catalog No.
4. Title and Subtitle
PEDESTRIAN CROSSWALK CASE STUDIES:
SACRAMENTO, CALIFORNIA; RICHMOND, VIRGINIA;
BUFFALO, NEW YORK; STILLWATER, MINNESOTA
5. Report Date
August 2001
6. Performing Organization Code
7. Author(s)
Richard L. Knoblauch, Marsha Nitzburg, and
Rita F. Seifert, Ph.D.
8. Performing Organization Report No.
9. Performing Organization Name and Address
Center for Applied Research, Inc.10213 Forest Lake Drive
Great Falls, VA 22066-3608
10. Work Unit No. (TRAIS)
11. Contract or Grant No.
DTFH61-92-C-00138
12. Sponsoring Agency Name and Address
Office of Safety R&DFederal Highway Administration
6300 Georgetown Pike
McLean, VA 22101-2296
13. Type of Report and Period Covered
Research Report
July 1, 1996 - October 31,
1999
14. Sponsoring Agency Code
15. Supplementary Notes
Contracting Officer’s Technical Representative (COTR): Carol Tan Esse
The prime contractor for this study was the University of North Carolina Highway SafetyResearch Center
16. Abstract
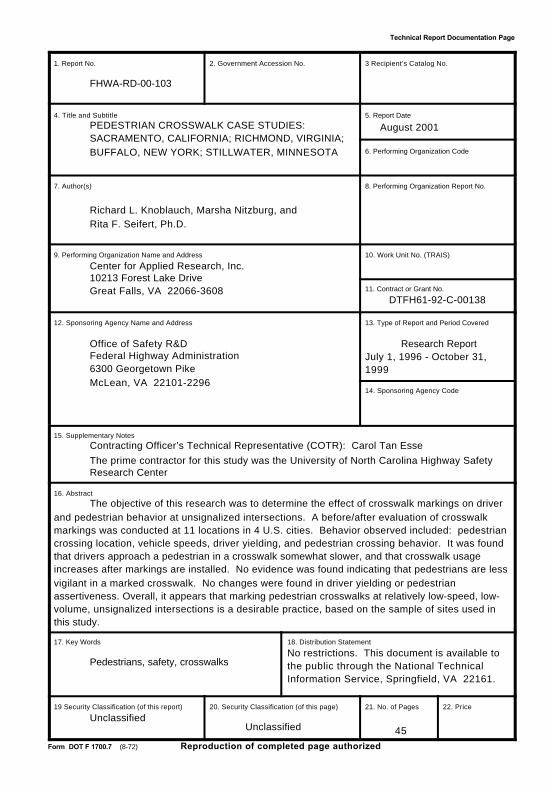
The objective of this research was to determine the effect of crosswalk markings on driver
and pedestrian behavior at unsignalized intersections. A before/after evaluation of crosswalk
markings was conducted at 11 locations in 4 U.S. cities. Behavior observed included: pedestrian
crossing location, vehicle speeds, driver yielding, and pedestrian crossing behavior. It was found
that drivers approach a pedestrian in a crosswalk somewhat slower, and that crosswalk usage
increases after markings are installed. No evidence was found indicating that pedestrians are less
vigilant in a marked crosswalk. No changes were found in driver yielding or pedestrian
assertiveness. Overall, it appears that marking pedestrian crosswalks at relatively low-speed, low-
volume, unsignalized intersections is a desirable practice, based on the sample of sites used in
this study.
17. Key Words
Pedestrians, safety, crosswalks
18. Distribution Statement
No restrictions. This document is available to
the public through the National Technical
Information Service, Springfield, VA 22161.
19 Security Classification (of this report)
Unclassified20. Security Classification (of this page)
Unclassified
21. No. of Pages
45
22. Price
Form DOT F 1700.7 (8-72) Reproduction of completed page authorized
i i
i i i
TABLE OF CONTENTSPage
OVERVIEW . . . . . . . . . . . . . . . . . . . . . . . . . . . . . . . . . . . . . . . . . . . . . . . . . . . . . . . . . . . . . . . . . . . 1
OBJECTIVES . . . . . . . . . . . . . . . . . . . . . . . . . . . . . . . . . . . . . . . . . . . . . . . . . . . . . . . . . . . . . . . . . 1
METHOD . . . . . . . . . . . . . . . . . . . . . . . . . . . . . . . . . . . . . . . . . . . . . . . . . . . . . . . . . . . . . . . . . . . . . 1
Experimental Sites . . . . . . . . . . . . . . . . . . . . . . . . . . . . . . . . . . . . . . . . . . . . . . . . . . . . . . . 1
Sacramento, Site 1: 10th Street at Capitol Mall Drive . . . . . . . . . . . . . . . . . . . . . . . 2Sacramento, Site 2: O Street at 14th Street . . . . . . . . . . . . . . . . . . . . . . . . . . . . . . 3
Sacramento, Site 3: N Street at 18th Street . . . . . . . . . . . . . . . . . . . . . . . . . . . . . . 3
Richmond, Site 1: Main Street at Granby Street . . . . . . . . . . . . . . . . . . . . . . . . . . 4Richmond, Site 2: Main Street at Plum Street . . . . . . . . . . . . . . . . . . . . . . . . . . . . 4
Richmond, Site 3: Main Street at Brunswick Street . . . . . . . . . . . . . . . . . . . . . . . . . 4
Buffalo, Site 1: E. Lovejoy Street at Goethe Street . . . . . . . . . . . . . . . . . . . . . . . . 5Buffalo, Site 2: E. Lovejoy Street at Schiller Street . . . . . . . . . . . . . . . . . . . . . . . . 6
Buffalo, Site 3: Tacoma Avenue at Winston Road . . . . . . . . . . . . . . . . . . . . . . . . . 6
Stillwater, Site 1: 4th Street at W. Mulberry Street . . . . . . . . . . . . . . . . . . . . . . . . . 6Stillwater, Site 2: S. Everett Street at W. Anderson Street . . . . . . . . . . . . . . . . . . . 7
DATA COLLECTION PROCEDURES . . . . . . . . . . . . . . . . . . . . . . . . . . . . . . . . . . . . . . . . . . . . . . . 12Pedestrian Entry/Magnet Study . . . . . . . . . . . . . . . . . . . . . . . . . . . . . . . . . . . . . . . . . . . . . 12
Right of Way Study . . . . . . . . . . . . . . . . . . . . . . . . . . . . . . . . . . . . . . . . . . . . . . . . . . . . . . 12
Driver Speeds/Staged Pedestrian Study . . . . . . . . . . . . . . . . . . . . . . . . . . . . . . . . . . . . . . 13Pedestrian Profile Study . . . . . . . . . . . . . . . . . . . . . . . . . . . . . . . . . . . . . . . . . . . . . . . . . . 14
RESULTS AND DISCUSSION . . . . . . . . . . . . . . . . . . . . . . . . . . . . . . . . . . . . . . . . . . . . . . . . . . . . 15Vehicle Volumes . . . . . . . . . . . . . . . . . . . . . . . . . . . . . . . . . . . . . . . . . . . . . . . . . . . . . . . . 15
Available Gaps in Traffic . . . . . . . . . . . . . . . . . . . . . . . . . . . . . . . . . . . . . . . . . . . . . . . . . . 18
Vehicle Speeds/Staged Pedestrian Study . . . . . . . . . . . . . . . . . . . . . . . . . . . . . . . . . . . . . 20Driver and Pedestrian Behavior . . . . . . . . . . . . . . . . . . . . . . . . . . . . . . . . . . . . . . . . . . . . . 24
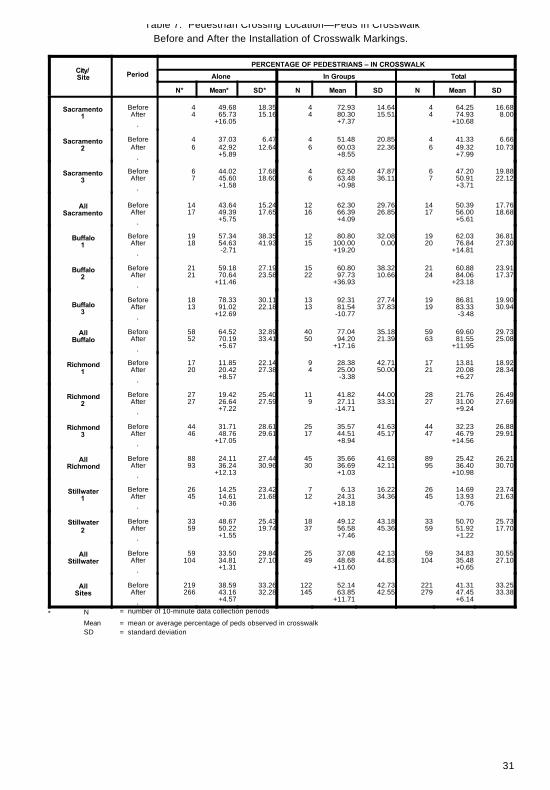
Pedestrians Crossing in Groups . . . . . . . . . . . . . . . . . . . . . . . . . . . . . . . . . . . . . . . 28
All Pedestrians . . . . . . . . . . . . . . . . . . . . . . . . . . . . . . . . . . . . . . . . . . . . . . . . . . . 28Pedestrian Profile—Looking Behavior . . . . . . . . . . . . . . . . . . . . . . . . . . . . . . . . . . . . . . . . 28
SUMMARY AND CONCLUSIONS . . . . . . . . . . . . . . . . . . . . . . . . . . . . . . . . . . . . . . . . . . . . . . . . . 30
APPENDIX—DATA COLLECTION PROTOCOL . . . . . . . . . . . . . . . . . . . . . . . . . . . . . . . . . . . . . . 32
Pedestrian Entry/Magnet Study - Data Collection Protocol . . . . . . . . . . . . . . . . . . . . . . . . 33Right of Way Study - Data Collection Protocol . . . . . . . . . . . . . . . . . . . . . . . . . . . . . . . . . 34
Driver Speeds/Staged Pedestrian Study - Data Collection Protocol . . . . . . . . . . . . . . . . . . 35
Pedestrian Profile Study - Data Collection Protocol . . . . . . . . . . . . . . . . . . . . . . . . . . . . . 37Vehicle Volume Counts and Traffic Gaps . . . . . . . . . . . . . . . . . . . . . . . . . . . . . . . . . . . . . 39
Field Studies Definitions and Exceptions . . . . . . . . . . . . . . . . . . . . . . . . . . . . . . . . . . . . . 40

iv
LIST OF FIGURES
Page
Figure 1. Sacramento Site No. 1 (10th Street at Capitol Mall Drive) . . . . . . . . . . . . . . . . 8Figure 2. Sacramento Site No. 2 (O Street at 14th Street) . . . . . . . . . . . . . . . . . . . . . . . . . 8Figure 3. Sacramento Site No. 3 (N Street at 18th Street) . . . . . . . . . . . . . . . . . . . . . . . . . 8Figure 4. Richmond Site No. 1 (Main Street at Granby Street) . . . . . . . . . . . . . . . . . . . . 9Figure 5. Richmond Site No. 2 (Main Street at Plum Street) . . . . . . . . . . . . . . . . . . . . . . 9Figure 6. Richmond Site No. 3 (Main Street at Brunswick Street) . . . . . . . . . . . . . . . . . 9Figure 7. Buffalo Site No. 1 (E. Lovejoy Street at Goethe Street) . . . . . . . . . . . . . . . . . 10Figure 8. Buffalo Site No. 2 (E. Lovejoy Street at Schiller Street) . . . . . . . . . . . . . . . . . 10Figure 9. Buffalo Site No. 3 (Tacoma Avenue at Winston Road) . . . . . . . . . . . . . . . . . 10Figure 10. Stillwater Site No. 1 (4th Street at W. Mulberry Street) . . . . . . . . . . . . . . . . . 11Figure 11. Stillwater Site No. 2 (S. Everett Street at W. Anderson Street) . . . . . . . . . . 11
LIST OF TABLES
Table 1. Effect of Crosswalk Markings on Vehicle Volumes on Thru Street . . . . . . . 16Table 2. Effect of Crosswalk Markings on Vehicle Volumes on Cross Street . . . . . . 17Table 3. Available Gaps in Traffic Before and After the Installation of
Crosswalk Markings . . . . . . . . . . . . . . . . . . . . . . . . . . . . . . . . . . . . . . . . . . . 19
Table 4. Effect of Crosswalk Markings on Vehicle Approach Speeds . . . . . . . . . . . . . 21Table 5. Effect of Crosswalk Markings on Vehicle Speeds in Crosswalk . . . . . . . . . 23Table 6. Effect of Crosswalk Markings on Driver and Pedestrian Behavior . . . . . . . . 25Table 7. Effect of Crosswalk Markings on Pedestrian Crossing Location—
Peds In Crosswalk . . . . . . . . . . . . . . . . . . . . . . . . . . . . . . . . . . . . . . . . . . . . . 26
Table 8. Pedestrian Profile: Pedestrian Looking Behavior . . . . . . . . . . . . . . . . . . . . . . 29Table 9. Summary of Research Results . . . . . . . . . . . . . . . . . . . . . . . . . . . . . . . . . . . . . . 31
1
OVERVIEW
This research was conducted by the Center for Applied Research, Inc., as part of asubcontract from The University of North Carolina Highway Safety Research Center. Task Order 11, Evaluation of Pedestrian Facilities, was part of Federal HighwayAdministration research project DTFH61-92-C-00138, Pedestrian and Bicyclist Safety- Administrative and Technical Support.
OBJECTIVES
The overall objective of the research was to determine the effect of crosswalkmarkings on driver and pedestrian behavior at unsignalized intersections. Oneaspect of the field data collection effort was to determine if pedestrians were morelikely to cross a street within a marked crosswalk. A second aspect of the study wasto determine if drivers drove slower and/or yielded more often to pedestrians crossingat a marked location. A final aspect of the study was to determine if pedestrians usemore, less, or the same amount of caution when crossing at a marked pedestriancrosswalk compared with an unmarked location.
METHOD
Experimental Sites
Eleven intersections were selected from four cities in different geographical regionsof the United States. A before/after evaluation of pedestrian crosswalk markings wasconducted. With the exception of one California location, all of the sites were locatedat previously unmarked crosswalks. All of the crossing locations were on relativelystraight and level roadways that allowed excellent sight distance.
Three locations in downtown Sacramento, California, were selected for evaluation. Two of the three sites were located at intersections with unmarked crosswalks. Before and after studies of crosswalk markings were conducted.
The third site in Sacramento was at a “T” intersection in front of the State Capitolbuilding. One through leg had standard solid white parallel line crosswalk markings. The other through leg had no crosswalk markings and No Crossing symbol signs(MUTCD R9-3a) and USE CROSSWALK with arrow signs (MUTCD R9-3b) posted,specifically prohibiting crossing at that location. The city was experiencing difficulty in

2
channeling pedestrian traffic and planned to supplement the existing standardcrosswalk markings with a high-visibility upgrade.
Three locations between Virginia Commonwealth University and the community ofUptown, in Richmond, Virginia, were selected. The three unsignalized intersectionsprovided ideal locations for pedestrian and driver observational studies because theyexperienced heavy traffic and continuous pedestrian activity throughout the day. Thechief traffic engineer of Richmond installed standard solid white parallel linecrosswalk markings in both crosswalks at each of the three intersections. A beforeand after study was conducted.
The chief traffic engineer of Buffalo, New York, suggested many locations that couldbe used in the study. Unfortunately, many of the unsignalized intersections in the citywere four-way, stop-controlled offset intersections. Three standard intersections withno traffic signals were selected. Two of the sites were on the south side of the city inan older village with mixed commercial and residential usage. The third site was onthe north side of the city in a suburban residential neighborhood. A before and afterstudy was conducted at the three intersections. The city installed standard solid whiteparallel line crosswalk markings at the three locations.
Two sites were selected for evaluation in Stillwater, Minnesota. One of the sites wasa “T” intersection in the downtown district across from the city library. The secondintersection was adjacent to one of the town's hospitals. With the cooperation of thecity traffic engineer, a before and after study was conducted with high-visibility laddercrosswalk markings installed for the after study.
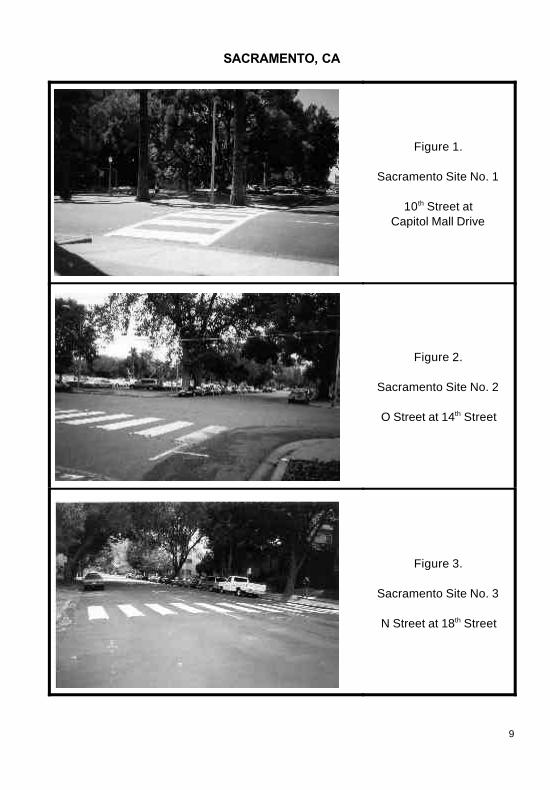
A detailed description of each of the study intersections follows. Photos showingeach location after the crosswalk installation are presented as Figures 1 thru 11.
Sacramento, Site 1: 10th Street at Capitol Mall Drive
The intersection of 10th Street at Capitol Mall Drive is unsignalized. 10th Street is aone-way, three-lane westbound roadway. Capitol Mall Drive is a stop-controlled,two-way roadway with a wide, grassy median that formed a “T” intersection at 10th
Street. There is restricted and metered parking along both sides of 10th Street withbus only parking in front of the Capitol Building across from the “T” intersection. Sidewalks are located on both sides of all legs of the intersection. Curb cuts areprovided on the east leg of 10th Street and on the cross street. There are no curb cutson the west leg of 10th Street, and two No Crossing (MUTCD R9-3a) symbol signswere posted on both sides of the roadway. Below the no pedestrian crossing signs
3
there was a Crosswalk sign with directional arrows (MUTCD R9-3b). The arrowspointed to the east leg of the through street where a standard solid white parallel linecrosswalk was installed in the roadway. The crosswalk markings were 0.3 m (1 ft)wide and 3 m (10 ft) apart. All legs of the intersection were straight and level and thespeed limit was 40 km/h (25 mi/h).
The State Capitol building is located across from the “T” intersection at Capitol Drive. Pedestrian traffic is lightest during morning rush hour, heaviest between 11:00 amand 4:00 pm, and moderate and steady during the afternoon rush hour. Tourists andschool children visit the State Capitol building throughout the day, often arriving inbuses.
The after study was conducted about 1 month after a novel high-visibility crosswalkwas installed. The crosswalk markings were enhanced by adding 0.6-m (2-ft) by 3-m(10-ft) solid white rectangles perpendicular to the standard solid white parallel lines. A total of seven white blocks and six unmarked spaces stretched the width of 10th
Street. In addition, seven mono-directional, raised reflective pavement markers wereinstalled in front of the white paint markings facing oncoming traffic.
Sacramento, Site 2: O Street at 14th Street
The intersection of O Street at 14th Street is unsignalized. O Street is a two-wayeast/west through street with one lane in each direction. The stop-controlled crossstreet, 14th Street, is also one lane in each direction. There are no additional turnlanes; however, there is space for metered and/or restricted parking on all four legs(both sides) of the intersection. There are sidewalks on all four legs, both sides ofthe road, with curb cuts at all crossings. All legs of the intersection are straight andlevel and the posted speed limit is 40 km/h (25 mi/h). The closest intersectioneastbound is 108.6 m (356 ft) away and is also an unsignalized intersection. In thewestbound direction, O Street ends at a stop-controlled “T” intersection about 108.6 m(356 ft) away. Two restaurants, a market, and a parking lot are located on the cornersof the intersection. Mixed residential and office buildings provide a pedestrian volumethat peaks during rush hours and lunch time.
The crosswalks were unmarked during the before study. A high-visibility ladder stylecrosswalk was installed on the west leg of O Street for the after study. The markedcrosswalk consisted of 10 bold white lines 3 m (10 ft) by 0.6 m (2 ft) with 0.6-m (2-ft)spacings. Each white line also had two mono-directional, raised reflective pavementmarkers installed facing oncoming traffic.
4
Sacramento, Site 3: N Street at 18th Street
The intersection of N Street at 18th Street was unsignalized. N Street is a one-way,eastbound, three-lane roadway. The stop-controlled cross street, 18th St., is a two-way roadway with one lane in each direction. There are no additional turn lanes;however, there is parking on all four legs, both sides, of the roadway. The residentialintersection has sidewalks on all four legs with curb cuts at all crossings. The roadsare straight and level with a speed limit of 40 km/h (25 mi/h). The closest signalizedintersections are at 16th Street and at 19th Street, which are 244 m (800 ft) away.
The crosswalks were unmarked during the before study. A high-visibility ladder stylecrosswalk was installed on the east leg of N Street for the after study. The markedcrosswalk consisted of 11 bold white lines 3.7 m (12 ft) by 0.6 m (2 ft) with 0.6-m (2-ft)spacings. Each white line also had two mono-directional, raised reflective pavementmarkers installed on the one-way approach to the crosswalk. The intersection is mixed-use residential and commercial with small corner businesses nearby. Pedestrian traffic is light but steady throughout the day.
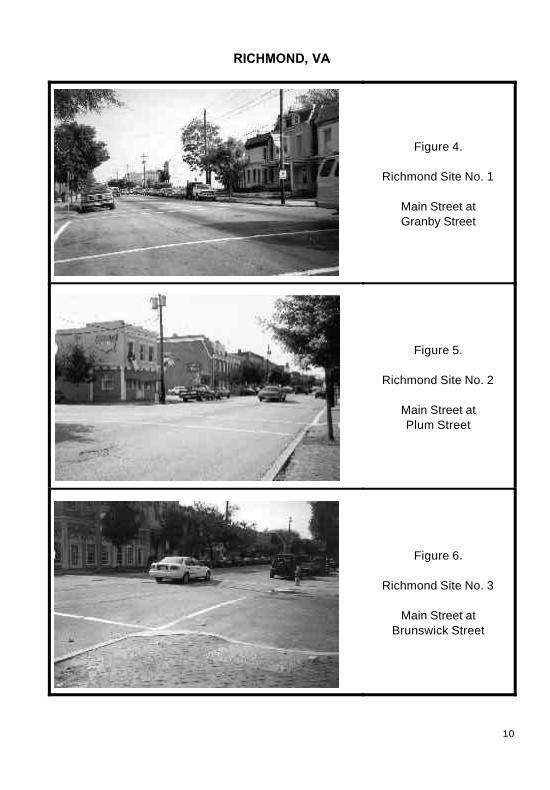
Richmond, Site 1: Main Street at Granby Street
The intersection of Main Street at Granby Street was unsignalized. Main Street is aone-way, two-lane northbound roadway. There are two additional paved lanes usedfor parking. Granby Street is a two-way, stop-controlled roadway with one lane in eachdirection. Parking is permitted at both legs, on both sides of the roadway. There aresidewalks without curb cuts on all four legs, both sides of the roadway, with theexception of the south side of Granby Street, west leg. All legs of the intersection arestraight and level and the speed limit is 40 km/h (25 mi/h). The intersection is locatedwithin a mixed commercial and residential area where pedestrian traffic is light butsteady throughout the day. The closest signalized intersection is located about 97.6m (320 ft) north of the site.
During the before study, the crosswalks were unmarked. The after study wasconducted after standard solid white parallel crosswalk markings were installed at allfour crossings of the intersection. The width of the white painted crosswalk markingswas 152 mm (6 in).
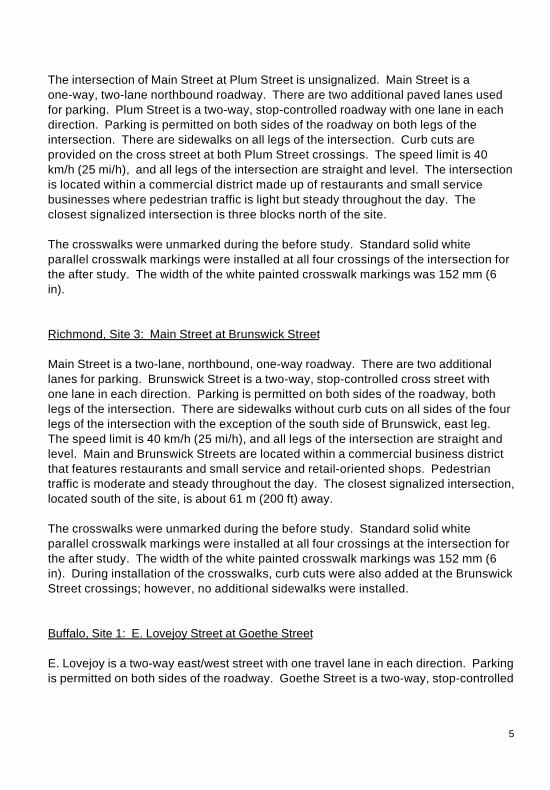
Richmond, Site 2: Main Street at Plum Street
5
The intersection of Main Street at Plum Street is unsignalized. Main Street is aone-way, two-lane northbound roadway. There are two additional paved lanes usedfor parking. Plum Street is a two-way, stop-controlled roadway with one lane in eachdirection. Parking is permitted on both sides of the roadway on both legs of theintersection. There are sidewalks on all legs of the intersection. Curb cuts areprovided on the cross street at both Plum Street crossings. The speed limit is 40km/h (25 mi/h), and all legs of the intersection are straight and level. The intersectionis located within a commercial district made up of restaurants and small servicebusinesses where pedestrian traffic is light but steady throughout the day. Theclosest signalized intersection is three blocks north of the site.
The crosswalks were unmarked during the before study. Standard solid whiteparallel crosswalk markings were installed at all four crossings of the intersection forthe after study. The width of the white painted crosswalk markings was 152 mm (6in).
Richmond, Site 3: Main Street at Brunswick Street
Main Street is a two-lane, northbound, one-way roadway. There are two additionallanes for parking. Brunswick Street is a two-way, stop-controlled cross street withone lane in each direction. Parking is permitted on both sides of the roadway, bothlegs of the intersection. There are sidewalks without curb cuts on all sides of the fourlegs of the intersection with the exception of the south side of Brunswick, east leg. The speed limit is 40 km/h (25 mi/h), and all legs of the intersection are straight andlevel. Main and Brunswick Streets are located within a commercial business districtthat features restaurants and small service and retail-oriented shops. Pedestriantraffic is moderate and steady throughout the day. The closest signalized intersection,located south of the site, is about 61 m (200 ft) away.
The crosswalks were unmarked during the before study. Standard solid whiteparallel crosswalk markings were installed at all four crossings at the intersection forthe after study. The width of the white painted crosswalk markings was 152 mm (6in). During installation of the crosswalks, curb cuts were also added at the BrunswickStreet crossings; however, no additional sidewalks were installed.
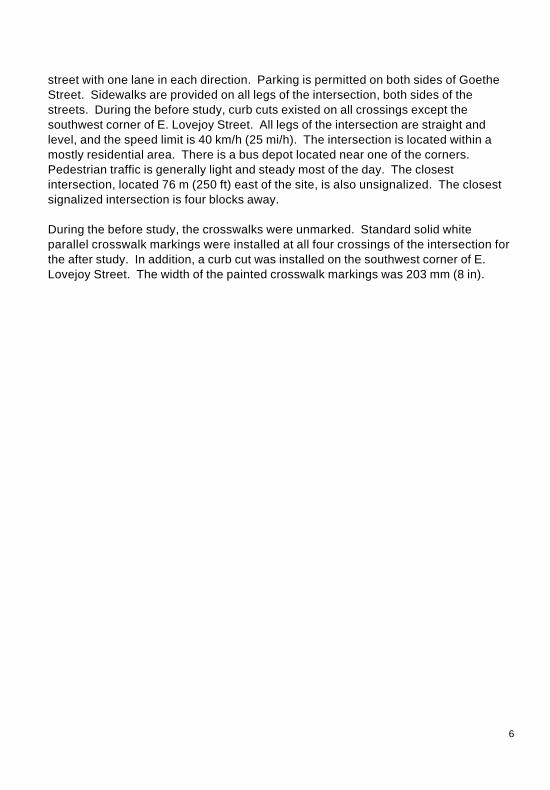
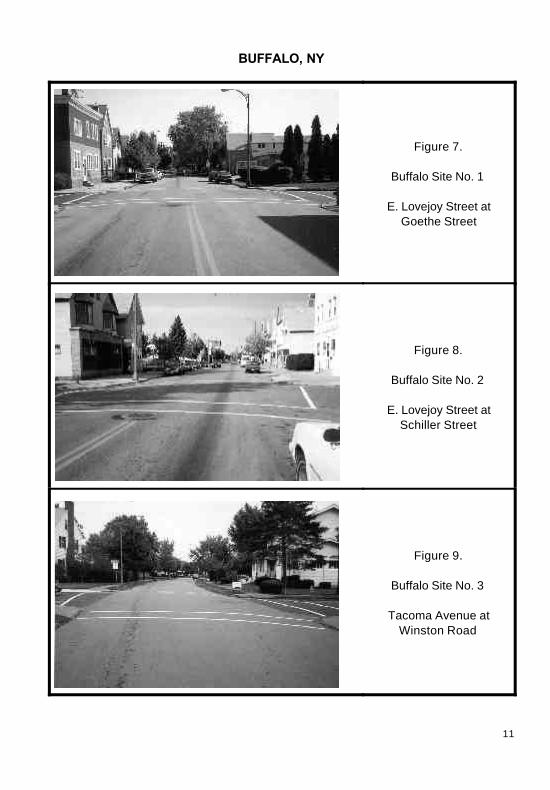
Buffalo, Site 1: E. Lovejoy Street at Goethe Street
E. Lovejoy is a two-way east/west street with one travel lane in each direction. Parkingis permitted on both sides of the roadway. Goethe Street is a two-way, stop-controlled
6
street with one lane in each direction. Parking is permitted on both sides of GoetheStreet. Sidewalks are provided on all legs of the intersection, both sides of thestreets. During the before study, curb cuts existed on all crossings except thesouthwest corner of E. Lovejoy Street. All legs of the intersection are straight andlevel, and the speed limit is 40 km/h (25 mi/h). The intersection is located within amostly residential area. There is a bus depot located near one of the corners. Pedestrian traffic is generally light and steady most of the day. The closestintersection, located 76 m (250 ft) east of the site, is also unsignalized. The closestsignalized intersection is four blocks away.
During the before study, the crosswalks were unmarked. Standard solid whiteparallel crosswalk markings were installed at all four crossings of the intersection forthe after study. In addition, a curb cut was installed on the southwest corner of E.Lovejoy Street. The width of the painted crosswalk markings was 203 mm (8 in).
7
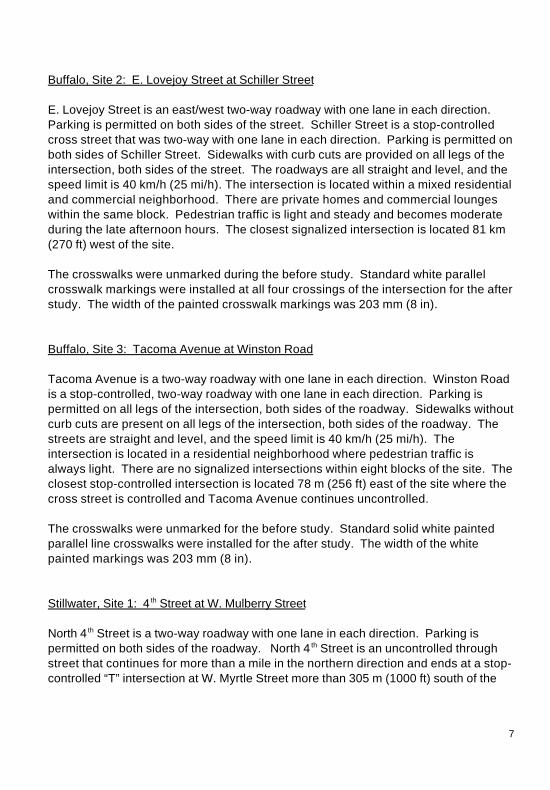
Buffalo, Site 2: E. Lovejoy Street at Schiller Street
E. Lovejoy Street is an east/west two-way roadway with one lane in each direction. Parking is permitted on both sides of the street. Schiller Street is a stop-controlledcross street that was two-way with one lane in each direction. Parking is permitted onboth sides of Schiller Street. Sidewalks with curb cuts are provided on all legs of theintersection, both sides of the street. The roadways are all straight and level, and thespeed limit is 40 km/h (25 mi/h). The intersection is located within a mixed residentialand commercial neighborhood. There are private homes and commercial loungeswithin the same block. Pedestrian traffic is light and steady and becomes moderateduring the late afternoon hours. The closest signalized intersection is located 81 km(270 ft) west of the site.
The crosswalks were unmarked during the before study. Standard white parallelcrosswalk markings were installed at all four crossings of the intersection for the afterstudy. The width of the painted crosswalk markings was 203 mm (8 in).
Buffalo, Site 3: Tacoma Avenue at Winston Road
Tacoma Avenue is a two-way roadway with one lane in each direction. Winston Roadis a stop-controlled, two-way roadway with one lane in each direction. Parking ispermitted on all legs of the intersection, both sides of the roadway. Sidewalks withoutcurb cuts are present on all legs of the intersection, both sides of the roadway. Thestreets are straight and level, and the speed limit is 40 km/h (25 mi/h). Theintersection is located in a residential neighborhood where pedestrian traffic isalways light. There are no signalized intersections within eight blocks of the site. Theclosest stop-controlled intersection is located 78 m (256 ft) east of the site where thecross street is controlled and Tacoma Avenue continues uncontrolled. The crosswalks were unmarked for the before study. Standard solid white paintedparallel line crosswalks were installed for the after study. The width of the whitepainted markings was 203 mm (8 in).
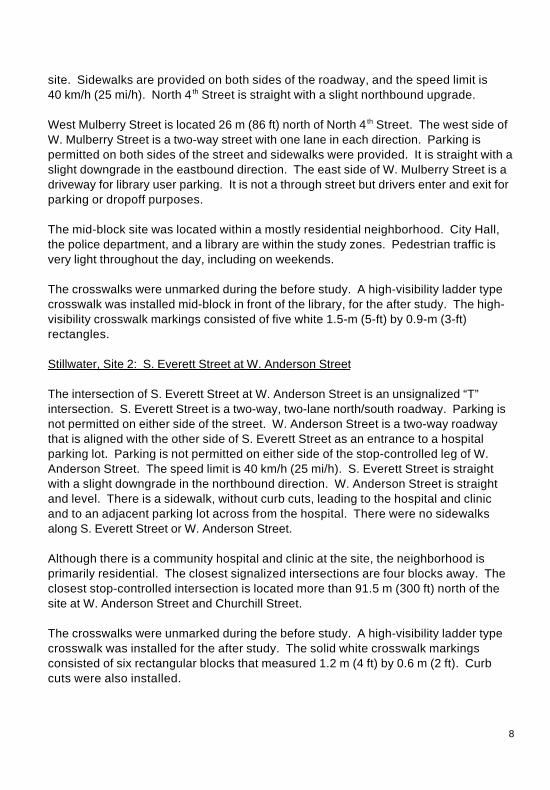
Stillwater, Site 1: 4th Street at W. Mulberry Street
North 4th Street is a two-way roadway with one lane in each direction. Parking ispermitted on both sides of the roadway. North 4 th Street is an uncontrolled throughstreet that continues for more than a mile in the northern direction and ends at a stop-controlled “T” intersection at W. Myrtle Street more than 305 m (1000 ft) south of the
8
site. Sidewalks are provided on both sides of the roadway, and the speed limit is 40 km/h (25 mi/h). North 4 th Street is straight with a slight northbound upgrade.
West Mulberry Street is located 26 m (86 ft) north of North 4th Street. The west side ofW. Mulberry Street is a two-way street with one lane in each direction. Parking ispermitted on both sides of the street and sidewalks were provided. It is straight with aslight downgrade in the eastbound direction. The east side of W. Mulberry Street is adriveway for library user parking. It is not a through street but drivers enter and exit forparking or dropoff purposes.
The mid-block site was located within a mostly residential neighborhood. City Hall,the police department, and a library are within the study zones. Pedestrian traffic isvery light throughout the day, including on weekends.
The crosswalks were unmarked during the before study. A high-visibility ladder typecrosswalk was installed mid-block in front of the library, for the after study. The high-visibility crosswalk markings consisted of five white 1.5-m (5-ft) by 0.9-m (3-ft)rectangles. Stillwater, Site 2: S. Everett Street at W. Anderson Street
The intersection of S. Everett Street at W. Anderson Street is an unsignalized “T”intersection. S. Everett Street is a two-way, two-lane north/south roadway. Parking isnot permitted on either side of the street. W. Anderson Street is a two-way roadwaythat is aligned with the other side of S. Everett Street as an entrance to a hospitalparking lot. Parking is not permitted on either side of the stop-controlled leg of W.Anderson Street. The speed limit is 40 km/h (25 mi/h). S. Everett Street is straightwith a slight downgrade in the northbound direction. W. Anderson Street is straightand level. There is a sidewalk, without curb cuts, leading to the hospital and clinicand to an adjacent parking lot across from the hospital. There were no sidewalksalong S. Everett Street or W. Anderson Street.
Although there is a community hospital and clinic at the site, the neighborhood isprimarily residential. The closest signalized intersections are four blocks away. Theclosest stop-controlled intersection is located more than 91.5 m (300 ft) north of thesite at W. Anderson Street and Churchill Street.
The crosswalks were unmarked during the before study. A high-visibility ladder typecrosswalk was installed for the after study. The solid white crosswalk markingsconsisted of six rectangular blocks that measured 1.2 m (4 ft) by 0.6 m (2 ft). Curbcuts were also installed.
9
SACRAMENTO, CA
Figure 1.
Sacramento Site No. 1
10th Street atCapitol Mall Drive
Figure 2.
Sacramento Site No. 2
O Street at 14th Street
Figure 3.
Sacramento Site No. 3
N Street at 18th Street
10
RICHMOND, VA
Figure 4.
Richmond Site No. 1
Main Street atGranby Street
Figure 5.
Richmond Site No. 2
Main Street atPlum Street
Figure 6.
Richmond Site No. 3
Main Street atBrunswick Street
11
BUFFALO, NY
Figure 7.
Buffalo Site No. 1
E. Lovejoy Street atGoethe Street
Figure 8.
Buffalo Site No. 2
E. Lovejoy Street atSchiller Street
Figure 9.
Buffalo Site No. 3
Tacoma Avenue atWinston Road

12
STILLWATER, MN
Figure 1O.
Stillwater Site No. 1
4th Street atW. Mulberry Street
Figure 11.
Stillwater Site No. 2
S. Everett Street atW. Anderson Street

13
DATA COLLECTION PROCEDURES
A team of two researchers in each city collected all of the before and after data duringthe spring, summer, and fall of 1996 and 1997. Data were collected between thehours of 8:00 am and 7:00 pm. The team worked together, one site at a time. Fourdifferent types of observational studies were conducted. Each study was scheduledto control for possible time of day and day of week differences.
The data collection team drew detailed site drawings that included measurements ofroadway and distances to various buildings, street furniture, and trees. The overallstudy zones for each site were determined by measuring half the distance to the nextintersection on the through street and between 17 m (55 ft) to 24 m (80 ft) on thecontrolled cross street. Other zones were created and labeled on the data collectionforms in order to track pedestrian origin and destination and various pedestrianbehaviors. Data were collected using pencil and data forms or by tape recordingbehavioral observations. The tapes were later transcribed onto data coding forms. Vehicle speeds were recorded at some of the sites using either laser or K-bandradar. Traffic volume counts, including turning movements, were collected hourly, and timeheadways (traffic gaps) were measured and recorded hourly at each site.
Following is a summary of the four studies that were conducted. For a morecomprehensive description of each study, data collection protocol, and sample datacollection forms, refer to the Appendix.
Pedestrian Entry/Magnet Study
The objective of the Pedestrian Entry/Magnet study was to determine if morepedestrians would cross at or near previously unmarked unsignalized intersectionswhen marked crosswalks were installed.
Researchers recorded the precise location and number of pedestrians entering theroadway to cross. Whether pedestrians were crossing alone or in groups was alsorecorded. Crossing zones included: at intersection, near intersection, variousdistances from intersection, mid-block, and diagonally. During data analysis thepedestrian crossing locations were reduced to either in the crosswalk (marked orunmarked) or not in the crosswalk. This was due to the relatively small number ofpedestrians observed in some of the original categories.
Right of Way Study

14
The primary objective of the Right of Way study was to determine how often driversyielded the right of way to pedestrians attempting to cross at a nonsignalizedintersection in unmarked and marked crosswalks. Another objective was todetermine how often pedestrians displayed aggressive behavior toward approachingmotorists by forcing drivers to yield the right of way. These behaviors were observedwhile pedestrians were crossing at the intersection.
The following data were recorded on a data collection form for each pedestrianobserved crossing the major roadway:
1. Driver yielded to pedestrian in travel way
2. Driver did not yield to pedestrian in travel way
3. Pedestrian showed blatant aggressive behavior toward driver (e.g.,
crossing behavior that required the driver to slow or stop to avoid acollision)
Driver Speeds/Staged Pedestrian Study
The primary objective of the Speed and Staged Pedestrian study was to determine ifdrivers slowed down when pedestrians were attempting to cross at a nonsignalizedintersection. A before and after study design was used to compare driver speeds atunmarked and marked crosswalks. For each observation, two speeds weremeasured: one in advance of the intersection and one at the crossing location. Byobserving two speeds, an assessment could be made about overall speeds andspeed change.
Speed measurements were recorded, under three test conditions, using laser radaror K-band radar. The first scenario, used for a baseline, was speeds of driversapproaching the test sites when no pedestrians were present near the intersection. During the second and third test conditions, one team member staged an actualroadway crossing. During these staged conditions, no other pedestrians werepresent. The same team member always performed as the staged pedestrian in thebefore and after conditions. The researcher always wore neutral colored casualclothing. A middle-aged man of average height and weight was the stagedpedestrian in Sacramento, Richmond, and Stillwater. A middle-aged woman ofaverage height and weight was the staged pedestrian in Buffalo. Time of day and dayof week were controlled between the before and after periods.
The second test scenario consisted of the staged pedestrian standing in thecrosswalk and looking in the direction of the oncoming traffic. The staged pedestrianwas in full view of traffic but not in a travel lane.
15
For the third test scenario, the staged pedestrian stood in the crosswalk and took onestep out into the travel lane as if he were about to cross the street. The steppingmovement was timed to the presence of oncoming traffic so that drivers that chose toslow down had the time and distance to do so. Targeted vehicles were randomlyselected and were always lone vehicles or the first vehicle in a platoon. Vehiclespeeds were recorded when the staged pedestrian was looking or stepping fromboth sides of the roadway.
The speed study for the two Stillwater, Minnesota, sites was limited to recordingvehicle speeds at the actual crosswalk before and after the high-visibility crosswalkmarkings were installed. This was necessary because parking restrictions made itdifficult to collect advance speeds.
Pedestrian Profile Study
One of the objectives of the Pedestrian Profile study was to determine if pedestrianswould go out of their way (and how far) in order to use a marked crosswalk at anonsignalized intersection. Another objective was to identify and record safetymeasures pedestrians exhibited before and during roadway crossings.
It became clear during pilot testing that frequency of looking behavior was of interestonly if traffic was approaching. For example, if no vehicles were within sight in eitherdirection (where there were no visual obstructions to oncoming or turning vehiclesand sight distance was several blocks long), the pedestrian who looked 10 timesduring the crossing of 2 to 3 lanes was no more safe than a pedestrian who lookedonce in each direction.
This study incorporated the element of approaching traffic, once again, to give a betterunderstanding of the observed pedestrian's gait and travel path before and during theroadway crossing. By tracking particular pedestrians from the location where theyentered the study zone, origin and destination information could be recorded. Descriptive information such as age and gender were gathered for each pedestrianobserved. Crossing behavior was observed to find out how often the pedestrianschecked traffic (looking behavior) and the general speed (in three categories) of theirgait. The exact location of the actual roadway crossing was tracked, usingestablished site zones, in order to determine if marked crosswalks not only attractedbut also channeled pedestrian crossings.
Observations were repeated during the first half of the crossing and during thesecond half of crossing. For each pedestrian crossing, observations were also made
16
about the presence of traffic during the entire crossing. One team member recordedon audio tape all pedestrian data items; the other team member simultaneouslyrecorded on data forms vehicle proximity by lane. The following information wasobserved and recorded for each targeted pedestrian in a before and after study at theunmarked and marked crosswalk sites:
C Pedestrian AgeC Pedestrian GenderC Pedestrian Travel PathC Pedestrian Gait, Before Crossing and During Each LaneC Pedestrian Looking Behavior, At Curb and During Entire Crossing Recorded by
Lane of OccurrenceC Vehicle Proximity By Lane While Pedestrian is At Curb, and Crossing Each
LaneC Presence/Absence of Parked VehiclesC Unusual Driver Behaviors (honking, gesturing, etc.).
RESULTS AND DISCUSSION
The results of the various data collection procedures will be presented in this section. The section has been organized by the various measures of effectiveness (MOEs)that were collected. Thus, the discussion deviates somewhat from the order in whichthe experimental procedures were described in the previous section.
The following MOEs will be discussed:
C Vehicle VolumesC Available Gaps in TrafficC Vehicle SpeedsC Driver and Pedestrian BehaviorC Pedestrian Profile—Looking Behavior
Vehicle Volumes
The purpose of the vehicle volume study was to document if any changes occurredbetween the before and after periods. Any such changes could have made it difficultto attribute other changes in pedestrian and vehicle behavior solely to the installationof the crosswalk markings.
17
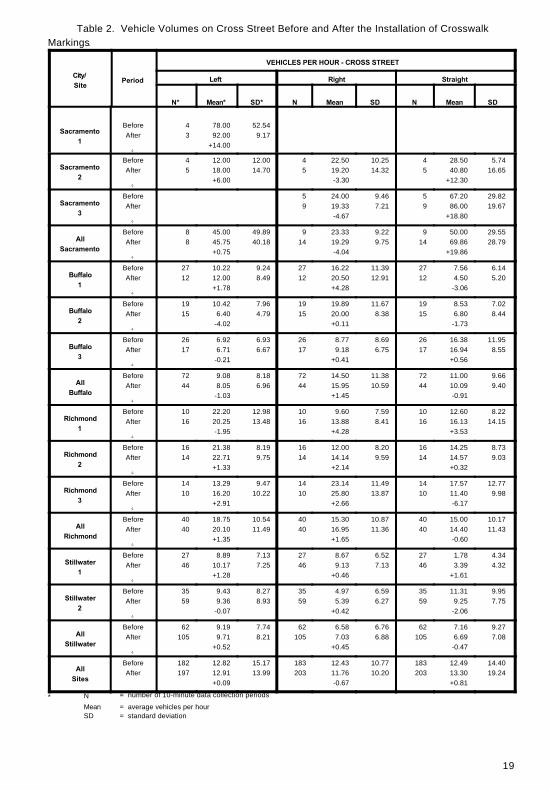
The vehicle volume data for the street being crossed are shown in Table 1. Thevehicle volume data for the cross streets are shown in Table 2. A three-way analysisof variance (period, city, and site within city) for each of the six vehicle volume counts(thru street left turn, thru street right turn, thru street straight, cross street left turn,cross street right turn, and cross street straight) was calculated. There were theexpected statistically significant city differences and site differences in all of theanalyses. The only statistically significant effect for period was an interaction betweenperiod and city. The straight thru vehicle volumes on the cross streets increased inthe after period in Sacramento but stayed approximately the same in the otherlocations, period, F_ (3,366 = 4.961, p = 0.002). As shown in Table 2, the straightcross street traffic volumes increased from 50 vehicles per hour to 70 vehicles perhour. It is not believed that this increase, although statistically significant, wassufficient to affect other behavioral changes that were observed. All other vehiclevolume counts remained essentially the same between the before and after periods.

18
Table 1. Vehicle Volumes on Thru Street Before and After the Installation of Crosswalk Markings.
City/
SitePeriod
VEHICLES PER HOUR - THRU STREET
Left Right Straight
N* Mean* SD* N Mean SD N Mean SD
Sacramento
1
Before
After
Î
4
3
48.00
66.00
+18.00
35.33
15.87
N/A 4
3
343.50
470.00
+126.50
155.64
121.39
Sacramento
2
Before
After
Î
4
5
18.00
27.60
+9.60
10.95
9.10
4
5
24.00
25.20
+1.20
18.97
14.32
4
5
82.50
72.00
-10.50
34.07
16.97
Sacramento
3
Before
After
Î
5
9
13.20
12.00
-1.20
10.73
9.49
5
9
9.60
11.33
+1.73
10.90
8.72
5
9
271.20
308.00
+36.80
170.89
135.20
All
Sacramento
Before
After
Î
13
17
25.38
26.12
+0.74
25.12
22.54
9
14
16.00
16.29
+0.29
15.87
12.55
13
17
235.38
267.18
+31.80
168.23
177.79
Buffalo
1
Before
After
Î
27
12
23.78
16.00
-7.78
19.86
9.69
27
12
18.67
8.50
-10.17
10.95
5.40
27
12
198.44
166.00
-32.44
53.77
48.29
Buffalo
2
Before
After
Î
19
15
16.42
14.40
-2.02
12.94
11.06
19
15
14.53
14.00
-0.53
10.83
11.49
19
15
210.95
196.40
-14.55
50.96
50.22
Buffalo
3
Before
After
Î
26
17
6.23
3.88
-2.35
5.49
4.21
26
17
9.92
7.76
-2.16
7.39
9.43
26
17
72.92
69.88
-3.04
26.92
21.42
All
Buffalo
Before
After
Î
72
44
15.50
10.77
-4.73
15.98
10.07
72
44
14.42
10.09
-4.33
10.35
9.58
72
44
156.42
139.23
-17.19
77.41
69.50
Richmond
1
Before
After
Î
10
16
6.00
5.25
-0.75
7.48
7.86
10
16
2.40
6.75
+4.35
3.10
6.15
10
16
813.00
787.13
-25.87
255.66
262.30
Richmond
2
Before
After
Î
16
14
12.75
12.00
-0.75
9.26
7.81
16
14
8.25
13.29
+5.04
8.45
9.75
16
14
780.38
867.86
+87.48
207.91
236.82
Richmond
3
Before
After
Î
14
10
24.00
16.80
-7.20
20.52
12.90
14
10
6.43
7.80
+1.37
6.85
2.90
14
10
818.14
858.00
+39.86
209.39
157.00
All
Richmond
Before
After
Î
40
40
15.00
10.50
-4.50
15.43
10.24
40
40
6.15
9.30
+3.15
7.12
7.56
40
40
801.75
833.10
+31.35
215.96
228.70
Stillwater
1
Before
After
Î
27
46
10.22
9.65
-0.57
8.12
10.84
27
46
8.89
12.91
+4.02
6.08
11.31
27
46
84.22
97.57
+13.35
19.93
28.18
Stillwater
2
Before
After
Î
35
59
7.37
5.90
-1.47
7.29
6.05
35
59
19.37
19.42
+0.05
13.26
11.65
35
59
88.46
88.07
-0.39
34.08
31.50
All
Stillwater
Before
After
Î
62
105
8.61
7.54
-1.07
7.73
8.65
62
105
14.81
16.57
+1.76
11.89
11.90
62
105
86.61
92.23
+5.62
28.65
30.32
All
Sites
Before
After
187
206
13.80
10.34
-3.46
15.08
11.98
183
203
12.82
13.71
+0.89
11.12
11.18
187
206
276.80
260.56
-16.24
302.01
309.09
* N = number of 10-minute data collection periods
Mean = average vehicles per hour
SD = standard deviation
19
Table 2. Vehicle Volumes on Cross Street Before and After the Installation of Crosswalk
Markings.
City/
SitePeriod
VEHICLES PER HOUR - CROSS STREET
Left Right Straight
N* Mean* SD* N Mean SD N Mean SD
Sacramento
1
Before
After
Î
4
3
78.00
92.00
+14.00
52.54
9.17
Sacramento
2
Before
After
Î
4
5
12.00
18.00
+6.00
12.00
14.70
4
5
22.50
19.20
-3.30
10.25
14.32
4
5
28.50
40.80
+12.30
5.74
16.65
Sacramento
3
Before
After
Î
5
9
24.00
19.33
-4.67
9.46
7.21
5
9
67.20
86.00
+18.80
29.82
19.67
All
Sacramento
Before
After
Î
8
8
45.00
45.75
+0.75
49.89
40.18
9
14
23.33
19.29
-4.04
9.22
9.75
9
14
50.00
69.86
+19.86
29.55
28.79
Buffalo
1
Before
After
Î
27
12
10.22
12.00
+1.78
9.24
8.49
27
12
16.22
20.50
+4.28
11.39
12.91
27
12
7.56
4.50
-3.06
6.14
5.20
Buffalo
2
Before
After
Î
19
15
10.42
6.40
-4.02
7.96
4.79
19
15
19.89
20.00
+0.11
11.67
8.38
19
15
8.53
6.80
-1.73
7.02
8.44
Buffalo
3
Before
After
Î
26
17
6.92
6.71
-0.21
6.93
6.67
26
17
8.77
9.18
+0.41
8.69
6.75
26
17
16.38
16.94
+0.56
11.95
8.55
All
Buffalo
Before
After
Î
72
44
9.08
8.05
-1.03
8.18
6.96
72
44
14.50
15.95
+1.45
11.38
10.59
72
44
11.00
10.09
-0.91
9.66
9.40
Richmond
1
Before
After
Î
10
16
22.20
20.25
-1.95
12.98
13.48
10
16
9.60
13.88
+4.28
7.59
8.41
10
16
12.60
16.13
+3.53
8.22
14.15
Richmond
2
Before
After
Î
16
14
21.38
22.71
+1.33
8.19
9.75
16
14
12.00
14.14
+2.14
8.20
9.59
16
14
14.25
14.57
+0.32
8.73
9.03
Richmond
3
Before
After
Î
14
10
13.29
16.20
+2.91
9.47
10.22
14
10
23.14
25.80
+2.66
11.49
13.87
14
10
17.57
11.40
-6.17
12.77
9.98
All
Richmond
Before
After
Î
40
40
18.75
20.10
+1.35
10.54
11.49
40
40
15.30
16.95
+1.65
10.87
11.36
40
40
15.00
14.40
-0.60
10.17
11.43
Stillwater
1
Before
After
Î
27
46
8.89
10.17
+1.28
7.13
7.25
27
46
8.67
9.13
+0.46
6.52
7.13
27
46
1.78
3.39
+1.61
4.34
4.32
Stillwater
2
Before
After
Î
35
59
9.43
9.36
-0.07
8.27
8.93
35
59
4.97
5.39
+0.42
6.59
6.27
35
59
11.31
9.25
-2.06
9.95
7.75
All
Stillwater
Before
After
Î
62
105
9.19
9.71
+0.52
7.74
8.21
62
105
6.58
7.03
+0.45
6.76
6.88
62
105
7.16
6.69
-0.47
9.27
7.08
All
Sites
Before
After
182
197
12.82
12.91
+0.09
15.17
13.99
183
203
12.43
11.76
-0.67
10.77
10.20
183
203
12.49
13.30
+0.81
14.40
19.24
* N = number of 10-minute data collection periods
Mean = average vehicles per hour
SD = standard deviation

20
With vehicle volumes of about 800 vehicles per hour, the three Richmond sites were,by far, the busiest roadways in the study. These high traffic volumes reduced theavailable pedestrian crossing opportunities.
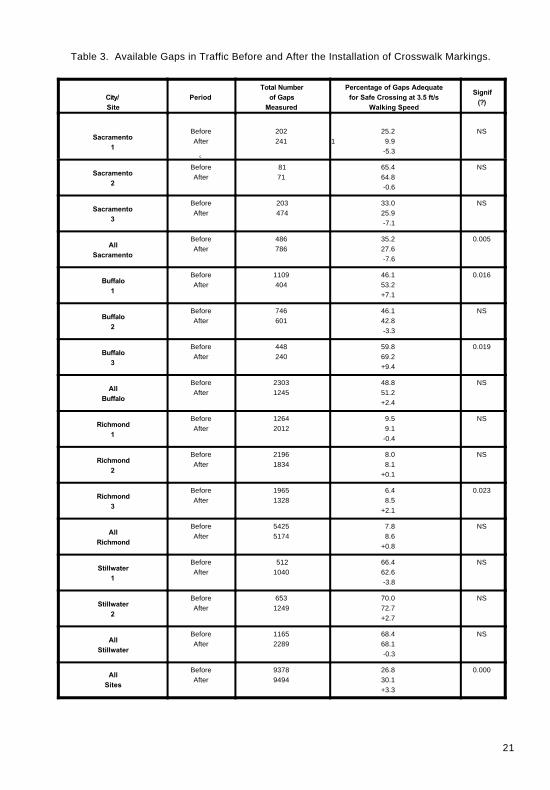
Available Gaps in Traffic
The purpose of the traffic gaps study (like the vehicle volume study) was to documentif any changes in traffic flow between the before and after periods could have beenresponsible for any of the other changes in either pedestrian or vehicle behavior thatwere observed in the other studies. It was hypothesized that there would be nochanges in available gaps between the before and after periods. It this were thecase, then we could more confidently conclude that observed changes in pedestrianbehavior were due to the installation of crosswalk markings and not due to changesin available gaps for crossing.
The available gaps in traffic before and after the installation of crosswalk markingsare shown in Table 3.
The percentage of gaps adequate for a safe pedestrian crossing before and aftercrosswalk markings were analyzed using chi-squares. A 2X2 contingency table ofperiod (before, after) by gap (adequate, inadequate) was completed for each site,
each city, and overall. Differences in each table were tested for significance using ÷2
corrected for continuity.
At the 11 sites where gap data were collected, 8 showed a nonsignificant ÷2 while 3
showed a significant ÷2. All three of the significant changes were due to increases inavailable gap. Seven of the eight nonsignificant differences involved reductions inavailable gap. Overall, across all sites, there was a significant (3.3 percent) increasein the percentage of gaps adequate for safe crossing at a 3.5 ft/s walking speed. Although statistically significant, this change is not believed to be large enough tohave affected any of the changes observed in pedestrian behavior. With the exceptionof the sites in Richmond, all of the study locations had relatively high percentages ofadequate gaps. At all three of the Richmond sites, less than 10 percent of theavailable gaps were adequate for a safe crossing at 3.5 ft/s. As was shown in Table1, the Richmond sites also had much higher vehicle volumes. It is not known whateffect the high traffic volumes and low percentage of adequate gaps may have had onother driver and pedestrian behavior observed in Richmond (i.e., approach andcrosswalk speeds).
21
Table 3. Available Gaps in Traffic Before and After the Installation of Crosswalk Markings.
City/
Site
Period
Total Number
of Gaps
Measured
Percentage of Gaps Adequate
for Safe Crossing at 3.5 ft/s
Walking Speed
Signif
(?)
Sacramento
1
Before
After
Î
202
241
25.2
1 9.9
-5.3
NS
Sacramento
2
Before
After
81
71
65.4
64.8
-0.6
NS
Sacramento
3
Before
After
203
474
33.0
25.9
-7.1
NS
All
Sacramento
Before
After
486
786
35.2
27.6
-7.6
0.005
Buffalo
1
Before
After
1109
404
46.1
53.2
+7.1
0.016
Buffalo
2
Before
After
746
601
46.1
42.8
-3.3
NS
Buffalo
3
Before
After
448
240
59.8
69.2
+9.4
0.019
All
Buffalo
Before
After
2303
1245
48.8
51.2
+2.4
NS
Richmond
1
Before
After
1264
2012
9.5
9.1
-0.4
NS
Richmond
2
Before
After
2196
1834
8.0
8.1
+0.1
NS
Richmond
3
Before
After
1965
1328
6.4
8.5
+2.1
0.023
All
Richmond
Before
After
5425
5174
7.8
8.6
+0.8
NS
Stillwater
1
Before
After
512
1040
66.4
62.6
-3.8
NS
Stillwater
2
Before
After
653
1249
70.0
72.7
+2.7
NS
All
Stillwater
Before
After
1165
2289
68.4
68.1
-0.3
NS
All
Sites
Before
After
9378
9494
26.8
30.1
+3.3
0.000

22
Vehicle Speeds/Staged Pedestrian Study
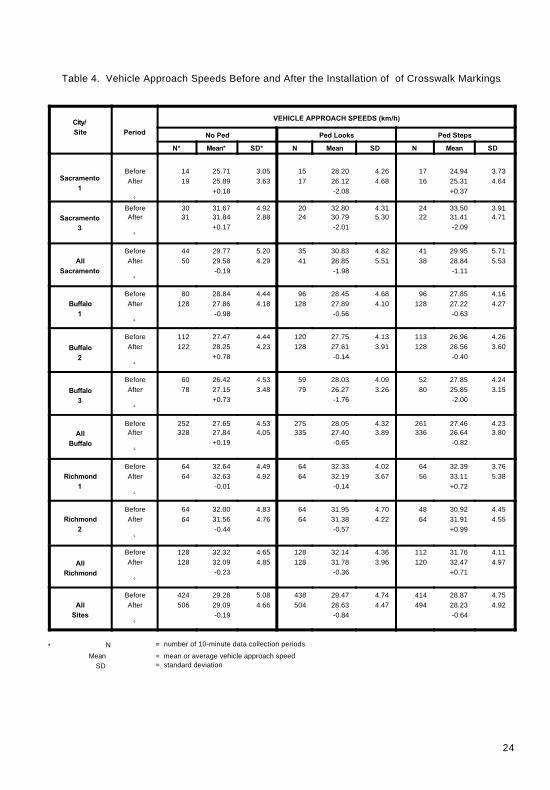
The vehicle speed and staged pedestrian study involved a comparison of vehiclespeeds before and after crosswalk markings were installed. The purpose of thestudy was to determine if crosswalk markings had an effect on vehicle speeds. Vehicle speeds were measured at two different locations under each of threeseparate stated pedestrian conditions. Vehicle speeds were measured as thevehicle approached the crosswalk (approach speed) and when the vehicle arrived atthe crosswalk (crosswalk speed). The three separate pedestrian conditionsincluded: (1) no pedestrian present (no ped); (2) a staged pedestrian standing in thecrosswalk looking in the direction of oncoming traffic (ped looks); and (3) a stagedpedestrian in the crosswalk making a stepping motion as if he/she were about tostep into the roadway (ped steps).
Vehicle approach speeds for the three staged pedestrian conditions are shown inTable 4. A three-way analysis of variance (period, city, site within city) of vehicleapproach speed was calculated for each of the three staged pedestrian conditions(no ped, ped looks, and ped steps). For the no ped condition, there was nosignificant difference between the before (no crosswalk markings) and the after(crosswalk markings installed) conditions. There were, not surprisingly, significantdifferences between cities, F_ (2,916) = 95.119, p = 0.000 and between sites, F_(4,916) = 13.156, p = 0.000.
For the ped looks staged condition, there were significant differences between thebefore and after periods, F_ (1,928) = 8.163, p = 0.004. The approach speeds weresignificantly lower in the after (markings installed) period. There were alsostatistically significant differences between cities, F_ (2,928) = 94.720, p = 0.000, andbetween sites, F_ (4,928) = 7.366, p = 0.000.
The ped steps condition also produced statistically significant differences betweencities, F_ (2,894) = 118.059, p = 0.000 and between sites, F_ (4,894) = 17.528, p =0.000. In addition, the ped steps condition resulted in a statistically significant periodby city interaction, F_ (2,894) = 4.117, p = 0.017. The approach speeds in bothSacramento and Buffalo decreased significantly while the approach speeds inRichmond increased significantly between the before and after periods.
The analysis of vehicle approach speeds shows that there were differences betweenthe various study areas (cities) and study locations (sites) within the study areas. This is not unexpected since travel speeds tend to vary by location and no attemptwas made to match the experimental sites by travel speed. There was also nodifference in approach speed when no pedestrian was present. This was alsoexpected since there is no need for a driver to slow down when approaching a

23
crosswalk unless a pedestrian is present. It is also important to remember that theabsolute amount of the speed reduction is not critical. The purpose of the crosswalkmarking is to produce a change in driver awareness. The markings should be tellingthe driver that pedestrians may be present and if they are present, they may cross theroad at that location. Basically, the
24
Table 4. Vehicle Approach Speeds Before and After the Installation of of Crosswalk Markings.
City/
Site Period
VEHICLE APPROACH SPEEDS (km/h)
No Ped Ped Looks Ped Steps
N* Mean* SD* N Mean SD N Mean SD
Sacramento
1
Before
After
Î
14
19
25.71
25.89
+0.18
3.05
3.63
15
17
28.20
26.12
-2.08
4.26
4.68
17
16
24.94
25.31
+0.37
3.73
4.64
Sacramento
3
Before
After
Î
30
31
31.67
31.84
+0.17
4.92
2.88
20
24
32.80
30.79
-2.01
4.31
5.30
24
22
33.50
31.41
-2.09
3.91
4.71
All
Sacramento
Before
After
Î
44
50
29.77
29.58
-0.19
5.20
4.29
35
41
30.83
28.85
-1.98
4.82
5.51
41
38
29.95
28.84
-1.11
5.71
5.53
Buffalo
1
Before
After
Î
80
128
28.84
27.86
-0.98
4.44
4.18
96
128
28.45
27.89
-0.56
4.68
4.10
96
128
27.85
27.22
-0.63
4.16
4.27
Buffalo
2
Before
After
Î
112
122
27.47
28.25
+0.78
4.44
4.23
120
128
27.75
27.61
-0.14
4.13
3.91
113
128
26.96
26.56
-0.40
4.26
3.60
Buffalo
3
Before
After
Î
60
78
26.42
27.15
+0.73
4.53
3.48
59
79
28.03
26.27
-1.76
4.09
3.26
52
80
27.85
25.85
-2.00
4.24
3.15
All
Buffalo
Before
After
Î
252
328
27.65
27.84
+0.19
4.53
4.05
275
335
28.05
27.40
-0.65
4.32
3.89
261
336
27.46
26.64
-0.82
4.23
3.80
Richmond
1
Before
After
Î
64
64
32.64
32.63
-0.01
4.49
4.92
64
64
32.33
32.19
-0.14
4.02
3.67
64
56
32.39
33.11
+0.72
3.76
5.38
Richmond
2
Before
After
Î
64
64
32.00
31.56
-0.44
4.83
4.76
64
64
31.95
31.38
-0.57
4.70
4.22
48
64
30.92
31.91
+0.99
4.45
4.55
All
Richmond
Before
After
Î
128
128
32.32
32.09
-0.23
4.65
4.85
128
128
32.14
31.78
-0.36
4.36
3.96
112
120
31.76
32.47
+0.71
4.11
4.97
All
Sites
Before
After
Î
424
506
29.28
29.09
-0.19
5.08
4.66
438
504
29.47
28.63
-0.84
4.74
4.47
414
494
28.87
28.23
-0.64
4.75
4.92
* N = number of 10-minute data collection periods
Mean = mean or average vehicle approach speed
SD = standard deviation
25
desired driver response is to a marked crosswalk is: “There may be a pedestrianhere; I need to be careful” or “If I see pedestrian here, they may cross; I need to becareful.” It is not essential that the driver slow down. Unfortunately, there is no way toobserve or measure driver awareness, so vehicle speed is used as a kind ofsurrogate measure.
An examination of the approach speed before/after differences in the no ped conditionin Table 4 shows very small differences, less than 1 mi/h (1.6 km/h) at all sites. In theped looks condition it could be hypothesized that the presence of crosswalk markingswould cause approaching drivers to be more careful (e.g., slow down). In fact, speedreductions were found at all locations. The magnitude of the speed reductions variedfrom 2.08 mi/h (3.33 km/h) at Site 1 in Sacramento to 0.14 mi/h (0.22 km/h) at Site 2 inBuffalo and Site 1 in Richmond. The overall speed reduction across all sites was0.84 mi/h (1.34 km/h). In the ped steps condition we could also hypothesize that thepresence of crosswalk markings would also cause approaching drivers to slowdown. This was the case in both Sacramento and Buffalo. The speed reductionsranged from 2.09 mi/h (3.34 km/h) at Site 3 in Sacramento to 0.37 mi/h (0.59 km/h) atSite 1 in Sacramento. However, the approach speeds increased at both of theRichmond sites. Overall, across all sites in all three cities there was a decrease inapproach speed of 0.64 mi/h (1.02 km/h). In general, it appears that crosswalkmarkings have a beneficial effect on the speeds of drivers approaching a pedestrianin a crosswalk.
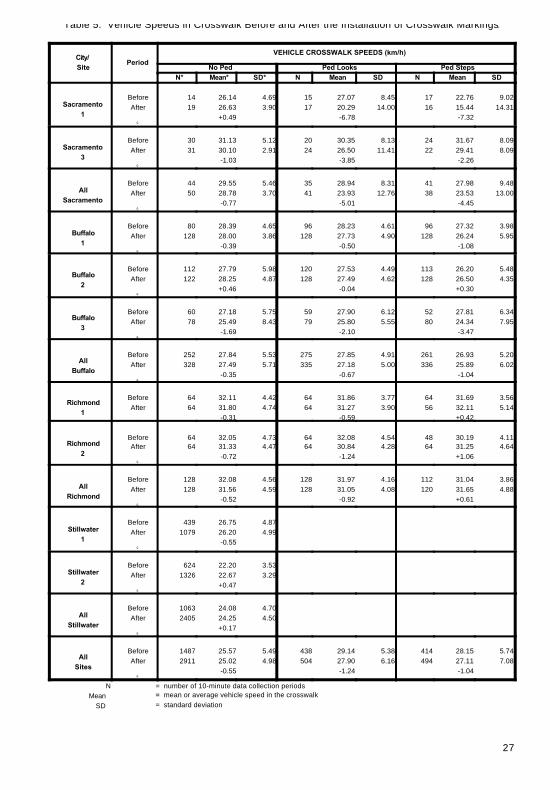
Vehicle speeds in the crosswalk for the three staged pedestrian conditions areshown in Table 5.
A three-way analysis of variance (period, city, site within city) of crosswalk speed wasplanned for each of the three conditions (no ped, ped looks, ped steps). One of theassumptions of this statistical test is homogeneity of variance, especially importantwhen the number of observations in each group varies greatly. This assumption waschecked using Levene’s Test, and in each condition this assumption was not met. Since the number of observations per site within each city was similar, each city wasanalyzed separately. Therefore, a two-way analysis of variance (period, site) wasperformed for each city for each condition.
For the no ped condition, the crosswalk vehicle speeds showed the same patterns asthe approach speed. In Sacramento there were statistically significant differencesbetween sites F_ (1,90) = 21.552, p = 0.000. In Buffalo there were statisticallysignificant differences between sites F_ (2, 574) = 5.208, p = 0.006. In Richmond therewere no significant differences. In Stillwater there was a statistically significantdifference between sites, F_ (1, 3464) = 685.933, p = 0.000 as well as a period by siteinteraction, F_ (1, 3464) = 10.855, p = 0.001. This interaction resulted from an increase

26
in speed at Site 2 and a decrease in speed at Site 1. Overall, we would not expectthat crosswalk markings, in the absence of a pedestrian, would produce a change invehicle speeds, and only one was found.
27
Table 5. Vehicle Speeds in Crosswalk Before and After the Installation of Crosswalk Markings.
City/
SitePeriod
VEHICLE CROSSWALK SPEEDS (km/h)
No Ped Ped Looks Ped Steps
N* Mean* SD* N Mean SD N Mean SD
Sacramento
1
Before
After
Î
14
19
26.14
26.63
+0.49
4.69
3.90
15
17
27.07
20.29
-6.78
8.45
14.00
17
16
22.76
15.44
-7.32
9.02
14.31
Sacramento
3
Before
After
Î
30
31
31.13
30.10
-1.03
5.12
2.91
20
24
30.35
26.50
-3.85
8.13
11.41
24
22
31.67
29.41
-2.26
8.09
8.09
All
Sacramento
Before
After
Î
44
50
29.55
28.78
-0.77
5.46
3.70
35
41
28.94
23.93
-5.01
8.31
12.76
41
38
27.98
23.53
-4.45
9.48
13.00
Buffalo
1
Before
After
Î
80
128
28.39
28.00
-0.39
4.65
3.86
96
128
28.23
27.73
-0.50
4.61
4.90
96
128
27.32
26.24
-1.08
3.98
5.95
Buffalo
2
Before
After
Î
112
122
27.79
28.25
+0.46
5.98
4.87
120
128
27.53
27.49
-0.04
4.49
4.62
113
128
26.20
26.50
+0.30
5.48
4.35
Buffalo
3
Before
After
Î
60
78
27.18
25.49
-1.69
5.75
8.43
59
79
27.90
25.80
-2.10
6.12
5.55
52
80
27.81
24.34
-3.47
6.34
7.95
All
Buffalo
Before
After
Î
252
328
27.84
27.49
-0.35
5.53
5.71
275
335
27.85
27.18
-0.67
4.91
5.00
261
336
26.93
25.89
-1.04
5.20
6.02
Richmond
1
Before
After
Î
64
64
32.11
31.80
-0.31
4.42
4.74
64
64
31.86
31.27
-0.59
3.77
3.90
64
56
31.69
32.11
+0.42
3.56
5.14
Richmond
2
Before
After
Î
64
64
32.05
31.33
-0.72
4.73
4.47
64
64
32.08
30.84
-1.24
4.54
4.28
48
64
30.19
31.25
+1.06
4.11
4.64
All
Richmond
Before
After
Î
128
128
32.08
31.56
-0.52
4.56
4.59
128
128
31.97
31.05
-0.92
4.16
4.08
112
120
31.04
31.65
+0.61
3.86
4.88
Stillwater
1
Before
After
Î
439
1079
26.75
26.20
-0.55
4.87
4.99
Stillwater
2
Before
After
Î
624
1326
22.20
22.67
+0.47
3.53
3.29
All
Stillwater
Before
After
Î
1063
2405
24.08
24.25
+0.17
4.70
4.50
All
Sites
Before
After
Î
1487
2911
25.57
25.02
-0.55
5.49
4.98
438
504
29.14
27.90
-1.24
5.38
6.16
414
494
28.15
27.11
-1.04
5.74
7.08
N = number of 10-minute data collection periods
Mean = mean or average vehicle speed in the crosswalk
SD = standard deviation
28
For the ped looks condition, it was hypothesized that crosswalk markings wouldresult in a speed reduction, and that was the case in two of the three study cities. InSacramento there was a significant difference between periods, F_ (1,72) = 4.464,p = 0.038. In Buffalo there was also a significant difference between periods,F_ (1,604) = 4.453, p = 0.035. In both cases speeds were slower during the afterperiod. In Richmond speeds were also lower, but the difference was not statisticallysignificant.
For the ped steps condition, it was hypothesized that the crosswalk markings wouldresult in a speed reduction in response to the staged pedestrian stepping into theroadway. This was not usually the case. In Sacramento there was a statisticallysignificant difference between sites, F_ (1,75) = 25.945, p = 0.000. In Buffalo there wasa statistically significant difference between periods, F_ (1,591) = 8.534, p = 0.004 anda period by site interaction, F_ (2,591) = 4.608, p = 0.010. The interaction was due todecreased speeds at Sites 1 and 3 and increased speeds at Site 2. In Richmondthere was a statistically significant difference between sites, F_ (1,228) = 4.114, p =0.044. Overall, speeds decreased at four of the sites and increased at three of thesites, but only Buffalo had a significant period effect.
Driver and Pedestrian Behavior
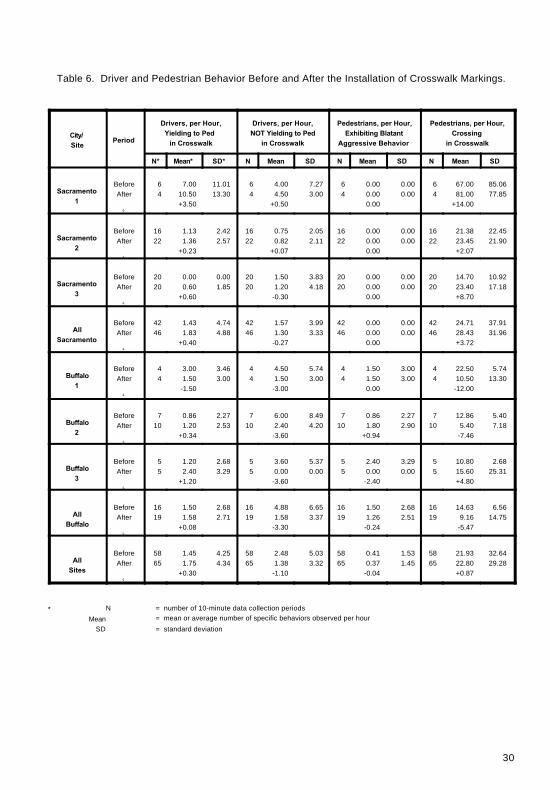
The purpose of the driver and pedestrian behavior study was to document changes inspecific driver and pedestrian behaviors that could be attributed to the installation ofcrosswalk markings at the study sites. The specific driver and pedestrian behaviorsobserved were: (1) drivers yielding to pedestrians; (2) drivers not yielding topedestrians; (3) pedestrian exhibiting aggressive behavior (behavior that caused thedriver to slow or stop); and (4) number of pedestrians crossing in the crosswalk(pedestrians per hour). The results of the study are shown in Table 6.
A three-way analysis of variance (period, city, site within city) was calculated for eachof the four specific behaviors observed. There were statistically significant citydifferences in two of the analyses and site differences in two of the analyses. Therewere no statistically significant differences between the before and after periods inany of the four behaviors observed. There were also no significant interactions,indicating that period, city and site within city did not affect the behaviors observed. Apparently, crosswalk markings do not have any effect on the yielding behavior ofdrivers, the blatant aggressive behavior of pedestrians, or the total number ofpedestrians crossing.

29
Additional data were collected on the crossing location of pedestrians who wereeither alone or in a group. The percentage of the pedestrians, either alone or in agroup, who were crossing in the crosswalk is shown in Table 7.
30
Table 6. Driver and Pedestrian Behavior Before and After the Installation of Crosswalk Markings.
City/
SitePeriod
Drivers, per Hour,
Yielding to Ped
in Crosswalk
Drivers, per Hour,
NOT Yielding to Ped
in Crosswalk
Pedestrians, per Hour,
Exhibiting Blatant
Aggressive Behavior
Pedestrians, per Hour,
Crossing
in Crosswalk
N* Mean* SD* N Mean SD N Mean SD N Mean SD
Sacramento
1
Before
After
Î
6
4
7.00
10.50
+3.50
11.01
13.30
6
4
4.00
4.50
+0.50
7.27
3.00
6
4
0.00
0.00
0.00
0.00
0.00
6
4
67.00
81.00
+14.00
85.06
77.85
Sacramento
2
Before
After
Î
16
22
1.13
1.36
+0.23
2.42
2.57
16
22
0.75
0.82
+0.07
2.05
2.11
16
22
0.00
0.00
0.00
0.00
0.00
16
22
21.38
23.45
+2.07
22.45
21.90
Sacramento
3
Before
After
Î
20
20
0.00
0.60
+0.60
0.00
1.85
20
20
1.50
1.20
-0.30
3.83
4.18
20
20
0.00
0.00
0.00
0.00
0.00
20
20
14.70
23.40
+8.70
10.92
17.18
All
Sacramento
Before
After
Î
42
46
1.43
1.83
+0.40
4.74
4.88
42
46
1.57
1.30
-0.27
3.99
3.33
42
46
0.00
0.00
0.00
0.00
0.00
42
46
24.71
28.43
+3.72
37.91
31.96
Buffalo
1
Before
After
Î
4
4
3.00
1.50
-1.50
3.46
3.00
4
4
4.50
1.50
-3.00
5.74
3.00
4
4
1.50
1.50
0.00
3.00
3.00
4
4
22.50
10.50
-12.00
5.74
13.30
Buffalo
2
Before
After
Î
7
10
0.86
1.20
+0.34
2.27
2.53
7
10
6.00
2.40
-3.60
8.49
4.20
7
10
0.86
1.80
+0.94
2.27
2.90
7
10
12.86
5.40
-7.46
5.40
7.18
Buffalo
3
Before
After
Î
5
5
1.20
2.40
+1.20
2.68
3.29
5
5
3.60
0.00
-3.60
5.37
0.00
5
5
2.40
0.00
-2.40
3.29
0.00
5
5
10.80
15.60
+4.80
2.68
25.31
All
Buffalo
Before
After
Î
16
19
1.50
1.58
+0.08
2.68
2.71
16
19
4.88
1.58
-3.30
6.65
3.37
16
19
1.50
1.26
-0.24
2.68
2.51
16
19
14.63
9.16
-5.47
6.56
14.75
All
Sites
Before
After
Î
58
65
1.45
1.75
+0.30
4.25
4.34
58
65
2.48
1.38
-1.10
5.03
3.32
58
65
0.41
0.37
-0.04
1.53
1.45
58
65
21.93
22.80
+0.87
32.64
29.28
* N = number of 10-minute data collection periods
Mean = mean or average number of specific behaviors observed per hour
SD = standard deviation
31
Table 7. Pedestrian Crossing Location—Peds In Crosswalk
Before and After the Installation of Crosswalk Markings.
City/Site Period
PERCENTAGE OF PEDESTRIANS – IN CROSSWALK
Alone In Groups Total
N* Mean* SD* N Mean SD N Mean SD
Sacramento1
BeforeAfter
Î
4 4
49.6865.73
+16.05
18.3515.16
4 4
72.9380.30+7.37
14.6415.51
4 4
64.2574.93
+10.68
16.688.00
Sacramento2
BeforeAfter
Î
4 6
37.0342.92+5.89
6.4712.64
4 6
51.4860.03+8.55
20.8522.36
4 6
41.3349.32+7.99
6.6610.73
Sacramento3
BeforeAfter
Î
6 7
44.0245.60+1.58
17.6818.60
46
62.5063.48+0.98
47.8736.11
6 7
47.2050.91+3.71
19.8822.12
AllSacramento
BeforeAfter
Î
1417
43.6449.39+5.75
15.2417.65
1216
62.3066.39+4.09
29.7626.85
1417
50.3956.00+5.61
17.7618.68
Buffalo1
BeforeAfter
Î
1918
57.3454.63-2.71
38.3541.93
1215
80.80100.00+19.20
32.080.00
1920
62.0376.84
+14.81
36.8127.30
Buffalo2
BeforeAfter
Î
2121
59.1870.64
+11.46
27.1923.58
1522
60.8097.73
+36.93
38.3210.66
2124
60.8884.06
+23.18
23.9117.37
Buffalo3
BeforeAfter
Î
1813
78.3391.02
+12.69
30.1122.18
1313
92.3181.54
-10.77
27.7437.83
1919
86.8183.33-3.48
19.9030.94
AllBuffalo
BeforeAfter
Î
5852
64.5270.19+5.67
32.8933.41
4050
77.0494.20
+17.16
35.1821.39
5963
69.6081.55
+11.95
29.7325.08
Richmond1
BeforeAfter
Î
1720
11.8520.42+8.57
22.1427.38
9 4
28.3825.00-3.38
42.7150.00
1721
13.8120.08+6.27
18.9228.34
Richmond2
BeforeAfter
Î
2727
19.4226.64+7.22
25.4027.59
11 9
41.8227.11
-14.71
44.0033.31
2827
21.7631.00+9.24
26.4927.69
Richmond3
BeforeAfter
Î
4446
31.7148.76
+17.05
28.6129.61
2517
35.5744.51+8.94
41.6345.17
4447
32.2346.79
+14.56
26.8829.91
AllRichmond
BeforeAfter
Î
8893
24.1136.24
+12.13
27.4430.96
4530
35.6636.69+1.03
41.6842.11
8995
25.4236.40
+10.98
26.2130.70
Stillwater1
BeforeAfter
Î
26 45
14.2514.61+0.36
23.4221.68
7 12
6.1324.31
+18.18
16.2234.36
26 45
14.6913.93-0.76
23.7421.63
Stillwater2
BeforeAfter
Î
33 59
48.6750.22+1.55
25.4319.74
1837
49.1256.58+7.46
43.1845.36
33 59
50.7051.92+1.22
25.7317.70
AllStillwater
BeforeAfter
Î
59104
33.5034.81+1.31
29.8427.10
2549
37.0848.68
+11.60
42.1344.83
59104
34.8335.48+0.65
30.5527.10
AllSites
BeforeAfter
Î
219266
38.5943.16+4.57
33.2632.28
122145
52.1463.85
+11.71
42.7342.55
221279
41.3147.45+6.14
33.2533.38
* N = number of 10-minute data collection periods
Mean = mean or average percentage of peds observed in crosswalk
SD = standard deviation

32
A three-way analysis of variance (period, city, site within city) of the percentage ofpedestrians crossing in the crosswalk was performed for three different categories ofpedestrians: pedestrians alone, pedestrians in groups, and total pedestrians. Preliminary checks on the data indicated that the assumption of homogeneity ofvariance was not met. Analysis of variance is relatively robust with respect todepartures from homogeneity of variance; however, when the number of observationsin each cell varies greatly, there is possibility of bias in the results. Since the numberof observations per site within each city were similar, each city was analyzedseparately. The final analysis was a two-way analysis of variance (period, site) foreach city for each category of pedestrians (i.e., single pedestrians, pedestrians ingroups and all pedestrians combined).
The data showing the percentage of either single pedestrians or pedestrians ingroups that completed all or part of their crossing within the unmarked (before) ormarked (after) crosswalk is shown in Table 7. The same size crosswalk was used inboth the before and after observations.
Single Pedestrians
Although there was an increase in crosswalk usage at all three Sacramento sites,there were no statistically significant differences. One of the three Buffalo sitesshowed a small (2.7 percent) decrease in crosswalk usage while the other twoBuffalo sites had 11.46 percent and 12.69 percent increases. Although there was astatistically significant difference between sites, F (2,104) = 7.075, p = 0.001, thebefore/after differences were not statistically significant.
All three Richmond sites showed before/after increases in crosswalk usage by singlepedestrians. They ranged from a 7.22 percent to a 17.05 percent increase in thenumber of pedestrians crossing alone in the crosswalk. In Richmond there was astatistically significant difference between sites, F (2,175) = 12.545, p = 0.001 and astatistically significant difference between periods, F (1,175) = 6.227, p = 0.014. Thepercentage of single pedestrians who were in the crosswalk increased after thecrosswalks were marked. In Stillwater the only significant difference was betweensites, F (1,159) = 93.007, p = 0.000.
33
Pedestrians Crossing in Groups
The data for pedestrians observed who were with at least one other pedestrian arealso shown in Table 7. There were no significant differences in Sacramento orRichmond. Buffalo had a statistically significant period by site interaction, F (2,84 =5.940, p = 0.004. At Sites 1 and 2 the percentages of pedestrians in groups who werein the crosswalk increased from the before to after periods, while at Site 3 thepercentage decreased. Stillwater had only a significant difference between sites, F(1,70) = 10.672, p = 0.002. It appears that the marking of crosswalks has less effecton the crossing location of pedestrians traveling in groups.
All Pedestrians
The data for all pedestrians (single pedestrian plus those in groups) are shown inTable 7. Although all three Sacramento sites had an increase in crosswalk usage,the only statistically significant difference was between sites, F (2,25) = 5.578, p =0.010. Buffalo also had a significant difference between sites F (2,116) = 3.801, p =0.025 but more interestingly had a statistically significant difference between periods,F (1,116) = 5.720, p = 0.018. The percentage of total pedestrians in the crosswalkincreased from before to after. Richmond had effects comparable to those found inBuffalo. There was a statistically significant difference between sites, F (2,178) =10.166, p = 0.000, as well as a statistically significant difference between periods, F(1,178) = 5.427, p = 0.021. The percentage of total pedestrians in the crosswalkincreased after the markings were installed. The total pedestrian data in Stillwater,like the alone and group data, showed only a significant difference between sites, F(1,159) = 108.980, p = 0.000.
Pedestrian Profile—Looking Behavior
The pedestrian profile study involved observing the looking behavior of pedestriansboth in the crosswalk and not in the crosswalk. Simultaneously, a second observernoted the presence of an approaching vehicle or vehicles. Because of the relativelysmall sample size in each of the four study locations, it was not possible to do ananalysis of each location separately. This data set was aggregated across the fourcities for analysis. The pedestrian profile looking behavior is presented in Table 8.
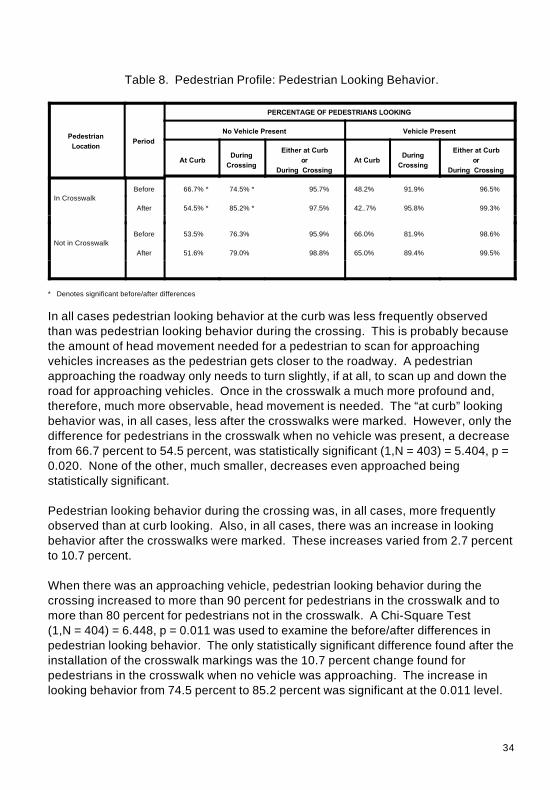
34
Table 8. Pedestrian Profile: Pedestrian Looking Behavior.
Pedestrian
LocationPeriod
PERCENTAGE OF PEDESTRIANS LOOKING
No Vehicle Present Vehicle Present
At CurbDuring
Crossing
Either at Curb
or
During Crossing
At CurbDuring
Crossing
Either at Curb
or
During Crossing
In Crosswalk
Before 66.7% * 74.5% * 95.7% 48.2% 91.9% 96.5%
After 54.5% * 85.2% * 97.5% 42..7% 95.8% 99.3%
Not in Crosswalk
Before 53.5% 76.3% 95.9% 66.0% 81.9% 98.6%
After 51.6% 79.0% 98.8% 65.0% 89.4% 99.5%
* Denotes significant before/after differences
In all cases pedestrian looking behavior at the curb was less frequently observedthan was pedestrian looking behavior during the crossing. This is probably becausethe amount of head movement needed for a pedestrian to scan for approachingvehicles increases as the pedestrian gets closer to the roadway. A pedestrianapproaching the roadway only needs to turn slightly, if at all, to scan up and down theroad for approaching vehicles. Once in the crosswalk a much more profound and,therefore, much more observable, head movement is needed. The “at curb” lookingbehavior was, in all cases, less after the crosswalks were marked. However, only thedifference for pedestrians in the crosswalk when no vehicle was present, a decreasefrom 66.7 percent to 54.5 percent, was statistically significant (1,N = 403) = 5.404, p =0.020. None of the other, much smaller, decreases even approached beingstatistically significant.
Pedestrian looking behavior during the crossing was, in all cases, more frequentlyobserved than at curb looking. Also, in all cases, there was an increase in lookingbehavior after the crosswalks were marked. These increases varied from 2.7 percentto 10.7 percent.
When there was an approaching vehicle, pedestrian looking behavior during thecrossing increased to more than 90 percent for pedestrians in the crosswalk and tomore than 80 percent for pedestrians not in the crosswalk. A Chi-Square Test (1,N = 404) = 6.448, p = 0.011 was used to examine the before/after differences inpedestrian looking behavior. The only statistically significant difference found after theinstallation of the crosswalk markings was the 10.7 percent change found forpedestrians in the crosswalk when no vehicle was approaching. The increase inlooking behavior from 74.5 percent to 85.2 percent was significant at the 0.011 level.
35
The third column in the table shows the percentage of pedestrians who wereobserved looking either at the curb or during the crossing. Virtually all of thepedestrians (at least 95 percent in all situations) were seen to look either while at thecurb or during the crossing. Although looking behavior was more frequent in allcases after the crosswalks were marked, the increases were not significant. Thereappears to be absolutely no evidence that the installation of crosswalk markingscauses pedestrians to be less vigilant during their crossing; in fact, the installation ofmarkings resulted in no significant change in pedestrian looking behavior.
SUMMARY AND CONCLUSIONS
A field study examined the effect of crosswalk markings on driver and pedestrianbehavior at 11 unsignalized intersections in four different cities. A before/afterexperimental design was used to evaluate the effect of crosswalk markings. Datawere collected on vehicle and pedestrian volumes, available crossing gaps, vehiclespeeds, driver behavior, and pedestrian behavior.
Table 9 contains a tabular summary of the primary research results. The first columnin the table lists the six hypotheses that were addressed by the experimental effort. The hypotheses represent both desirable and undesirable effects that might beassociated with the installation of crosswalk markings. The second column lists thedependent variables or MOEs that were collected to prove each of the hypotheses. The last column summarizes the conclusions that were presented in the previoussection. In general, crosswalk markings at unsignalized intersections appear to haveseveral positive effects and no observed negative effects. Specifically, drivers appearto be aware that pedestrians are in a marked crosswalk and drive slightly slower. Crosswalks also have the positive benefit of channeling pedestrians to theintersection. Also, there appears to be no evidence to support the contention thatpedestrians feel protected in marked crosswalks and act more carelessly. Inconclusion, it appears that marking pedestrian crosswalks at relatively narrow, low-speed, unsignalized intersections is a desirable practice.
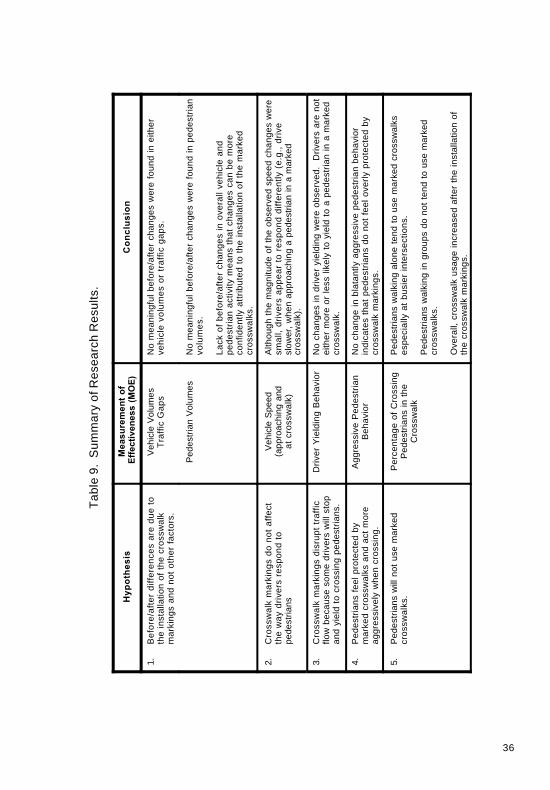
36
Ta
ble
9. S
um
ma
ry o
f R
ese
arc
h R
esu
lts.
Hy
po
the
sis
Me
as
ure
me
nt
of
Eff
ec
tiv
en
es
s (
MO
E)
Co
nc
lus
ion
1.
Be
fore
/aft
er
dif
fere
nce
s a
re d
ue
to
the
in
sta
llatio
n o
f th
e c
rossw
alk
ma
rkin
gs a
nd
no
t o
the
r fa
cto
rs.
Ve
hic
le V
olu
me
sT
raff
ic G
ap
sN
o m
ea
nin
gfu
l b
efo
re/a
fte
r ch
an
ge
s w
ere
fo
un
d i
n e
ith
er
ve
hic
le v
olu
me
s o
r tr
aff
ic g
ap
s.
Pe
de
str
ian
Vo
lum
es
No
me
an
ing
ful
be
fore
/aft
er
ch
an
ge
s w
ere
fo
un
d i
n p
ed
estr
ian
vo
lum
es.
La
ck o
f b
efo
re/a
fte
r ch
an
ge
s i
n o
ve
rall
ve
hic
le a
nd
pe
de
str
ian
activity m
ea
ns t
ha
t ch
an
ge
s c
an
be
mo
reco
nfid
en
tly a
ttri
bu
ted
to
th
e i
nsta
llatio
n o
f th
e m
ark
ed
cro
ssw
alk
s.
2.
Cro
ssw
alk
ma
rkin
gs d
o n
ot
aff
ect
the
wa
y d
rive
rs r
esp
on
d t
op
ed
estr
ian
s
Ve
hic
le S
pe
ed
(ap
pro
ach
ing
an
da
t cro
ssw
alk
)
Alth
ou
gh
th
e m
ag
nitu
de
of
the
ob
se
rve
d s
pe
ed
ch
an
ge
s w
ere
sm
all,
dri
ve
rs a
pp
ea
r to
re
sp
on
d d
iffe
ren
tly (
e.g
., d
rive
slo
we
r, w
he
n a
pp
roa
ch
ing
a p
ed
estr
ian
in
a m
ark
ed
cro
ssw
alk
).
3.
Cro
ssw
alk
ma
rkin
gs d
isru
pt
tra
ffic
flo
w b
eca
use
so
me
dri
ve
rs w
ill s
top
an
d y
ield
to
cro
ssin
g p
ed
estr
ian
s.
Dri
ve
r Y
ield
ing
Be
ha
vio
rN
o c
ha
ng
es i
n d
rive
r yie
ldin
g w
ere
ob
se
rve
d.
Dri
ve
rs a
re n
ot
eith
er
mo
re o
r le
ss l
ike
ly t
o y
ield
to
a p
ed
estr
ian
in
a m
ark
ed
cro
ssw
alk
.
4.
Pe
de
str
ian
s f
ee
l p
rote
cte
d b
ym
ark
ed
cro
ssw
alk
s a
nd
act
mo
rea
gg
ressiv
ely
wh
en
cro
ssin
g.
Ag
gre
ssiv
e P
ed
estr
ian
Be
ha
vio
rN
o c
ha
ng
e i
n b
lata
ntly a
gg
ressiv
e p
ed
estr
ian
be
ha
vio
rin
dic
ate
s t
ha
t p
ed
estr
ian
s d
o n
ot
fee
l o
ve
rly p
rote
cte
d b
ycro
ssw
alk
ma
rkin
gs.
5.
Pe
de
str
ian
s w
ill n
ot
use
ma
rke
dcro
ssw
alk
s.
Pe
rce
nta
ge
of
Cro
ssin
gP
ed
estr
ian
s i
n t
he
Cro
ssw
alk
Pe
de
str
ian
s w
alk
ing
alo
ne
te
nd
to
use
ma
rke
d c
rossw
alk
se
sp
ecia
lly a
t b
usie
r in
ters
ectio
ns.
Pe
de
str
ian
s w
alk
ing
in
gro
up
s d
o n
ot
ten
d t
o u
se
ma
rke
dcro
ssw
alk
s.
Ove
rall,
cro
ssw
alk
usa
ge
in
cre
ase
d a
fte
r th
e i
nsta
llatio
n o
fth
e c
rossw
alk
ma
rkin
gs.
37
APPENDIX—DATA COLLECTION PROTOCOL
Pedestrian Entry/Magnet Study - Data Collection Protocol
Right of Way Study - Data Collection Protocol
Driver Speeds/Staged Pedestrian Study - Data Collection Protocol
Pedestrian Profile Study - Data Collection Protocol
Vehicle Volume Counts and Traffic Gaps
Field Studies Definitions and Exceptions
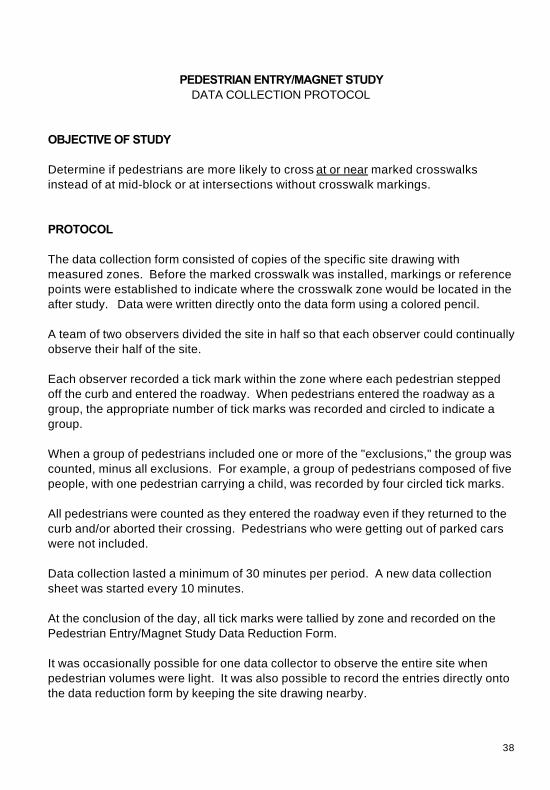
38
PEDESTRIAN ENTRY/MAGNET STUDYDATA COLLECTION PROTOCOL
OBJECTIVE OF STUDY
Determine if pedestrians are more likely to cross at or near marked crosswalksinstead of at mid-block or at intersections without crosswalk markings.
PROTOCOL The data collection form consisted of copies of the specific site drawing withmeasured zones. Before the marked crosswalk was installed, markings or referencepoints were established to indicate where the crosswalk zone would be located in theafter study. Data were written directly onto the data form using a colored pencil.
A team of two observers divided the site in half so that each observer could continuallyobserve their half of the site. Each observer recorded a tick mark within the zone where each pedestrian steppedoff the curb and entered the roadway. When pedestrians entered the roadway as agroup, the appropriate number of tick marks was recorded and circled to indicate agroup.
When a group of pedestrians included one or more of the "exclusions," the group wascounted, minus all exclusions. For example, a group of pedestrians composed of fivepeople, with one pedestrian carrying a child, was recorded by four circled tick marks.
All pedestrians were counted as they entered the roadway even if they returned to thecurb and/or aborted their crossing. Pedestrians who were getting out of parked carswere not included.
Data collection lasted a minimum of 30 minutes per period. A new data collectionsheet was started every 10 minutes. At the conclusion of the day, all tick marks were tallied by zone and recorded on thePedestrian Entry/Magnet Study Data Reduction Form. It was occasionally possible for one data collector to observe the entire site whenpedestrian volumes were light. It was also possible to record the entries directly ontothe data reduction form by keeping the site drawing nearby.
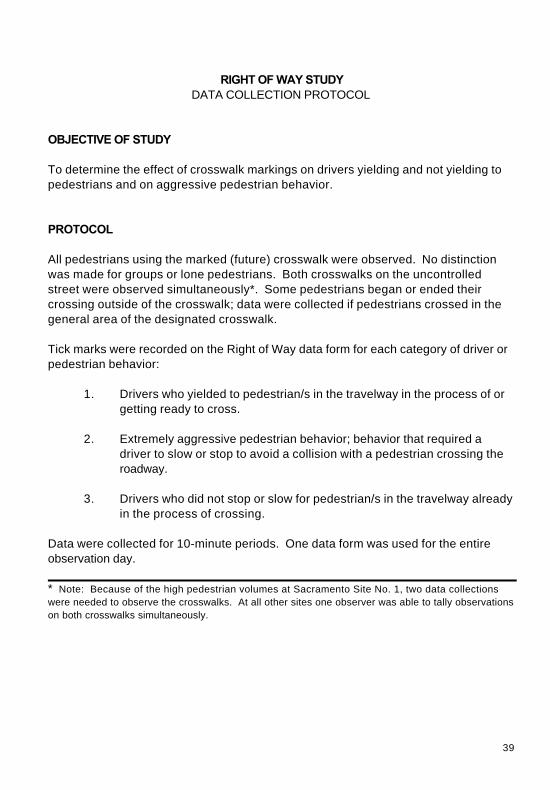
39
RIGHT OF WAY STUDYDATA COLLECTION PROTOCOL
OBJECTIVE OF STUDY
To determine the effect of crosswalk markings on drivers yielding and not yielding topedestrians and on aggressive pedestrian behavior.
PROTOCOL
All pedestrians using the marked (future) crosswalk were observed. No distinctionwas made for groups or lone pedestrians. Both crosswalks on the uncontrolledstreet were observed simultaneously*. Some pedestrians began or ended theircrossing outside of the crosswalk; data were collected if pedestrians crossed in thegeneral area of the designated crosswalk.
Tick marks were recorded on the Right of Way data form for each category of driver orpedestrian behavior:
1. Drivers who yielded to pedestrian/s in the travelway in the process of orgetting ready to cross.
2. Extremely aggressive pedestrian behavior; behavior that required a
driver to slow or stop to avoid a collision with a pedestrian crossing theroadway.
3. Drivers who did not stop or slow for pedestrian/s in the travelway alreadyin the process of crossing.
Data were collected for 10-minute periods. One data form was used for the entireobservation day.
* Note: Because of the high pedestrian volumes at Sacramento Site No. 1, two data collections
were needed to observe the crosswalks. At all other sites one observer was able to tally observations
on both crosswalks simultaneously.
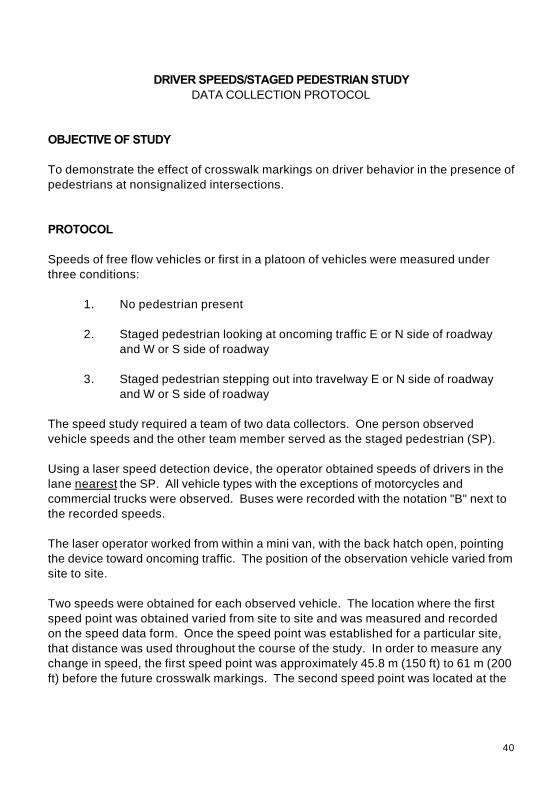
40
DRIVER SPEEDS/STAGED PEDESTRIAN STUDY DATA COLLECTION PROTOCOL
OBJECTIVE OF STUDY
To demonstrate the effect of crosswalk markings on driver behavior in the presence ofpedestrians at nonsignalized intersections.
PROTOCOL Speeds of free flow vehicles or first in a platoon of vehicles were measured underthree conditions:
1. No pedestrian present
2. Staged pedestrian looking at oncoming traffic E or N side of roadwayand W or S side of roadway
3. Staged pedestrian stepping out into travelway E or N side of roadwayand W or S side of roadway
The speed study required a team of two data collectors. One person observedvehicle speeds and the other team member served as the staged pedestrian (SP). Using a laser speed detection device, the operator obtained speeds of drivers in thelane nearest the SP. All vehicle types with the exceptions of motorcycles andcommercial trucks were observed. Buses were recorded with the notation "B" next tothe recorded speeds.
The laser operator worked from within a mini van, with the back hatch open, pointingthe device toward oncoming traffic. The position of the observation vehicle varied fromsite to site.
Two speeds were obtained for each observed vehicle. The location where the firstspeed point was obtained varied from site to site and was measured and recordedon the speed data form. Once the speed point was established for a particular site,that distance was used throughout the course of the study. In order to measure anychange in speed, the first speed point was approximately 45.8 m (150 ft) to 61 m (200ft) before the future crosswalk markings. The second speed point was located at the
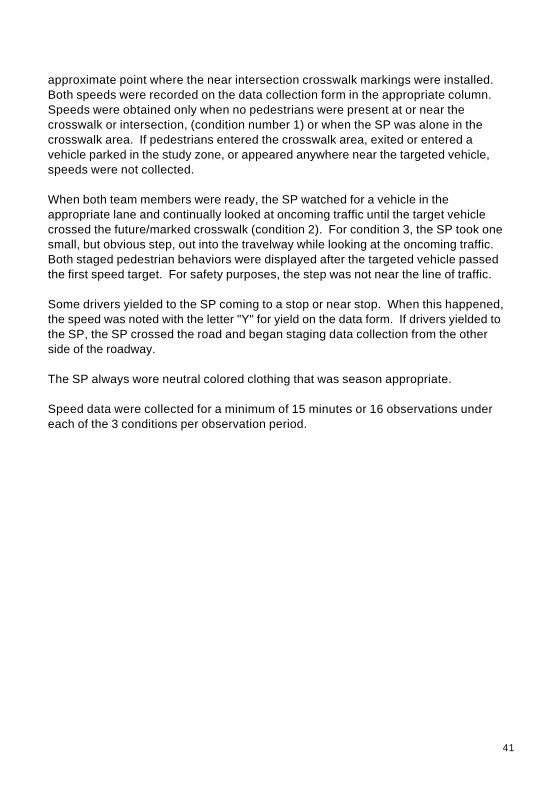
41
approximate point where the near intersection crosswalk markings were installed. Both speeds were recorded on the data collection form in the appropriate column. Speeds were obtained only when no pedestrians were present at or near thecrosswalk or intersection, (condition number 1) or when the SP was alone in thecrosswalk area. If pedestrians entered the crosswalk area, exited or entered avehicle parked in the study zone, or appeared anywhere near the targeted vehicle,speeds were not collected.
When both team members were ready, the SP watched for a vehicle in theappropriate lane and continually looked at oncoming traffic until the target vehiclecrossed the future/marked crosswalk (condition 2). For condition 3, the SP took onesmall, but obvious step, out into the travelway while looking at the oncoming traffic. Both staged pedestrian behaviors were displayed after the targeted vehicle passedthe first speed target. For safety purposes, the step was not near the line of traffic. Some drivers yielded to the SP coming to a stop or near stop. When this happened,the speed was noted with the letter "Y" for yield on the data form. If drivers yielded tothe SP, the SP crossed the road and began staging data collection from the otherside of the roadway.
The SP always wore neutral colored clothing that was season appropriate.
Speed data were collected for a minimum of 15 minutes or 16 observations undereach of the 3 conditions per observation period.
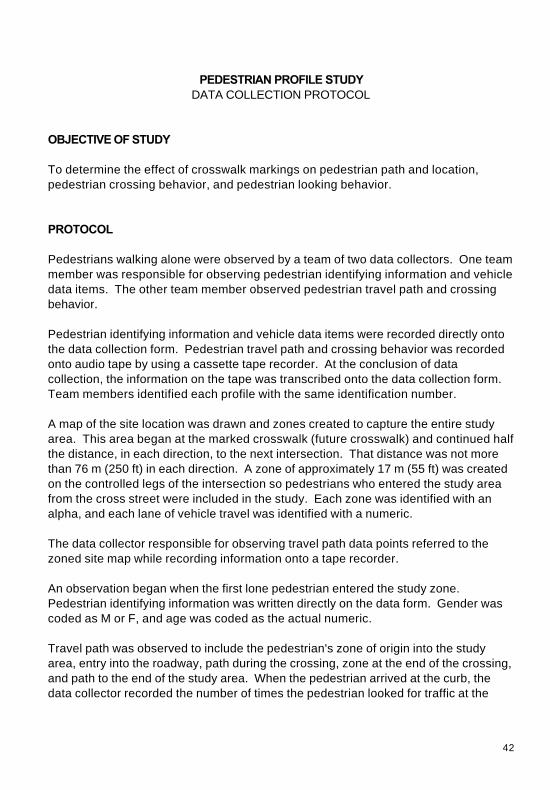
42
PEDESTRIAN PROFILE STUDYDATA COLLECTION PROTOCOL
OBJECTIVE OF STUDY
To determine the effect of crosswalk markings on pedestrian path and location,pedestrian crossing behavior, and pedestrian looking behavior.
PROTOCOL
Pedestrians walking alone were observed by a team of two data collectors. One teammember was responsible for observing pedestrian identifying information and vehicledata items. The other team member observed pedestrian travel path and crossingbehavior.
Pedestrian identifying information and vehicle data items were recorded directly ontothe data collection form. Pedestrian travel path and crossing behavior was recordedonto audio tape by using a cassette tape recorder. At the conclusion of datacollection, the information on the tape was transcribed onto the data collection form. Team members identified each profile with the same identification number.
A map of the site location was drawn and zones created to capture the entire studyarea. This area began at the marked crosswalk (future crosswalk) and continued halfthe distance, in each direction, to the next intersection. That distance was not morethan 76 m (250 ft) in each direction. A zone of approximately 17 m (55 ft) was createdon the controlled legs of the intersection so pedestrians who entered the study areafrom the cross street were included in the study. Each zone was identified with analpha, and each lane of vehicle travel was identified with a numeric.
The data collector responsible for observing travel path data points referred to thezoned site map while recording information onto a tape recorder.
An observation began when the first lone pedestrian entered the study zone. Pedestrian identifying information was written directly on the data form. Gender wascoded as M or F, and age was coded as the actual numeric.
Travel path was observed to include the pedestrian's zone of origin into the studyarea, entry into the roadway, path during the crossing, zone at the end of the crossing,and path to the end of the study area. When the pedestrian arrived at the curb, thedata collector recorded the number of times the pedestrian looked for traffic at the
43
curb and the number of times the pedestrian looked during the crossing while in eachlane. The looking codes were: none=0, once=1 and more than once=2. Lookingobservations were recorded at the curb and during each lane of crossing. Pedestrian walking gait and any change in gait during each profile observation wererecorded. The codes for gait were: 1=slow, 2=typical, 3=run/jog, 4=adjusted speedfaster, 5=adjusted speed slower, 6=4 and 5, 7=stopped during the crossing,8=reversal during the crossing, and 9=stopped at the curb.
When the pedestrian began crossing the roadway, the data collector responsible fortraffic observations coded the number of vehicles in the study zone, by lane. Twotraffic observations were recorded: once during the first half of the pedestriancrossing and once during the second half of the pedestrian crossing. The codeswere: none=0, at least one vehicle in study zones=1, and congested—no free flowtraffic=2.
Any unusual driver behavior was recorded using the following codes: 0=none, 1=yieldto pedestrian, 2=obvious slowing, 3=hard braking, and 4=horn, swerve, driver yells orgestures.
All vehicles parked within 4.6 m (15 ft) of the marked crosswalk were recorded byzone on the data form. Any changes during the observation period were recorded asthey occurred.
To avoid selecting the targeted pedestrian to be observed, some of the observationsincluded people who entered the study zones but never crossed the roadway. Theseobservations were part of the data set.

44
VEHICLE VOLUME COUNTS AND TRAFFIC GAPS
OBJECTIVE
To provide general traffic volume and density information, by time of day. This willallow proper comparison between the before (unmarked crosswalk) and the after(marked crosswalk) periods (i.e., by isolating any changes due to the markings andnot due to changes in traffic volume).
PROTOCOL
Vehicle Volume Counts
Using the Traffic Volume Counts data form, the number of vehicles, by leg and turningmovement, that crossed the marked (future) crosswalk were counted.
Identifying leg numbers by N/S ordinates as they relate to each site were established.
Bank counters or paper and pencil tick marks were used for 10 minutes per hour ofdata collection. All identifying information at the top of the form was completed. The"notes and comments" section at the bottom of the data collection form was used forany relevant information about the roadway (i.e., one-way street, "T" intersection, etc.).
Time Headways/Traffic Gaps
A 100-interval memory stop watch was activated each time a vehicle, in any lane,crossed the crosswalk marking nearest the intersection. After 10 minutes the gaptimes were tallied on the data form. For gaps of more than 25 seconds, the exacttime of each gap was recorded on the lower half of the data form.
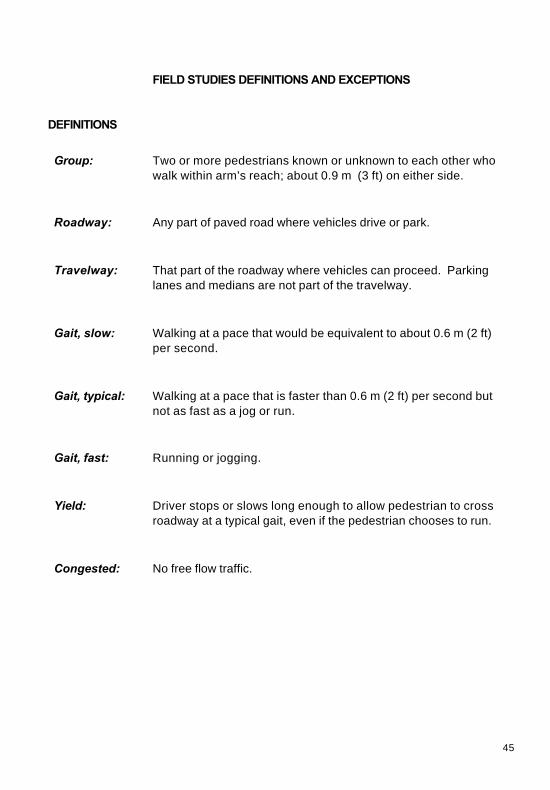
45
FIELD STUDIES DEFINITIONS AND EXCEPTIONS
DEFINITIONS
Group: Two or more pedestrians known or unknown to each other whowalk within arm’s reach; about 0.9 m (3 ft) on either side.
Roadway: Any part of paved road where vehicles drive or park.
Travelway: That part of the roadway where vehicles can proceed. Parkinglanes and medians are not part of the travelway.
Gait, slow: Walking at a pace that would be equivalent to about 0.6 m (2 ft)per second.
Gait, typical: Walking at a pace that is faster than 0.6 m (2 ft) per second butnot as fast as a jog or run.
Gait, fast: Running or jogging.
Yield: Driver stops or slows long enough to allow pedestrian to crossroadway at a typical gait, even if the pedestrian chooses to run.
Congested: No free flow traffic.

46
EXCEPTIONS
In general, the following pedestrians were not observed during the field studies. There were a few sites where bikers and skaters were found in abundance. At theselocations, special codes were developed and these individuals were noted. C People who used roller blades, skates, skateboardsC People who rode or walked bikesC People who were in wheel chairsC People who used walkersC People who carried children of any ageC People who pushed baby stroller, cart, walked dogsC People who were blind or who led blind pedestrians