pedestrian level of comfort methodology
TRANSCRIPT


1
Pedestrian Level of Comfort Methodology
Version 1.2
Montgomery County Planning Department
December 21, 2020
I. Introduction
When people walk (or when using a mobility device, roll) along pedestrian pathways, trails and roadways, they may experience varying levels of comfort. A quiet residential street with a 25-mile-per-hour speed limit, low motor vehicle traffic volumes, and pedestrian pathways separated from the road by trees creates a comfortable walking or rolling experience for most people. In contrast, a six-lane suburban highway with a 40-mile-per-hour speed limit and narrow pedestrian pathways directly adjacent to the street may be undesirable. Fewer people are likely to walk or roll in less comfortable environments, and for those who must, the experience is more uncomfortable than it might be with a different design. The Pedestrian Level of Comfort (PLOC) methodology captures how comfortable it is to walk and roll in different conditions in Montgomery County. A variety of pathway and crossing factors are considered to determine a comfort score for each crossing and pathway segment. The four main scores are: undesirable (score = 4), uncomfortable (score = 3), somewhat comfortable (score = 2), and very comfortable (score = 1). Half-point scores are also possible as certain contextual information becomes available. If an area receives a relatively poor score, changes may be needed to make it a place where more people will feel comfortable walking.
Not all factors that influence pedestrian comfort are included due to the lack of available data. However, some such factors can have outsized impacts on comfort (such as pedestrian and street lighting or the presence of a Leading Pedestrian Interval at crossings). Therefore, they are scored separately. As data for these additional factors become available, they will be integrated to provide a more complete analysis of the pathway or crossing. However, the basic PLOC score can be calculated in their absence.
“Comfort” as a concept should be thought of differently from “safety”. While safety will always be the bedrock principle of the transportation system, this analysis is a tool to create a pedestrian environment in Montgomery County that is more than safe – one that is enjoyable and comfortable for people of all ages. In situations where comfort and safety may appear to diverge, safety is paramount.
There are four main scoring tables: Pathway, No Pathway (where a pedestrian must share the road with vehicle traffic), Controlled Crossing and Uncontrolled Crossing. These four tables can be found later in this document. An additional table further assesses pathways and crossings on factors related to accessibility. This accessibility evaluation serves as a separate overlay to allow independent consideration of broader factors that impact pedestrian comfort as well as ADA compliance and access for all. Similarly, an additional crossing overlay table assesses crossing characteristics, such as the presence of a Leading Pedestrian Interval and crosswalk lighting standards.
II. Pathway Factors
A “pathway” is a place designated for pedestrians such as sidewalks, shared use paths and trails. “No pathway” describes a place where a pedestrian must share the road with motor vehicles. A variety of factors influence the ultimate PLOC score for a pathway or no-pathway segment. Pathway scores consider land use, pathway width, posted speed limit, pathway buffer width, pathway condition, on-street separation and traffic volume. Since traffic volume is not universally collected in

Montgomery Planning PEDESTRIAN LEVEL OF COMFORT METHODOLOGY, VERSION 1.2
2
Montgomery County, roadway functional classifications—Major Highway, Arterial, Business District and Primary Residential, for example—stand in for a roadway’s traffic volume in this analysis.1 Major highways are assumed to have high traffic volume while secondary residential roads are assumed to have low traffic volume and so on. “No pathway” scores consider land use, posted speed limit, traffic volume or roadway functional classification and whether curbside parking is allowed. Each factor used in the PLOC evaluation is detailed below.
Land Use
Land use, classified as “urban” and “non-urban,” indicates the volume of likely pedestrian activity on a given pathway segment. Urban pathways are those within the following zones: Commercial/Residential (CR), Life Sciences Center (LSC) or their floating zone equivalents (areas designated for these purposes but with undetermined locations). Pathways within multifamily residential zones (R-10, R-20, R-30) and townhouse zones (RT) receive an “urban” designation if they are adjacent to CR, LSC or floating zones. Pathways that are not adjacent to these land uses are considered “non-urban.” The “urban” versus “non-urban” designation affects the score of the pathway because pathways in urban areas are expected to be wider to accommodate more pedestrians.2
Pathway Width
In urban areas, wider pathways are preferred to accommodate more pedestrians and to reduce conflict and discomfort between people walking and biking. Urban pathways that are not sufficiently wide will receive a lower score and can be prioritized for improvements, such as wider shared use paths or separating walking from bicycling.3 The functional path width is the pedestrian clear space. This excludes the furnishing (space for obstacles like utility poles and signposts) and frontage zones (area adjacent to building fronts where café seating, etc. may be located). Overall width categories are indicated below:
Urban score categories (best to worst): ≥10 feet, ≥8 feet to 10 feet, ≥5 feet to 8 feet, and <5 feet Non-urban score categories (best to worst): ≥8 feet, ≥5 feet to 8 feet, and <5 feet
Posted Speed Limit
Posted speed limit refers to the posted speed limit of the roadway parallel to the pathway. The maximum posted speed limit scoring cutoff is 40 mph because research shows that safety outcomes (injuries and fatalities) do not vary greatly for pedestrians when struck by a vehicle traveling at speeds higher than 40 mph. Posted speed limits are a stand-in for observed vehicular travel speeds which are not widely available in Montgomery County. Posted speeds cannot typically be changed in isolation to improve the PLOC score. Additional engineering efforts will likely be required. If observed speed data are available, it can be used with Planning staff and MCDOT approval.
Score categories (best to worst): <25 mph, 25 mph, 30 mph, 35 mph, and ≥40 mph
Pathway Buffer Width
Pathway buffer refers to the distance between the pedestrian clear space (path width) and the curb or edge of pavement. Buffers of different widths provide varying benefits. Those between two and five feet separate moving vehicles from pedestrians which affords some amount of comfort benefit compared to no buffer at all. Having no buffer at all may force
1 References to functional classification will be updated to reflect the street typologies in the Complete Streets Design Guide when that document is approved by County Council and the street classifications have been mapped. 2 References to “urban” and “non-urban” will be updated to reflect the Downtown and Town Center designations identified by the Complete Streets Design Guide when that document is approved by County Council. 3 For more detailed width determination when designing a shared use facility, bicycle and pedestrian volume data are required and the FHWA Shared Use Path Level of Service Calculator is the recommended analytical tool to use: https://www.fhwa.dot.gov/publications/research/safety/pedbike/05138/.
Montgomery Planning PEDESTRIAN LEVEL OF COMFORT METHODOLOGY, VERSION 1.2
3
pedestrians to “shy” away from travel lanes, thereby reducing the effective width of the pathway.4 Pathway buffers of at least five feet allow the planting of larger street trees to provide robust physical separation from traffic, shade canopy and a sense of enclosure for pedestrians.5 6 Vertical buffers, such as railings, guardrails or jersey barriers are scored as equivalent to a five-foot buffer. Pathway buffers exceeding eight feet may provide all the benefits afforded by a five-foot buffer plus additional physical separation from traffic.
Score categories (best to worst): ≥8 feet, 5 feet to <8 feet (includes vertical buffers), 2 to <5 feet, 0 to <2 feet
4 San Francisco Department of Public Health. 2012. "Pedestrian Environmental Quality Index: Street Auditor's Manual." San Francisco, CA. 5 Ibid. 6 Toole, J. 2010. Update of the AASHTO Guide for the Planning, Design, and Operation of Pedestrian Facilities. Transportation Research Board of The National Academies, National Cooperative Highway Research Program. (NCHRP 20-07/Task 263)

Montgomery Planning PEDESTRIAN LEVEL OF COMFORT METHODOLOGY, VERSION 1.2
4
Pathway Condition
Research indicates that pathway condition affects pedestrian comfort and this variable is included in other leading pedestrian comfort indices.7 8 9 Montgomery County is currently collecting information about pathway condition throughout the county including cross slope (helps drain water and prevent pooling), tripping hazards, cracks, severe spalling (surface peeling or cracking of concrete), obstructions (to be accounted for in the Accessibility Evaluation), and missing sections. A sample survey is provided below.
HOT BUTTONS
Ramps Pathways Crosswalks Bus pads
Detectable Warning Surface (DWS)
Yes/No Surface Type Concrete, Asphalt or
Other Slope Minimum Size
(5' x 8') Yes/No
DWS Type Cast in Place, Nail Down or
Other Width In Feet Marking
Type
Solid, Standard, Continental, Dashed, Zebra, Ladder, None
Bus Stop Connected to Pathway (100' of pathway or
nearest intersection)
Yes/No
DWS Color Red, Yellow,
Gray or Other
Cross Slope (2% or less but greater
than 0)
Yes/No Centered with Ramp Yes/No Midblock Yes/No
DWS Size In Feet Trip Hazard
1/4" or greater
Yes/No Pedestrian Signal Yes/No
Ramp Width In Feet Multiple
Cracks in one section
Yes/No Pushbutton Yes/No
Ramp Slope (8.33% or
less) Yes/No Severe
Spalling Yes/No Pushbutton
Heights, Distance from Pathway,
Raised Tactile, Tone, Audible Indication, Actuated Indicator
Ramp Landing area (2% or less)
Yes/No Obstructions
(less than 36" opening)
Yes/No
Ramp Landing Area
(5' x 5') Yes/No Obstruction
Type
Utility, Vegetation,
Sign or Other
Missing Sections Lengths
In Feet
Montgomery County Pathway Condition Survey
7 Clifton, Kelly J., Andrea D. Livi Smith, and Daniel Rodriguez. 2007. "The development and testing of an audit for the pedestrian environment." Landscape and Urban Planning; 95-110. 8 San Francisco Department of Public Health, 2012. 9 Oregon DOT. 2018. "Multimodal Analysis." Chap. 14 in Analysis Procedure Manual.
Montgomery Planning PEDESTRIAN LEVEL OF COMFORT METHODOLOGY, VERSION 1.2
5
In the PLOC, pathway condition is calculated based on the total number of issues counted on a given segment. For example, a poor pathway section could have obstructions, severe spalling and trip hazards, while a fair segment may have only cracking. A pathway is assumed to be in good condition unless data are available to identify any of the above issues. If the pathway is determined to be in fair condition, 0.5 will be added to its base score from the Pedestrian Pathway Table (table included in the Pathway Evaluation section). If determined to be in poor condition, 1 will be added to the base score (with a maximum score of 4).
The following issues can impact pathway condition:
• Cross slope – <0 or >2% • Trip hazards – 1/4" or greater • Cracks – Multiple cracks in one section • Severe spalling – Surface peeling or flaking of concrete • Obstructions – As defined above • Missing sections – Any linear feet of missing pathway in a given segment
Score categories: Good (no known issues), Fair (1-2 issues), Poor (3+ issues)
On-Street Buffer (Designated Parking Lane or Separated Bike Lane)
Research shows that the presence of an on-street buffer, such as a parking lane or bike lane, can increase pedestrian comfort by providing additional separation between pedestrians and moving vehicles.10 11 Designated parking lanes include striped parking lanes, parking between curb extensions and metered parking. On-street parking that is not identified with striping, curb extensions or parking meters is not considered designated parking as vehicles may travel in that space in the absence of parked cars. The wider the on-street separation, the larger the effect on the overall score.
Score categories (best to worst): Two-way separated bike lanes or combined designated parking lane and separated bike lanes (one- or two-way), designated parking lane or one-way separated bike lane, no designated parking lane or separated bike lane
Traffic Volume or Roadway Functional Classification
Traffic volume or roadway functional classification (which may serve as a proxy for roadway volume) can influence a pathway score in two possible ways. First, pathways without buffers and no-pathway segments with lower roadway functional classifications (and presumably lower traffic volume) may score better than those with higher traffic volume.
Second, “no pathway” segments receiving an “uncomfortable” score may be improved to “somewhat comfortable” due to low traffic volume. The PLOC accounts for a “low volume” variable which is applied to Tertiary Residential streets, residential cul-de-sacs (that do not terminate in a parking lot), and connector streets that serve as redundant residential routes with assumed low traffic volumes. A pathway that is already receiving a “somewhat comfortable” or “very comfortable” ranking remains unchanged.
Parking (“No Pathway” Segments Only)
10 Landis, Bruce W., Vattijuti R Venkat, Russell M. Ottenberg, Douglas S. McLeod, and Martin Guttenplan. 2001. "Modeling the Roadside Walking Environment: Pedestrian Level of Service." Transportation Research Record: Journal of the Transportation Research Board. 11 Moyano et al. 2019. "Station avenue: high speed rail’s missing link. Assessing pedestrian city station routes for edge stations in Spanish small cities." Journal of Housing and the Built Environment: 175-193.

Montgomery Planning PEDESTRIAN LEVEL OF COMFORT METHODOLOGY, VERSION 1.2
6
On “No Pathway” segments (roadways without sidewalks or shared use paths), on-street parking forces pedestrians to walk in the path of motor vehicles. On streets without parking, pedestrians can more easily walk curbside, away from motor vehicles. Therefore, prohibition of on-street parking on streets with low speed limits may positively impact the PLOC score.

Montgomery Planning PEDESTRIAN LEVEL OF COMFORT METHODOLOGY, VERSION 1.2
7
III. Crossing Factors
Crossings are scored using different metrics, depending on whether they are uncontrolled (no stop sign or traffic signal present) or controlled (stop sign or traffic signal present). Factors considered in all crossing evaluations include crossing control, presence of a channelized right turn or interstate ramp, number of lanes crossed, highest posted speed limit of the intersection, median type and crosswalk type. Only signalized crossings are affected and scored by the presence of a “No Right Turn on Red” sign.
Crossing Control
Traffic control can improve pedestrian safety and the specific controls used have varying pedestrian comfort benefits. Data providing the types of phasing at signalized intersections are currently unavailable. Therefore, crossings are characterized as controlled or uncontrolled. Controlled crossings include signalized and stop-controlled intersections (where a stop sign is present). Controlled crossings and uncontrolled crossings are scored differently. With all other factors equal, a controlled crossing is scored as more comfortable than an uncontrolled crossing.
Right Turn on Red
At signalized intersections, the presence of a “No Right Turn on Red” sign improves the final crossing score by a half point.
Channelized Right Turn or Interstate Ramp
Channelized turn lanes (separated from the main intersection by curbs or other delineators) and interstate on- and off-ramps encourage higher vehicle speeds and present unique safety challenges for pedestrian crossings—especially for people with visual disabilities.12 The crossing of a channelized right turn lane or interstate ramp without traffic control automatically scores “undesirable” unless a raised crosswalk, vehicle-slowing geometry, or other treatments are in place that reduce speeds, improve visibility, and further mitigate conflicts between pedestrians and motor vehicles. In instances where such treatments are in place, an “uncomfortable” score is possible. Ramps and channelized right turns with signals are scored the same as one-lane signalized crossings.
Number of Lanes Crossed
As pedestrians cross more travel lanes to cross the street, exposure to crash risk increases and comfort decreases. 13 14 15 16
The total number of lanes should be used (not lanes per direction); this variable does not change with the presence of a raised refuge island.17
Score categories (best to worst): 1-3 lanes, 4-5 lanes, 6+ lanes
Highest Posted Speed Limit of the Intersection
The highest posted speed limit of all roads comprising an intersection is taken into account for both oncoming traffic and the speed of turning vehicles. Part of the discomfort pedestrians experience while traveling along high-speed roads is
12 Schroeder, B. J., Rouphail, N. M., & Emerson, R. S. W. 2006. Exploratory Analysis of Crossing Difficulties for Blind and Sighted Pedestrians at Channelized Turn Lanes. Transportation Research Record, 1956(1): 94–102. https://doi.org/10.1177/0361198106195600112 13 Oregon DOT. 2018. 14 Fitzpatrick et al. 2006. "Improving Pedestrian Safety at Unsignalized Crossings." Transit Cooperative Research Program Report 112, National Cooperative Highway Research Program Report 562. 15 Fitzpatrick et al. 2016. Will You Stop for Me? Roadway Design and Traffic Control Device Influences on Drivers Yielding to Pedestrians in a Crosswalk with a Rectangular Rapid-Flashing Beacon. Center for Transportation Safety, Texas A&M Transportation Institute. 16 Turner et al. 2017. Synthesis of Methods for Estimating Pedestrian and Bicyclist Exposure to Risk at Areawide Levels and on Specific Transportation Facilities. Federal Highway Administration, U.S. Department of Transportation. 17 If available, the curb to curb (or edge of pavement to edge of pavement) width of a crossing can be used instead of the number of lanes. The crossing width translates to the number of lanes by dividing total width by 11.
Montgomery Planning PEDESTRIAN LEVEL OF COMFORT METHODOLOGY, VERSION 1.2
8
vehicles turning into their path. Even if those vehicles are turning onto a low-speed street, they can rapidly approach and be perceived as still travelling at high speed. Additionally, drivers turning left across a high-speed street onto a low-speed street may be more focused on finding a gap in traffic than on any pedestrians crossing the low-speed street. Residential crossings may benefit from traffic calming improvements, such as hardened centerlines on the perpendicular street, crossing islands, turn wedges, or curb extensions.18 For midblock crossings, the scoring uses the posted speed limit of the road being crossed.
Score categories (best to worst): <25 mph, 25 mph, 30 mph, 35 mph, and ≥40 mph.
Median Type
While raised refuge islands have the greatest crossing safety and comfort benefits, medians that do not meet the criteria for a refuge may also have pedestrian safety benefits.19 A raised refuge island is a median of six feet to accommodate the width of a bicycle, a person using a wheelchair or a person pushing a stroller.20 In addition, raised medians that are narrower than six feet may have safety benefits for pedestrians compared to no median.21 Hardened centerlines and grass medians also fall in this category as they provide physical separation between travel lanes but do not provide the full safety and comfort benefits of a raised refuge island. This variable is categorized as follows:
Score categories (best to worst): Raised refuge island (raised median ≥6’); raised median <6’, curbless landscaped (including grass) median of any width, or hardened centerline; painted/no median
Crosswalk Type
High-visibility crosswalks have proven pedestrian safety benefits over standard crosswalk markings.22 23 High-visibility crosswalk markings include continental, ladder, zebra and solid. Standard crosswalk markings include stamped concrete, standard and dashed marking patterns. Unmarked crossings have no pavement markings to denote the crosswalk.24
Score categories (best to worst): High-visibility, standard, or unmarked
Traffic Volume
Uncontrolled crossings on roads that are designated as low volume (Tertiary Residential streets, residential cul-de-sacs that do not terminate in a parking lot, and connector streets that serve as redundant residential routes with assumed low traffic volumes) will receive an automatic score of 'somewhat comfortable' unless the uncontrolled crossing parallels a road with a speed limit >25mph or MPOHT class of primary residential or higher.
18 NYCDOT. 2016. Don’t Cut Corners: Left Turn Pedestrian and Bicyclist Crash Study. http://home.nyc.gov/html/dot/downloads/pdf/left-turn-pedestrian-and-bicycle-crash-study.pdf 19 Federal Highway Administration, U.S. Department of Transportation. 2019. Proven Safety Countermeasures. https://safety.fhwa.dot.gov/provencountermeasures/. 20 Rosenbloom, Toval, and Avihu Pereg. 2012. "A within-subject design of comparison of waiting time of pedestrians before crossing three successive road crossings." Transportation Research Part F 625-634. 21 Bahar, Geni, Maurice Masliah, Rhys Wolff, and Peter Park. 2008. Desktop Reference for Crash Reduction Factors. Washington, D.C.: Federal Highway Administration, U.S. Department of Transportation. 22 FHWA. 2019. Proven Safety Countermeasures. 23 Knoblauch , Richard, and Paula D Raymond. 2000. The Effect of Crosswalk Markings on Vehicle Speeds in Maryland, Virginia, and Arizona Report No. FHWA-RD-00-101. Washington, D.C.: Federal Highway Administration, U.S. Department of Transportation. 24 Locations where crossings are legally prohibited are treated as “unmarked” for purposes of PLOC assessment.

Montgomery Planning PEDESTRIAN LEVEL OF COMFORT METHODOLOGY, VERSION 1.2
9
IV. Comfort Levels
The comfort level scale allows for a basic four-point ranking system, while half-points add further nuance when additional data are available to refine the evaluation. For example, a crossing might be upgraded from a score of 3 to 2.5 if an additional safety or comfort treatment, such as lighting or a “No Turn on Red” sign, is present.25
1 = Very Comfortable
1.5 = Comfortable
2 = Somewhat Comfortable
2.5 = Somewhat Uncomfortable
3 = Uncomfortable
3.5 = Very Uncomfortable
4 = Undesirable
25 Achieving the desired PLOC score may not always be possible in a given location due to limited right-of-way, impractical traffic operations requirements, cost, or other feasibility concerns.

Montgomery Planning PEDESTRIAN LEVEL OF COMFORT METHODOLOGY, VERSION 1.2
10
V. Pathway Evaluation
Pedestrian pathways will be scored using the following table. A separate scoring table for roadways with no pedestrian pathway follows.
Pedestrian Pathway Table
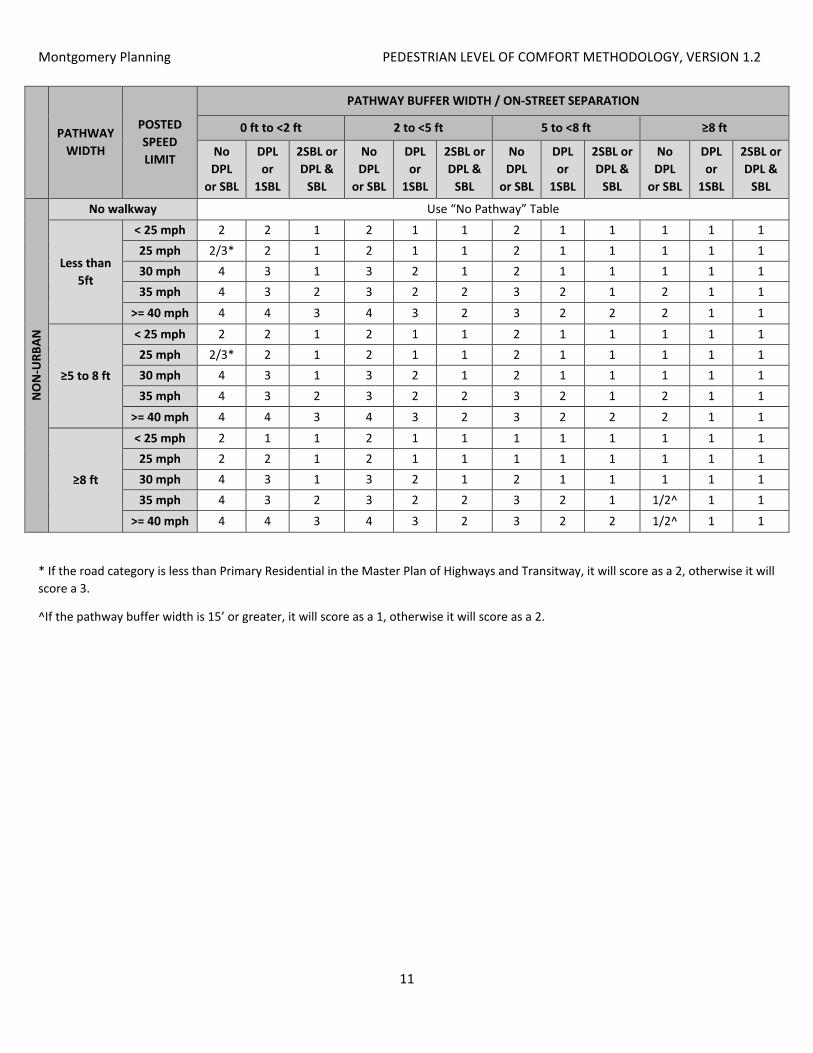
This table is categorized along the vertical axis by land use (urban, non-urban) and compares pathway width (broken down into speed categories) to total buffer width, further classified by on-street buffer type. On-street buffers are abbreviated as DPL (designated parking lane), SBL (separated bike lane) and 2SBL (two-way separated bike lane). These variables were considered because a pathway’s relative distance from a roadway (i.e. the buffer plus on-street separation), its width, and the speed of that roadway have interrelated effects on pedestrian comfort. The scores in this table assume the pathway is in good condition. If the pathway is in fair condition, 0.5 will be added to the score. For poor condition, 1 will be added to the score (with a maximum score of 4).
PATHWAY
WIDTH
POSTED SPEED LIMIT
PATHWAY BUFFER WIDTH / ON-STREET SEPARATION
0 ft to <2 ft 2 to <5 ft 5 to <8 ft ≥8 ft
No DPL
or SBL
DPL or
1SBL
2SBL or DPL &
SBL
No DPL
or SBL
DPL or
1SBL
2SBL or DPL &
SBL
No DPL
or SBL
DPL or
1SBL
2SBL or DPL &
SBL
No DPL
or SBL
DPL or
1SBL
2SBL or DPL &
SBL
URB
AN
No walkway Use “No Pathway” Table
< 5ft
< 25 mph 4 3 1 4 3 1 3 2 1 2 1 1 25 mph 4 3 1 4 3 1 3 2 1 2 1 1 30 mph 4 3 1 4 3 1 3 2 1 2 1 1 35 mph 4 3 2 4 3 2 3 2 1 2 1 1
>= 40 mph 4 4 3 4 3 2 3 2 2 2 1 1
≥5 to 8 ft
< 25 mph 2 2 1 2 2 1 2 1 1 1 1 1 25 mph 2/3* 2 1 2/3* 2 1 2 1 1 1 1 1 30 mph 4 3 1 3 2 1 2 1 1 1 1 1 35 mph 4 3 2 3 2 2 3 2 1 2 1 1
>= 40 mph 4 4 3 4 3 2 3 2 2 2 1 1
≥8 to 10 ft
< 25 mph 2 2 1 2 1 1 1 1 1 1 1 1 25 mph 2 2 1 2 1 1 1 1 1 1 1 1 30 mph 4 3 1 3 2 1 2 1 1 1 1 1 35 mph 4 3 2 3 2 2 3 2 1 2 1 1
>= 40 mph 4 4 3 4 3 2 3 2 2 2 1 1
≥10 ft
< 25 mph 2 1 1 2 1 1 1 1 1 1 1 1 25 mph 2 2 1 2 1 1 1 1 1 1 1 1 30 mph 3 2 1 3 2 1 2 1 1 1 1 1 35 mph 4 3 2 3 2 2 3 2 1 1/2^ 1 1
>= 40 mph 4 4 3 4 3 2 3 2 2 1/2^ 1 1
Montgomery Planning PEDESTRIAN LEVEL OF COMFORT METHODOLOGY, VERSION 1.2
11
PATHWAY
WIDTH
POSTED SPEED LIMIT
PATHWAY BUFFER WIDTH / ON-STREET SEPARATION
0 ft to <2 ft 2 to <5 ft 5 to <8 ft ≥8 ft
No DPL
or SBL
DPL or
1SBL
2SBL or DPL &
SBL
No DPL
or SBL
DPL or
1SBL
2SBL or DPL &
SBL
No DPL
or SBL
DPL or
1SBL
2SBL or DPL &
SBL
No DPL
or SBL
DPL or
1SBL
2SBL or DPL &
SBL
NO
N-U
RBAN
No walkway Use “No Pathway” Table
Less than 5ft
< 25 mph 2 2 1 2 1 1 2 1 1 1 1 1 25 mph 2/3* 2 1 2 1 1 2 1 1 1 1 1 30 mph 4 3 1 3 2 1 2 1 1 1 1 1 35 mph 4 3 2 3 2 2 3 2 1 2 1 1
>= 40 mph 4 4 3 4 3 2 3 2 2 2 1 1
≥5 to 8 ft
< 25 mph 2 2 1 2 1 1 2 1 1 1 1 1 25 mph 2/3* 2 1 2 1 1 2 1 1 1 1 1 30 mph 4 3 1 3 2 1 2 1 1 1 1 1 35 mph 4 3 2 3 2 2 3 2 1 2 1 1
>= 40 mph 4 4 3 4 3 2 3 2 2 2 1 1
≥8 ft
< 25 mph 2 1 1 2 1 1 1 1 1 1 1 1 25 mph 2 2 1 2 1 1 1 1 1 1 1 1 30 mph 4 3 1 3 2 1 2 1 1 1 1 1 35 mph 4 3 2 3 2 2 3 2 1 1/2^ 1 1
>= 40 mph 4 4 3 4 3 2 3 2 2 1/2^ 1 1
* If the road category is less than Primary Residential in the Master Plan of Highways and Transitway, it will score as a 2, otherwise it will score a 3.
^If the pathway buffer width is 15’ or greater, it will score as a 1, otherwise it will score as a 2.

Montgomery Planning PEDESTRIAN LEVEL OF COMFORT METHODOLOGY, VERSION 1.2
12
No Pedestrian Pathway Table
Streets with no pathway receive special consideration because they cannot be scored based on path width or buffer. The most important considerations on these streets are posted speed, amount of vehicle traffic, land use and parking presence. In this table, functional class is used as a substitute for vehicle traffic volumes, since traffic volume data are not available on all roads. No road without a pathway can receive a perfect score of 1 using the available variables.26 Parking on Less than Primary Residential streets may decrease pedestrian comfort by forcing pedestrians to share a narrower right of way with vehicular traffic, thereby contributing to potential conflicts.
CONTEXT MASTER PLAN OF HIGHWAYS AND TRANSITWAYS (MPOHT) FUNCTIONAL CLASSIFICATION
PARKING ALLOWED
POSTED SPEED LIMIT
< 25 mph 25 mph 30 mph 35 mph ≥ 40 mph
URBAN Any No / Yes 4 4 4 4 4
NON-URBAN
Less than Primary Residential No 2 3 4 4 4
Yes 2 3 4 4 4
Primary Residential or Greater No 2 4 4 4 4
Yes 3 4 4 4 4
26 In the future, M-NCPPC may collect data on traffic calming measures, neighborhood slow zones with traffic calming, neighborhood shared streets or commercial shared streets, all of which would receive a score of 1 with speeds of less than 25 mph. All other scores for these contexts would remain the same.
Montgomery Planning PEDESTRIAN LEVEL OF COMFORT METHODOLOGY, VERSION 1.2
13
VI. Crossings Evaluation
Crossings are scored using two main tables and an overlay table for factors that, if evaluated, can affect the base score. The two primary crossing tables are mutually exclusive (controlled or uncontrolled crossings). After crossings are scored, the overlay bonus can be assessed, as described in the crossing overlays section.
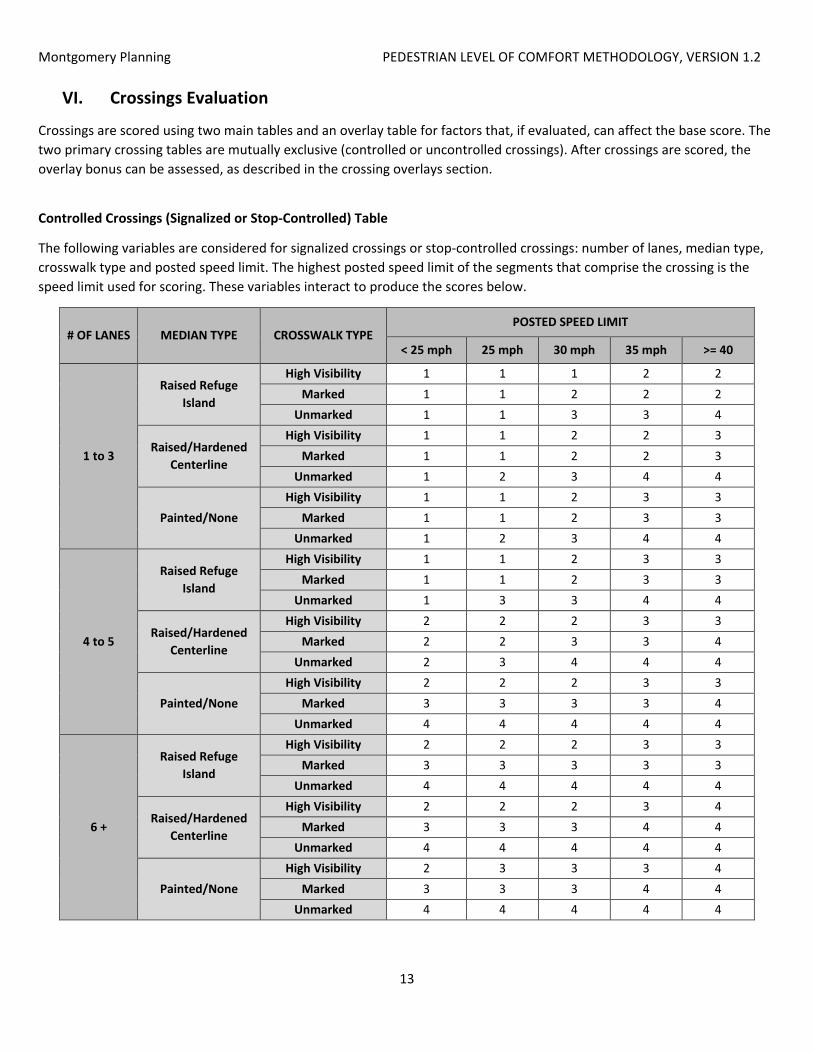
Controlled Crossings (Signalized or Stop-Controlled) Table
The following variables are considered for signalized crossings or stop-controlled crossings: number of lanes, median type, crosswalk type and posted speed limit. The highest posted speed limit of the segments that comprise the crossing is the speed limit used for scoring. These variables interact to produce the scores below.
# OF LANES MEDIAN TYPE CROSSWALK TYPE POSTED SPEED LIMIT
< 25 mph 25 mph 30 mph 35 mph >= 40
1 to 3
Raised Refuge Island
High Visibility 1 1 1 2 2 Marked 1 1 2 2 2
Unmarked 1 1 3 3 4
Raised/Hardened Centerline
High Visibility 1 1 2 2 3 Marked 1 1 2 2 3
Unmarked 1 2 3 4 4
Painted/None High Visibility 1 1 2 3 3
Marked 1 1 2 3 3 Unmarked 1 2 3 4 4
4 to 5
Raised Refuge Island
High Visibility 1 1 2 3 3 Marked 1 1 2 3 3
Unmarked 1 3 3 4 4
Raised/Hardened Centerline
High Visibility 2 2 2 3 3 Marked 2 2 3 3 4
Unmarked 2 3 4 4 4
Painted/None High Visibility 2 2 2 3 3
Marked 3 3 3 3 4 Unmarked 4 4 4 4 4
6 +
Raised Refuge Island
High Visibility 2 2 2 3 3 Marked 3 3 3 3 3
Unmarked 4 4 4 4 4
Raised/Hardened Centerline
High Visibility 2 2 2 3 4 Marked 3 3 3 4 4
Unmarked 4 4 4 4 4
Painted/None High Visibility 2 3 3 3 4
Marked 3 3 3 4 4 Unmarked 4 4 4 4 4
Montgomery Planning PEDESTRIAN LEVEL OF COMFORT METHODOLOGY, VERSION 1.2
14
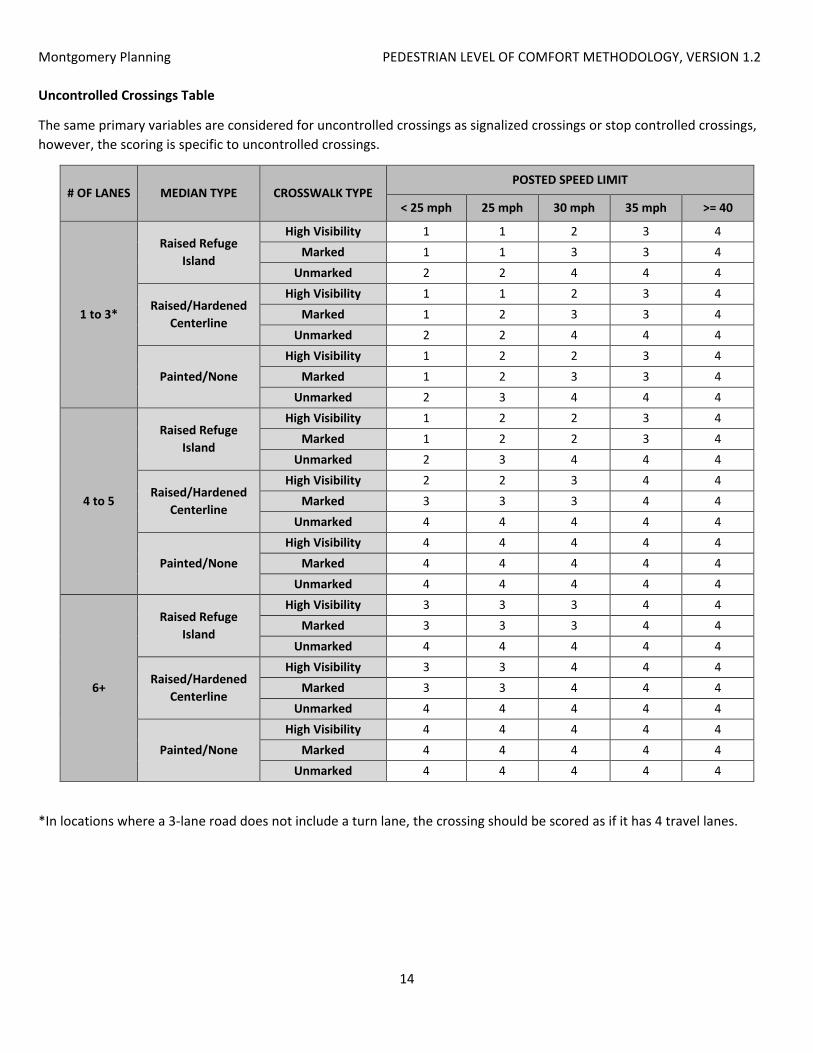
Uncontrolled Crossings Table
The same primary variables are considered for uncontrolled crossings as signalized crossings or stop controlled crossings, however, the scoring is specific to uncontrolled crossings.
# OF LANES MEDIAN TYPE CROSSWALK TYPE POSTED SPEED LIMIT
< 25 mph 25 mph 30 mph 35 mph >= 40
1 to 3*
Raised Refuge Island
High Visibility 1 1 2 3 4 Marked 1 1 3 3 4
Unmarked 2 2 4 4 4
Raised/Hardened Centerline
High Visibility 1 1 2 3 4 Marked 1 2 3 3 4
Unmarked 2 2 4 4 4
Painted/None High Visibility 1 2 2 3 4
Marked 1 2 3 3 4 Unmarked 2 3 4 4 4
4 to 5
Raised Refuge Island
High Visibility 1 2 2 3 4 Marked 1 2 2 3 4
Unmarked 2 3 4 4 4
Raised/Hardened Centerline
High Visibility 2 2 3 4 4 Marked 3 3 3 4 4
Unmarked 4 4 4 4 4
Painted/None High Visibility 4 4 4 4 4
Marked 4 4 4 4 4 Unmarked 4 4 4 4 4
6+
Raised Refuge Island
High Visibility 3 3 3 4 4 Marked 3 3 3 4 4
Unmarked 4 4 4 4 4
Raised/Hardened Centerline
High Visibility 3 3 4 4 4 Marked 3 3 4 4 4
Unmarked 4 4 4 4 4
Painted/None High Visibility 4 4 4 4 4
Marked 4 4 4 4 4 Unmarked 4 4 4 4 4
*In locations where a 3-lane road does not include a turn lane, the crossing should be scored as if it has 4 travel lanes.
Montgomery Planning PEDESTRIAN LEVEL OF COMFORT METHODOLOGY, VERSION 1.2
15
VII. Crossing Overlays
Overlays are used for crossings that have additional safety and comfort features present as follows:
Lighting
All crossings should be evaluated for lighting where data are available. If lit to MCDOT standards, a crossing’s score is improved by a half point.
Protected Pedestrian Phase or Leading Pedestrian Interval (LPI)
Scores for controlled crossings are improved by the presence of either a protected pedestrian phase (fully protected or protected/permissive) or an LPI that allows the pedestrian a head start into an intersection before vehicle traffic signals turn green.
Rectangular Rapid Flashing Beacon (RRFB)
The presence of an RRFB, a traffic control device that improves motorist yielding compliance at uncontrolled crossing locations, improves a crossing’s score by a half-point.
No Right Turn on Red Signage (No RTOR)
At signalized intersections, the presence of a “No Right Turn on Red” sign improves the final crossing score by a half point.
Traffic Calming
At all crossing locations, treatments that slow traffic speeds, improve visibility, and increase yield compliance improve the crossing score by a half point. Such treatments can include raised centerlines, raised intersections, raised crossings, or turn wedges.
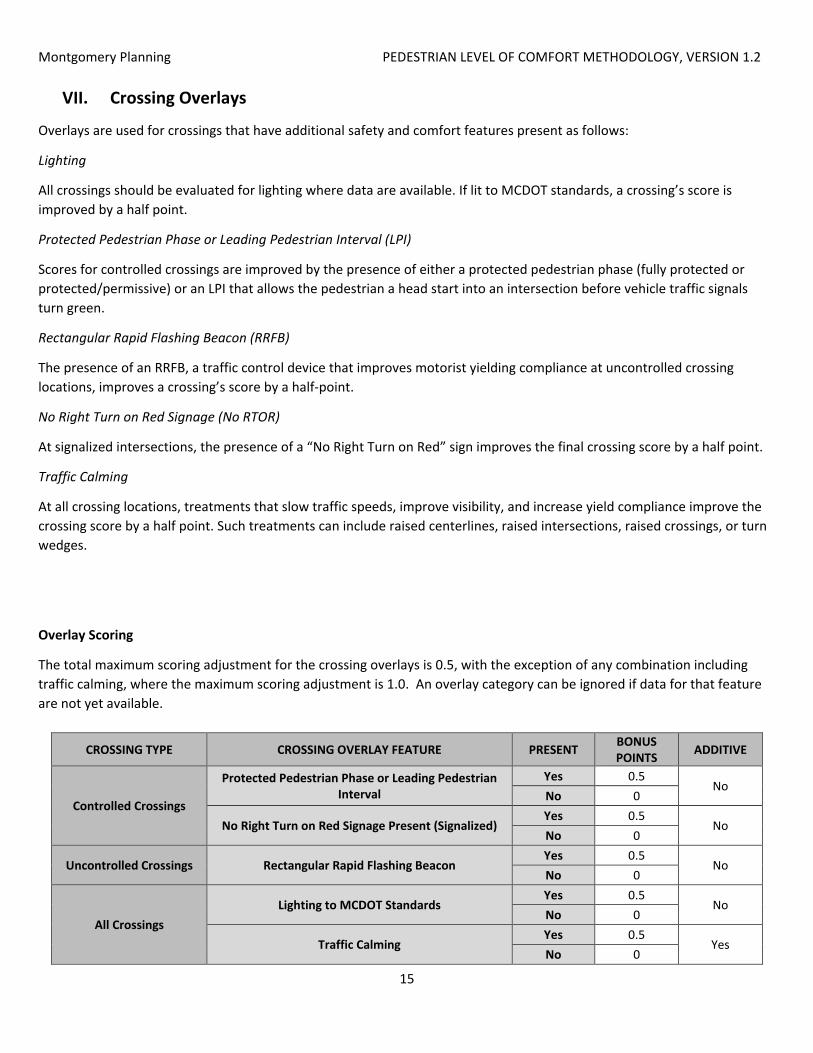
Overlay Scoring
The total maximum scoring adjustment for the crossing overlays is 0.5, with the exception of any combination including traffic calming, where the maximum scoring adjustment is 1.0. An overlay category can be ignored if data for that feature are not yet available.
CROSSING TYPE CROSSING OVERLAY FEATURE PRESENT BONUS POINTS ADDITIVE
Controlled Crossings
Protected Pedestrian Phase or Leading Pedestrian Interval
Yes 0.5 No
No 0
No Right Turn on Red Signage Present (Signalized) Yes 0.5
No No 0
Uncontrolled Crossings Rectangular Rapid Flashing Beacon Yes 0.5
No No 0
All Crossings Lighting to MCDOT Standards
Yes 0.5 No
No 0
Traffic Calming Yes 0.5
Yes No 0

Montgomery Planning PEDESTRIAN LEVEL OF COMFORT METHODOLOGY, VERSION 1.2
16
VIII. Accessibility Evaluation
In addition to the PLOC evaluation, an accessibility evaluation is recommended for both street blocks and crossings. If a street block or crossing has a score of greater than zero, it may have accessibility issues that need to be addressed.
ADA CONDITION YES/NO SCORE NOTES
Street Block (Score each segment)
Pathway is under 5’ wide Yes 1
Sum = number of ADA issue categories.
Score of 0 = No known accessibility
issues from available data.
No 0
Trip hazards of 1/4" or greater Yes 1
No 0
Cross slope less than 0% or greater than 2% Yes 1
No 0
Obstruction(s) creating a less than 36”* pedestrian access route (PAR)
Yes 1
No 0
Missing pathway section(s) within segment Yes 1
No 0
Crossings (Score each
crossing direction or crosswalk)
Lacking detectable warning surface (DWS) Yes 1
Sum = number of ADA issue categories.
Score of 0 = No known accessibility
issues from available data.
No 0
Ratio of DWS width / Ramp width is less than 1
Yes 1
No 0
Ramp width is less than 36”** Yes 1
No 0
Ramp slope is less than 0% or greater than 8.33%
Yes 1
No 0
Ramp landing area slope is less than 0% or greater than 2%
Yes 1
No 0
Ramp landing area is less than 5' x 5' Yes 1
No 0
Accessible pushbutton not present (when pedestrian signal is present)
Yes 1
No 0
*Current ADA Standards from the U.S. Department of Justice/Federal Highway Administration (USDOJ)/FHWA) require 36” minimum width for segments (with 60” passing space every 200’ minimum for segments). When adopted, Public Right of Way Accessibility Guidelines (PROWAG) will require a 48” minimum and recommend a 60” width for segments. Obstructions include any fixed object, such as signs, planters, utility poles, tree trunks/pits, etc.
**Current ADA Standards (USDOJ/FHWA) recommend a 48” minimum curb ramp with a minimum of 36” required in locations where space is restricted. PROWAG recommends 48” minimum width for curb ramps at all locations.
Montgomery Planning PEDESTRIAN LEVEL OF COMFORT METHODOLOGY, VERSION 1.2
17
IX. Conclusion
Montgomery County Planning will use the PLOC evaluation and associated connectivity analyses to identify locations in the county with the greatest pedestrian comfort needs and recommend projects to address these needs in collaboration with MCDOT and other relevant jurisdictions. Used in conjunction with the accessibility overlay table and other pedestrian planning and prioritization tools, such as equity emphasis areas, the PLOC methodology provides a powerful tool for Montgomery County to improve pedestrian comfort and make it easier for the county’s residents and visitors to walk.
X. Scoring Examples
The following examples illustrate the PLOC evaluation (including Crossing Overlay score, where applicable) for several pathway and crossing examples in Montgomery County. Examples do not include ADA assessment as the full assessment requires more information than can be gathered using a photo.
Pathway Examples
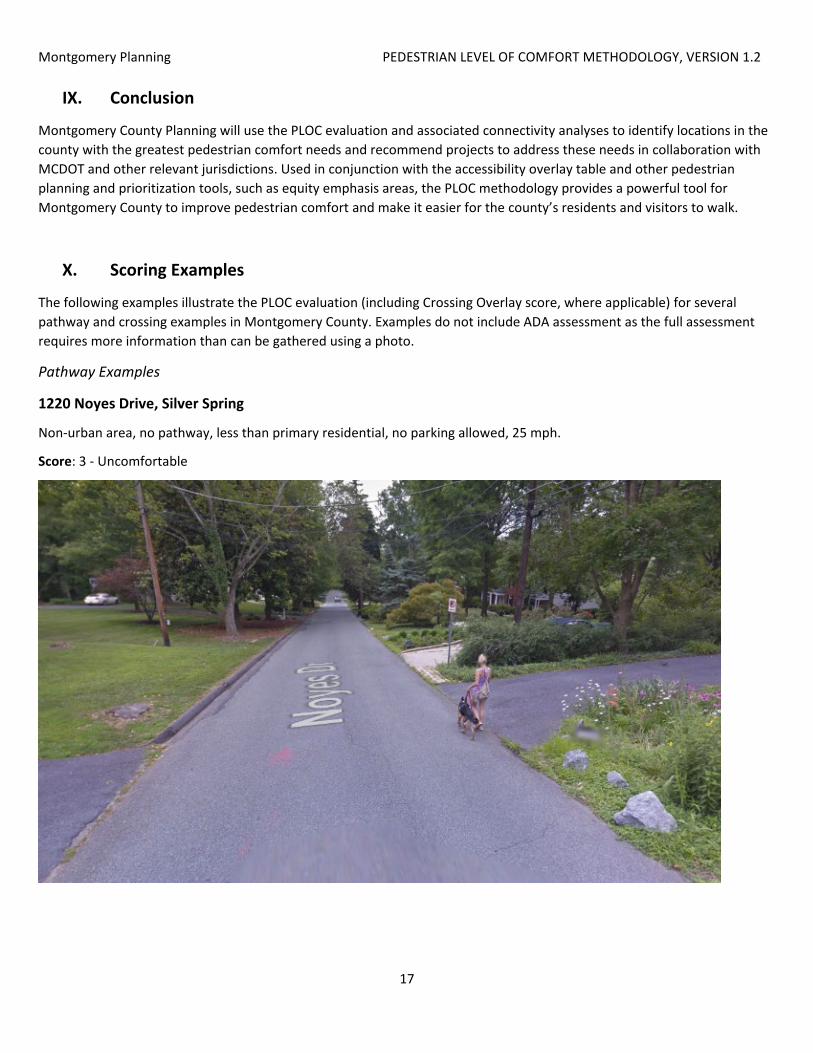
1220 Noyes Drive, Silver Spring
Non-urban area, no pathway, less than primary residential, no parking allowed, 25 mph.
Score: 3 - Uncomfortable
Montgomery Planning PEDESTRIAN LEVEL OF COMFORT METHODOLOGY, VERSION 1.2
18
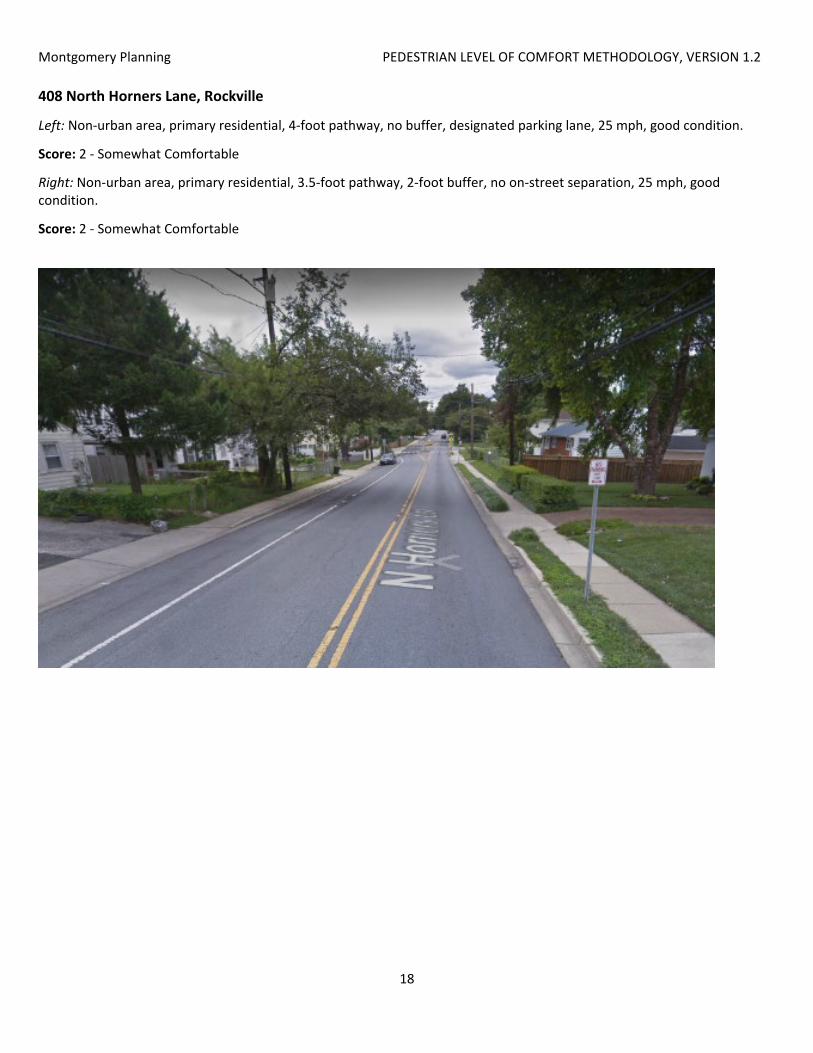
408 North Horners Lane, Rockville
Left: Non-urban area, primary residential, 4-foot pathway, no buffer, designated parking lane, 25 mph, good condition.
Score: 2 - Somewhat Comfortable
Right: Non-urban area, primary residential, 3.5-foot pathway, 2-foot buffer, no on-street separation, 25 mph, good condition.
Score: 2 - Somewhat Comfortable

Montgomery Planning PEDESTRIAN LEVEL OF COMFORT METHODOLOGY, VERSION 1.2
19
Maryland 119 in Gaithersburg
Non-urban area, 8-foot pathway, 5-foot buffer, no parking lane or SBL, 50 mph, good condition.
Score: 3 - Uncomfortable

Montgomery Planning PEDESTRIAN LEVEL OF COMFORT METHODOLOGY, VERSION 1.2
20
898 Silver Spring Avenue, Silver Spring
Urban, 8-foot pathway, 5-foot buffer, striped parking lane, good condition, 25 mph.
Score: 1 - Very Comfortable

Montgomery Planning PEDESTRIAN LEVEL OF COMFORT METHODOLOGY, VERSION 1.2
21
7431 Arlington Road, Bethesda
Left: Urban, 5.5-foot pathway, no buffer, no parking lane or SBL, 30 mph, good condition.
Score: 4 - Undesirable
Right: Urban, 6-foot pathway, no buffer, no parking lane or SBL, 30 mph, fair condition (utility pole obstructions create <36-inch Pedestrian Access Route).
Score: 4 - Undesirable

Montgomery Planning PEDESTRIAN LEVEL OF COMFORT METHODOLOGY, VERSION 1.2
22
Crossing Examples
University Boulevard West and Georgia Avenue, Wheaton
All sides: Signalized, highest posted speed: 35 mph, high-visibility crosswalk, permissive signal phasing, 6+ lanes crossed, raised median.
Score: 3 - Uncomfortable

Montgomery Planning PEDESTRIAN LEVEL OF COMFORT METHODOLOGY, VERSION 1.2
23
Edwin Street and Bluhill Road, Wheaton
Stop controlled, highest posted speed: 25 mph.
All sides: Unmarked crosswalk, two lanes crossed, painted/no median.
Score: 2 - Somewhat Comfortable

Montgomery Planning PEDESTRIAN LEVEL OF COMFORT METHODOLOGY, VERSION 1.2
24
Washington Street and Martins Lane, Rockville
Signalized, highest posted speed: 30 mph.
North and South sides: Standard crosswalk, four lanes crossed, painted/no median.
Score: 3 - Uncomfortable
West side: Standard crosswalk, three lanes crossed, painted/no median.
Score: 1 - Very Comfortable

Montgomery Planning PEDESTRIAN LEVEL OF COMFORT METHODOLOGY, VERSION 1.2
25
Hitching Post Lane & Montrose Road, North Bethesda (facing west)
Signalized, highest posted speed: 40 mph.
Note: This intersection has evidence of pedestrian-scale and overhead lighting; hypothetical scores provided if MCDOT standards are confirmed.
North (right) side: Standard crosswalk, three lanes crossed, painted/no median.
Score: 3 - Uncomfortable
Score (with lighting): 2.5 – Somewhat Uncomfortable
South (left) side: Standard crosswalk, four lanes crossed, painted/no median.
Score: 4 - Undesirable
Score (with lighting): 3.5 – Very Uncomfortable
East (foreground) side: High-visibility crosswalk, seven lanes crossed, raised refuge island.
Score: 3 - Uncomfortable
Score (with lighting): 2.5 - Somewhat Uncomfortable
West (background) side: Standard crosswalk, seven lanes crossed, raised refuge island.
Score: 3 - Uncomfortable
Score (with lighting): 2.5 - Somewhat Uncomfortable
Montgomery Planning PEDESTRIAN LEVEL OF COMFORT METHODOLOGY, VERSION 1.2
26
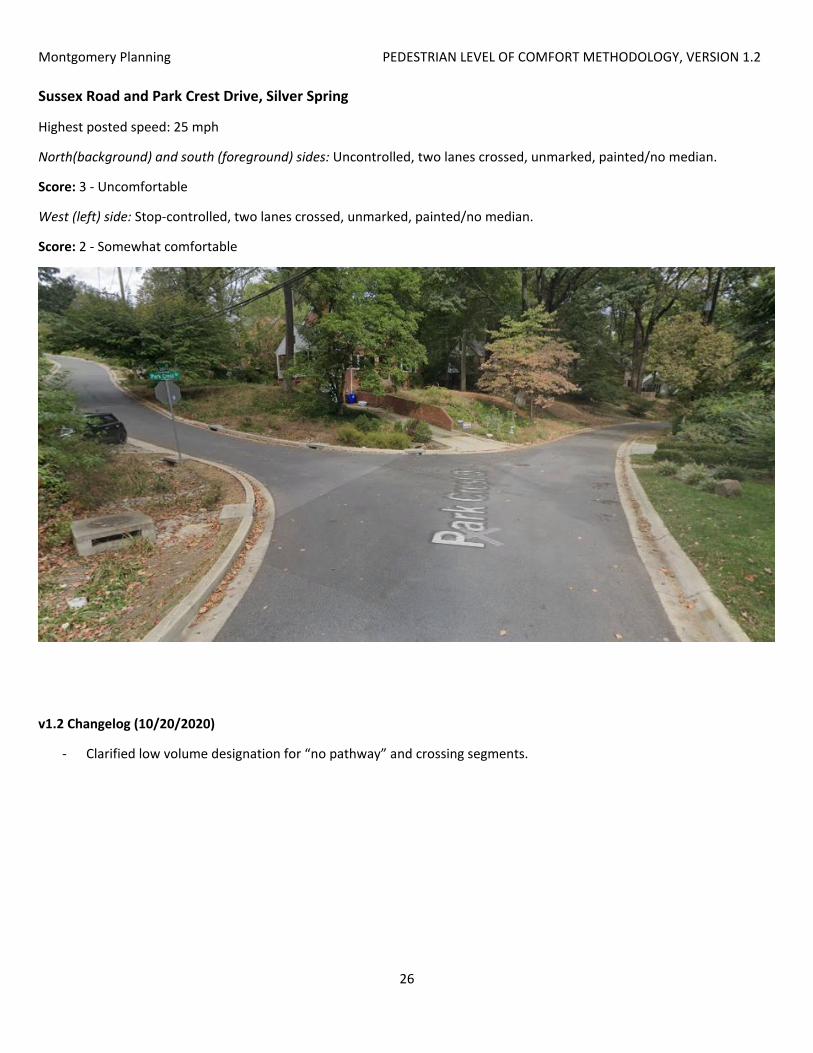
Sussex Road and Park Crest Drive, Silver Spring
Highest posted speed: 25 mph
North(background) and south (foreground) sides: Uncontrolled, two lanes crossed, unmarked, painted/no median.
Score: 3 - Uncomfortable
West (left) side: Stop-controlled, two lanes crossed, unmarked, painted/no median.
Score: 2 - Somewhat comfortable
v1.2 Changelog (10/20/2020)
- Clarified low volume designation for “no pathway” and crossing segments.