peer-reviewed article bioresources...packaging) instead of 3-mm as was done formerly (tee et al....
TRANSCRIPT
PEER-REVIEWED ARTICLE bioresources.com
Tee et al. (2016). “Poly(lactic Acid) with palm oil,” BioResources 11(1), 1518-1540. 1518
Comparative Study of Chemical, Mechanical, Thermal, and Barrier Properties of Poly(Lactic Acid) Plasticized with Epoxidized Soybean Oil and Epoxidized Palm Oil
Yee Bond Tee,a Rosnita A. Talib,b,c,* Khalina Abdan,d Nyuk Ling Chin,b
Roseliza Kadir Basha,b and Khairul Faezah Md Yunos b
To investigate epoxidized palm oil’s (EPO) potential as plasticizer for poly(lactic acid) (PLA), its plasticizing effect was compared with commercialized epoxidized soybean oil (ESO). The plasticizers were respectively melt-compounded into PLA at 3, 5, 10, and 15 wt.%. As it was aimed for the blends to be characterized towards packaging appropriate for food products, they were hot-pressed into ~0.3-mm sheets, which is the approximate thickness of clamshell packaging. Fourier transform infrared spectroscopy (FTIR) confirmed the plasticizers’ compatibility with PLA. At similar loadings, EPO was superior in reinforcing elongation at break (EAB), thermal, and barrier properties of PLA. The ductility of PLA was notably improved to 50.0% with addition of 3 wt.% of EPO. From thermogravimetric analysis (TGA), PLA/EPO5 improved PLA’s thermal stability, while all PLA/ESO blends reported reduced thermal stability. From differential scanning calorimetry (DSC), the increase in crystallinity and the shifts in enthalpy of fusions in all plasticized blends denoted facilitation of PLA to form thermally stable α-form crystals. The addition of EPO enabled PLA to become highly impermeable to oxygen, which can extend its potential in packaging extensive range of oxygen sensitive food.
Keywords: Poly(lactic acid); Epoxidized oil; Plasticizer; Mechanical properties; Thermal properties;
Barrier properties
Contact information: a: Department of Biotechnology, Faculty of Applied Sciences, UCSI University,
56000 Cheras, Kuala Lumpur, Malaysia; b: Department of Process and Food Engineering, Faculty of
Engineering, Universiti Putra Malaysia, 43400 UPM Serdang, Selangor, Malaysia; c: Halal Products
Research Institute, Universiti Putra Malaysia, 43400 UPM Serdang, Selangor, Malaysia; d: Institute of
Tropical Forestry and Forest Products, Universiti Putra Malaysia, 43400 UPM Serdang, Selangor,
Malaysia;
* Corresponding author: [email protected]
INTRODUCTION
Neat poly(lactic acid) (PLA) can be used for most rigid packaging applications.
However in more extensive areas, especially in the manufacturing of flexible film, PLA is
typically plasticized to widen its melt-processing ability, ductility, and impact properties
(Murariu et al. 2008). Given the appropriate additives used, PLA can be competent in
replacing petroleum-based polymers. For instance with additives to aid the form, fill, and
seal (f/f/s) process, PLA has been productively used in Europe and US to replace
polystyrene for yogurt containers (Mohan 2011a,b).
While petrochemical-based plasticizers such as phthalates can be added and are
indeed critically important in plastic manufacturing especially in the PVC industry, their
high toxicity, which impacts the health and environment, is a major setback (Groshar and
PEER-REVIEWED ARTICLE bioresources.com
Tee et al. (2016). “Poly(lactic Acid) with palm oil,” BioResources 11(1), 1518-1540. 1519
Okkerman 2000; Markarian 2007; Wang et al. 2013). For instance, the compounds
butylbenzylphthalate (BBP), di-(2-ethylhexyl) phthalate (DEHP), and di-n-butylphthalate
(DBP), which were mainly used as softener and plasticizer in toys, packaging materials,
cosmetics, and in the PVC industry were identified as endocrine disruptors (Groshart and
Okkerman, 2000; Markarian 2007).
Acknowledging the risks, efforts to find plasticizing compounds from natural
resources have been escalating. Research on utilizing plant oils as plasticizers, including
studies of rubber seed oil, neem oil, Madhuca oil, olive oil, corn oil, castor oil, soybean oil,
and palm oil, have been picking up recently (Liu et al. 2006; Gamage et al. 2009; Xu and
Qu 2009; Al-Mulla et al. 2010; Chua et al. 2012; Xiong et al. 2013). The benefits of these
alternative plasticizers are definitely lower toxicity (Fenollar et al. 2009), good lubricity,
lower volatility, (Lathi and Mattiason, 2007), low cost, renewable nature, and
biodegradability (Wang et al. 2013).
In the present work, epoxidized soybean oil (ESO) and epoxidized palm oil (EPO)
were compared as bio-sourced plasticizers for PLA. While ESO has long been established
as one of the constituents for industrial production of PVC (HallStar 2007), EPO was more
recently developed and studied as a potential plasticizer (Chieng et al. 2012; Silverajah et
al. 2012; Al-Mulla et al. 2014; Tee et al. 2014). Our previous work reported positive results
whereby EPO toughened and aided the melt-processing of PLA more readily than the
commercially available ESO (Tee et al. 2014). The work continues with the comparison of
ESO- and EPO-plasticized PLA on the basis of chemical, tensile, thermal, and barrier
properties with the aim to present EPO as another sustainable plasticizer alternative to ESO
appropriate for food packaging applications.
EXPERIMENTAL
Materials Poly(lactic acid) resin (Ingeo 2003D, with MFI of 6 g/10 min at 210 oC; D-lactide
of 4 to 4.5%; and a bulk density of 0.85 g cm-3) was purchased from NatureWorks LLC,
USA. A chemically pure grade of epoxidized soybean oil (ESO) (Vikoflex® 7170, with
average molecular weight of 1000 g mol-1; minimum oxirane oxygen of 7.0 % and viscosity
of 420.0 cP at 25 ºC) was provided by Arkema Inc., USA. Epoxidized palm oil (EPO) (with
average molecular weight of 982 g mol-1; minimum oxirane oxygen of 3.23 % and viscosity
of 142.6 cP at 25 ºC) was provided by Advance Oleochemical Technology Division
(AOTD), Malaysian Palm Oil Board (MPOB), Malaysia.
Preparation of Blends The methodology for melt-compounding of 3, 5, 10, and 15 wt.% of ESO or EPO
with PLA was also formerly reported (Tee et al. 2014). Prior to melt-blending, PLA resins
were oven dried at 60 ºC overnight. PLA resins were premixed with ESO or EPO at loading
of 3, 5, 10, and 15 wt.% of PLA and were melt-blended in an internal mixer (Brabender,
Brabender Plastograph EC, Germany) at 170 ºC with a rotor speed of 50 rpm for 15 min.
In view of preparing the blends potentially for food packaging applications, the blends were
hot and cold pressed into ~0.3-mm sheets (which is the typical thickness of clamshell
packaging) instead of 3-mm as was done formerly (Tee et al. 2014). They were pressed
with a hot and cold press machine (Hot and Cold Press Machine, LP-50, Thailand) at
160 ºC for further characterization.
PEER-REVIEWED ARTICLE bioresources.com
Tee et al. (2016). “Poly(lactic Acid) with palm oil,” BioResources 11(1), 1518-1540. 1520
Fourier Transform Infrared Spectroscopy (FTIR) The chemical compositions of ESO- and EPO-plasticized PLA were examined via
FTIR (Perkin Elmer, Spectrum One FT-IR Spectrometer, US) with the attenuated total
reflectance (ATR) technique. The spectra were recorded in absorbance mode with a
resolution of 4 cm-1 in the range of 600 to 4000 cm-1. Ten scans were averaged for each
sample.
Tensile Test Tensile tests were conducted in reference to ASTM D882. Seven rectangular strips
with 100 mm × 15 mm × 0.3 mm dimensions were cut from each sample. Tensile strength,
tensile modulus, and elongation at break were measured using a Universal Testing Machine
(Instron®, Model 4301, US) with a load cell of 1 kN. The test was performed at a cross-
head speed of 5 mm min-1 until tensile failure was detected. The average values of seven
repetitions of each sample were reported with standard error.
Thermogravimetric Analysis (TGA) PLA blends were subjected to thermal analysis using a thermogravimetric analyser
(Perkin Elmer, TGA 7, US). Samples weighing 4 to 10 mg were placed in appropriate pans
and heated from 30 to 600 oC at 10 oC min-1 under a nitrogen atmosphere at a flow rate of
20 mL min-1.
The thermal stability of PLA resins, EPO, and ESO plasticizers during melt-
compounding and hot-pressing was also analysed via TGA. They were heated in isothermal
mode at 170 °C for 20 min under air at flow rate of 20 mL min-1. PLA, PLA/EPO5, and
PLA/ESO5 pallets were heated in isothermal mode at 160 °C for 20 min under air at flow
rate of 20 mL min-1.
Differential Scanning Calorimetry (DSC) PLA blends were subjected to thermal analysis using a differential scanning
calorimeter (Perkin Elmer, DSC 7, USA). Samples weighing 4 to 10 mg were placed in
sample pans and sealed. They were then introduced into the heating cell of the DSC and
heated from 30 to 200 oC at 5 oC min-1 under a nitrogen atmosphere at a flow rate of 10 mL
min-1.
Oxygen Permeability The oxygen transmission rate (OTR) of a sample sheet was acquired in accordance
with ASTM D3985-05 standard using an Oxygen Permeability Analyser (MOCON Inc.,
OpTech®-O2 Platinum, US) at room temperature. A circular sample sheet with 110 mm
diameter was prepared, and 50 cm2 of the surface area was subjected to the test. Before
testing, the sample sheet was sealed with a silicone ring coated with high vacuum grease
within the diffusion chamber. One side of the sheet (test cell at the lower half of the
chamber) was purged with pure nitrogen at flow rate of 10 mL min-1 until 0% of O2 was
confirmed. Then, pure oxygen (99.9%) was continuously purged on the upper half of the
chamber with barometric pressure of 760 mmHg (or 101,325 Pa). The test was stopped
when at least three consecutive transmission rate readings differed by less than 5% were
reported whereby an equilibrium state was presumed to have been reached. Oxygen
permeability (OP) was calculated using Eq. 1 where ΔPO2 was taken as 101,325 Pa as the
PEER-REVIEWED ARTICLE bioresources.com
Tee et al. (2016). “Poly(lactic Acid) with palm oil,” BioResources 11(1), 1518-1540. 1521
O2 pressure on the N2 side of the sheet was assumed to be zero (Ayranci and Tunc 2003).
The average values three repetitions of each sample were reported with standard error,
(1)
where OP is the oxygen permeability [m3 m m-2 s-1 Pa-1]; OTR is the oxygen transmission
rate [mL m-2 day-1]; ∆PO2 is the oxygen pressure difference across the sheet [Pa]; and x is
the thickness of sheet [m].
Water Vapour Permeability The water vapour transmission rate (WVTR) of a sample sheet was acquired in
accordance to ASTM F1249-06 using Water Vapour Permeability Analyser (Permatran
W3/31, MOCON Inc., US). A circular sample sheet with 110 mm diameter was prepared,
and 50 cm2 of the surface area was subjected to the test. Before testing, the sheet was sealed
with a silicone ring coated with high vacuum grease within the diffusion chamber. The
tests were run at 37.8 oC with 90 ± 2% RH at the permeant side, and 0 ± 2% RH at the test
cell, and the tests were stopped when at least three consecutive transmission rate readings
differed by less than 5% and were reported where an equilibrium state was presumed
reached. Water vapour permeability (WVP) was calculated using Eq. 2 whereby the water
vapour pressure, Pw at 37.8 oC was 6545 Pa (Carvalho and Grosso 2004; Cao et al. 2009).
The calculated average values of three repetitions of each sample were reported with
standard error,
(2)
where WVP is the water vapour permeability [kg m m-2 s-1 Pa-1]; WVTR is the water vapour
transmission rate [g m-2 day-1]; Pw is the water vapour pressure at temperature during the
experiment [Pa]; x is the thickness of sheet [m]; and RH1-RH2 is the relative humidity
gradient used in the experiment.
Morphology Characterization The morphologies of tensile fracture surface of sample sheet were observed using
a variable pressure scanning electron microscope (LEO, 1455VPSEM, England) at an
accelerated voltage of 20 kV. Before scanning, the samples were sputter-coated with gold.
RESULTS AND DISCUSSION
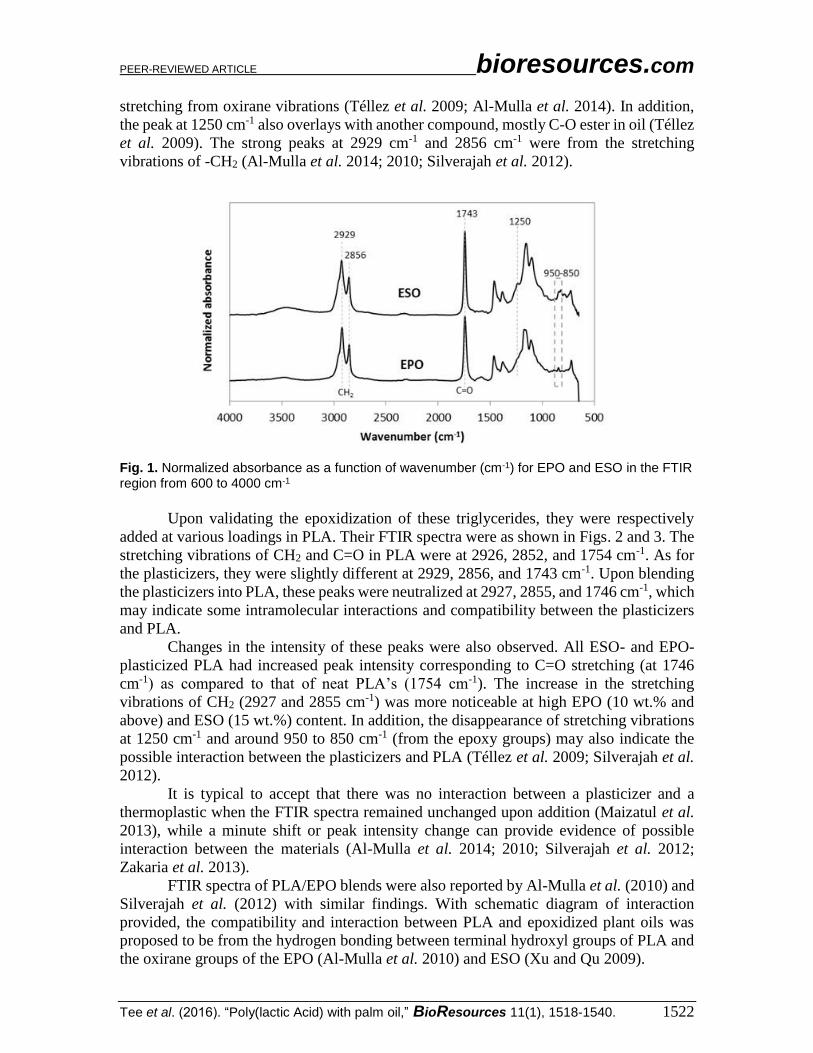
FTIR Spectra The FTIR spectra of EPO and ESO plasticizers were compared as shown in Fig. 1.
Both had similar prominent characteristic peaks, which correspond to the ester sites and
epoxy groups (also known as oxirane rings) (C-O-C) in epoxidized oil. Both spectra
displayed a peak at 1743 cm-1, which correspond to the aliphatic -C=O stretching of esters
(Adhvaryu and Erhan 2002; Al-Mulla et al. 2010; Silverajah et al. 2012). The peak at 1250
cm-1, and small intensity vibrations around 950 to 850 cm-1, were indicative of C-O-C
𝑂𝑃 = 𝑂𝑇𝑅 𝑥
∆ 𝑃𝑂2
𝑊𝑉𝑃 =𝑊𝑉𝑇𝑅 𝑥
𝑃𝑤(𝑅𝐻1 − 𝑅𝐻2)
PEER-REVIEWED ARTICLE bioresources.com
Tee et al. (2016). “Poly(lactic Acid) with palm oil,” BioResources 11(1), 1518-1540. 1522
stretching from oxirane vibrations (Téllez et al. 2009; Al-Mulla et al. 2014). In addition,
the peak at 1250 cm-1 also overlays with another compound, mostly C-O ester in oil (Téllez
et al. 2009). The strong peaks at 2929 cm-1 and 2856 cm-1 were from the stretching
vibrations of -CH2 (Al-Mulla et al. 2014; 2010; Silverajah et al. 2012).
Fig. 1. Normalized absorbance as a function of wavenumber (cm-1) for EPO and ESO in the FTIR region from 600 to 4000 cm-1
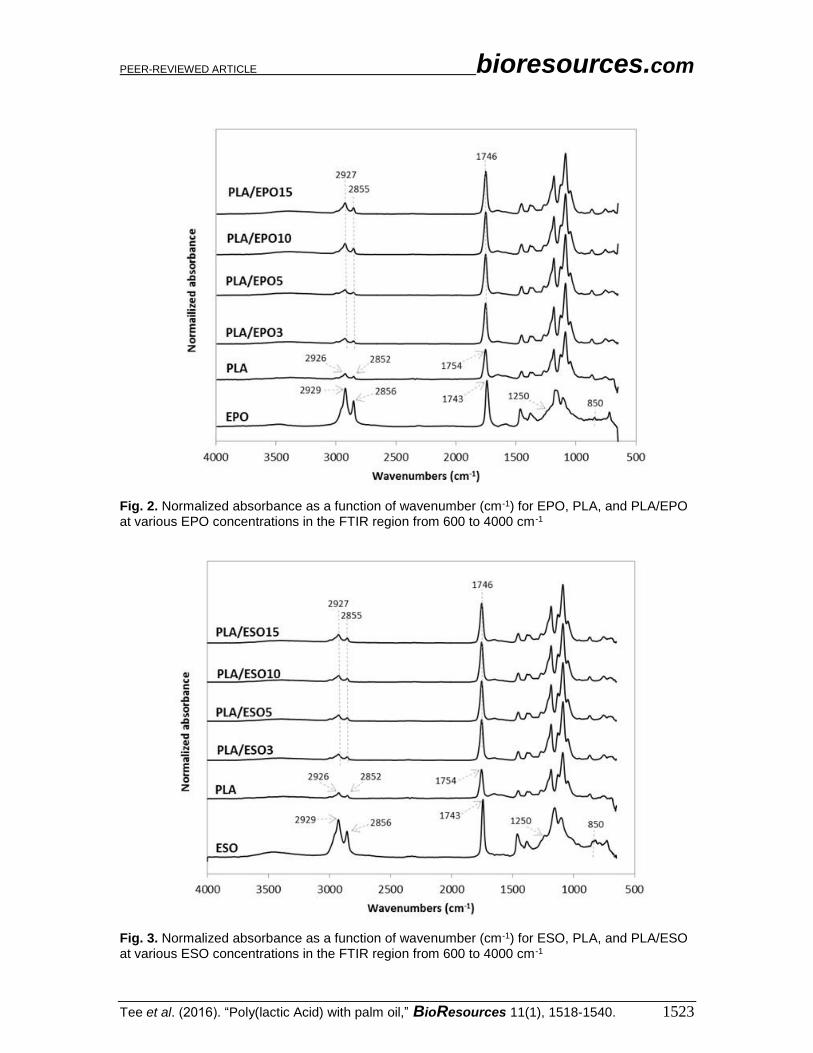
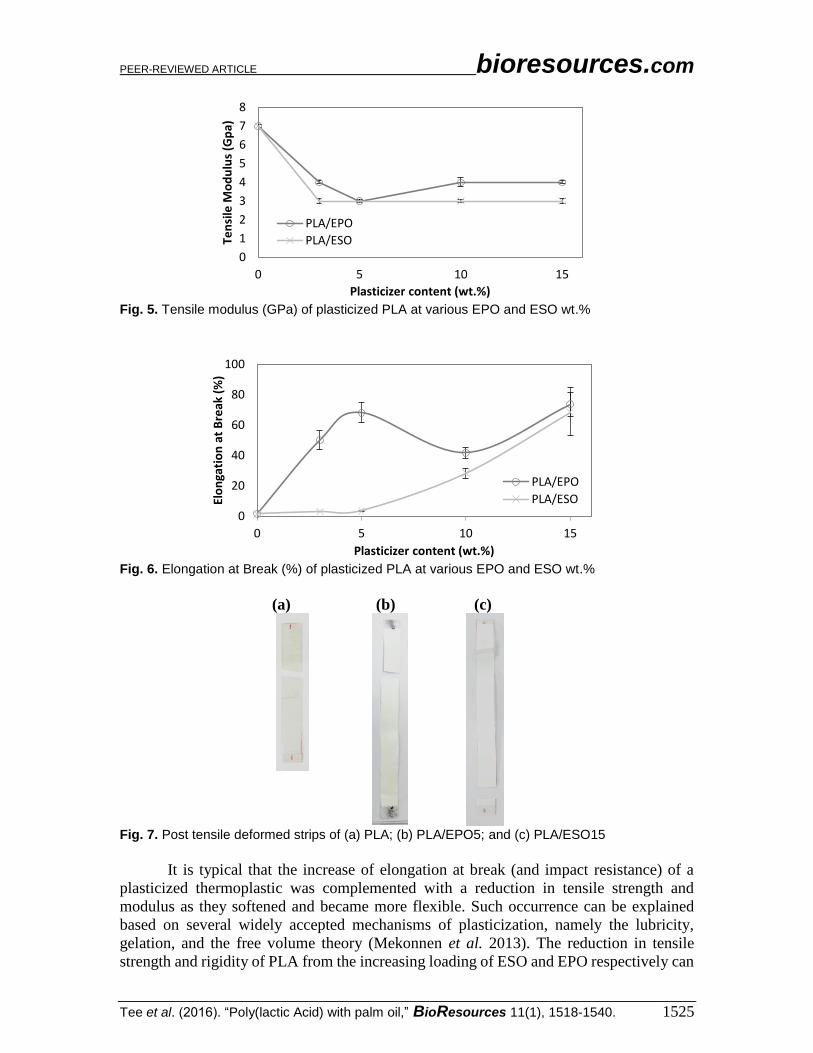
Upon validating the epoxidization of these triglycerides, they were respectively
added at various loadings in PLA. Their FTIR spectra were as shown in Figs. 2 and 3. The
stretching vibrations of CH2 and C=O in PLA were at 2926, 2852, and 1754 cm-1. As for
the plasticizers, they were slightly different at 2929, 2856, and 1743 cm-1. Upon blending
the plasticizers into PLA, these peaks were neutralized at 2927, 2855, and 1746 cm-1, which
may indicate some intramolecular interactions and compatibility between the plasticizers
and PLA.
Changes in the intensity of these peaks were also observed. All ESO- and EPO-
plasticized PLA had increased peak intensity corresponding to C=O stretching (at 1746
cm-1) as compared to that of neat PLA’s (1754 cm-1). The increase in the stretching
vibrations of CH2 (2927 and 2855 cm-1) was more noticeable at high EPO (10 wt.% and
above) and ESO (15 wt.%) content. In addition, the disappearance of stretching vibrations
at 1250 cm-1 and around 950 to 850 cm-1 (from the epoxy groups) may also indicate the
possible interaction between the plasticizers and PLA (Téllez et al. 2009; Silverajah et al.
2012).
It is typical to accept that there was no interaction between a plasticizer and a
thermoplastic when the FTIR spectra remained unchanged upon addition (Maizatul et al.
2013), while a minute shift or peak intensity change can provide evidence of possible
interaction between the materials (Al-Mulla et al. 2014; 2010; Silverajah et al. 2012;
Zakaria et al. 2013).
FTIR spectra of PLA/EPO blends were also reported by Al-Mulla et al. (2010) and
Silverajah et al. (2012) with similar findings. With schematic diagram of interaction
provided, the compatibility and interaction between PLA and epoxidized plant oils was
proposed to be from the hydrogen bonding between terminal hydroxyl groups of PLA and
the oxirane groups of the EPO (Al-Mulla et al. 2010) and ESO (Xu and Qu 2009).
PEER-REVIEWED ARTICLE bioresources.com
Tee et al. (2016). “Poly(lactic Acid) with palm oil,” BioResources 11(1), 1518-1540. 1523
Fig. 2. Normalized absorbance as a function of wavenumber (cm-1) for EPO, PLA, and PLA/EPO at various EPO concentrations in the FTIR region from 600 to 4000 cm-1
Fig. 3. Normalized absorbance as a function of wavenumber (cm-1) for ESO, PLA, and PLA/ESO at various ESO concentrations in the FTIR region from 600 to 4000 cm-1

PEER-REVIEWED ARTICLE bioresources.com
Tee et al. (2016). “Poly(lactic Acid) with palm oil,” BioResources 11(1), 1518-1540. 1524
Tensile Properties For comparison, the trend with tensile strength, modulus, and elongation at break
at increasing EPO and ESO loadings in PLA were respectively plotted as shown in Figs. 4
to 6. As shown in Fig. 4, both EPO and ESO caused gradual decrease in tensile strength of
PLA as the loading increased. In the case of EPO the tensile strength values decreased to a
greater extent. At low loading of 3 and 5 wt.% of ESO, statistically there were no
significant differences in tensile strength as compared to PLA. As for the higher loading of
ESO and all loadings of EPO, their addition into PLA caused significant decrease in tensile
strength of PLA at 47 MPa, to the lowest at 28 MPa for PLA/ESO15, and 30 MPa for
PLA/EPO15.
Fig. 4. Tensile strength (MPa) of plasticized PLA at various EPO and ESO wt.%
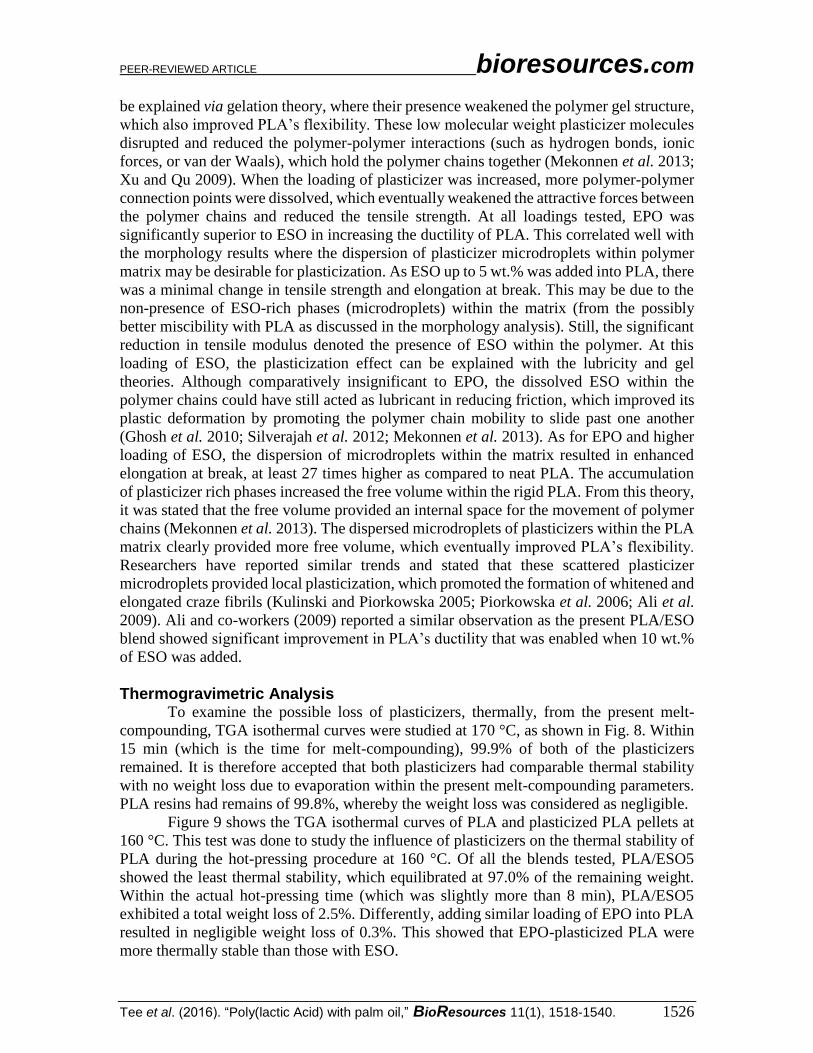
As shown in Fig. 5, PLA with tensile modulus of 7 GPa was significantly reduced
and remained constant at 3 to 4 GPa despite increasing the loading of added respective
plasticizers. The drop in tensile modulus indicated an increase in samples’ flexibility.
Correspondingly, an apparent increase in elongation at break was reported. From Fig. 6,
the increase in elongation at break or ductility of ESO-plasticized PLA at increasing ESO
loading was exponential. At low loading of 3 and 5 wt.%, the increases in elongation at
break were little, and these findings were consistent with the insignificant decrease in
tensile strength. As ESO loading increased up to 15 wt.%, the blend turned ductile with
elongation at break of 68.6%. Nevertheless, it should be noted that a marked standard error
at ±15.79 was also reported. Comparatively, EPO was superior in improving the ductility
of PLA for all loadings tested. Even at 3 wt.%, PLA/EPO3 exhibited approximately 16
times higher elongation at break (50.0%) as compared to PLA/ESO3’s (3.1%). That aside,
comparable elongation at break with PLA/ESO15 was achieved with addition of only 5
wt.% of EPO in PLA with a noticeably lower standard error (68.2% (± 6.41)). The change
in elasticity upon addition of both plasticizers in PLA samples can be observed in Fig. 7
(b) and (c), where the tensile deformed strips exhibited stress whitening and appeared more
elongated as compared to the rigid PLA strip (Fig. 7 (a)). This was due to the enhanced
straining of craze fibrils from the local plasticization of ESO- and EPO-rich phases within
the matrix.
20
25
30
35
40
45
50
0 5 10 15
Ten
sile
Str
en
gth
(M
pa)
Plasticizer content (wt%)
PLA/EPO
PLA/ESO
PEER-REVIEWED ARTICLE bioresources.com
Tee et al. (2016). “Poly(lactic Acid) with palm oil,” BioResources 11(1), 1518-1540. 1525
Fig. 5. Tensile modulus (GPa) of plasticized PLA at various EPO and ESO wt.%
Fig. 6. Elongation at Break (%) of plasticized PLA at various EPO and ESO wt.%
(a)
(b)
(c)
Fig. 7. Post tensile deformed strips of (a) PLA; (b) PLA/EPO5; and (c) PLA/ESO15
It is typical that the increase of elongation at break (and impact resistance) of a
plasticized thermoplastic was complemented with a reduction in tensile strength and
modulus as they softened and became more flexible. Such occurrence can be explained
based on several widely accepted mechanisms of plasticization, namely the lubricity,
gelation, and the free volume theory (Mekonnen et al. 2013). The reduction in tensile
strength and rigidity of PLA from the increasing loading of ESO and EPO respectively can
0
1
2
3
4
5
6
7
8
0 5 10 15
Ten
sile
Mo
du
lus
(Gp
a)
Plasticizer content (wt.%)
PLA/EPO
PLA/ESO
0
20
40
60
80
100
0 5 10 15
Elo
nga
tio
n a
t B
reak
(%
)
Plasticizer content (wt.%)
PLA/EPO
PLA/ESO
PEER-REVIEWED ARTICLE bioresources.com
Tee et al. (2016). “Poly(lactic Acid) with palm oil,” BioResources 11(1), 1518-1540. 1526
be explained via gelation theory, where their presence weakened the polymer gel structure,
which also improved PLA’s flexibility. These low molecular weight plasticizer molecules
disrupted and reduced the polymer-polymer interactions (such as hydrogen bonds, ionic
forces, or van der Waals), which hold the polymer chains together (Mekonnen et al. 2013;
Xu and Qu 2009). When the loading of plasticizer was increased, more polymer-polymer
connection points were dissolved, which eventually weakened the attractive forces between
the polymer chains and reduced the tensile strength. At all loadings tested, EPO was
significantly superior to ESO in increasing the ductility of PLA. This correlated well with
the morphology results where the dispersion of plasticizer microdroplets within polymer
matrix may be desirable for plasticization. As ESO up to 5 wt.% was added into PLA, there
was a minimal change in tensile strength and elongation at break. This may be due to the
non-presence of ESO-rich phases (microdroplets) within the matrix (from the possibly
better miscibility with PLA as discussed in the morphology analysis). Still, the significant
reduction in tensile modulus denoted the presence of ESO within the polymer. At this
loading of ESO, the plasticization effect can be explained with the lubricity and gel
theories. Although comparatively insignificant to EPO, the dissolved ESO within the
polymer chains could have still acted as lubricant in reducing friction, which improved its
plastic deformation by promoting the polymer chain mobility to slide past one another
(Ghosh et al. 2010; Silverajah et al. 2012; Mekonnen et al. 2013). As for EPO and higher
loading of ESO, the dispersion of microdroplets within the matrix resulted in enhanced
elongation at break, at least 27 times higher as compared to neat PLA. The accumulation
of plasticizer rich phases increased the free volume within the rigid PLA. From this theory,
it was stated that the free volume provided an internal space for the movement of polymer
chains (Mekonnen et al. 2013). The dispersed microdroplets of plasticizers within the PLA
matrix clearly provided more free volume, which eventually improved PLA’s flexibility.
Researchers have reported similar trends and stated that these scattered plasticizer
microdroplets provided local plasticization, which promoted the formation of whitened and
elongated craze fibrils (Kulinski and Piorkowska 2005; Piorkowska et al. 2006; Ali et al.
2009). Ali and co-workers (2009) reported a similar observation as the present PLA/ESO
blend showed significant improvement in PLA’s ductility that was enabled when 10 wt.%
of ESO was added.
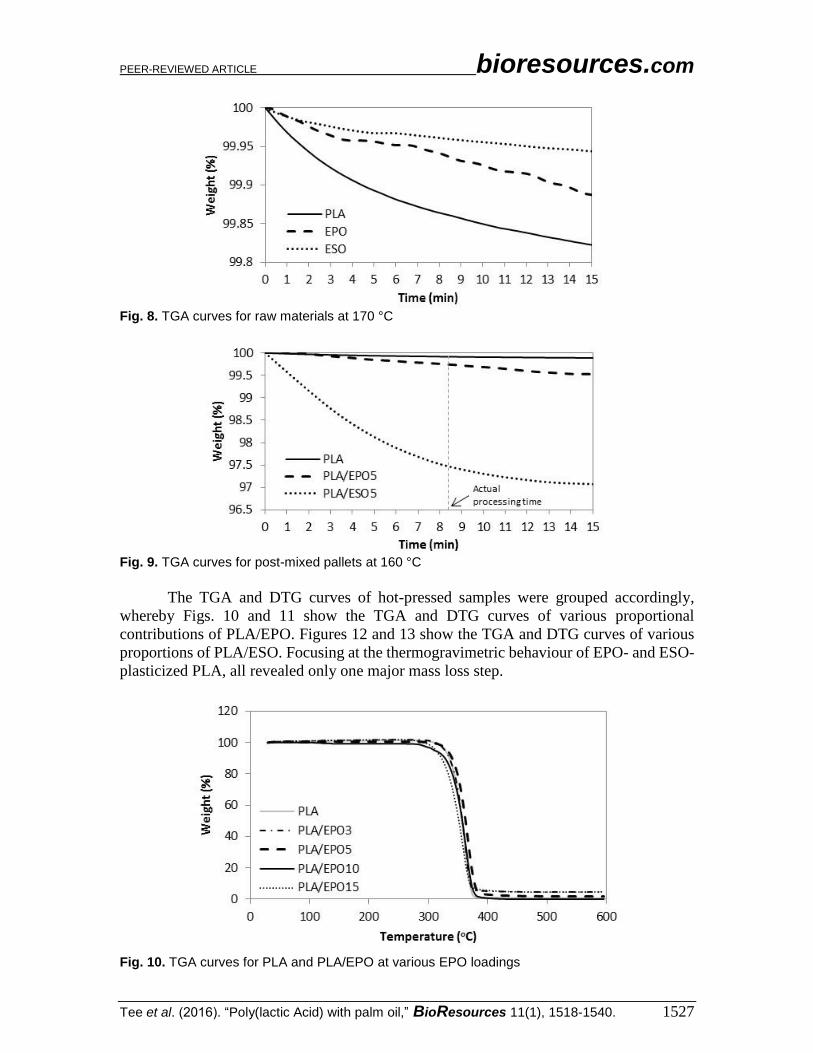
Thermogravimetric Analysis To examine the possible loss of plasticizers, thermally, from the present melt-
compounding, TGA isothermal curves were studied at 170 °C, as shown in Fig. 8. Within
15 min (which is the time for melt-compounding), 99.9% of both of the plasticizers
remained. It is therefore accepted that both plasticizers had comparable thermal stability
with no weight loss due to evaporation within the present melt-compounding parameters.
PLA resins had remains of 99.8%, whereby the weight loss was considered as negligible.
Figure 9 shows the TGA isothermal curves of PLA and plasticized PLA pellets at
160 °C. This test was done to study the influence of plasticizers on the thermal stability of
PLA during the hot-pressing procedure at 160 °C. Of all the blends tested, PLA/ESO5
showed the least thermal stability, which equilibrated at 97.0% of the remaining weight.
Within the actual hot-pressing time (which was slightly more than 8 min), PLA/ESO5
exhibited a total weight loss of 2.5%. Differently, adding similar loading of EPO into PLA
resulted in negligible weight loss of 0.3%. This showed that EPO-plasticized PLA were
more thermally stable than those with ESO.
PEER-REVIEWED ARTICLE bioresources.com
Tee et al. (2016). “Poly(lactic Acid) with palm oil,” BioResources 11(1), 1518-1540. 1527
Fig. 8. TGA curves for raw materials at 170 °C
Fig. 9. TGA curves for post-mixed pallets at 160 °C
The TGA and DTG curves of hot-pressed samples were grouped accordingly,
whereby Figs. 10 and 11 show the TGA and DTG curves of various proportional
contributions of PLA/EPO. Figures 12 and 13 show the TGA and DTG curves of various
proportions of PLA/ESO. Focusing at the thermogravimetric behaviour of EPO- and ESO-
plasticized PLA, all revealed only one major mass loss step.
Fig. 10. TGA curves for PLA and PLA/EPO at various EPO loadings
PEER-REVIEWED ARTICLE bioresources.com
Tee et al. (2016). “Poly(lactic Acid) with palm oil,” BioResources 11(1), 1518-1540. 1528
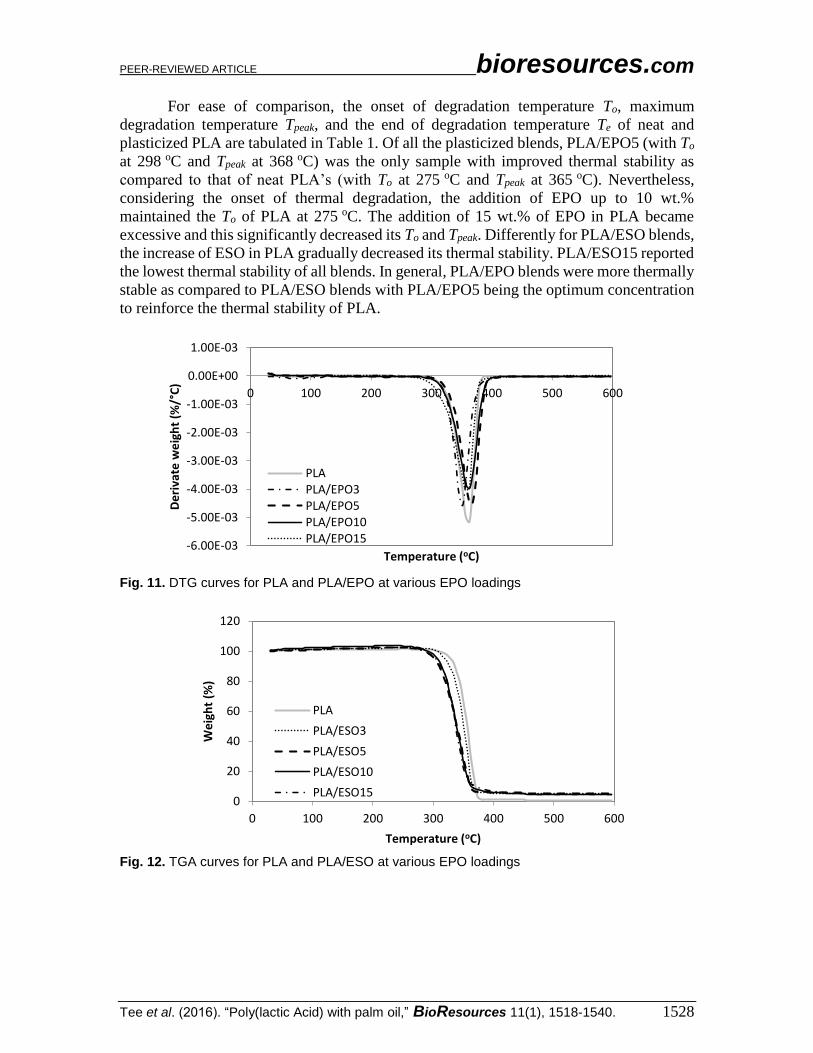
For ease of comparison, the onset of degradation temperature To, maximum
degradation temperature Tpeak, and the end of degradation temperature Te of neat and
plasticized PLA are tabulated in Table 1. Of all the plasticized blends, PLA/EPO5 (with To
at 298 oC and Tpeak at 368 oC) was the only sample with improved thermal stability as
compared to that of neat PLA’s (with To at 275 oC and Tpeak at 365 oC). Nevertheless,
considering the onset of thermal degradation, the addition of EPO up to 10 wt.%
maintained the To of PLA at 275 oC. The addition of 15 wt.% of EPO in PLA became
excessive and this significantly decreased its To and Tpeak. Differently for PLA/ESO blends,
the increase of ESO in PLA gradually decreased its thermal stability. PLA/ESO15 reported
the lowest thermal stability of all blends. In general, PLA/EPO blends were more thermally
stable as compared to PLA/ESO blends with PLA/EPO5 being the optimum concentration
to reinforce the thermal stability of PLA.
Fig. 11. DTG curves for PLA and PLA/EPO at various EPO loadings
Fig. 12. TGA curves for PLA and PLA/ESO at various EPO loadings
-6.00E-03
-5.00E-03
-4.00E-03
-3.00E-03
-2.00E-03
-1.00E-03
0.00E+00
1.00E-03
0 100 200 300 400 500 600
De
riva
te w
eig
ht
(%/°
C)
Temperature (oC)
PLAPLA/EPO3PLA/EPO5PLA/EPO10PLA/EPO15
0
20
40
60
80
100
120
0 100 200 300 400 500 600
We
igh
t (%
)
Temperature (oC)
PLA
PLA/ESO3
PLA/ESO5
PLA/ESO10
PLA/ESO15
PEER-REVIEWED ARTICLE bioresources.com
Tee et al. (2016). “Poly(lactic Acid) with palm oil,” BioResources 11(1), 1518-1540. 1529
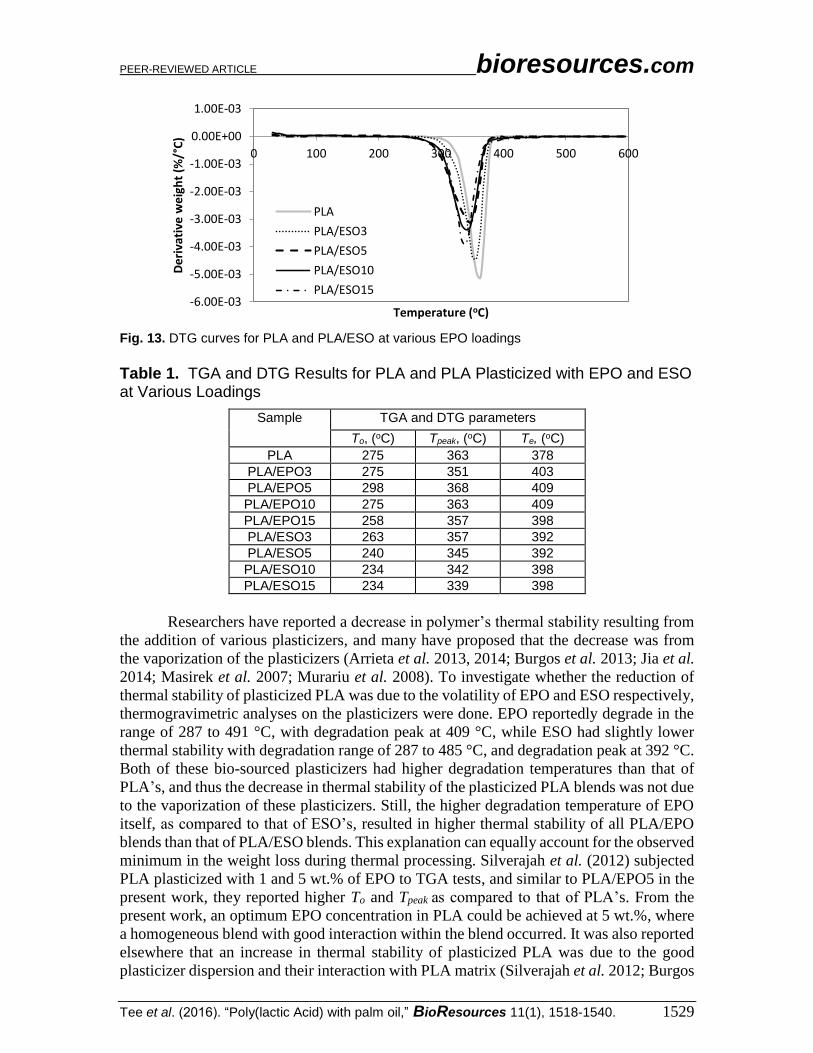
Fig. 13. DTG curves for PLA and PLA/ESO at various EPO loadings
Table 1. TGA and DTG Results for PLA and PLA Plasticized with EPO and ESO at Various Loadings
Sample TGA and DTG parameters
To, (oC) Tpeak, (oC) Te, (oC)
PLA 275 363 378
PLA/EPO3 275 351 403
PLA/EPO5 298 368 409
PLA/EPO10 275 363 409
PLA/EPO15 258 357 398
PLA/ESO3 263 357 392
PLA/ESO5 240 345 392
PLA/ESO10 234 342 398
PLA/ESO15 234 339 398
Researchers have reported a decrease in polymer’s thermal stability resulting from
the addition of various plasticizers, and many have proposed that the decrease was from
the vaporization of the plasticizers (Arrieta et al. 2013, 2014; Burgos et al. 2013; Jia et al.
2014; Masirek et al. 2007; Murariu et al. 2008). To investigate whether the reduction of
thermal stability of plasticized PLA was due to the volatility of EPO and ESO respectively,
thermogravimetric analyses on the plasticizers were done. EPO reportedly degrade in the
range of 287 to 491 °C, with degradation peak at 409 °C, while ESO had slightly lower
thermal stability with degradation range of 287 to 485 °C, and degradation peak at 392 °C.
Both of these bio-sourced plasticizers had higher degradation temperatures than that of
PLA’s, and thus the decrease in thermal stability of the plasticized PLA blends was not due
to the vaporization of these plasticizers. Still, the higher degradation temperature of EPO
itself, as compared to that of ESO’s, resulted in higher thermal stability of all PLA/EPO
blends than that of PLA/ESO blends. This explanation can equally account for the observed
minimum in the weight loss during thermal processing. Silverajah et al. (2012) subjected
PLA plasticized with 1 and 5 wt.% of EPO to TGA tests, and similar to PLA/EPO5 in the
present work, they reported higher To and Tpeak as compared to that of PLA’s. From the
present work, an optimum EPO concentration in PLA could be achieved at 5 wt.%, where
a homogeneous blend with good interaction within the blend occurred. It was also reported
elsewhere that an increase in thermal stability of plasticized PLA was due to the good
plasticizer dispersion and their interaction with PLA matrix (Silverajah et al. 2012; Burgos
-6.00E-03
-5.00E-03
-4.00E-03
-3.00E-03
-2.00E-03
-1.00E-03
0.00E+00
1.00E-03
0 100 200 300 400 500 600
De
riva
tive
we
igh
t (%
/°C
)
Temperature (oC)
PLA
PLA/ESO3
PLA/ESO5
PLA/ESO10
PLA/ESO15
PEER-REVIEWED ARTICLE bioresources.com
Tee et al. (2016). “Poly(lactic Acid) with palm oil,” BioResources 11(1), 1518-1540. 1530
et al. 2013). In addition, the homogeneously dispersed EPO could have acted as a
protective barrier, which deterred the release of volatile degradation products out from the
blend and therefore delayed the degradation (Silverajah et al. 2012; Burgos et al. 2013; Al-
Mulla et al. 2014). It is worth noting that the lowest To recorded at 234 °C (in PLA/ESO
blends) was still acceptable, as it was higher than those used in food processing or
distribution, confirming their thermal stability with no apparent weight loss after
processing (Arrieta et al. 2014).
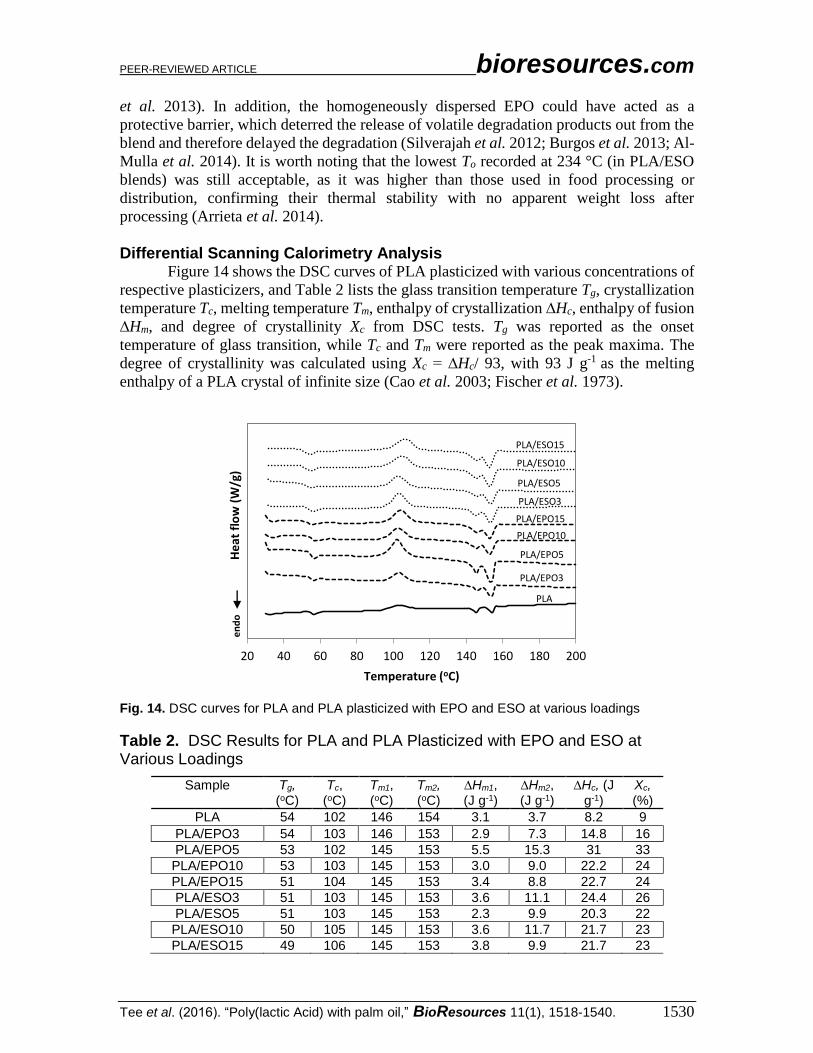
Differential Scanning Calorimetry Analysis Figure 14 shows the DSC curves of PLA plasticized with various concentrations of
respective plasticizers, and Table 2 lists the glass transition temperature Tg, crystallization
temperature Tc, melting temperature Tm, enthalpy of crystallization ∆Hc, enthalpy of fusion
∆Hm, and degree of crystallinity Xc from DSC tests. Tg was reported as the onset
temperature of glass transition, while Tc and Tm were reported as the peak maxima. The
degree of crystallinity was calculated using Xc = ∆Hc/ 93, with 93 J g-1 as the melting
enthalpy of a PLA crystal of infinite size (Cao et al. 2003; Fischer et al. 1973).
Fig. 14. DSC curves for PLA and PLA plasticized with EPO and ESO at various loadings
Table 2. DSC Results for PLA and PLA Plasticized with EPO and ESO at Various Loadings
Sample Tg, (oC)
Tc, (oC)
Tm1, (oC)
Tm2, (oC)
∆Hm1, (J g-1)
∆Hm2, (J g-1)
∆Hc, (J g-1)
Xc, (%)
PLA 54 102 146 154 3.1 3.7 8.2 9
PLA/EPO3 54 103 146 153 2.9 7.3 14.8 16
PLA/EPO5 53 102 145 153 5.5 15.3 31 33
PLA/EPO10 53 103 145 153 3.0 9.0 22.2 24
PLA/EPO15 51 104 145 153 3.4 8.8 22.7 24
PLA/ESO3 51 103 145 153 3.6 11.1 24.4 26
PLA/ESO5 51 103 145 153 2.3 9.9 20.3 22
PLA/ESO10 50 105 145 153 3.6 11.7 21.7 23
PLA/ESO15 49 106 145 153 3.8 9.9 21.7 23
20 40 60 80 100 120 140 160 180 200
He
at f
low
(W
/g)
Temperature (oC)
en
do
PLA
PLA/EPO3
PLA/EPO5
PLA/EPO10
PLA/EPO15
PLA/ESO10
PLA/ESO3
PLA/ESO5
PLA/ESO15
PEER-REVIEWED ARTICLE bioresources.com
Tee et al. (2016). “Poly(lactic Acid) with palm oil,” BioResources 11(1), 1518-1540. 1531
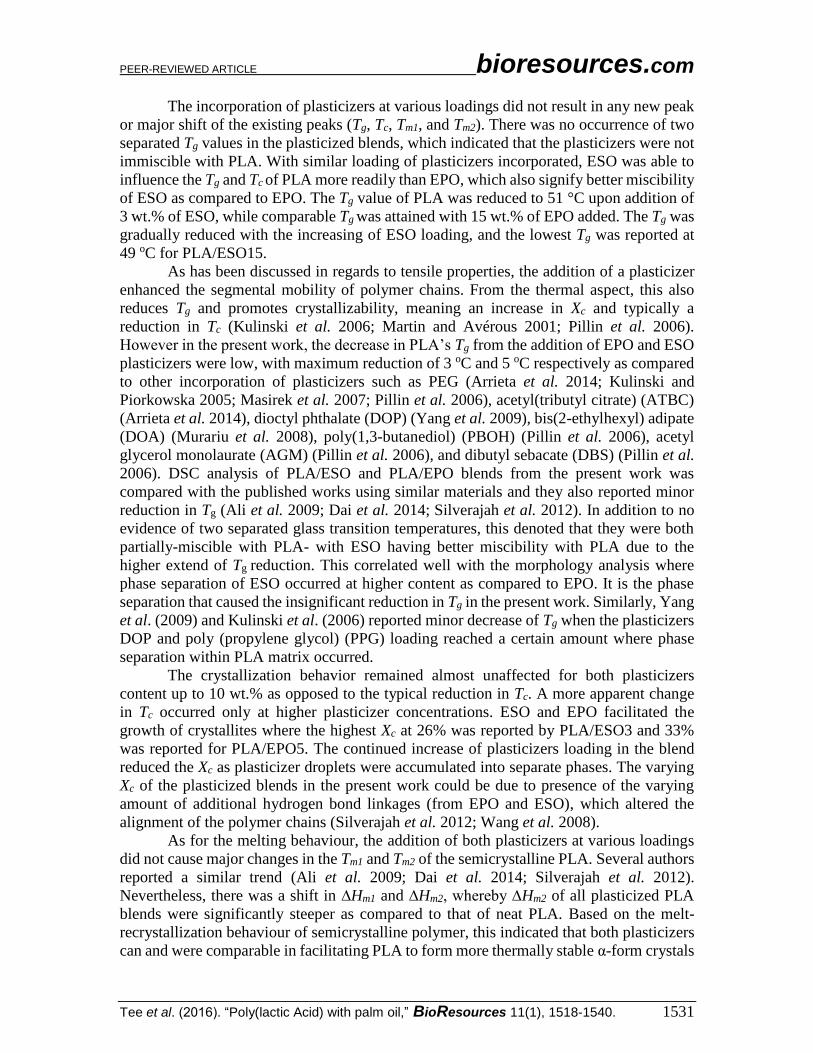
The incorporation of plasticizers at various loadings did not result in any new peak
or major shift of the existing peaks (Tg, Tc, Tm1, and Tm2). There was no occurrence of two
separated Tg values in the plasticized blends, which indicated that the plasticizers were not
immiscible with PLA. With similar loading of plasticizers incorporated, ESO was able to
influence the Tg and Tc of PLA more readily than EPO, which also signify better miscibility
of ESO as compared to EPO. The Tg value of PLA was reduced to 51 °C upon addition of
3 wt.% of ESO, while comparable Tg was attained with 15 wt.% of EPO added. The Tg was
gradually reduced with the increasing of ESO loading, and the lowest Tg was reported at
49 oC for PLA/ESO15.
As has been discussed in regards to tensile properties, the addition of a plasticizer
enhanced the segmental mobility of polymer chains. From the thermal aspect, this also
reduces Tg and promotes crystallizability, meaning an increase in Xc and typically a
reduction in Tc (Kulinski et al. 2006; Martin and Avérous 2001; Pillin et al. 2006).
However in the present work, the decrease in PLA’s Tg from the addition of EPO and ESO
plasticizers were low, with maximum reduction of 3 oC and 5 oC respectively as compared
to other incorporation of plasticizers such as PEG (Arrieta et al. 2014; Kulinski and
Piorkowska 2005; Masirek et al. 2007; Pillin et al. 2006), acetyl(tributyl citrate) (ATBC)
(Arrieta et al. 2014), dioctyl phthalate (DOP) (Yang et al. 2009), bis(2-ethylhexyl) adipate
(DOA) (Murariu et al. 2008), poly(1,3-butanediol) (PBOH) (Pillin et al. 2006), acetyl
glycerol monolaurate (AGM) (Pillin et al. 2006), and dibutyl sebacate (DBS) (Pillin et al.
2006). DSC analysis of PLA/ESO and PLA/EPO blends from the present work was
compared with the published works using similar materials and they also reported minor
reduction in Tg (Ali et al. 2009; Dai et al. 2014; Silverajah et al. 2012). In addition to no
evidence of two separated glass transition temperatures, this denoted that they were both
partially-miscible with PLA- with ESO having better miscibility with PLA due to the
higher extend of Tg reduction. This correlated well with the morphology analysis where
phase separation of ESO occurred at higher content as compared to EPO. It is the phase
separation that caused the insignificant reduction in Tg in the present work. Similarly, Yang
et al. (2009) and Kulinski et al. (2006) reported minor decrease of Tg when the plasticizers
DOP and poly (propylene glycol) (PPG) loading reached a certain amount where phase
separation within PLA matrix occurred.
The crystallization behavior remained almost unaffected for both plasticizers
content up to 10 wt.% as opposed to the typical reduction in Tc. A more apparent change
in Tc occurred only at higher plasticizer concentrations. ESO and EPO facilitated the
growth of crystallites where the highest Xc at 26% was reported by PLA/ESO3 and 33%
was reported for PLA/EPO5. The continued increase of plasticizers loading in the blend
reduced the Xc as plasticizer droplets were accumulated into separate phases. The varying
Xc of the plasticized blends in the present work could be due to presence of the varying
amount of additional hydrogen bond linkages (from EPO and ESO), which altered the
alignment of the polymer chains (Silverajah et al. 2012; Wang et al. 2008).
As for the melting behaviour, the addition of both plasticizers at various loadings
did not cause major changes in the Tm1 and Tm2 of the semicrystalline PLA. Several authors
reported a similar trend (Ali et al. 2009; Dai et al. 2014; Silverajah et al. 2012).
Nevertheless, there was a shift in ∆Hm1 and ∆Hm2, whereby ∆Hm2 of all plasticized PLA
blends were significantly steeper as compared to that of neat PLA. Based on the melt-
recrystallization behaviour of semicrystalline polymer, this indicated that both plasticizers
can and were comparable in facilitating PLA to form more thermally stable α-form crystals
PEER-REVIEWED ARTICLE bioresources.com
Tee et al. (2016). “Poly(lactic Acid) with palm oil,” BioResources 11(1), 1518-1540. 1532
than δ-form crystals without affecting PLA’s melting points (Wasanasuk and Tashiro
2011).
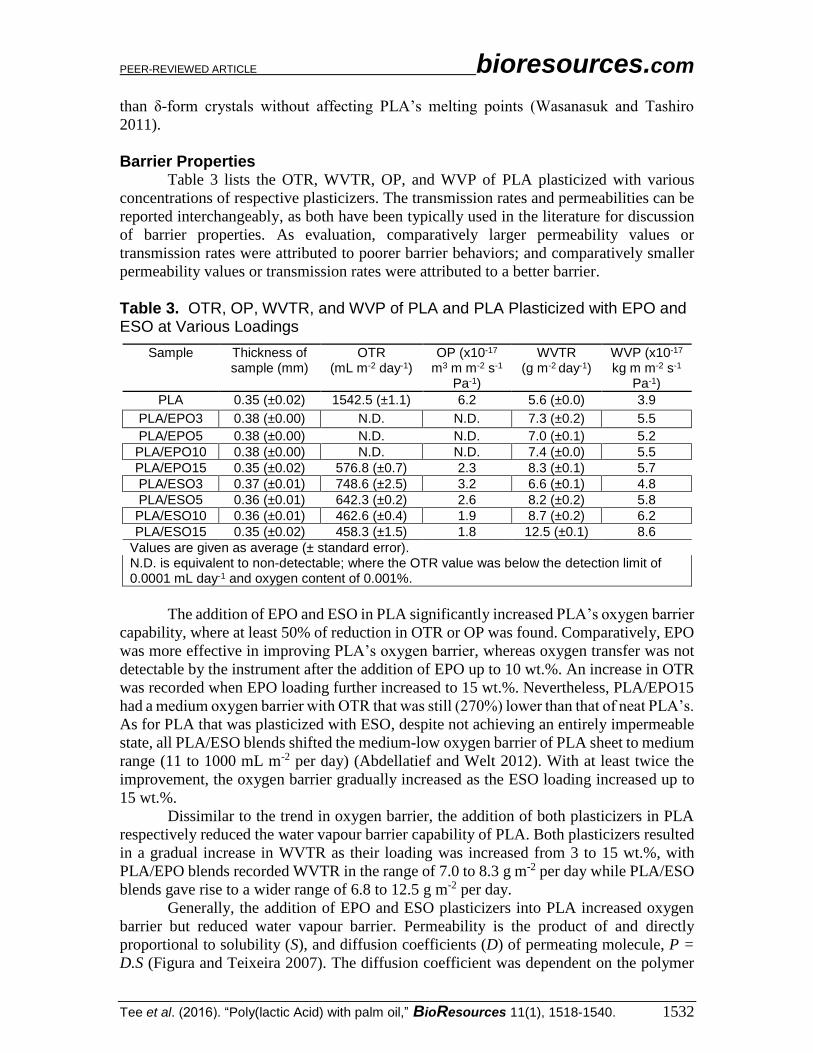
Barrier Properties Table 3 lists the OTR, WVTR, OP, and WVP of PLA plasticized with various
concentrations of respective plasticizers. The transmission rates and permeabilities can be
reported interchangeably, as both have been typically used in the literature for discussion
of barrier properties. As evaluation, comparatively larger permeability values or
transmission rates were attributed to poorer barrier behaviors; and comparatively smaller
permeability values or transmission rates were attributed to a better barrier.
Table 3. OTR, OP, WVTR, and WVP of PLA and PLA Plasticized with EPO and ESO at Various Loadings
Sample Thickness of sample (mm)
OTR (mL m-2 day-1)
OP (x10-17 m3 m m-2 s-1
Pa-1)
WVTR (g m-2 day-1)
WVP (x10-17 kg m m-2 s-1
Pa-1)
PLA 0.35 (±0.02) 1542.5 (±1.1) 6.2 5.6 (±0.0) 3.9
PLA/EPO3 0.38 (±0.00) N.D. N.D. 7.3 (±0.2) 5.5
PLA/EPO5 0.38 (±0.00) N.D. N.D. 7.0 (±0.1) 5.2
PLA/EPO10 0.38 (±0.00) N.D. N.D. 7.4 (±0.0) 5.5
PLA/EPO15 0.35 (±0.02) 576.8 (±0.7) 2.3 8.3 (±0.1) 5.7
PLA/ESO3 0.37 (±0.01) 748.6 (±2.5) 3.2 6.6 (±0.1) 4.8
PLA/ESO5 0.36 (±0.01) 642.3 (±0.2) 2.6 8.2 (±0.2) 5.8
PLA/ESO10 0.36 (±0.01) 462.6 (±0.4) 1.9 8.7 (±0.2) 6.2
PLA/ESO15 0.35 (±0.02) 458.3 (±1.5) 1.8 12.5 (±0.1) 8.6
Values are given as average (± standard error). N.D. is equivalent to non-detectable; where the OTR value was below the detection limit of 0.0001 mL day-1 and oxygen content of 0.001%.
The addition of EPO and ESO in PLA significantly increased PLA’s oxygen barrier
capability, where at least 50% of reduction in OTR or OP was found. Comparatively, EPO
was more effective in improving PLA’s oxygen barrier, whereas oxygen transfer was not
detectable by the instrument after the addition of EPO up to 10 wt.%. An increase in OTR
was recorded when EPO loading further increased to 15 wt.%. Nevertheless, PLA/EPO15
had a medium oxygen barrier with OTR that was still (270%) lower than that of neat PLA’s.
As for PLA that was plasticized with ESO, despite not achieving an entirely impermeable
state, all PLA/ESO blends shifted the medium-low oxygen barrier of PLA sheet to medium
range (11 to 1000 mL m-2 per day) (Abdellatief and Welt 2012). With at least twice the
improvement, the oxygen barrier gradually increased as the ESO loading increased up to
15 wt.%.
Dissimilar to the trend in oxygen barrier, the addition of both plasticizers in PLA
respectively reduced the water vapour barrier capability of PLA. Both plasticizers resulted
in a gradual increase in WVTR as their loading was increased from 3 to 15 wt.%, with
PLA/EPO blends recorded WVTR in the range of 7.0 to 8.3 g m-2 per day while PLA/ESO
blends gave rise to a wider range of 6.8 to 12.5 g m-2 per day.
Generally, the addition of EPO and ESO plasticizers into PLA increased oxygen
barrier but reduced water vapour barrier. Permeability is the product of and directly
proportional to solubility (S), and diffusion coefficients (D) of permeating molecule, P =
D.S (Figura and Teixeira 2007). The diffusion coefficient was dependent on the polymer

PEER-REVIEWED ARTICLE bioresources.com
Tee et al. (2016). “Poly(lactic Acid) with palm oil,” BioResources 11(1), 1518-1540. 1533
structure, which includes its tortuosity and free volume, while the solubility coefficient was
dependent on the permeant’s solubility on a molecular scale (Courgneau et al. 2011). The
epoxidized oils are not water-soluble. Therefore, the increase in WVP was mainly due the
diffusivity of water vapour molecules rather than their solubility. The localized plasticizers
within the matrix increased the polymer chains mobility and free volume, which widened
the interstitial space and thus eased the diffusion of water molecules through the PLA sheet
(Bourtoom 2008; Laboulfie et al. 2013). A quick validation can be done by comparing the
WVTR (or WVP) and morphology analysis between PLA/EPO3 and PLA/ESO3. Notable
microdroplets of EPO were seen dispersed within the matrix of PLA/EPO3 from the
morphology analysis, while it was absent in PLA/ESO3; despite similar plasticizer loading
used. This may correlate with the higher WVTR (or WVP) of PLA/EPO3 sheet as
compared to that of PLA/ESO3, where the higher content of free volume in PLA/EPO3
created more pathways for water vapour diffusion.
A contradicting drop in OP (or OTR) was reported in the present work with the
addition of both epoxidized oils. The drop was so significant that an absolute oxygen
barrier in most of the PLA/EPO blends was achieved, despite repeated examinations.
Addition of both EPO and ESO can extend the potential of PLA in packaging for a wider
range of oxygen sensitive food products. Especially for PLA/EPO blends with
comparatively better barrier properties, their potential may extend to products such as
processed meat packaging (with OTR and WVTR requirement of 3.1 to 15.5 mL m-2 per
day and 3.1 to 7.75 g m-2 per day) and cheese (with OTR and WVTR requirement of 9.3 to
15.5 mL m-2 per day and 1-15.5 g m-2 per day) (Butler and Morris 2013). Similarly,
Srinivasa and co-workers (2007) also reported an opposing trend of an increase in water
vapour permeability with a drastic decrease in oxygen permeability upon plasticizing
chitosan films with PEG and fatty acids. While the increased crystallinity of all plasticized
PLA could have caused restriction to the gas permeation, it was not the only factor. The
trend of crystallinity increasing from the DSC analysis did not entirely agree with that of
OTR of plasticized PLA. The excellent oxygen barrier of the epoxidized oils could have
offset the anticipated reduction in the O2 transmission through PLA from the increased free
volume. The lipids could have packed into the micro-channels or pores of matrix and
obstructed the movement of the gas molecules (Srinivasa et al. 2007). Plasticizing PLA
would have prevented cracks and pores formation on PLA’s surface, which eventually
reduces the channels for gas molecules transmission (García et al. 2000).
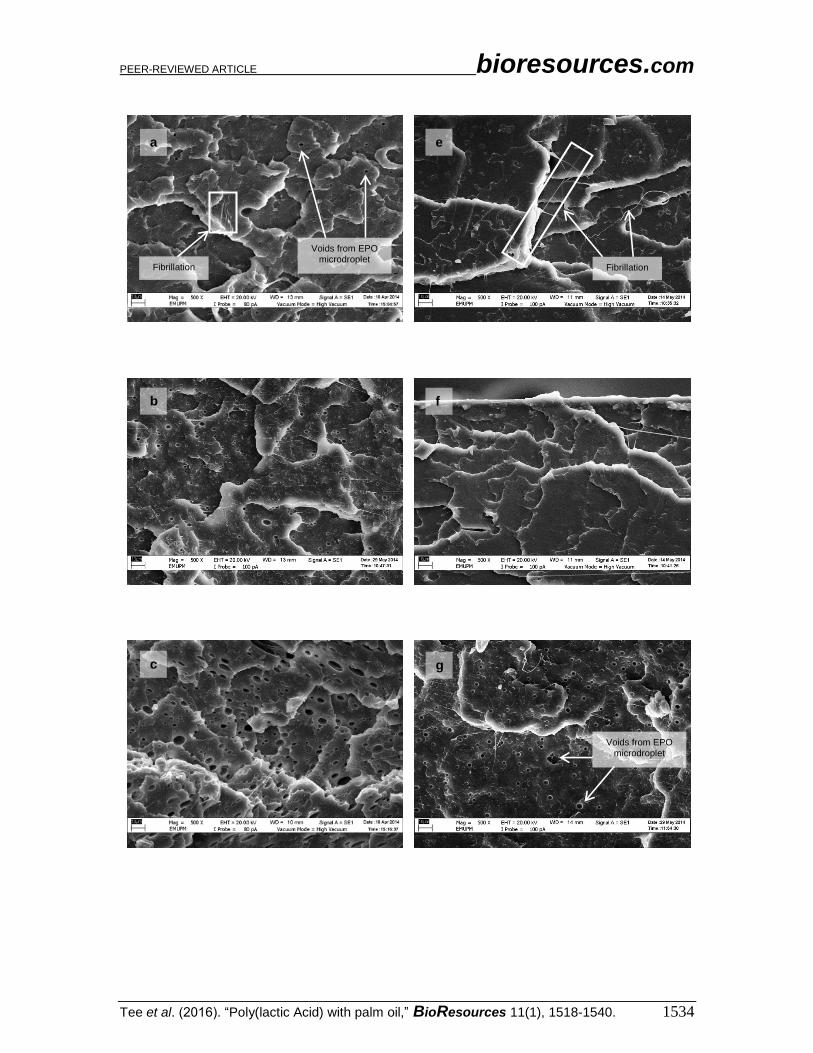
Morphology Characterization Figure 15 shows the micrographs of tensile fracture surfaces of PLA/EPO and
PLA/ESO sheets at various plasticizer loadings. In all blends of plasticized PLA, there
were fibrillations of matrix, or web-like structures of strained matrix, which was not seen
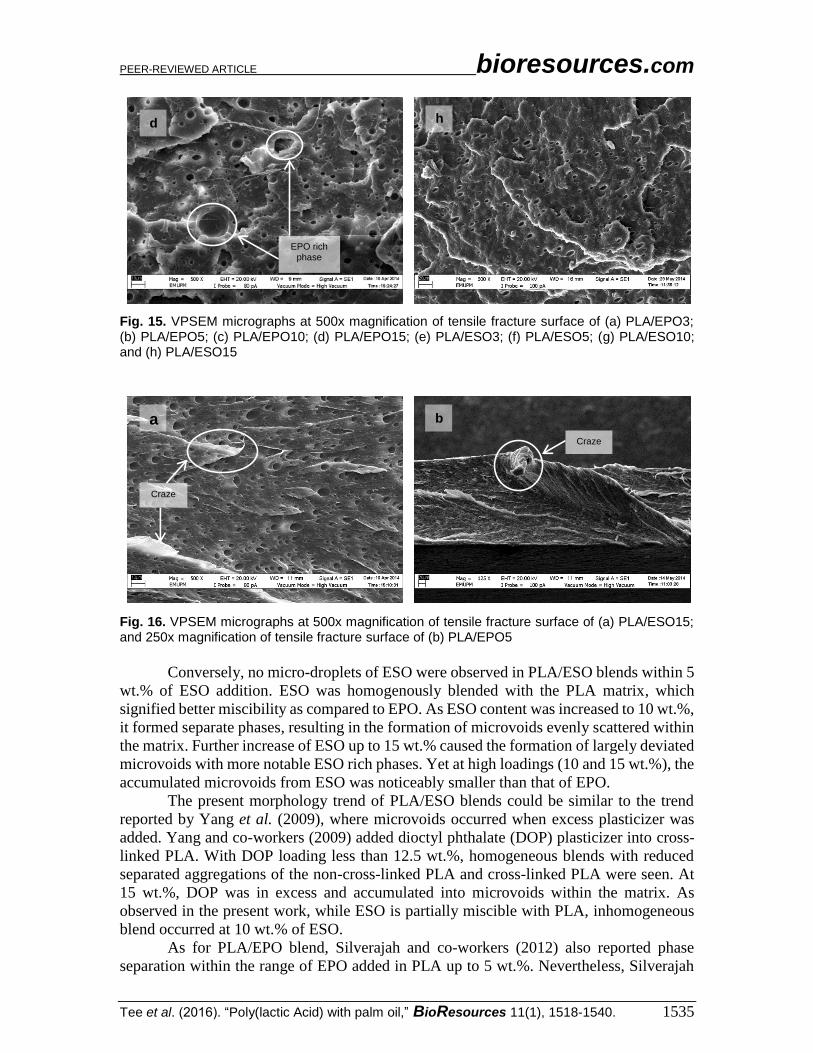
in neat PLA. Figure 16 shows a clearer observation on the improved ductility in plasticized-
PLA. Dense arrays of whitened fibrils known as craze, were seen at the fracture surface
due to straining from tensile test. The crazes were mostly perpendicular to the applied stress
and were inter-dispersed with elongated microvoids.
From the tensile fracture surfaces of all PLA/EPO blends, microvoids were seen
scattered within the matrix. These microvoids, with centres appearing darker than the
matrix, were from the retention of EPO micro-droplets, which were partially removed from
the matrix as it was fractured. At 3 wt.% of EPO in PLA, about 1 µm microvoids were
evenly dispersed within the matrix. As EPO loading increased to 10 wt.% and 15 wt.%, the
size of the microvoids deviated significantly with more discernible EPO rich phases.
PEER-REVIEWED ARTICLE bioresources.com
Tee et al. (2016). “Poly(lactic Acid) with palm oil,” BioResources 11(1), 1518-1540. 1534
a
b
e
f
c g
Voids from EPO microdroplet
Fibrillation Fibrillation
Voids from EPO microdroplet
PEER-REVIEWED ARTICLE bioresources.com
Tee et al. (2016). “Poly(lactic Acid) with palm oil,” BioResources 11(1), 1518-1540. 1535
Fig. 15. VPSEM micrographs at 500x magnification of tensile fracture surface of (a) PLA/EPO3; (b) PLA/EPO5; (c) PLA/EPO10; (d) PLA/EPO15; (e) PLA/ESO3; (f) PLA/ESO5; (g) PLA/ESO10; and (h) PLA/ESO15
Fig. 16. VPSEM micrographs at 500x magnification of tensile fracture surface of (a) PLA/ESO15; and 250x magnification of tensile fracture surface of (b) PLA/EPO5
Conversely, no micro-droplets of ESO were observed in PLA/ESO blends within 5
wt.% of ESO addition. ESO was homogenously blended with the PLA matrix, which
signified better miscibility as compared to EPO. As ESO content was increased to 10 wt.%,
it formed separate phases, resulting in the formation of microvoids evenly scattered within
the matrix. Further increase of ESO up to 15 wt.% caused the formation of largely deviated
microvoids with more notable ESO rich phases. Yet at high loadings (10 and 15 wt.%), the
accumulated microvoids from ESO was noticeably smaller than that of EPO.
The present morphology trend of PLA/ESO blends could be similar to the trend
reported by Yang et al. (2009), where microvoids occurred when excess plasticizer was
added. Yang and co-workers (2009) added dioctyl phthalate (DOP) plasticizer into cross-
linked PLA. With DOP loading less than 12.5 wt.%, homogeneous blends with reduced
separated aggregations of the non-cross-linked PLA and cross-linked PLA were seen. At
15 wt.%, DOP was in excess and accumulated into microvoids within the matrix. As
observed in the present work, while ESO is partially miscible with PLA, inhomogeneous
blend occurred at 10 wt.% of ESO.
As for PLA/EPO blend, Silverajah and co-workers (2012) also reported phase
separation within the range of EPO added in PLA up to 5 wt.%. Nevertheless, Silverajah
d h
\
h
EPO rich phase
Craze
Craze
a b
PEER-REVIEWED ARTICLE bioresources.com
Tee et al. (2016). “Poly(lactic Acid) with palm oil,” BioResources 11(1), 1518-1540. 1536
et al. (2012) have witnessed homogenous blend with no phase separation when 1 wt.% of
EPO was added into PLA. In addition, improvement in elongation at break, impact
strength, and flexural strength were also reported which justified EPO’s presence. From
the present experimental results and other published works as mentioned above, EPO may
have weaker miscibility with PLA as compared to ESO, albeit both were partially miscible.
CONCLUSIONS
1. Commercially available ESO and relatively new EPO were compared as plasticizers
for PLA at various loadings. While being partially miscible to PLA, their inclusion,
which significantly reinforced the ductility of PLA, facilitated the formation of more
thermally stable α-form crystals than δ-form crystals without affecting PLA’s melting
points, and varied PLA’s (oxygen and water vapour) barrier shall widen PLA’s range
in food packaging applications.
2. From all tests, PLA/EPO blends were notably more effective in reinforcement of
properties as compared to equivalent loading of PLA/ESO blends.
3. The particularly high oxygen barrier of PLA/EPO blends may be prospective in
packaging oxygen sensitive foods.
4. Overall, there is the potential of introducing EPO as polymer plasticizer in addition to
the established ESO.
ACKNOWLEDGMENTS
The authors are thankful for the supply of epoxidized soybean oil (Vikoflex® 7170)
from Arkema Inc., USA and epoxidized palm oil from the Advanced Oleochemical
Technology Division (AOTD), Malaysian Palm Oil Board (MPOB), Malaysia. The authors
also acknowledge the Universiti Putra Malaysia (Malaysia) for providing financial support
under grant No. 9199816.
REFERENCES CITED
Abdellatief, A., and Welt, B. A. (2012). “Comparison of new dynamic accumulation
method for measuring oxygen transmission rate of packaging against the steady-state
method described by ASTM D3985,” Packag. Technol. Sci. 26(5), 281-288. DOI:
10.1002/pts.1974
Ali, F., Chang, Y. W., Kang, S. C., and Yoon, J. Y. (2009). “Thermal, mechanical and
rheological properties of poly (lactic acid)/epoxidized soybean oil blends,” Polym.
Bull. 62(1), 91-98. DOI: 10.1007/s00289-008-1012-9
Al-Mulla, E. A. J., Ibrahim, N. A. B., Shameli, K., Ahmad, M. B., and Yunus, W. M. Z.
W. (2014). “Effect of epoxidized palm oil on the mechanical and morphological
properties of a PLA–PCL blend,” Res. Chem. Intermed. 40(2), 689-698. DOI:
10.1007/s11164-012-0994-y
PEER-REVIEWED ARTICLE bioresources.com
Tee et al. (2016). “Poly(lactic Acid) with palm oil,” BioResources 11(1), 1518-1540. 1537
Al-Mulla, E. A. J., Yunus, W. M. Z. W., Ibrahim, N. A. B., and Rahman, M. Z. A.
(2010). “Properties of epoxidized palm oil plasticized polytlactic acid,” J. Mater.
Sci. 45(7), 1942-1946. DOI: 10.1007/s10853-009-4185-1
Arrieta, M. P., López, J., Ferrándiz, S., and Peltzer, M. A. (2013). “Characterization of
PLA-limonene blends for food packaging applications,” Polym. Test. 32(4), 760-768.
DOI: 10.1016/j.polymertesting.2013.03.016
Arrieta, M. P., Samper, M. D., López, J., and Jiménez, A. (2014). “Combined effect of
poly (hydroxybutyrate) and plasticizers on polylactic acid properties for film intended
for food packaging,” J. Polym. Environ. 22(4), 460-470. DOI: 10.1007/s10924-014-
0654-y
Ayranci, E., and Tunc, S. (2003). “A method for the measurement of the oxygen
permeability and the development of edible films to reduce the rate of oxidative
reactions in fresh foods,” Food Chem. 80(3), 423-431. DOI:10.1016/S0308-
8146(02)00485-5
Bourtoom, T. (2008). “Plasticizer effect on the properties of biodegradable blend from
rice starch-chitosan,” Songklanakarin J. Sci. Technol. 30(1), 149-155.
Burgos, N., Martino, V. P., and Jiménez, A. (2013). “Characterization and ageing study
of poly(lactic acid) films plasticized with oligomeric lactic acid,” Polym. Degrad.
Stab. 98(2), 651-658. DOI: 10.1016/j.polymdegradstab.2012.11.009
Butler, T., and Morris, B. A. (2013). “PE based multilayer film structures,” in: Plastic
Films in Food Packaging: Materials, Technology and Applications, S. Ebnesajjad
(ed.), William Andrew Publishing, Oxford. DOI: 10.1016/b978-1-4557-3112-
1.00003-x
Cao, X., Mohamed, A., Gordon, S. H., Willett, J. L., and Sessa, D. J. (2003). “DSC study
of biodegradable poly (lactic acid) and poly (hydroxy ester ether) blends,”
Thermochim. Acta 406(1), 115-127. DOI: 10.1016/S0040-6031(03)00252-1
Cao, N., Yang, X., and Fu, Y. (2009). “Effects of various plasticizers on mechanical and
water vapor barrier properties of gelatin films,” Food Hydrocolloids 23(3), 729-735.
DOI: 10.1016/j.foodhyd.2008.07.017
Carvalho, R. A., and Grosso, C. R. F. (2004). “Characterization of gelatin based films
modified with transglutaminase, glyoxal and formaldehyde,” Food Hydrocolloids.
18(5), 717–726. DOI: 10.1016/j.foodhyd.2003.10.005
Chieng, B. W., Ibrahim, N. A., Wan Yunus, W. M. Z., Hussein, M. Z., and Silverajah, V.
S. (2012). “Graphene nanoplatelets as novel reinforcement filler in poly (lactic
acid)/epoxidized palm oil green nanocomposites: Mechanical properties,” Int. J. Mol.
Sci. 13(9), 10920-10934. DOI: 10.3390/ijms130910920
Chua, S. C., Xu, X., and Guo, Z. (2012). “Emerging sustainable technology for
epoxidation directed toward plant oil-based plasticizers,” Process Biochem. 47(10),
1439-1451. DOI: 10.1016/j.procbio.2012.05.025
Courgneau, C., Domenek, S., Guinault, A., Avérous, L., and Ducruet, V. (2011).
“Analysis of the structure-properties relationships of different multiphase systems
based on plasticized poly (lactic acid),” J. Polym. Environ. 19(2), 362-371. DOI:
10.1007/s10924-011-0285-5
Dai, X., Xiong, Z., Na, H., and Zhu, J. (2014). “How does epoxidized soybean oil
improve the toughness of microcrystalline cellulose filled polylactide acid
composites?” Compos. Sci. Technol. 90, 9-15. DOI:
10.1016/j.compscitech.2013.10.009
PEER-REVIEWED ARTICLE bioresources.com
Tee et al. (2016). “Poly(lactic Acid) with palm oil,” BioResources 11(1), 1518-1540. 1538
Fenollar, O., García, D., Sánchez, L., López, J., and Balart, R. (2009). “Optimization of
the curing conditions of PVC plastisols based on the use of an epoxidized fatty acid
ester plasticizer,” Eur. Polym. J. 45(9), 2674-2684. DOI:
10.1016/j.eurpolymj.2009.05.029
Fischer, E. W., Sterzel, H. J., and Wegner, G. K. Z. Z. (1973). “Investigation of the
structure of solution grown crystals of lactide copolymers by means of chemical
reactions,” Kolloid Z. Z. Polym. 251(11), 980-990. DOI: 10.1007/BF01498927
Figura, L. O., and Teixeira, A. A. (2007). "Permeability,” in: Food Physics (Physical
Properties - Measurement and Applications), Springer-Verlag Berlin Heidelberg,
Berlin.
Gamage, P. K., O’Brien, M., and Karunanayake, L. (2009). “Epoxidation of some
vegetable oils and their hydrolysed products with peroxyformic acid-optimised to
industrial scale,” J. Natl. Sci. Found. Sri Lanka 37, 229-240.
García, M. A., Martino, M. N., and Zaritzky, N. E. (2000). “Lipid addition to improve
barrier properties of edible starch‐based films and coatings,” J. Food Sci. 65(4), 941-
944. DOI: 10.1111/j.1365-2621.2000.tb09397.x
Ghosh, S. B., Bandyopadhyay-Ghosh, S., and Sai, M. (2010). “Composites,” in:
Poly(lactic acid): Synthesis, Structures, Properties, Processing, and Applications, 2nd
Ed., Auras, R., Lim, L. T., Selke, S. E .M., and Tsuji, H. (eds.), John Wiley & Sons,
Hoboken, New Jersey. DOI: 10.1002/9780470649848.ch18
Groshart, C., and Okkerman, P. C. (2000). “Towards the establishment of a priority list of
substances for further evaluation of their role in endocrine disruption,” European
Commission Dg Env. DOI:M0355008/1786Q/10/11/00
HallStar (2007). PLASTHALL® P-550 Plasticizer for Refrigerator Gaskets, HallStar,
(http://www.hallstar.com/techdocs/plasthall_p550_for_refrigerator_gaskets.pdf ).
Jia, P.-Y., Bo, C.-Y., Hu, L-.H., and Zhou, Y.-H. (2014). “Properties of poly(vinyl
alcohol) plasticized by glycerin,” J. For. Prod. Ind. 3(3), 151-153.
Kulinski, Z., and Piorkowska, E. (2005). “Crystallization, structure and properties of
plasticized poly (L-lactide),” Polymer 46(23),10290-10300. DOI:
10.1016/j.polymer.2005.07.101
Kulinski, Z., Piorkowska, E., Gadzinowska, K., and Stasiak, M. (2006). “Plasticization of
poly (L-lactide) with poly (propylene glycol),” Biomacromolecules 7(7), 2128-2135.
DOI: 10.1021/bm060089m
Laboulfie, F., Hemati, M., Lamure, A., and Diguet, S. (2013). “Effect of the plasticizer
on permeability, mechanical resistance and thermal behaviour of composite coating
films,” Powder Technol. 238, 14-19. DOI: 10.1016/j.powtec.2012.07.035
Lathi, P. S., and Mattiasson, B. (2007). “Green approach for the preparation of
biodegradable lubricant base stock from epoxidized vegetable oil,” Appl. Catal. B
69(3), 207-212. DOI: 10.1016/j.apcatb.2006.06.016
Liu, L., Kerry, J. F., and Kerry, J. P. (2006). “Effect of food ingredients and selected
lipids on the physical properties of extruded edible films/casings,” Int. J. Food Sci.
Tech. 41(3), 295-302. DOI: 10.1111/j.1365-2621.2005.01063.x
Maizatul, N., Norazowa, I., Yunus, W. M. Z. W., Khalina, A., and Khalisanni, K. (2013).
“FTIR and TGA analysis of biodegradable poly (lactic acid)/treated kenaf bast fibre:
Effect of plasticizers,” Pertanika J. Sci. Technol. 21(1), 151-160.
Markarian, J. (2007). “PVC additives- What lies ahead?” Plast. Addit. Compd. 9(6), 22-
25. DOI: 10.1016/S1464-391X(07)70153-8
PEER-REVIEWED ARTICLE bioresources.com
Tee et al. (2016). “Poly(lactic Acid) with palm oil,” BioResources 11(1), 1518-1540. 1539
Martin, O., and Averous, L. (2001). “Poly(lactic acid): Plasticization and properties of
biodegradable multiphase systems,” Polymer 42(14), 6209-6219. DOI:
10.1016/S0032-3861(01)00086-6
Masirek, R., Kulinski, Z., Chionna, D., Piorkowska, E., and Pracella, M. (2007).
“Composites of poly(L-lactide) with hemp fibers: Morphology and thermal and
mechanical properties,” J. Appl. Polym. Sci. 105(1), 255-268. DOI:
10.1002/app.26090
Mekonnen, T., Mussone, P., Khalil, H., and Bressler, D. (2013). “Progress in bio-based
plastics and plasticizing modifications,” J. Mater. Chem. A 1(43), 13379-13398. DOI:
10.1039/c3ta12555f
Mohan (2011a). Danone First to Switch to PLA for Yogurt Cup in Germany,
GreenerPackage.com
(http://www.greenerpackage.com/bioplastics/danone_first_switch_pla_yogurt_cup_g
ermany)
Mohan 2011b). PLA Yogurt Cup Project Scrutinized from All Angles,
GreenerPackage.com
(http://www.greenerpackage.com/bioplastics/pla_yogurt_cup_project_scrutinized_all
_angles)
Murariu, M., Ferreira, A. D. S., Alexandre, M., and Dubois, P. (2008). “Polylactide
(PLA) designed with desired end-use properties: 1. PLA compositions with low
molecular weight ester-like plasticizers and related performances,” Polym. Adv.
Technol. 19(6), 636-646. DOI: 10.1002/pat.1131
Pillin, I., Montrelay, N., and Grohens, Y. (2006). “Thermo-mechanical characterization
of plasticized PLA: Is the miscibility the only significant factor?,” Polymer 47(13),
4676-4682. DOI: 10.1016/j.polymer.2006.04.013
Piorkowska, E., Kulinski, Z., Galeski, A., and Masirek, R. (2006). “Plasticization of
semicrystalline poly (L-lactide) with poly (propylene glycol),” Polymer 47(20), 7178-
7188. DOI: 10.1016/j.polymer.2006.03.115
Silverajah, V. S., Ibrahim, N. A., Zainuddin, N., Yunus, W. M. Z. W., and Hassan, H. A.
(2012). “Mechanical, thermal and morphological properties of poly (lactic
acid)/epoxidized palm olein blend,” Molecules 17(10), 11729-11747. DOI:
10.3390/molecules171011729
Srinivasa, P. C., Ramesh, M. N., and Tharanathan, R. N. (2007). “Effect of plasticizers
and fatty acids on mechanical and permeability characteristics of chitosan
films,” Food Hydrocolloids 21(7), 1113-1122. DOI: 10.1016/j.foodhyd.2006.08.005
Tee, Y. B., Talib, R. A., Abdan, K., Chin, N. L., Basha, R. K., and Yunos, K. F. M.
(2014). “Toughening poly(lactic acid) and aiding the melt-compounding with bio-
sourced plasticizers,” Agric. Agric. Sci. Procedia 2, 289-295. DOI:
10.1016/j.aaspro.2014.11.041
Téllez, G. L., Vigueras-Santiago, E., and Hernández-López, S. (2009). “Characterization
of linseed oil epoxidized at different percentages,” Superficies Y Vacío 22(1), 5-10.
Wang, Q., Chen, Y., Tang, J., and Zhang, Z. (2013). “Determination of the solubility
parameter of epoxidized soybean oil by inverse gas chromatography,” J. Macromol.
Sci. Part B 52(10), 1405-1413. DOI: 10.1080/00222348.2013.768870
Wang, Z., Hou, X., Mao, Z., Ye, R., Mo, Y., and Finlow, D. E. (2008). “Synthesis and
characterization of biodegradable poly (lactic acid-co-glycine) via direct melt
copolymerization,” Iran. Polym. J. 17(10), 791-798.
PEER-REVIEWED ARTICLE bioresources.com
Tee et al. (2016). “Poly(lactic Acid) with palm oil,” BioResources 11(1), 1518-1540. 1540
Wasanasuk, K., and Tashiro, K. (2011). “Crystal structure and disorder in Poly (l-lactic
acid) δ form (α′ form) and the phase transition mechanism to the ordered α
form,” Polymer 52(26), 6097-6109. DOI: 10.1016/j.polymer.2011.10.046
Xiong, Z., Yang, Y., Feng, J., Zhang, X., Zhang, C., Tang, Z., and Zhu, J. (2013).
“Preparation and characterization of poly (lactic acid)/starch composites toughened
with epoxidized soybean oil,” Carbohydr. Polym. 92(1), 810-816. DOI:
10.1016/j.carbpol.2012.09.007
Xu, Y. Q., and Qu, J. P. (2009). “Mechanical and rheological properties of epoxidized
soybean oil plasticized poly (lactic acid),” J. Appl. Polym. Sci. 112(6), 3185-3191.
DOI: 10.1002/app.29797
Yang, S. L., Wu, Z. H., Meng, B., and Yang, W. (2009). “The effects of dioctyl phthalate
plasticization on the morphology and thermal, mechanical, and rheological properties
of chemical crosslinked polylactide,” J. Polym. Sci., Part B: Polym. Phys. 47(12),
1136-1145. DOI: 10.1002/polb.21716
Zakaria, Z., Islam, M. S., Hassan, A., Mohamad Haafiz, M. K., Arjmandi, R., Inuwa, I.
M., and Hasan, M. (2013). “Mechanical properties and morphological
characterization of PLA/chitosan/epoxidized natural rubber composites,” Adv. Mater.
Sci. Eng. 2013, 1-7. DOI: 10.1155/2013/629092
Article submitted: September 4, 2015; Peer review completed: November 8, 2015;
Revised version received and accepted: December 10, 2015; Published: December 17,
2015.
DOI: 10.15376/biores.11.1.1518-1540