peer-reviewed article bioresources · peer-reviewed article bioresources.com jablonský et al....
TRANSCRIPT
PEER-REVIEWED ARTICLE bioresources.com
Jablonský et al. (2015). “Cellulose fibre identification,” BioResources 10(3), 5845-5862. 5845
Cellulose Fibre Identification through Color Vectors of Stained Fibre
Michal Jablonský,a,* Lenka Dubinyová,a Štefan Varga,b Katarína Vizárová,a Jozef Šima,c
and Svetozár Katuščák a
Simple, rapid staining analytical methods with visual color assessment are the most used in practice, but they involve problems including subjective error, low accuracy, qualitative results, and the necessity of using many kinds of stains and a great deal of morphology information for correct identification. A method of objective fiber identification using color vectors of a microscan from stained fibre digital photography is described in this report. A model set of cellulose fibres was prepared: groundwood; sulphate pulp; Whatman paper; and rag fibres. The objective micro-colorimetric method, using RGB (red, green, blue) vectors with discriminatory analysis, reduced the number of stains to 1; requires no morphological information; and the discriminatory power (dp,) of this approach is up to 95 to 100% of correctly identified unknown samples with one color vector R or B. A dp value of 100% was achieved when using 2-P or 3-P combinations of R, G, and B.
Keywords: Cellulose; Fibre identification; Objective method; Staining; Colorimetry; RGB;
Discriminatory analysis; Optical microscopy
Contact information: a: Slovak University of Technology, Faculty of Chemical and Food Technology,
Institute of Natural and Synthetic Polymers, Department of Wood, Pulp and Paper, Radlinského 9,
Bratislava, 812 37, Slovak Republic; b: Institute of Information Engineering, Automation, and
Mathematics, Radlinského 9, Bratislava, 812 37, Slovak Republic; c: Department of Inorganic Chemistry,
Radlinského 9, Bratislava, 812 37, Slovak Republic;
* Corresponding author: [email protected]
INTRODUCTION
There are two groups of fibre identification methods, separated in terms of
availability, cost, and practical use: (1) methods using complex scientific devices (Chen
et al. 1996; Durán and Angelo 1998; IWTO-58 2000; Bergfjord and Holst 2010; Rezič et
al. 2010; Paolella et al. 2013) and (2) methods using subjective sensory evaluation of
their form, smell, staining, and color (ČSN 1976; Goodway 1987; STN 1993; ASTM
2007; TAPPI 2008).
Staining analytical methods are simple, rapid, low-cost, available, and are the
most frequently used in fibre identification. However, they face problems including
subjective error and low accuracy. In spite of the subjectivity and lack of quantitative
data, staining methods do not require complex equipment and are therefore widely used
in industries utilizing polymeric materials such as wood, pulp, and paper (Parham and
Gray 1990; Franke 1993; Durán and Angelo 1998; Meng et al. 2013; Chen et al. 2015;
Liu et al. 2015); fibre and textiles (Perry et al. 1985); the automotive industry
(Abendshien et al. 2011); cultural heritage protection (Goodway 1987); archeology
(Chen et al. 1996; Anheuser and Roumeliotou 2003); forensic science and criminal
investigation (Neel and McIntyre 2010); medicine (Kumar and Gill 2010; Kostrominova

PEER-REVIEWED ARTICLE bioresources.com
Jablonský et al. (2015). “Cellulose fibre identification,” BioResources 10(3), 5845-5862. 5846
et al. 2013); developmental biology and the study of renewing tissues (Gavrieli et al.
1992); the food industry (Jit 1995); agriculture (AATCC 1990); and for development of
modern opto-electronic methods and instruments (Suslick et al. 2002; Askim et al. 2013).
The problem with these methods is the objectivisation of simple staining methods
using discriminatory analysis of generally available RGB (red, green, blue) data from the
picture elements of stained fibre microphotographs. Possibilities of reducing the number
of stains, dimensionality, and data volume and increasing discriminatory power are being
searched for.
To make fibre identification more objective, Herzberg stain (zinc chloride-iodine
stain) was selected to stain the fibres. The reasons for this choice are as follows: (1) the
stain is recommended by ISO, TAPPI, ASTM, and corporate standards (ČSN 1976; STN
1993; ASTM 2007; TAPPI 2008) for the identification of the cellulose model fibres used
in our model; (2) it is especially suitable for the chosen cellulose fiber model system; (3)
it is used in micro- and macroscopic diagnostics (Dogu and Grabner 2010); and (4) our
preliminary tests have shown that it is possible to reduce the dimensionality and number
of stains while simultaneously achieving a high percentage of correctly identified
unknown samples. The number of stains recommended is sometimes 2, 3, or more (ČSN
1976; STN 1993; ASTM 2007; TAPPI 2008) which would increase data volume,
dimensionality, testing time, and the cost of objective analyses.
The triiodide group of Herzberg stains—Graff “C” stain, Loffton-Meritte stain,
and phloroglucinol—were used in this study in preliminary testing. These stains cannot
be applied to wet plant fibers because any dilution of the stain decreases its stability.
They are also light-sensitive and easily oxidized so that they must be stored in a
refrigerator in small quantities in stoppered, dark glass bottles. A solution suitable for
treating wet fibres is a stain made from a solution of potassium iodide and iodine mixed
with phosphoric acid just prior to use (Walker and Bullwinkel 1989).
The coloration of fibres depends on the chemical nature of fibre, on the fine
structure of the fibre, and chemical modification. The depth of color is dependent upon
the type and degree of cooking (Woodward 2002). Simons (1950) described a two-color
differential stain for investigation of fibrillation and mechanical damage of beaten fibre.
After beating, the fibrils and fibre debris and bruised spots in the fibres stained orange,
and unbeaten fibres appeared blue (Yu et al. 1995). Colorability can affect the particle
size of dyes, since smaller particles can penetrate very small capillaries. This can cause
changes in colorability. The results of these experiments indicated that the staining
response of the fibres is dependent on the proportion of pores of certain sizes (Yu et al.
1995; Fernando and Daniel 2010). When the fibre wall is made more accessible by
beating or other means, the yellow dye can penetrate the largest pores and displace the
blue dye because of its higher affinity for cellulose (Simons 1950; Yu et al. 2002).
Katuscak and Katuscakova (1987) revealed that coloring the wood with pH indicators can
be used for the identification of decay in spruce wood.
Instead of using 2 or more stains (ČSN 1976; STN 1993; ASTM 2007; TAPPI
2008), only a single zinc chloride-iodine stain was used in this work, as selected by
preliminary experimental testing. The key questions addressed in this report are: (1) what
would be the advantages of objectivisation using RGB vectors from generally available
digital photography or fibre scans for fibre material identification; (2) can the number of
stains can be reduced; and (3) what is the discriminatory power of the individual color
vectors R, G, B, and their combinations, both in statistical tests and experimentally
measured, by the percentage of the correctly identified unknown samples?

PEER-REVIEWED ARTICLE bioresources.com
Jablonský et al. (2015). “Cellulose fibre identification,” BioResources 10(3), 5845-5862. 5847
EXPERIMENTAL
Materials Tissue preparation
The model set of fibres studied were F1, groundwood; F2, sulphate pulp
(bleached); F3, Whatman paper; and F4, rag fibres consisting mainly of cotton. Each kind
of fibrous material was prepared by defibrating according to standards (ČSN 1976; STN
1993; ASTM 2007; TAPPI 2008).
Reagents
The zinc chloride-iodine stain (Herzberg stain) and the stain prepared from
aluminium, calcium, and zinc chlorides, together with iodine and potassium iodide (Graff
“C” stain), were prepared according to standards (ČSN 1976; STN 1993; ASTM 2007;
TAPPI 2008).
Staining
The Herzberg stain was chosen for the objective colorimetric identification of
stained fibres because of its efficacy, simplicity, and the fact that it is especially useful to
differentiate between rag, groundwood, and chemical wood pulps. The defibrated
groundwood, sulphate pulp, Whatman paper, and rag fibres were taken by a micropipette
and placed on glass slides, and the fibres were evenly distributed by a preparation needle.
The microscopic slide was heated and dried completely. The dye was applied, and the
fibers were covered with a coverslip without creating air bubbles. They were allowed to
stand for 1 to 2 min and the excess dye was soaked up with absorbent paper.
Methods Visual assessment
The microscopic preparations were stained with Herzberg and Graff “C” dyes.
After staining, the fibers were divided based on a subjective visual assessment of the
color and the standard color chart for iodine stain. Visual observation and assessment was
made at 40- to 100-times magnification according to various standards (ČSN 1976; STN
1993; ASTM 2007; TAPPI 2008). The microphotographs for microcolorimetric cellulose
fibre identification were taken at 40x magnification (Table 1).
Taking a microphotographic image and scans
To track the microscopic slides, an MIC 456 optical microscope with an Olympus
Camedia Digital Camera C-5050 ZOOM with a 1/1.8" (7.18 x 5.32 mm) 5 megapixel
CCD sensor was used. Microphotographic images were generated at 40x magnification.
In the microphotograph of the sample, one fibre was selected and the area of one scan
(As) was marked perpendicular to the fibre length as measured using a cursor; the width
of each scan was 7 picture elements (pixels, px) and the area, As, was 7-times wf (px),
where wf was the fibre width and was between 123 and 487 pixels or 814 and 3222 μm;
the number of pixels in one scan, npx, varied in the range of 861 to 3409. The area of the
scans of the cellulose fibre microphotographs used in this work, at 40-fold magnification,
to the area of real sample, As, r (mm2), ranged from 0.04 to 0.15. The scanned data (R, G,
and B) from each picture element (pixel) were transferred to a reference database such
that the R, G, and B measured data, and any derived data for each pixel, correspond to
one line in the database.

PEER-REVIEWED ARTICLE bioresources.com
Jablonský et al. (2015). “Cellulose fibre identification,” BioResources 10(3), 5845-5862. 5848
Reference
To form a reference data set for the cellulose fibre types, three images were
selected from each type of fibre denoted F1 to F4. In each microimage, one fibre was
chosen and the scanning was performed as described previously.
For the reference set: 3 images, 3 scans, npx <861, 3409> were used per 1 fibre
type. Subsequently from these pixels, 100 px were selected at random from each type of
fibre, and used as reference for identification of each unknown sample by discriminant
analysis.
To evaluate the homogeneity of the selected set of data and the mutual
distinguishability of the types and extent of internal correlations of groups F1 to F4,
statistical methods, ANOVA, MANOVA, correlation analysis, and evaluation of the
extent of mutual distinctiveness of individual type pairs F1 to F4 were conducted.
Identification of an unknown fibre sample was carried out by discriminatory analysis of
the RGB values of the sample and those of the reference sets F1 to F4 (Varga 2012).
Identification of unknown fibre kind sample.
An unknown sample delivered for identification can be either a physical sample
or an image of stained fibres prepared from an analysed fibre material. The physical
unknown sample should be defibrated, stained, and microscopically observed as
described above. Three microscopic images were prepared from each unknown sample; 1
scan (As = 7 x wf) was taken from each image as described above.
Estimation of the discriminatory power (dp) of the 1-P, 2-P and 3-P color vectors R, G, B.
The RGB vectors for cellulose fiber identification were measured experimentally
and expressed as the percentage of the correctly identified unknown cellulose fibre
samples as follows: the number of unknown samples for one measurement of dp (%), 20;
the number of unknown samples from one kind of fibre F1 to F4, 5; 3 images and scans
(1 scan of a selected fibre per image) were made from each sample; 100 px were selected
from each sample from a set of 3 images; 3 scans, with npx between 861 and 3409, by
statistical random selection. Six parallel measurement experiments were conducted
(Table 8), each containing 20 unknown samples (Table 7).
RESULTS AND DISCUSSION
The cellulose fibre models F1 to F4 simulate the well-known, standardized
practice of fibre identification by staining and subjective visual evaluation because it is
complex enough for subjective standardised visual identification with some problems in
correctness, accuracy, and lack of quantitative data (Table 1).
Two or more stains are recommended for reliable identification (Kutscha and
Gray 1972) because of the complexity and fuzzy character of visual identification. There
are uncertainties associated with visually distinguishing between cellulose fibres of types
F2 and F3 and the identification of F4.
The model is also complex enough with regard to objective identification: the
clouds of data (Fig. 1) and probability density functions (Fig. 2) meaningfully overlap.
PEER-REVIEWED ARTICLE bioresources.com
Jablonský et al. (2015). “Cellulose fibre identification,” BioResources 10(3), 5845-5862. 5849
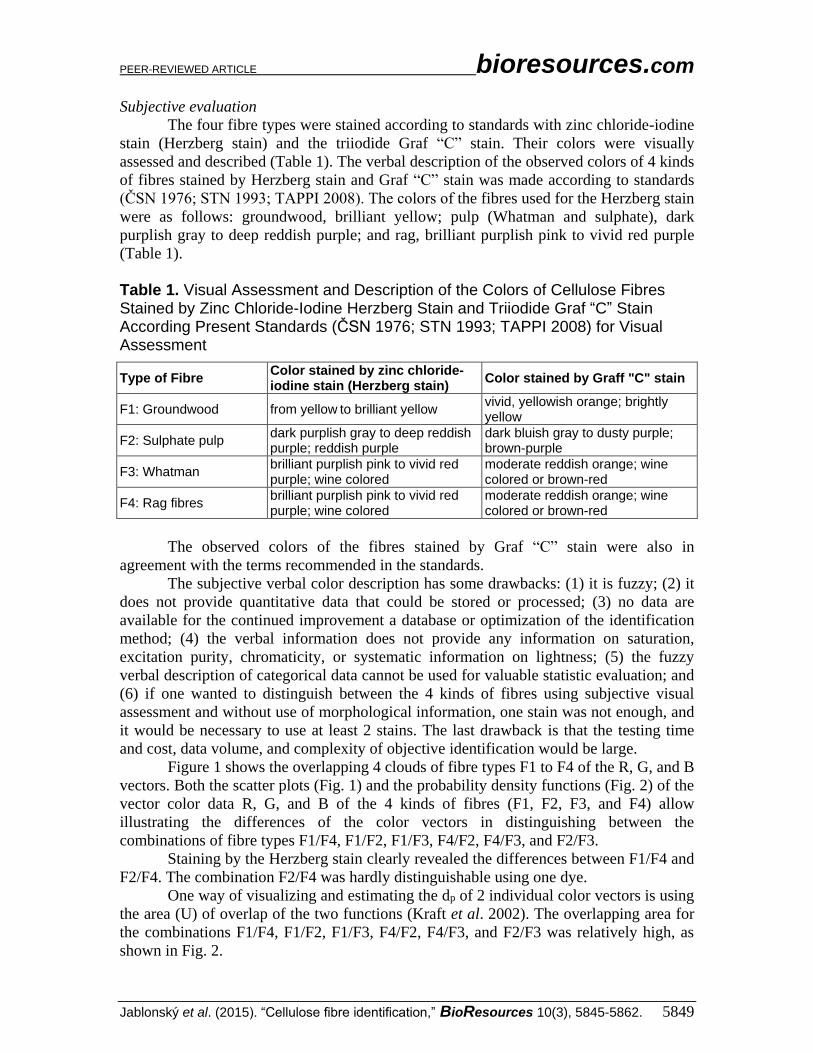
Subjective evaluation
The four fibre types were stained according to standards with zinc chloride-iodine
stain (Herzberg stain) and the triiodide Graf “C” stain. Their colors were visually
assessed and described (Table 1). The verbal description of the observed colors of 4 kinds
of fibres stained by Herzberg stain and Graf “C” stain was made according to standards
(ČSN 1976; STN 1993; TAPPI 2008). The colors of the fibres used for the Herzberg stain
were as follows: groundwood, brilliant yellow; pulp (Whatman and sulphate), dark
purplish gray to deep reddish purple; and rag, brilliant purplish pink to vivid red purple
(Table 1).
Table 1. Visual Assessment and Description of the Colors of Cellulose Fibres Stained by Zinc Chloride-Iodine Herzberg Stain and Triiodide Graf “C” Stain According Present Standards (ČSN 1976; STN 1993; TAPPI 2008) for Visual Assessment
Type of Fibre Color stained by zinc chloride-iodine stain (Herzberg stain)
Color stained by Graff "C" stain
F1: Groundwood from yellow to brilliant yellow vivid, yellowish orange; brightly yellow
F2: Sulphate pulp dark purplish gray to deep reddish purple; reddish purple
dark bluish gray to dusty purple; brown-purple
F3: Whatman brilliant purplish pink to vivid red purple; wine colored
moderate reddish orange; wine colored or brown-red
F4: Rag fibres brilliant purplish pink to vivid red purple; wine colored
moderate reddish orange; wine colored or brown-red
The observed colors of the fibres stained by Graf “C” stain were also in
agreement with the terms recommended in the standards.
The subjective verbal color description has some drawbacks: (1) it is fuzzy; (2) it
does not provide quantitative data that could be stored or processed; (3) no data are
available for the continued improvement a database or optimization of the identification
method; (4) the verbal information does not provide any information on saturation,
excitation purity, chromaticity, or systematic information on lightness; (5) the fuzzy
verbal description of categorical data cannot be used for valuable statistic evaluation; and
(6) if one wanted to distinguish between the 4 kinds of fibres using subjective visual
assessment and without use of morphological information, one stain was not enough, and
it would be necessary to use at least 2 stains. The last drawback is that the testing time
and cost, data volume, and complexity of objective identification would be large.
Figure 1 shows the overlapping 4 clouds of fibre types F1 to F4 of the R, G, and B
vectors. Both the scatter plots (Fig. 1) and the probability density functions (Fig. 2) of the
vector color data R, G, and B of the 4 kinds of fibres (F1, F2, F3, and F4) allow
illustrating the differences of the color vectors in distinguishing between the
combinations of fibre types F1/F4, F1/F2, F1/F3, F4/F2, F4/F3, and F2/F3.
Staining by the Herzberg stain clearly revealed the differences between F1/F4 and
F2/F4. The combination F2/F4 was hardly distinguishable using one dye.
One way of visualizing and estimating the dp of 2 individual color vectors is using
the area (U) of overlap of the two functions (Kraft et al. 2002). The overlapping area for
the combinations F1/F4, F1/F2, F1/F3, F4/F2, F4/F3, and F2/F3 was relatively high, as
shown in Fig. 2.

PEER-REVIEWED ARTICLE bioresources.com
Jablonský et al. (2015). “Cellulose fibre identification,” BioResources 10(3), 5845-5862. 5850
a)
b)

PEER-REVIEWED ARTICLE bioresources.com
Jablonský et al. (2015). “Cellulose fibre identification,” BioResources 10(3), 5845-5862. 5851
c)
d)
Fig. 1. The distribution of the R, G, and B vector parameters of the 4 fibre types stained by the Herzberg stain (the number of kinds of fibres, nfk = 4; the number of R, G, and B pixels, npx = 100), a) 3-P visualization and 2-P projections b) G-R, c) R-B and d) G-B projections

PEER-REVIEWED ARTICLE bioresources.com
Jablonský et al. (2015). “Cellulose fibre identification,” BioResources 10(3), 5845-5862. 5852
a) R
b) G
c) B
Fig. 2. Probability density functions of the CIE color vector parameters R, G, and B for 100 pixels of one scan of each of the four kinds of cellulose fibres: F1 (groundwood), F2 (sulphate pulp), F3 (Whatman paper), and F4 (rag)

PEER-REVIEWED ARTICLE bioresources.com
Jablonský et al. (2015). “Cellulose fibre identification,” BioResources 10(3), 5845-5862. 5853
Density plots (Fig. 2) are a much more effective way to view the practically
normal distribution of a variable. Visualization via density plots also allows for better
superimposing of the kernal density plots of the four groups of the vector color data, for
better comparison of the overlapping of the densities, and the groups of color data for the
6 combinations of the 4 kinds of fibres for each color vector.
Other alternatives were considered to better distinguish between these 4 fibre
groups. Discriminatory analysis and density plots, along with distinguishable degree,
were applied in these alternatives.
The probability functions overlap significantly, meaning that identification is
complex and it can be assumed that dp is relatively small. It is not simple to visually or
objectively discriminate between the colors of the 4 kinds of stained fibres. Another
visualisation option, histograms, is neither suitable for determining the shape of a
distribution nor for the comparison of groups of data for the 4 fibre kinds because it is so
strongly affected by the number of bins used.
Internal Correlations and Dimensionality The color of every pixel can be described using three vectors. These vectors are
theoretically internally or mutually independent dimension variables. If the vectors are
mutually correlating, it is a property of a measured material, object, or system and not of
the R, G, and B quantities. This attribute, an extent of internal correlation of theoretically
independent dimensions, may be characteristic for a given system (material, fibre kind,
object, dynamic system).
Table 2. Internal Correlations Coefficients (R) between the R, G, and B Vectors of the Scanned Microimages of the 4 Fibre Types Stained by the Herzberg Stain
100 px rR-G rR-B rG-B
F1 0.91 0.79 0.85
F2 0.99 0.93 0.95
F3 0.78 0.39 0.78
F4 0.74 0.48 0.54
μr 0.85 0.65 0.78
The color vectors R, G, and B of the 4 cellulose fibre types used in the studied
model are partially correlated. The highest internal correlations, close to r = 1, were
found for the vectors R, G, and B in stained cellulose sulphate pulp fibres (F2).
Comparing Groups/Density Plots Variance analysis and discriminatory analysis allow one to group data into classes
based on observed parameters. Both of these methods, and several other statistical
methods, stem from an assumption that the data observed satisfy a normal probability
distribution. By applying multi analysis of variance (MANOVA), a hypothesis on the
identity of the mean values of the four fibre types for 100 randomly chosen RGB color
parameter values was statistically tested. The compared mean values were three
parametric (3-P) vectors. The hypothesis that all four mean values were identical was
subjected to testing where H0: µF1 = µF2 = µF3 = µF4 and H1: at least one pair of mean
values differs. This test determined whether or not the variability factor substantially
influenced the values of the measured quantities R, G, and B.

PEER-REVIEWED ARTICLE bioresources.com
Jablonský et al. (2015). “Cellulose fibre identification,” BioResources 10(3), 5845-5862. 5854
Table 3. Mean Values of R, G, and B Parameters and their Standard Deviations for the 4 Types of Fibres
Type of fibre R σR G σG B σB
F1 160 12 133 13 101 17
F2 102 18 71 18 76 17
F3 112 21 72 17 68 14
F4 113 14 86 10 84 9
For RGB with the values χ2 = 935.6, p-value = 0.0000, and α = 0.05, the null
hypothesis H0 was rejected. This means that the set was not homogeneous and at least
one kind of fibre was distinguishable. Further, the distinguishability of all pairs F1/F2,
F1/F3, F1/F4, F2/F3, F2/F4, and F3/F4 was tested using the Wilks (Λ) and the Chi-
Square (χ2) test (Table 3).
Table 4. Comparison of Differing Pairs of Fibres
Type of fibre Λ χ2 p-value F-ratio
F1/F2 0.09 474.53 0.00 665.68
F1/F3 0.19 435.93 0.00 535.30
F1/F4 0.13 403.49 0.00 443.88
F2/F3 0.61 96.08 0.00 41.20
F2/F4 0.57 111.57 0.00 49.94
F3/F4 0.41 173.53 0.00 92.67
The best distinguishability was for the pairs F1/F2, F1/F3, and F1/F4, which had
the highest F-ratios. The lowest F-ratios were found for F3/F4, F2/F4, and F2/F3.
In using one-dimensional testing to distinguish the fibre types through the F-ratio
and p-value (Table 5), it was found that all three parameters R, G, and B allowed
distinguishability. Based on the ANOVA test, for one-parametric testing, the best
parameter was G, followed by R and B.
Table 5. ANOVA of F-Ratios and P-Values for the Individual Color Vectors R, G, and B
Color parameter F-ratio p-value
R 244.03 0.00
G 389.75 0.00
B 89.09 0.00
In connection with this result, the following facts are interesting: (1) the human
eye is the most sensitive to green; and (2) in the camera used and the majority of digital
cameras, the recording of a color image is performed using a single CCD sensor (charge-
coupled device) with color filters located directly within a scanner over each single pixel,
containing more green pixels, usually 50%, while the other 50% is divided between red
and blue (e.g., Bayer (1976) array). This image sensor has a higher sensitivity to green
color, which simulates the color sensitivity of the human eye (Neitz and Jacobs 1986).
Such an arrangement is also applied in the camera used and the majority of digital
cameras currently produced. The current Bayer filter design uses GRGB or RGGB filters.

PEER-REVIEWED ARTICLE bioresources.com
Jablonský et al. (2015). “Cellulose fibre identification,” BioResources 10(3), 5845-5862. 5855
Other types, such as the Kodak Truesense image sensor, also have higher sensitivity to
green light.
As shown later (Tables 7 and 8), during the objective identification of fibres using
individual vectors R, G, or B, the G vector led to the lowest percentage of correctly
identified fibres. It is necessary to study the discriminatory power of the individual
vectors, their combinations, and potentially derived characteristic quantities in more
detail to identify cellulose and other kinds of fibres in the future.
Table 6 shows that, according to MANOVA, which is based on the statistical test
procedure for comparing multivariate (population) means of several groups (Warne
2014), the percentage of correctly classified fibres for one-parametric (1-P) evaluation of
R, G, B ranged between 46 and 57%. For two-parametric (2-P) evaluation (RG, RB, and
GB) it was 63 to 70%. For three-parametric (3-P) evaluation, it reached 74%.
Table 6. MANOVA – Percentage of Correctly Classified Fibre Sample Picture Elements using RGB Parameters
1-P % 2–P % 3–P %
R 50.50 RG 68.50 RGB 74.00
G 57.00 RB 63.00
B 46.25 GB 69.50
An increase in the number of parameters leads to an increase in the percent of
correctly classified picture elements (RGB pixels) of the fibres.
Distinguishability of the Pairs of the Cellulose Fibre Kinds The results of the variance analysis led to rejection of the null hypothesis (Table
3). This means that the data were not homogeneous and that the sets were mutually
distinguishable to a certain extent.
The fundamental questions of distinguishability are as follows: first, what is the
distinguishability of fibre types using color vectors and the vector combinations R, G, B,
R/B, R/G, B/G, R/G, and R/G/B? Second, what is the difference in the distinguishability
of the individual parameters of R, G, and B and their combinations in the identification of
particular cellulose fibre types?
Quantifying the discriminatory power dp can be done by numerous methods using
the distance, overlapping area, or empirically (e.g., by measuring the percentage of
correct analytical decisions or identifications). Discriminatory power can be expressed as
the distance between the centres of two groups (types of fibres) using the index of
distinguishability, Vij, defined as follows (Varga 2012) in Eqs. 1 and 2,
(1)
where dij is a function of Si and Sj and is the distance between the centres of groups i and
j; ri is the mean range in group i; and rj is the mean range in group j.
(2)
PEER-REVIEWED ARTICLE bioresources.com
Jablonský et al. (2015). “Cellulose fibre identification,” BioResources 10(3), 5845-5862. 5856
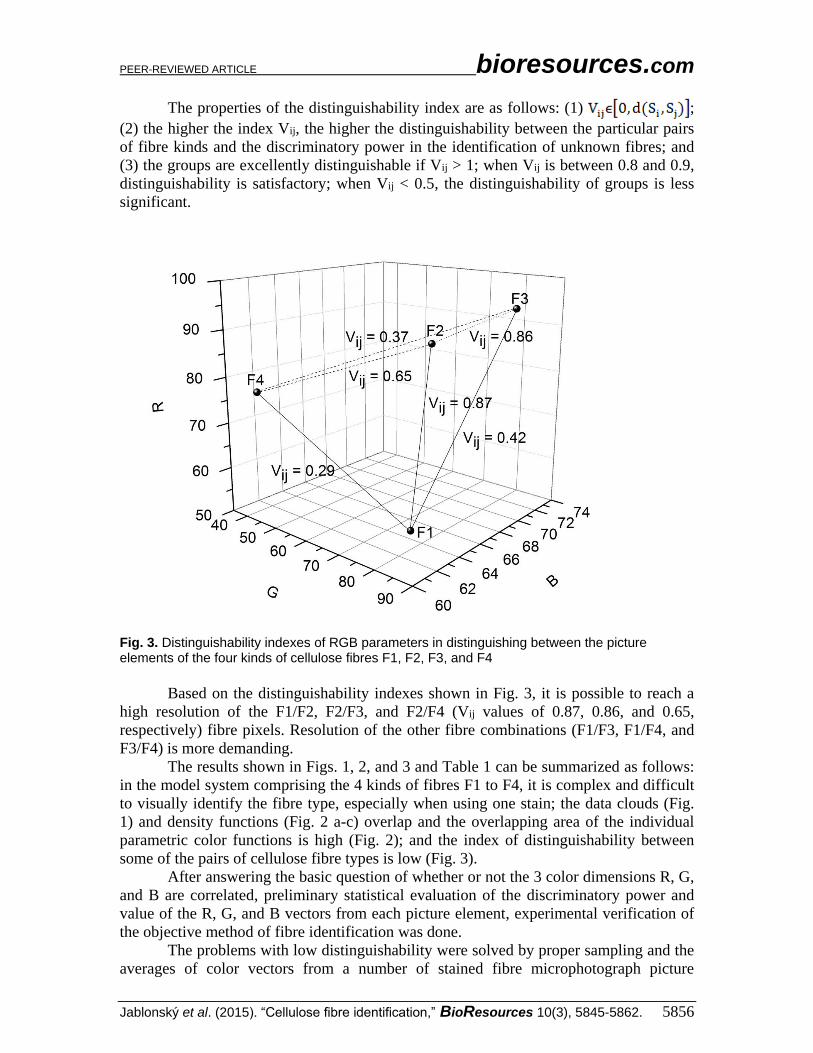
The properties of the distinguishability index are as follows: (1) ;
(2) the higher the index Vij, the higher the distinguishability between the particular pairs
of fibre kinds and the discriminatory power in the identification of unknown fibres; and
(3) the groups are excellently distinguishable if Vij > 1; when Vij is between 0.8 and 0.9,
distinguishability is satisfactory; when Vij < 0.5, the distinguishability of groups is less
significant.
Fig. 3. Distinguishability indexes of RGB parameters in distinguishing between the picture elements of the four kinds of cellulose fibres F1, F2, F3, and F4
Based on the distinguishability indexes shown in Fig. 3, it is possible to reach a
high resolution of the F1/F2, F2/F3, and F2/F4 (Vij values of 0.87, 0.86, and 0.65,
respectively) fibre pixels. Resolution of the other fibre combinations (F1/F3, F1/F4, and
F3/F4) is more demanding.
The results shown in Figs. 1, 2, and 3 and Table 1 can be summarized as follows:
in the model system comprising the 4 kinds of fibres F1 to F4, it is complex and difficult
to visually identify the fibre type, especially when using one stain; the data clouds (Fig.
1) and density functions (Fig. 2 a-c) overlap and the overlapping area of the individual
parametric color functions is high (Fig. 2); and the index of distinguishability between
some of the pairs of cellulose fibre types is low (Fig. 3).
After answering the basic question of whether or not the 3 color dimensions R, G,
and B are correlated, preliminary statistical evaluation of the discriminatory power and
value of the R, G, and B vectors from each picture element, experimental verification of
the objective method of fibre identification was done.
The problems with low distinguishability were solved by proper sampling and the
averages of color vectors from a number of stained fibre microphotograph picture

PEER-REVIEWED ARTICLE bioresources.com
Jablonský et al. (2015). “Cellulose fibre identification,” BioResources 10(3), 5845-5862. 5857
elements of unknown samples were used. Discriminatory analysis of the average values
of the R, G, and B vectors of the unknown sample, with the reference of the four kinds of
the cellulose fibres, was used.
Experimental Verification of the Objective Method Six parallel experiments comprising sample preparation and the identification of
the unknowns were carried out (Table 8). Each experiment involved a set of 20 unknown
samples, 5 of each type of fibre F1 to F4. On each fibre, the 7 x wf pixel measured
elementary area was marked, where wf is the fibre width (px). The color of each
unknown sample was represented by the mean of 100 px randomly selected from 3 fibres.
Table 7. Identification of 20 Unknown Fibre Samples (F1 to F4) by Discriminatory Analysis of the Color Vectors RGB from 100 Picture Elements (Px) from the Microphotography of the Fibres Stained by the Herzberg Stain
Correctness of identification of unknown sample: 1 – correct, 2 – false
1-P 2-P 3-P
No. R G B RG RB GB RGB Correct answer
1 0 (F4) 1 1 1 1 1 1 F3
2 1 1 1 1 1 1 1 F1
3 1 1 1 1 1 1 1 F3
4 1 0 (F2) 1 1 1 1 1 F3
5 1 1 1 1 1 1 1 F1
6 1 0 (F3) 1 1 1 1 1 F2
7 1 1 1 1 1 1 1 F4
8 1 1 1 1 1 1 1 F1
9 0 (F2) 0 (F2) 1 1 1 1 1 F3
10 1 1 1 1 1 1 1 F1
11 1 0 (F3) 1 1 1 1 1 F2
12 1 1 1 1 1 1 1 F1
13 1 0 (F3) 1 1 1 1 1 F2
14 1 1 1 1 1 1 1 F4
15 1 1 1 1 1 1 1 F4
16 1 1 1 1 1 1 1 F4
17 1 0 (F3) 1 1 1 1 1 F2
18 1 1 1 1 1 1 1 F4
19 0 (F2) 0 (F2) 1 1 1 1 1 F3
20 1 0 (F3) 1 1 1 1 1 F2
dp (%) 85 60 100 100 100 100 100
σdp 0.37 0.50 0 0 0 0 0
νdp 0.43 0.84 0 0 0 0 0
Symbols: No. – unknown sample number; 1-P, 2-P, 3-P – number of parameters at identification; σdp – standard deviation; νdp – coefficient of variation (%); dp (%) – discriminatory power expressed as the percentage of correctly identified fibre samples.

PEER-REVIEWED ARTICLE bioresources.com
Jablonský et al. (2015). “Cellulose fibre identification,” BioResources 10(3), 5845-5862. 5858
Each parallel experiment involved the identification of the unknown samples
using each of the 7 methods: 1-parameter identification using R, G, or B; 3 evaluation
methods using 2-parameter identification using RG, RB, or BG combinations; and 1
method using 3-parameter RGB identification. The identification was made by the
discriminatory analysis using averages of the R, G, and B color information for each
unknown sample. An example of the identification of 20 unknown samples, 5 samples of
each type of fibres F1 to F4, by the 7 methods is shown in Table 7.
In this identification experiment, the main cause of false identifications in
columns R and G was insufficient distinguishing between the cellulose fibres F2 and F3.
Of the total number of fibre type identifications (140), only 5 were false using one vector
(1-parameter evaluation R) identification. The discriminating power, as expressed by the
number of incorrect identifications, increased as follows: dp (G) = 60%; dp (R) = 85%;
and dP for the 2- and 3-parameter identification was 100%.
To verify whether or not objective identification using solely color information
without morphological information was possible, the experiment in Table 7, involving
140 unknown fibre identifications, was repeated (Table 8). The first line in the Table 8
summarizes the results shown in Table 7, and each following line represents a parallel
experiment. The total number of unknown fibre samples was 6 x 20 = 120 in each of the
6 parallel experiments described in Table 8. Each sample was identified via 7 methods,
and the total number of verifying discriminatory analyses and fibre identifications was
120 x 7 = 840.
Table 8. The Average Percentage of Correctly Identified Unknown Samples using the R, G, or B Parameters in 840 Discriminatory Analyses of Fibre Identifications of the 120 Unknown Samples using the Three 1-P, Three 2-P, and One 3-P Identification Methods
No. 1-P 2-P 3-P
R G B RG RB GB RGB
1 85 60 100 100 100 100 100
2 100 60 95 100 100 100 100
3 100 60 100 100 100 100 100
4 95 75 85 100 100 100 100
5 95 75 90 100 100 100 100
6 95 80 90 100 100 100 100
μdp 95 68 93 100 100 100 100
σdp 5 9 6 0 0 0 0
Symbols: No. – parallel experiment number; 1-P, 2-P, 3-P – number of parameters at identification by 1, 2, or 3 color vectors RGB; µdp – average discriminatory power; Ϭdp – standard deviation
The discriminatory power (dp), in terms of the percentage of correctly identified
unknown samples, of the G vector was in the range 60 to 80%. Those of the color vectors
R and B varied between 85 and 100%, and those of the 2-parametric and 3-parametric
were 100% for the 100 px averages.

PEER-REVIEWED ARTICLE bioresources.com
Jablonský et al. (2015). “Cellulose fibre identification,” BioResources 10(3), 5845-5862. 5859
This objective micro-colorimetric method of fibre identification using scanned
RGB data from the material digital photography successfully tested on the cellulose fibre
model could also be applied to other kinds of fibre material identification.
Recommended procedure for the objective micro-colorimetric fibre identification
Based on the knowledge acquired regarding the objective micro-colorimetric fibre
identification using RGB vectors from digital photography, the following procedure is
recommended: (1) selection of fibre types that can be analysed in a given laboratory and
sampling of the known fibre types for comparative calibration analysis (DB) should be of
representative nature (ČSN 1976; AATCC 1990; STN 1993; ASTM 2007; TAPPI 2008;
ASTM 2010); (2) defibration and microscopic staining preparation of the selected fibre
types according to various standards (ČSN 1976; AATCC 1990; STN 1993; ASTM 2007;
TAPPI 2008; ASTM 2010); the zinc chloride-iodine stain (Herzberg stain) used in this
contribution can be delivered by the Institute of Paper Science Technology (Institute of
Paper Science Technology 2009) or prepared in the laboratory according to standards
(ČSN 1976; AATCC 1990; STN 1993; ASTM 2007; TAPPI 2008; ASTM 2010); (3) the
microphotograph of the microscopic sample is made at 40x magnification and transferred
to a computer; (4) a uniformly-stained, non-deformed fibre without bubbles or other
defects is selected from the microphotograph by a cursor; a scan area (e.g., 7 x wf px,
where wf is the fibre width) is selected and the RGB data from each pixel are transferred
to the database; (5) identification of the unknown sample by discriminatory analysis of
the reference fibre and unknown fibre data; formation of a microscopic preparation,
taking photographs and transferring the data of the unknown are to be performed in
identical modes as those for reference fibres.
CONCLUSIONS
1. The objective identification method using R,G,B color vectors enabled the correct
identification. No morphological information regarding the form of the fibre needed
to be known; Experimental verification by the analysis and identification of 120
unknown samples was done; Up to 100% of the unknown samples were identified
correctly using the individual color vectors R or B, 2-P (RG, RB, GB), or 3-P(RGB)
combinations from the digital microphotographs of the stained fibres.
2. The model of cellulose fibres well-simulates the problems associated with subjective
visual evaluation of fiber type: the visual identification of fiber types F1 to F4 is
complex; the verbally estimated colors are fuzzy; 2 or more stains are usually needed
for visual identification according to present standards; the color data clouds of the
fibre types F1 to F4, as well as the density functions, strongly overlap; and the
estimated distinguishability index (Vij) is low.
3. The objective method of identification enabled reduction of the number of stains used
for the visual identification from 2 to 1, which increases testing speed and decreases
the data volume and costs of the objective fibre identification.

PEER-REVIEWED ARTICLE bioresources.com
Jablonský et al. (2015). “Cellulose fibre identification,” BioResources 10(3), 5845-5862. 5860
ACKNOWLEDGEMENTS
This work was supported by a grant no. APVV-14-0393from the Grant Agency APVV
and by a grant no. 1/0775/13 and 1/0543/15 from the Grant Agency VEGA.
REFERENCES CITED
AATCC Test Method 20. (1990). “Fiber Analysis: Qualitative,” American Association of
Textile Chemists and Colorists, Research Triangle Park, NC.
Abendshien, L. C., Brown, C. J., Williams, D. K., and Shaw, S. (2011). Fibre
Identification Database (FACID) Preliminary Validation and Evaluation, Oak Ridge
Institute, Quantico, VA.
Anheuser, K., and Roumeliotou, M. (2003). “Characterisation of mineralised
archaelogical textile fibres through chemical staining,” The Conservator 27(1), 23-33.
DOI: 10.1080/01410096.2003.9995187
Askim, J. R., Mahmoudiab, M., and Suslick, K. S. (2013). “Optical sensor arrays for
chemical sensing: The optoelectronic nose,” Chem. Soc. Rev. 42(22), 8649-8682.
DOI: 10.1039/C3CS60179J
ASTM D 1030 – 95 (2007). “Standard test method for fiber analysis of paper and
paperboard,” American Society for Testing and Materials, West Conshohocken, PA.
ASTM D 585 – 97 (2010). “Standard practice for sampling and accepting a single lot of
paper, paperboard, fiberboard, and related product,” American Society for Testing
and Materials, West Conshohocken, PA.
Bayer, B. E. (1976), “Color imaging array,” US Patent 3971065.
Bergfjord, C., and Holst, B. (2010). “A procedure for identifying textile bast fibres using
microscopy: Flax, nettle/ramie, hemp and jute,” Ultramicroscopy 110(9), 1192-1197.
DOI:10.1016/j.ultramic.2010.04.014.
Chen, H. L., Jakes, K. A., and Foreman, D. W. (1996). “SEM, EDS, and FTIR
examination of archaeological mineralized plant fibers,” Textile Research Journal
66(4), 219-224. DOI: 10.1177/004051759606600406
Chen, Y., Wan, J., Ma, Y., Dong, X., Wang, Y., and Huang, M. (2015). "Fiber properties
of de-inked old newspaper pulp after bleaching with hydrogen peroxide,”
BioResources 10(1), 1857-1868. DOI: 10.15376/biores.10.1.1857-1868
ČSN ISO 9184-1-5 (1993). “Paper, board and pulps – Fibre furnish analysis,” [in Czech],
The Czech Standards Institute, Praha, Czech Republic.
Dogu, A. D., and Grabner, M. (2010). “A staining method for determining severity of
tension wood,” Turk J. Agric. For. 34(5), 381-392. DOI: 10.3906/tar-0906-209
Durán, N., and Angelo, R. (1998). “Infrared microspectroscopy in the pulp and paper-
making industry,” Applied Spectroscopy Reviews 33(3), 219-236. DOI:
10.1080/05704929808006778
Fernando, D, and Daniel, G. (2010). “Characterization of spruce thermomechanical pulps
at the fiber cell wall level: A method for quantitatively assessing pulp fiber
development using Simons’ stain,” Tappi Journal 9(10), 47–55.
Franke, W. (1993). “Microskopische und photometrische Verfahren,” Prüfung von
Papier, Pappe, Zellstoff und Holzstoff. ISBN 3-540-54255-8.
Gavrieli, Y., Sherman, Y., and Ben-Sasson SA. (1992). “Identification of programmed
cell death in situ via specific labeling of nuclear DNA fragmentation,” J. Cell Biol.

PEER-REVIEWED ARTICLE bioresources.com
Jablonský et al. (2015). “Cellulose fibre identification,” BioResources 10(3), 5845-5862. 5861
119(3), 493-501. DOI:10.1083/jcb.119.3.493
Goodway, M. (1987). “Fiber identification in practice,” JAIC 26(1), 27-44.
Institute of Paper Science Technology. (2009). “Zinc chloro-iodide stain – Herzberg
stain,” Material Safety Data Sheet, West Chester, PA.
IWTO-58. (2000). “Scanning electron microscopic analysis of specialty fibres and
sheep's wool and their blends,” Standard Test Method of the International Wool
Textile Organisation, Ilkley, UK, The Woolmark Company.
Jit, F. A. (1995). “Cellulose in food matrix quantification,” US Patent 5646045 A.
Katuscak, S., and Katuscakova, G. (1987). “Means of objective identification of spruce
wood decay,” Holzforschung 41(5), 315-320, DOI: 10.1515/hfsg.1987.41.5.315
Kostrominova, T. Y., Reiner, D. S., Haas, R. H., Ingermanson, R., and McDonough, P.
M. (2013). “Chapter seven - Automated methods for the analysis of skeletal muscle
fiber siye and metabolic type,” Int. Rev. Cell. Mol. Biol. 306, 275-332. DOI:
10.1016/B978-0-12-407694-5.00007-9
Kraft, H., Kroisandt, G., and Müller, M. (2002). “Assessing the discriminatory power of
credit scores,” Discussion Papers 67(SBF 373), 1-21.
Kumar, G. L., and Gill, G. W. (2010). “Chapter 1. Introduction to special stains,” Special
Stains and H & E, (2nd ed.), Kumar, G. L., and Kiernan, J. A. (Eds.), Dako North
America, Carpinteria, CA, p. 299.
Kutscha, N., and Gray, J. R. (1972). Life Sciences and Agriculture Experiment Station
Technical Bulletin 53, 1-71.
Liu, Z., Cao, Y., Wang, Z., Ren, H., Amidon, T. E., and Lai, Y. (2015). “The utilization
of soybean straw. I. Fiber morphology and chemical characteristics,” BioResources
10(2), 2266-2280. DOI: 10.15.376/biores.10.2.2266-2280
Meng, Q., Wan, J., Ma, Y., and Wang, Y. (2013). “Effects of different deinking processes
on fiber morphology, hydrogen bond models, and cellulose supramolecular
structure,” BioResources 8(2), 2398-2416. DOI: 10.15376/biores.8.2.2398-2416
Neel, N., and McIntyre, A. J. (2010). “The effects of cyanoacrylate fuming and
fluorescent dye staining on forensic tape analysis,” JASTEE 2(2), 127-136.
Neitz, J., and Jacobs, G. H. (1986). “Polymorphism of the long-wavelength cone in
normal human color vision,” Nature 323(6089), 623-625. DOI: 10.1038/323623a0
Paolella, S., Bencivenni, M., Lambertini, F., Prandi, B., Faccini, A., Tonetti, C., Vineis,
C., and Sforza, S. (2013). “Identification and quantification of different species in
animal fibres by LC/ESI-MS analysis of keratin-derived proteolytic peptides,” J.
Mass Spectrom. 48(8), 919-26. DOI: 10.1002/jms.3222.
Parham, R. A., and Gray, R. L. (1990). “The practical identification of wood pulp fibers,”
TAPPI Press, Atlanta, GA.
Perry, D. R., Appleyard, H. M., Cartridge, G., Cobb, P. G. W., Coop, G. E., Lomas, B.,
Ritchie, G. G., Taylor, C., Welch, M. J., and Farnfield, C. A. (1985). “Identification
of textile materials,” Textile Institute, Manchester, UK.
Rezič, I., Čurkovič, L., and Ujevič, M. (2010). “Simple methods for characterization of
metals in historical textile threads,” Talanta 82(1), 237-244. DOI:
10.1016/j.talanta.2010.04.028
Simons, F. L. (1950). “A stain for use in the microscopy of beaten fibers,” Tappi Journal
33(7), 312-314.
STN ISO 9184-1-5. (1993). “Paper, board and pulps – Fibre furnish analysis”.
Suslick, K. S., Rakow, N. A., and Sen, A. (2002). “Colorimetric artificial nose having an
array of dyes and method of artificial olfaction,” US Patent 6495102 B1.

PEER-REVIEWED ARTICLE bioresources.com
Jablonský et al. (2015). “Cellulose fibre identification,” BioResources 10(3), 5845-5862. 5862
TAPPI T 401. (2008). “Fibre analysis of paper and paperboard,” TAPPI Standards,
Atlanta, GA.
Varga, Š. (2012). Mathematical Statistics [In Slovak], (1st Ed.), Komorníková, M.,
Nánásiová, O. and Garaj, I. (eds.), Slovak Technical University Press, Bratislava,
Slovakia, p. 219. ISBN 978-80-227-3789-0
Walker, H., and Bullwinkel, E. P. (1989). “Aqueous solution containing iodine; mixed
prior to application,” US Patent 4978364.
Warne, R. T. (2014). “A primer on multivariate analysis of variance (MANOVA) for
behavioral scientists,” Practical Assessment, Research & Evaluation 19(17), 1-10.
Woodward, J., H. (2002). “Stain for the determination of paper components and paper
defects,” Microscs. Microanal. 8(2), 196-197. DOI 10.1017.S1431927602102303
Yu, X., Minor, J. L., and Attala, R., H. (1995). “Mechanism of action of Simons´stain,”
Tappi Journal 78(6), 175-179.
Article submitted: April 27, 2015; Peer review completed: July 6, 2015; Revised version
received and accepted: July 15, 2015; Published: July 29, 2015.
DOI: 10.15376/biores.10.3.5845-5862