peg-peptide conjugate containing cathepsin b degradation...
TRANSCRIPT

Turk J Chem
(2018) 42: 385 – 400
c⃝ TUBITAK
doi:10.3906/kim-1706-65
Turkish Journal of Chemistry
http :// journa l s . tub i tak .gov . t r/chem/
Research Article
PEG-peptide conjugate containing cathepsin B degradation unit as a doxorubicin
carrier system
Nesligul SENTURK, Ayben TOP∗
Department of Chemical Engineering, Faculty of Engineering, Izmir Institute of Technology, Izmir, Turkey
Received: 29.06.2017 • Accepted/Published Online: 08.11.2017 • Final Version: 27.04.2018
Abstract: A drug delivery system (DDS) containing a cathepsin B degradable sequence and pH-responsive histidines
was prepared by methoxypolyethylene glycol and peptide conjugation. Doxorubicin was attached to the carrier system
using amide linkage to give the final form of the DDS, denoted as mPEG-AT3-DOX. mPEG-AT3-DOX exhibited a
bimodal size distribution at about 15 and 30 nm independent of pH, whereas the size of the control DDS containing
no peptide sequence, mPEG-DOX, was measured as ∼ 15–20 nm. At the end of 72 h, % doxorubicin release from
both of the DDSs was observed to be below 8.5 ± 3% in the absence of cathepsin B, and it increased to 17 ± 2% in
the presence of cathepsin B for mPEG-AT3-DOX. Complete degradation of AT3 peptide within 3 h upon incubation
with cathepsin B suggests that lower than expected doxorubicin release is likely due to the aggregation tendency of
mPEG-AT3-DOX. Absolute IC50 values indicated that the cytotoxicity trend of the samples is in the order of free DOX
≥ mPEG-AT3-DOX >mPEG-DOX. Considering these results, PEG-peptide-doxorubicin conjugates can be promising
candidates in cancer therapy if they are designed to have more pronounced pH-responsive behavior to increase the drug
release rate.
Key words: Polymer conjugates, peptide, doxorubicin, cathepsin B, controlled release
1. Introduction
In order to minimize their side effects and improve the therapeutic potential of chemotherapeutic drugs, an
ideal drug delivery system (DDS) should be designed to arrive at target tumor tissues by avoiding normal cells
without any leakage of the drug during transportation and release the cargo in a programmed manner.1−4
The enhanced permeability and retention (EPR) effect observed in tumor blood vessels has been widely
exploited in the design of tumor-targeted drug delivery systems. Pore size distribution of the blood vessels of
the normal cells is bimodal with approximately 9 nm and 50 nm in diameter, but the number of the 50-nm
pores is 100–1000 times less than that of the smaller pores. However, particles of up to 100 nm can easily enter
into tumor blood vessel pores.5,6 Additionally, aberrant lymphatic drainage systems of tumors cannot remove
macromolecules and lipids from the interstitial space, retaining these large molecules there over a long time
period. As a result of the abnormal pore structure of the cancer blood vessels, free drugs with small molecular
weights can diffuse into tumor sites and leave from there easily. Nanosized drug carriers, on the other hand,
can penetrate into tumor sites and be retained there.7 The EPR effect can be observed for macromolecules
with molecular weights greater than 40–50 kDa, even larger than 800 kDa, or of the size of bacteria, and it can
be enhanced with increasing molecular weight of the polymer as long as the size of the polymer fits the pore
∗Correspondence: [email protected]
385

SENTURK and TOP/Turk J Chem
size of tumor blood vessels.2,8−14 Examples of molecules that utilize the EPR effect are micellar systems and
liposomes, containing anticancer drugs.13,15−18
One of the challenges in the development of current drug delivery systems is to overcome multidrug
resistance (MDR), which is a major reason for the failure of many forms of chemotherapy due to the development
of resistance of cancer cells to chemotherapeutic drugs. Resistance to therapy has been correlated to the presence
of molecular pumps in tumor-cell membranes that transport toxic drugs out of the cell before the drug exhibits
its toxic properties within the nucleus or in the cytoplasm.19 Of the ATP-binding cassette (ABC) membrane
transporters, three efflux-pumps, namely P-glycoprotein (Pgp-ABCB1), multidrug resistance-associated protein-
1 (MRP1/ABCC1), and breast cancer resistance protein 113 (ABCG2), have been reported to commonly cause
MDR effect.20,21 One of the strategies to reverse the MDR effect is the use of anticancer drugs that can
escape from ABC transporters, such as alkylating drugs (cyclophosphamide), antimetabolites (5-fluorouracil),
and the anthracycline-modified drugs (annamycin and doxorubicin-peptide). So-called MDR inhibitors, MDR
modulators, MDR reversal agents, or chemosensitizers, which are not inherently toxic but are able to inhibit
ABC transporters, have also been proposed. However, most of them failed in clinical trials by exhibiting low
efficacy and high inherent toxicity or by altering pharmacokinetics and biodistribution of anticancer drugs
coadministered with MDR inhibitors.22,23
Nanoparticles that offer increased therapeutic potential of anticancer agents due to their passive and
active tumor-targeting abilities can potentially overcome MDR.24 They can bypass efflux-pumps as they are
internalized via either nonspecific or specific endocytosis, which results in high intracellular accumulation of
the drug.14,21 It was shown that reversal of the MDR effect could be possible when doxorubicin (DOX)
was attached to different nanoparticles including poly(isobutylcyano acrylate) (PIBCA), poly(isohexylcyano
acrylate) (PIHCA), dextran, and gold.25
Although most nanoparticle DDSs can accumulate in tumor tissues, the poor cellular uptake and insuf-
ficient intracellular drug release remain rate-limiting steps for reaching therapeutic drug concentration levels.
Thus, before being quickly eliminated by the reversal cells, an ideal DDS should exhibit fast drug release to
overcome MDR. Multifunctional stimuli-responsive delivery systems that ensure fast drug release kinetics by
a change in pH or enzyme levels have been proposed as an alternative strategy for the reversal of MDR.23,26
There are many reports that focused on the development of pH-responsive DDSs.27−37 However, DDSs that
can respond to lysosomal enzymes have been less explored.38−40
Cathepsin B, a lysosomal cysteine protease, is an important matrix protease frequently overexpressed in
highly metastatic cancer cells. Indeed, it is the imbalance between cathepsin B activity and cysteine proteinase
inhibitors that causes invasion and metastasis in cancer cells.41,42 One of the earliest studies testing a specific
peptide sequence as a substrate for cathepsin B is related to the conjugation of an antibody to radiolabeled
benzyl EDTA via an ALAL linker. Incubation of this conjugate in vitro with cathepsin B enzyme resulted
in rapid cleavage of the conjugate with a half-life of 6 h.43 In another study, Schmid et al. designed a DDS
based on human serum albumin and DOX conjugate containing an enzymatically degradable linker RRALAL
sequence. It was shown that cathepsin B cleaved the RRALAL sequence efficiently and very fast, facilitating
the release of DOX.40 Veronesa et al. prepared a number of prodrug systems based on PEG-peptide-DOX
and tested the effect of different enzymatically degradable peptide sequences on drug release and therapeutic
activity of these prodrugs. It was reported that GFLG and GLFG sequences were cleaved by the lysosomal
enzyme cocktail and the rate of DOX release was controlled by the peptidyl linker.39 In a similar study, DOX
release was observed to be faster for HPMA-based copolymers with a GFLG linker compared to the conjugate
386

SENTURK and TOP/Turk J Chem
without an enzymatically degradable linker in the presence of cathepsin B.38 Consequently, these studies clearly
indicated that drug release properties of the carrier systems can be controlled by the addition of enzymatically
degradable domains.
The aim of this study is to develop a first-generation DDS composed of methoxy polyethylene glycol
(mPEG), a de novo peptide denoted as AT3 containing pH-responsive and enzymatic degradable units, and
DOX. The FDA-approved, nonimmunogenic, nonantigenic, and hydrophilic mPEGmolecule was used to increase
the solubility and blood circulation time of DDSs.44−48 The carrier system was prepared by mPEG and peptide
conjugation. A model anticancer drug, DOX, was attached to the carrier systems via a stable amide bond to
obtain the final form of the DDS. A peptide-free mPEG-DOX system was also prepared as a control system
to assess the role of the peptide. The synthesis route of mPEG-DOX is given in Figure 1. The conjugation
reaction between mPEG and AT3 peptide and the reaction scheme of DOX conjugation to mPEG-AT3 are
given in Figures 2 and 3, respectively. Purity of the carrier molecules was determined by spectroscopic and
chromatographic methods. Size and stability of the drug delivery systems (mPEG-DOX and mPEG-AT3-DOX)
were evaluated using dynamic light scattering. Atomic force microscopy (AFM) was employed to monitor the
morphology of the mPEG-DOX. DOX release profiles of the DDSs were determined in neutral and acidic buffer
conditions and in the presence and absence of cathepsin B enzyme. Finally, the cytotoxicity of the DDSs against
A549 and PC3 cell lines was determined using MTT assay.
Figure 1. Reaction scheme of mPEG-DOX conjugate.
2. Results and discussion
In the design of the peptide, AT3, cysteine at the N-terminal containing thiol functionality was used to serve
as a PEG attachment site via Michael addition reaction (Figure 2). Six histidine residues were added to the
sequence with an intention to impart pH responsiveness to AT3 as the pKa value of histidine is around 6.0. The
RRALAL sequence functions as a substrate for cathepsin B enzyme. Glutamic acid having a COO− functional
group was placed at the C-terminus of the peptide to attach DOX (Figure 3). Glycines next to cysteine and
glutamic acid were incorporated to the peptide to minimize steric effects during conjugation reactions.
387

SENTURK and TOP/Turk J Chem
Figure 2. Reaction scheme of mPEG-AT3 conjugate.
Purity of the AT3 peptide and mPEG-AT3 conjugate was assessed by HPLC and MALDI-TOF-MS.
HPLC curves of the peptide, mPEG-maleimide (mPEG-MAL), and mPEG-AT3 are given in Figures 4a–4c,
respectively. No significant UV absorption that corresponded to the peptide or mPEG-MAL fraction was
observed in the chromatogram of the mPEG-peptide conjugate, suggesting that the conjugate has high purity.
Respective MALDI-TOF-MS results of the peptide and mPEG-AT3 are represented in Figures 5a and 5b. In
the MALDI-TOF-MS of the peptide (Figure 5a), the largest peak matched the theoretical molar mass of the
peptide. From Figure 5b, the molar mass of the mPEG-peptide conjugate was determined as 7300 Da, very
close to its theoretical value (∼ 7100 Da, i.e. Mpeptide = 2095 Da and MPEG = 5000 Da). These results show
that the conjugation reaction was performed successfully.
Mole percentages of DOX incorporated into the carrier molecules, mPEG and mPEG-AT3, were deter-
mined as 109 ± 5% and 187 ± 8%, respectively. Surprisingly, moles of DOX in the composition of the carrier
systems were found to be higher than moles of available COO− groups, suggesting that there might be free
DOX in the isolated carrier systems or side reactions that caused multiple attachments of DOX molecules to
the carrier molecules.
Size distributions of the AT3 peptide, mPEG-MAL, and mPEG-AT3 conjugate are given in Figures 6a–
6c, respectively. Average hydrodynamic diameters of AT3, mPEG-MAL, and mPEG-AT3 were measured as 1.7
± 0.4 nm, 4.4 ± 0.4 nm, and 5.2 ± 0.4 nm, respectively. The size of mPEG-MAL agreed with the theoretical
value (4.4 nm) calculated by using the following equation:49
DH = 0.3824M0.559n ,
where DH (A) and Mn (Da) are the hydrodynamic diameter and molar mass of PEG, respectively. These
results showed that mPEG-AT3 has no aggregation tendency.
388

SENTURK and TOP/Turk J Chem
Figure 3. Reaction scheme of mPEG-AT3-DOX conjugate.
mPEG-AT3
10 20 30 40 50
0
500
1000
mPEG-MAL
0
500
1000
AT3
0
500
1000
(c)
Elution time (min)
(b)
A d
ezil
amr
oN
(a)
Figure 4. HPLC curves of (a) AT3, (b) mPEG-MAL, and (c) mPEG-AT3.
Respective size distributions of mPEG-DOX and mPEG-AT3-DOX measured at different pH values and
time intervals are shown in Figures 7 and 8. Initially, average sizes of mPEG-DOX were determined as 15 ± 3
nm and 19 ± 2 nm at pH 5 and pH 7.4, respectively, as given in Figure 7a. This is more than twice the size of
389

SENTURK and TOP/Turk J Chem
Figure 5. MALDI-TOF mass spectra of (a) AT3 and (b) mPEG-AT3.
1 10 100 1000
0
20
0
20
0
20
(c)
Hydrodynamic diameter (nm)
Volu
me
(%)
(b)
(a)
Figure 6. Size distributions of (a) AT3, (b) mPEG-MAL, and (c) mPEG-AT3.
the mPEG, indicating that the mPEG-DOX system tends to aggregate. At the end of 24 h (Figure 7b) and 48
h (Figure 7c), the size of mPEG-DOX at both neutral pH and pH 5 did not change significantly, suggesting that
the aggregates are stable. mPEG-AT3-DOX showed a bimodal size distribution centered at ∼ 15 and ∼ 30
nm, independent of pH, initially (Figure 8a). Hence, the number of histidines in the structure seems to be not
enough to thoroughly disintegrate the aggregates. Figure 8b indicated that incubation of mPEG-AT3-DOX at
390

SENTURK and TOP/Turk J Chem
pH 5 for 24 h resulted in a unimodal particle size distribution with an average size of ∼ 30 nm. After 48 h, the
average size shifted to 30 nm for both pH values, as given in Figure 8c.
1 10 100 1000
0
20
0
20
0
20
pH 7.4
pH 5.0
(c)
Hydrodynamic diameter (nm)
pH 7.4
pH 5.0
pH 7.4
pH 5.0
(b)
(a)
Volu
me
(%)
1 10 100 1000
0
20
0
20
0
20
pH 7.4
pH 5.0
(c)
Hydrodynamic diameter (nm)
pH 7.4
pH 5.0
Volu
me
(%)
pH 7.4
pH 5.0
(b)
(a)
Figure 7. Size distributions of mPEG-DOX measured at
(a) 0 h, (b) 24 h, and (c) 48 h.
Figure 8. Size distributions of mPEG-AT3-DOX mea-
sured at (a) 0 h, (b) 24 h, and (c) 48 h.
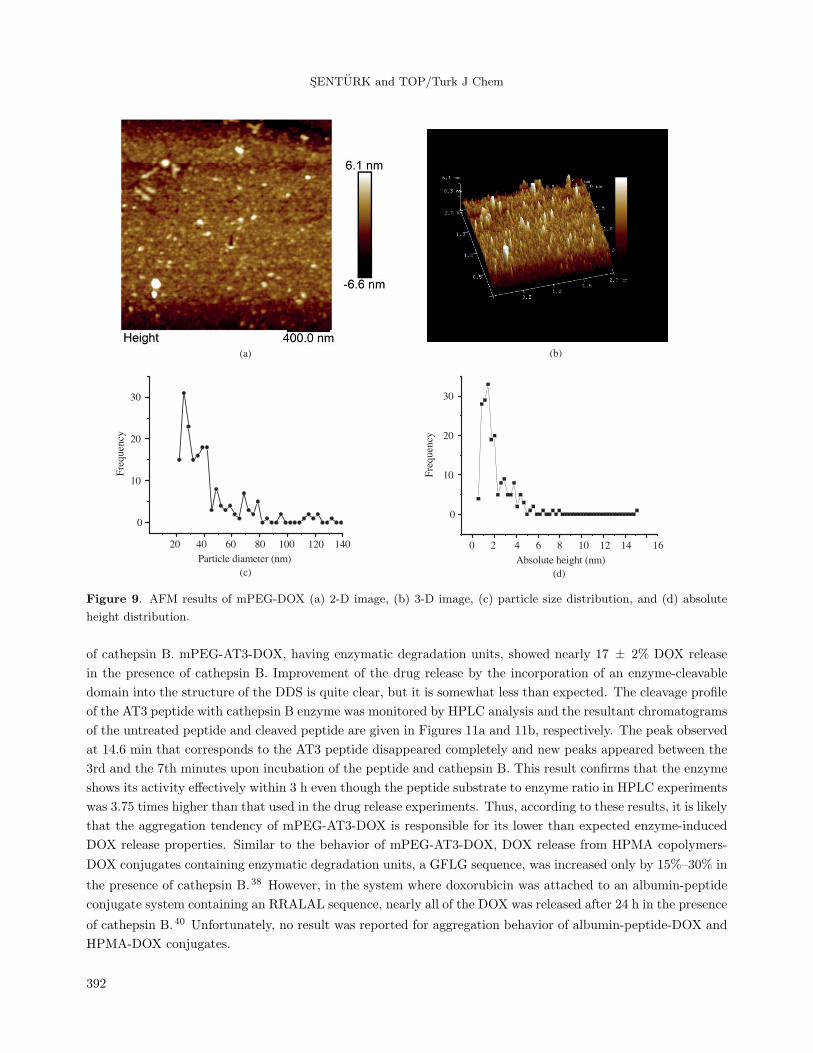
2D and 3D AFM images, particle size, and absolute height distribution obtained from the AFM data of
mPEG-DOX are given in Figures 9a–9d, respectively. The 2D AFM image of mPEG-DOX showed that the
aggregates have circular or elliptical cross-sections. In its particle size distribution, it was observed that most
of the aggregate population ranged between 25 and 40 nm. Slightly larger size values obtained from the AFM
image compared to those of dynamic light scattering measurement can be explained by the tip broadening
effect, which causes inaccurate measurements in the lateral dimensions. Another reason could be the fusion
of the aggregates as a result of increasing concentration during sample preparation. Height distribution of the
aggregates was obtained to be around 1.4 and 5.5 nm, which corresponds to the size of the collapsed aggregates
where PEG chains are no longer hydrated.50 Unfortunately, it was not possible to get decent AFM images of
the mPEG-AT3-DOX sample due to its strong aggregation tendency that evolved during sample preparation.
Nevertheless, both light scattering and AFM results confirmed that the drug delivery systems self-assemble
upon DOX conjugation. It was reported that PEG-peptide-DOX conjugates containing different enzymatically
degradable units also showed aggregation tendency.39 DOX was shown to have a hydrophobic character as
it could be incorporated into the hydrophobic poly(caprolactam) (PCL) block of a PEG-PCL-PEG micellar
system.51 Thus, the carrier systems, mPEG-DOX and mPEG-AT3-DOX, composed of hydrophobic DOX and
hydrophilic mPEG, are likely to form aggregate structures with DOX in the core of the DDSs and PEG molecules
at the surface.
DOX release curves of the carrier systems at different conditions are given in Figure 10. The maximum
% drug release value of the conjugates was obtained as 8.5 ± 3% with no significant difference in the absence
391
SENTURK and TOP/Turk J Chem
(a)
(b)
20 40 60 80 100 120 140
0
10
20
30
Fre
quen
cy
Particle diameter (nm)
(c)
0 2 4 6 8 10 12 14 16
0
10
20
30
Fre
qu
ency
Absolute height (nm)
(d)
Figure 9. AFM results of mPEG-DOX (a) 2-D image, (b) 3-D image, (c) particle size distribution, and (d) absolute
height distribution.
of cathepsin B. mPEG-AT3-DOX, having enzymatic degradation units, showed nearly 17 ± 2% DOX release
in the presence of cathepsin B. Improvement of the drug release by the incorporation of an enzyme-cleavable
domain into the structure of the DDS is quite clear, but it is somewhat less than expected. The cleavage profile
of the AT3 peptide with cathepsin B enzyme was monitored by HPLC analysis and the resultant chromatograms
of the untreated peptide and cleaved peptide are given in Figures 11a and 11b, respectively. The peak observed
at 14.6 min that corresponds to the AT3 peptide disappeared completely and new peaks appeared between the
3rd and the 7th minutes upon incubation of the peptide and cathepsin B. This result confirms that the enzyme
shows its activity effectively within 3 h even though the peptide substrate to enzyme ratio in HPLC experiments
was 3.75 times higher than that used in the drug release experiments. Thus, according to these results, it is likely
that the aggregation tendency of mPEG-AT3-DOX is responsible for its lower than expected enzyme-induced
DOX release properties. Similar to the behavior of mPEG-AT3-DOX, DOX release from HPMA copolymers-
DOX conjugates containing enzymatic degradation units, a GFLG sequence, was increased only by 15%–30% in
the presence of cathepsin B.38 However, in the system where doxorubicin was attached to an albumin-peptide
conjugate system containing an RRALAL sequence, nearly all of the DOX was released after 24 h in the presence
of cathepsin B.40 Unfortunately, no result was reported for aggregation behavior of albumin-peptide-DOX and
HPMA-DOX conjugates.
392

SENTURK and TOP/Turk J Chem
In vitro cytotoxicity of the AT3 peptide, mPEG-MAL, and mPEG-AT3 conjugate was tested in A549 and
PC3 cell lines at a single concentration and compared with that of mPEG-AT3-DOX. Respective % viability
values of A549 and PC3 cells obtained at the end of 24 h and 48 h are given in Figures 12a and 12b. mPEG-MAL
at 1.5 mg/mL concentration exhibited no cytotoxic effect to either cell line. AT3 and mPEG-AT3 were used
at a lower concentration (0.75 mg/mL) in the A549 cell line experiment and their cytotoxic effects could only
be seen at the end of 48 h (Figure 12a). However, the AT3 peptide and mPEG-AT3 at 1.5 mg/mL showed
notable cytotoxicity against PC3 cells (Figure 12b). It was reported that many cytotoxic peptides contain
positively charged lysine and arginine.52 A previously designed peptide, AT1, with a sequence of CG3H6G3E,
did not show any cytotoxicity against the A549 cell line.53 Thus, the cytotoxic effect of AT3 seems to be due
to the arginines in the enzymatic degradation unit (RRALAL) and can be observed at high concentrations.
mPEG-AT3-DOX at 0.75 mg/mL was observed to be quite toxic to both cell lines, as expected.
0 20 40 60 80
0
10
20
30
mPEG-DOX at pH 7.4
mPEG-AT3-DOX at pH 7.4
mPEG-AT3-DOX at pH 5.0
mPEG-AT3-DOX + cathepsin B at pH 5.0
DO
X r
elea
se (
%)
Time (h)
AT3 + cathepsin B (3 h)
0 10 20 30
0
500
1000
AT3
0
500
1000
**** *
Elution time (min)
peptide fragments
(b)
Abso
rban
ce a
t 214 n
m
(a)AT3
*
Figure 10. DOX release profiles of mPEG-DOX and
mPEG-AT3-DOX samples.
Figure 11. HPLC curves of AT3 peptide (a) before and
(b) after being treated with cathepsin B for 3 h.
AT3 mPEG-MAL mPEG-AT3 mPEG-AT3-DOX
0
20
40
60
80
100
)%(
ytil ib
aiV
Sample
24 h
48 h
(a)
AT3 mPEG-MAL mPEG-AT3 mPEG-AT3-DOX
0
20
40
60
80
100
)%(
ytil ib
aiV
Sample
24 h
48 h
(b)
Figure 12. Viability % of (a) A549 cells and (b) PC3 cells in the presence of AT3, mPEG-MAL, mPEG-AT3, and
mPEG-AT3-DOX.
393

SENTURK and TOP/Turk J Chem
Representative concentration-dependent MTT cell proliferation assay results of free DOX, mPEG-DOX,
and mPEG-AT3-DOX samples obtained at the end of 24 h are given in Figures 13a and 13b for the A549 and
PC3 cell lines, respectively. Absolute IC50 values of free DOX and the DOX-conjugated carrier systems are
summarized in the Table. P-values show that for the DOX and mPEG-AT3-DOX pair, no statistically significant
difference exists in their absolute IC50 values obtained at the end of 24 h against both A549 and PC3 cell lines.
Additionally, IC50 values of mPEG-DOX and mPEG-AT3-DOX obtained at the end of 48 h for PC3 cells were
also determined to be statistically not different from each other. For other pairwise comparisons of the IC50
values of the samples, P-values were obtained to be lower than 0.05. According to the general trend of IC50
values, cytotoxicity of the samples can be ordered as free DOX ≥ mPEG-DOX-AT3 >mPEG-DOX. Lower
in vitro cytotoxicity of the DOX-conjugated DDSs compared to free DOX has been also observed in other
systems such as PEG-DOX,54 peptide-DOX,31 PEG-peptide-DOX,39 and biodegradable block copolymer-
DOX30 conjugates and it was attributed to the slower internalization and cytosol/nucleus distribution rates of
these conjugated systems. It was reported that histidine-rich peptides and polypeptides facilitated endosomal
cracking due to the proton sponge effect. In the acidic environment of endosomes, the imidazole group of
histidine with a pKa around 6 gets protonated, which in turn causes the entry of chlorine ions and water
into endosomes. As a result of increase in osmotic pressure, the endosomal membrane collapses and entrapped
components are released into the cytosol.55,56 Thus, slightly higher cytotoxicity of mPEG-AT3-DOX compared
to mPEG-DOX can be attributed to the possible endosomal escape ability of mPEG-AT3-DOX. Additionally,
cytotoxicity of the AT3 peptide might also contribute to the total cytotoxicity of the mPEG-AT3-DOX system.
DOX.HCl
mPEG-DOX
mPEG-AT3-DOX
0.1 1 10 1000
25
50
75
100
(a)
)%(
ytilib
aiV
DOX.HCl
mPEG-DOX
mPEG-AT3-DOX
0.1 1 10 1000
25
50
75
100
)%(
ytilib
aiV
Equivalent DOX concentration (µg/mL) Equivalent DOX concentration (µg/mL)
(b)
Figure 13. Growth inhibition curves of free DOX and the DOX-conjugated DDSs obtained at the end of 24 h using (a)
A549 and (b) PC3 cell lines.
Table. Absolute IC50 values of free DOX and the DOX-conjugated DDSs.
Sample
DOX equivalent IC50 value (µg/mL)A549 PC324 h 48 h l24 h 48 h
Free DOX 1.37 ± 0.05 0.60 ± 0.06 l1.51 ± 0.07 NA*mPEG-DOX 1.87 ± 0.27 0.80 ± 0.13 l3.81 ± 0.72 0.54 ± 0.04mPEG-AT3-DOX 1.33 ± 0.11 0.72 ± 0.07 l1.63 ± 0.80 0.39 ± 0.03*Could not be determined.
394

SENTURK and TOP/Turk J Chem
In this study, DDSs containing stable amide bonds were synthesized. The peptide (AT3), which includes
an enzymatic degradation unit and pH-sensitive histidines, was incorporated into the mPEG-AT3-DOX system.
The mPEG-DOX conjugate was synthesized as a control carrier system to determine the effect of the peptide on
the performance of the DDS. Both mPEG-DOX and mPEG-AT3-DOX conjugates showed aggregation tendency.
The % DOX release was observed to increase for mPEG-AT3-DOX at pH 5.0 in the presence of cathepsin B.
However, improvement in % DOX release is lower than expected when compared to the DOX release rates of
other carrier systems containing enzymatic degradation domains. HPLC analysis showed that the AT3 peptide
treated with cathepsin B was completely cleaved. Thus, the modest DOX release profile of mPEG-AT3-DOX
can be explained by the lowered interactions of the cathepsin B and RRALAL sequence due to the aggregation
tendency of mPEG-AT3-DOX. It is likely that the DOX release rate of mPEG-AT3-DOX can be improved
significantly by the addition of more histidines into the peptide sequence, which improves pH responsiveness of
mPEG-AT3-DOX by promoting disintegration of the aggregate structures at lysosomal pH. The cytotoxicity
tests showed that the mPEG-AT3-DOX conjugate was almost as toxic as free DOX. This observation suggests
that the AT3 peptide having some degree of cytotoxicity and the proton sponge effect of histidines in mPEG-
AT3-DOX may favor its superior cytotoxic activity compared to mPEG-DOX. Considering the quite low IC50
value and tendency to form aggregated structures of the mPEG-AT3-DOX system obtained in this study coupled
with the possibility of addition of more histidines to tune pH responsiveness and to increase membrane disruption
properties of the resultant DDS, PEG-peptide-doxorubicin conjugates can have value in cancer therapy.
3. Experimental
3.1. Materials
Methoxypolyethylene glycol propionic acid (MW: 5000 g/mol with >80% COOH functionality), methoxy-
polyethylene glycol maleimide (MW: 5000 g/mol with >90% maleimide functionality), (benzotriazol-1-yloxy)
tripyrrolidinophosphonium hexafluorophosphate (PyBOP) and solvents, dimethyl sulfoxide (DMSO), and di-
ethyl ether (DEE) were obtained from Sigma-Aldrich. N-Ethyldiisopropylamine (DIPEA) and doxorubicin hy-
drochloride were purchased from Alfa Aesar and Medkoo Biosciences, respectively. For solid-phase peptide syn-
thesis, rink amide MBHA resin, Fmoc-Cys(Trt)-OH, Fmoc-Gly-OH, Fmoc-His(Trt)-OH, Fmoc-Arg(Pbf)-OH,
Fmoc-Ala-OH, Fmoc-Leu-OH, Fmoc-Glu(OtBu)-OH (NovaBiochem), N,N,N,N-tetramethyl-O-(1H-benzotriazol-
1-yl)uronium hexafluorophosphate (HBTU), 1-hydroxybenzotriazole hydrate (HOBt) (P3 Biosystems), dimethyl-
formamide (DMF), 4-methylmorpholine (NMM) (Sigma-Aldrich), and piperidine (Acros) were used. Triiso-
propyl silane (TIS), 1,3-dimethoxybenzene (DMB), and synthesis-grade trifluoroacetic acid (TFA) (Merck)
were employed in the preparation of the cleavage cocktail. Sodium chloride, sodium hydroxide, L-cysteine,
ethylenediaminetetraacetic acid (EDTA) sodium salt (Sigma-Aldrich), sodium phosphate monobasic, imidazole
(Fluka), sodium acetate, acetic acid, and hydrochloric acid (Merck) were used to prepare the buffer solutions.
Affinity chromatography and gel permeation chromatography were carried out using respective HisPur Ni-NTA
(Thermo Scientific) and Sephadex LH-20 (GE Healthcare) resins. SnakeSkin (MW 3.5 kDa) dialysis tubing
(Thermo Scientific) was used in dialysis processes and drug release experiments. Merck cathepsin B (human
liver, C = 0.53 mg protein/mL, specific activity >10 U/mg protein) was employed as a lysosomal enzyme in drug
release and related experiments. HPLC-grade acetonitrile and spectroscopic-grade TFA were purchased from
Sigma-Aldrich and Merck, respectively. Sinapic acid (Sigma-Aldrich) was employed in MALDI-TOF mass spec-
troscopy experiments. European-grade fetal bovine serum (FBS), gentamycin sulfate, trypsin-EDTA solution
C, and 0.5% trypan blue solution purchased from Biological Industries and RPMI-1640 growth medium with
395

SENTURK and TOP/Turk J Chem
L-glutamine and 3-(4,5-dimethylthiazol-2-yl)-2,5-diphenyltetrazolium bromide (MTT) obtained from Sigma-
Aldrich and Amresco, respectively, were used in the cell culture experiments.
3.2. Preparation of mPEG-DOX conjugate
Doxorubicin was attached to the polymeric carrier molecule, mPEG propionic acid, using amine-carboxylic acid
reaction via the formation of the amide bond as given in Figure 1. In a typical reaction, 20 mg of mPEG (0.004
mmol) and 14.4 mg of PyBOP (0.028 mmol) were dissolved in 4 mL of DMSO and 9.6 µL of DIPEA (0.055
µmol) and 8 mg of DOX (0.0136 mmol) was added. The reaction was allowed to proceed in the dark at 30 ◦C
and 120 rpm for 3 days. The reaction mixture was then precipitated on cold DEE (stored at –20 ◦C) to isolate
the mPEG-DOX conjugate. The precipitate (mainly mPEG-DOX conjugate) was washed with cold DEE to
remove some portion of unreacted DOX until no color was detected in the washing solution. Residual DEE in
the conjugate was evaporated in a fume hood. The dried pellet was dissolved in 2 mL of DMSO and applied
to a gel permeation chromatography column containing Sephadex LH-20 resin suspended in DMSO to remove
the remaining unreacted DOX. A colorimetric PEG detection test based on the complex formation of barium
iodide and PEG was applied to identify the PEG-containing fractions eluted from the column.57 The fractions
isolated were precipitated on cold DEE. After the removal of DEE in a fume hood, the conjugate was dissolved
in deionized water, freeze-dried, and stored at –20 ◦C (yield = 72 ± 19%).
3.3. Preparation of mPEG-peptide-DOX conjugate
The mPEG-peptide-DOX conjugate system was synthesized by following three consecutive steps:
• Solid-phase peptide synthesis
• mPEG-peptide conjugation
• Drug attachment
The peptide used in this study, denoted as AT3, with a sequence of CG3H6R2ALALG3E, was synthesized
using an AAPTEC Focus XI model automated peptide synthesis instrument. Solid-phase peptide synthesis was
conducted on a rink amide MBHA resin (0.66 mmol/g functionality) by employing the Fmoc strategy. Base-
labile protecting groups of the resin and amino acids were removed by using 20% piperidine in DMF. HBTU
and NMM were used as activating agents for all coupling reactions. For histidine and cysteine, HOBt was
also added to prevent racemization during coupling reactions. Double coupling cycles were carried out for each
amino acid. After the cleavage reaction was performed using 92.5:5:2.5 TFA:DMB:TIS cocktail,58 the resin was
filtered using a polypropylene column and the supernatant was precipitated over cold DEE. The precipitate
was washed with DEE and centrifuged twice. DEE was evaporated under nitrogen flow at room temperature.
Finally, the raw peptide was dissolved in 1% acetic acid in deionized water, freeze-dried and stored at –20 ◦C.
mPEG-MAL was conjugated to the thiol group of cysteine located at the N-terminal of the peptide via
Michael addition reaction as given in Figure 2. In this reaction, 40 mg (0.019 mmol) of peptide was dissolved in 5
mL of 0.1% acetic acid in deionized water, and the solution pH was brought to a neutral pH by the addition of 15
mL of PBS buffer (100 mM phosphate buffer with 150 mM NaCl at pH 7.2) while passing nitrogen gas over the
solution. Then 100 mg (0.02 mmol) of PEG-MAL was added to the peptide solution under inert atmosphere and
the solution was stirred at room temperature for 4 h. Unreacted mPEG-MAL was removed from the reaction
mixture via affinity chromatography with Ni-NTA resin. Excess peptide was removed by extensive dialysis
396

SENTURK and TOP/Turk J Chem
against deionized water using a SnakeSkin dialysis tubing membrane (MWCO 3.5 kDa). Then the isolated
mPEG-AT3 conjugate was freeze-dried and stored at –20 ◦C (yield = 16 ± 1%).
Doxorubicin was attached to mPEG-AT3 by following a similar procedure used in mPEG-propionic acid
and DOX conjugation (yield = 76 ± 1%). In this reaction, the amine group of DOX was attached to the
carboxylic acid group of the C-terminal glutamic acid in the peptide sequence (Figure 3).
3.4. Characterization
Reverse-phase HPLC analyses were carried out on an Agilent 1100 model HPLC system using a C18 analytical
column (Inertsil WP-300, 5 µ m, 4.6 × 100 mm). In all runs, 0.1% TFA in deionized water and 0.08% TFA
in acetonitrile were used as solvent A and solvent B, respectively. In the analyses of AT3, mPEG-MAL, and
mPEG-AT3, the samples were dissolved in 0.1% TFA in filtered deionized water and 100 µL of sample was
injected to the column. First, a mixture of solvent A and solvent B at a ratio of 95:5 was passed through the
column for 15 min. Then the solvent A:solvent B ratio was changed from 95:5 to 40:60 linearly within 40 min.
To monitor cathepsin B activity, 1.5 mg of AT3 was dissolved in 1 mL of buffer (50 mM sodium acetate
buffer containing 150 mM NaCl, 1 mM EDTA, and 5 mM L-cysteine at pH 5.0) and then, after filtration, it
was added to 10 µL of cathepsin B (0.53 mg/mL). The solution was incubated at 37 ◦C for 3 h and 100 µL of
solution was injected into the C18 analytical column. Solvent A:solvent B was kept at a ratio of 95:5 for 5 min
and then the ratio was changed to 40:60 in 50 min. For all analyses, solvent flowrate was set to 1 mL/min and
a UV detector at 214 nm was used to monitor elution of the samples from the column.
MALDI-TOF-MS (Bruker Daltonics, Autoflex III Smartbeam) was used to confirm molar masses of the
peptide and mPEG-peptide conjugate. The samples were dissolved in 0.1% TFA in deionized water and sinapic
acid was utilized as a matrix for the analysis. The identity of AT3 peptide was confirmed with m/z = 2095.7
Da [(M+H)+ , calculated = 2096.3 Da].
At high temperature, acid hydrolysis of DOX results in cleavage of the glycosidic bond between the
aglycone (adriamycinone) and the sugar (daunosamine) group.59 Thus, total DOX contents of the DDSs were
determined based on the molar absorbance coefficient of adriamycinone at 488 nm measured as 15,551 L mol−1
cm−1 . The hydrolysis reactions were carried out at 1 N HCl concentration at 50 ◦C for 2 h. UV-Vis absorbance
measurements were performed using a PerkinElmer Lambda-45 model UV-Vis spectrophotometer.
Size distribution and stability of the conjugates were determined by using the dynamic light scattering
method. Experiments were carried out on a Malvern ZetaSizer Nano ZS90 model instrument. Samples at 1.5
mg/mL concentration were dissolved in either of the following buffers: 10 mM phosphate buffer with 150 mM
NaCl at pH 7.4 or 10 mM acetate buffer with 150 mM NaCl at pH 5.0. The solutions were filtered using
a regenerated cellulose filter with 0.2-µ m pore size and equilibrated at 25 ◦C for at least 10 min prior to
measurements. For each sample, three measurements were recorded. Diffusion coefficients of the samples were
determined using the CONTIN method and hydrodynamic diameters were calculated using the Stoke–Einstein
equation with the software of the instrument. Size distributions of the samples were measured immediately
after dissolving the samples at the end of 24 h and 48 h upon incubating the samples at 37 ◦C.
The AFM image of mPEG-DOX was obtained using a Digital Instruments MMSPM Nanoscope IV model
instrument. Freshly cleaved mica substrate was exposed to UV light for further cleaning its surface. The mPEG-
DOX sample was dissolved in deionized water at a concentration of ∼ 1.5 mg/mL. After filtering (0.2 µ m,
regenerated cellulose filter), 2 µL of solution was applied to the plate and diluted by adding 8 µL of filtered
397

SENTURK and TOP/Turk J Chem
deionized water. The plate was dried at room temperature while protected from light, and an image of the
sample was taken in tapping mode using a silicone tip. 2D and 3D AFM images, particle size distribution, and
absolute height analysis were obtained using NanoScope Analysis software.
DOX release curves of the samples were obtained by using dialysis method. Approximately 0.75 mg of
sample dissolved in 0.5 mL of an appropriate buffer solution (10 mM phosphate buffer with 150 mM NaCl at
pH 7.4, 10 mM acetate buffer with 150 mM NaCl at pH 5.0, and 50 mM sodium acetate buffer with 150 mM
NaCl, 1 mM EDTA, 5 mM L-cysteine at pH 5.0 for cathepsin B experiment) was placed in a membrane tubing
having MWCO of 3.5 kDa, exposed to 12.5 mL of the same buffer at 37 ◦C in a vial, and shaken at 150 rpm. To
evaluate lysosomal enzyme-induced DOX release behavior of mPEG-AT3-DOX, 5 µL of cathepsin B solution
(0.53 mg/mL) was added to the solution inside the membrane and 100 µL of solution was taken from each vial
at specific intervals (1, 3, 6, 10, 24, 48, 55, and 72 h) and 100 µL of fresh buffer was replaced. Amount of
released DOX from the carrier systems was determined via fluorescence emission intensity measurements at 590
nm with an excitation wavelength of 480 nm using a VarioSkan Flash Multimode Reader (Thermo Scientific)
microplate reader. Drug release profiles of the samples were constructed based on two independent experiments
for each sample.
Cytotoxicity of the samples was evaluated via MTT method using human lung adenocarcinoma epithelium
(A549) and human prostate (PC3) cell lines. Both cell lines were grown in RPMI 1640 medium containing 10%
FBS and 50 µ g/mL gentamycin. In a typical MTT assay, 90 µL of aliquots of the cells (1 × 10⁴ cells/well) were
seeded in a 96-well tissue culture microplate and incubated at 37 ◦C in 5% CO2 atmosphere for 24 h. After the
incubation, 10 µL of sample dissolved in sterile PBS was added to the wells at different concentrations. Sterile
PBS was used as a control sample. Five independent experiments were performed for each concentration. The
plates were incubated for a further 24 h and 48 h and 10 µL of MTT (5 mg/mL) in sterile PBS was added to each
well. At the end of 3 h, the microplates were centrifuged at 1800 rpm for 5 min and supernatants were removed.
Finally, the empty wells were filled with 100 µL of DMSO and shaken at 150 rpm for 5 min. Absorbance values of
each well were measured at 590 nm (reference wavelength = 690 nm) using a Thermo Scientific VarioSkan Flash
Multimode Reader. Absolute IC50 values of the samples were determined as a concentration that corresponded
to 50% viability. Statistical analysis of cytotoxicity results of the DDSs and free DOX was carried out using
the independent two-sample t-test method in Minitab software. P <0.05 obtained from pairwise comparison of
the samples was considered to be a statistically significant difference.
Acknowledgments
This work was financially supported by the Scientific and Technological Research Council of Turkey (TUBITAK)
with grant number 112S554. The Materials Research Center and Biotechnology and Bioengineering Application
and Research Center at Izmir Institute of Technology are thanked for making the respective AFM experiments
and cell studies possible. Mass spectroscopy experiments were performed at the Biological Mass Spectrometry
and Proteomics Facility at Izmir Institute of Technology. We also thank Professor Talat Yalcın for kindly
providing mass spectroscopy data.
References
1. Qin, S. Y.; Zhang, A. Q.; Cheng, S. X.; Rong, L.; Zhang, X. Z. Biomaterials 2017, 112, 234-247.
2. Tong, R.; Cheng, J. J. Macromol. Sci. Polymer Rev. 2007, 47, 345-381.
3. Li, Z.; Tan, S.; Li, S.; Shen, Q.; Wang, K. Oncol. Rep. 2017, 38, 611-624.
398

SENTURK and TOP/Turk J Chem
4. Sun, Q.; Zhou, Z.; Qiu, N.; Shen, Y. Adv. Mater. 2017, 29, 1606628.
5. Fukumori, Y.; Ichikawa, H. Adv. Powder Technol. 2006, 17, 1-28.
6. Zaimy, M.; Saffarzadeh, N.; Mohammadi, A.; Pourghadamyari, H.; Izadi, P.; Sarli, A.; Moghaddam, L.; Paschepari,
S.; Azizi, H.; Torkamandi, S. Cancer Gene Ther. 2017, 24, 233-243.
7. Ulbrich, K.; Hola, K.; Subr, V.; Bakandritsos, A.; Tucek, J.; Zboril, R. Chem. Rev. 2016, 116, 5338-5431.
8. Bae, Y. H.; Park, K. J. Control. Release 2011, 153, 198-205.
9. Gabizon, A.; Shmeeda, H.; Horowitz, A. T.; Zalipsky, S. Adv. Drug Deliv. Rev. 2004, 56, 1177-1192.
10. Liang, X. J.; Chen, C.; Zhao, Y.; Wang, P. C. Methods Mol. Biol. 2010, 596, 467-488.
11. Maeda, H. Adv. Enzyme Regul. 2001, 41, 189-207.
12. Maeda, H. Proc. Jpn. Acad., Ser. B Phys. Biol. Sci. 2012, 88, 53-71.
13. Maeda, H.; Bharate, G.; Daruwalla, J. Eur. J. Pharm. Biopharm. 2009, 71, 409-419.
14. Yuan, Y.; Cai, T.; Xia, X.; Zhang, R.; Chiba, P.; Cai, Y. Drug Deliv. 2016, 23, 3350-3357.
15. Peer, D.; Karp, J. M.; Hong, S.; Farokhzad, O. C.; Margalit, R.; Langer, R. Nat. Nanotechnol. 2007, 2, 751-760.
16. Torchilin, V. Adv. Drug Deliv. Rev. 2011, 63, 131-135.
17. Maruyama, K. Adv. Drug Deliv. Rev. 2011, 63, 161-169.
18. Gabizon, A. A.; Patil, Y.; La-Beck, N. M. Drug Resist. Updat. 2016, 29, 90-106.
19. Brys, A. K.; Gowda, R.; Loriaux, D. B.; Robertson, G. P.; Mosca, P. J. Biotechnol. Adv. 2016, 34, 565-577.
20. Persidis, A. Nat. Biotechnol. 1999, 17, 94-95.
21. Saraswathy, M.; Gong, S. Biotechnol. Adv. 2013, 31, 1397-1407.
22. Ozben, T. FEBS Lett. 2006, 580, 2903-2909.
23. Yin, Q.; Shen, J.; Zhang, Z.; Yu, H.; Li, Y. Adv. Drug Deliv. Rev. 2013, 65, 1699-1715.
24. Huang, Y.; Cole, S. P.; Cai, T.; Cai, Y. Oncol. Lett. 2016, 12, 11-15.
25. Patel, N. R.; Pattni, B. S.; Abouzeid, A. H.; Torchilin, V. P. Adv. Drug Deliv. Rev. 2013, 65, 1748-1762.
26. Chistiakov, D. A.; Myasoedova, V. A.; Orekhov, A. N.; Bobryshev, Y. V. Curr. Pharm. Des. 2017, 23, 3301-3308.
27. Ganta, S.; Devalapally, H.; Shahiwala, A.; Amiji, M. J. Control. Release 2008, 126, 187-204.
28. Gillies, E. R.; Frechet, J. M. Bioconjug. Chem. 2005, 16, 361-368.
29. Guo, X.; Shi, C.; Wang, J.; Di, S.; Zhou, S. Biomaterials 2013, 34, 4544-4554.
30. Hu, X.; Liu, S.; Huang, Y.; Chen, X.; Jing, X. Biomacromolecules 2010, 11, 2094-2102.
31. Jin, Y.; Huang, Y.; Yang, H.; Liu, G.; Zhao, R. Chem. Commun. 2015, 51, 14454-14457.
32. Lee, E. S.; Gao, Z.; Bae, Y. H. J. Control. Release 2008, 132, 164-170.
33. Lee, E. S.; Na, K.; Bae, Y. H. J. Control. Release 2005, 103, 405-418.
34. Shenoy, D.; Little, S.; Langer, R.; Amiji, M. Mol. Pharm. 2005, 2, 357-366.
35. Zhou, L.; Cheng, R.; Tao, H.; Ma, S.; Guo, W.; Meng, F.; Liu, H.; Liu, Z.; Zhong, Z. Biomacromolecules 2011,
12, 1460-1467.
36. Sonawane, S. J.; Kalhapure, R. S.; Govender, T. Eur. J. Pharm. Sci. 2017, 99, 45-65.
37. Kanamala, M.; Wilson, W. R.; Yang, M.; Palmer, B. D.; Wu, Z. Biomaterials 2016, 85, 152-167.
38. Etrych, T.; Jelınkova, M.; Rıhova, B.; Ulbrich, K. J. Control. Release 2001, 73, 89-102.
39. Veronese, F. M.; Schiavon, O.; Pasut, G.; Mendichi, R.; Andersson, L.; Tsirk, A.; Ford, J.; Wu, G.; Kneller, S.;
Davies, J. Bioconjug. Chem. 2005, 16, 775-784.
399

SENTURK and TOP/Turk J Chem
40. Schmid, B.; Chung, D. E.; Warnecke, A.; Fichtner, I.; Kratz, F. Bioconjug. Chem. 2007, 18, 702-716.
41. Nomura, T.; Katunuma, N. J. Med. Invest. 2005, 52, 1-9.
42. Yano, M.; Hirai, K.; Naito, Z.; Yokoyama, M.; Ishiwata, T.; Shiraki, Y.; Inokuchi, M.; Asano, G. Surg. Today
2001, 31, 385-389.
43. Studer, M.; Kroger, L. A.; DeNardo, S. J.; Kukis, D. L.; Meares, C. F. Bioconjug. Chem. 1992, 3, 424-429.
44. Harris, J. M.; Chess, R. B. Nat. Rev. Drug Discov. 2003, 2, 214-221.
45. Mishra, P.; Nayak, B.; Dey, R. Asian J. Pharm. Sci. 2016, 11, 337-348.
46. Veronese, F. M.; Pasut, G. Drug Discov. Today 2005, 10, 1451-1458.
47. Hamley, I. W. Biomacromolecules 2014, 15, 1543-1559.
48. von Roemeling, C.; Jiang, W.; Chan, C. K.; Weissman, I. L.; Kim, B. Y. Trends Biotechnol. 2017, 35, 159-171.
49. Fee, C. J.; Van Alstine, J. M. Chem. Eng. Sci. 2006, 61, 924-939.
50. Hong, G.; Zou, Y.; Antaris, A. L.; Diao, S.; Wu, D.; Cheng, K.; Zhang, X.; Chen, C.; Liu, B.; He, Y. et al. Nat.
Commun. 2014, 5, 4206.
51. Cuong, N. V.; Jiang, J. L.; Li, Y. L.; Chen, J. R.; Jwo, S. C.; Hsieh, M. F. Cancers 2010, 3, 61-78.
52. Kourie, J.; Shorthouse, A. Am. J. Physiol., Cell Physiol. 2000, 278, C1063-C1087.
53. Balcı, B. MSc, Department of Chemical Engineering, Izmir Institute of Technology, Turkey, 2016.
54. Gou, P.; Liu, W.; Mao, W.; Tang, J.; Shen, Y.; Sui, M. J. Mater. Chem. B 2013, 1, 284-292.
55. Meng, Z.; Luan, L.; Kang, Z.; Feng, S.; Meng, Q.; Liu, K. J. Mater. Chem. B 2017, 5, 74-84.
56. Midoux, P.; Pichon, C.; Yaouanc, J. J.; Jaffres, P. A. Br. J. Pharmacol. 2009, 157, 166-178.
57. Gong, X. W.; Wei, D. Z.; He, M. L.; Xiong, Y. C. Talanta 2007, 71, 381-384.
58. Stathopoulos, P.; Papas, S.; Tsikaris, V. J. Pept. Sci. 2006, 12, 227-232.
59. Configliacchi, E.; Razzano, G.; Rizzo, V.; Vigevani, A. J. Pharm. Biomed. Anal. 1996, 15, 123-129.
400