peis: a novel approach of tumor purity estimation by
TRANSCRIPT

RESEARCH Open Access
PEIS: a novel approach of tumor purityestimation by identifying information sitesthrough integrating signal based on DNAmethylation dataShudong Wang1, Lihua Wang1, Yuanyuan Zhang1,2*, Shanchen Pang1 and Xinzeng Wang3*
From International Conference on Data Science, Medicine and BioinformaticsNanning, China. 22-24 June 2019
Abstract
Background: Tumor purity plays an important role in understanding the pathogenic mechanism of tumors. Thepurity of tumor samples is highly sensitive to tumor heterogeneity. Due to Intratumoral heterogeneity of geneticand epigenetic data, it is suitable to study the purity of tumors. Among them, there are many purity estimationmethods based on copy number variation, gene expression and other data, while few use DNA methylation dataand often based on selected information sites. Consequently, how to choose methylation sites as information siteshas an important influence on the purity estimation results. At present, the selection of information sites was oftenbased on the differentially methylated sites that only consider the mean signal, without considering other possiblesignals and the strong correlation among adjacent sites.
Results: Considering integrating multi-signals and strong correlation among adjacent sites, we propose anapproach, PEIS, to estimate the purity of tumor samples by selecting informative differential methylation sites.Application to 12 publicly available tumor datasets, it is shown that PEIS provides accurate results in the estimationof tumor purity which has a high consistency with other existing methods. Also, through comparing the results ofdifferent information sites selection methods in the evaluation of tumor purity, it shows the PEIS is superior toother methods.
Conclusions: A new method to estimate the purity of tumor samples is proposed. This approach integrates multi-signals of the CpG sites and the correlation between the sites. Experimental analysis shows that this method is ingood agreement with other existing methods for estimating tumor purity.
Keywords: DNA methylation, Differential methylation, Integrating signal, Tumor purity
© The Author(s). 2019 Open Access This article is distributed under the terms of the Creative Commons Attribution 4.0International License (http://creativecommons.org/licenses/by/4.0/), which permits unrestricted use, distribution, andreproduction in any medium, provided you give appropriate credit to the original author(s) and the source, provide a link tothe Creative Commons license, and indicate if changes were made. The Creative Commons Public Domain Dedication waiver(http://creativecommons.org/publicdomain/zero/1.0/) applies to the data made available in this article, unless otherwise stated.
* Correspondence: [email protected]; [email protected] of Computer Science and Technology, China University ofPetroleum (East China), Qingdao, Shandong, China3College of Mathematics and Systems Science, Shandong University ofScience and Technology, Qingdao, Shandong, ChinaFull list of author information is available at the end of the article
Wang et al. BMC Bioinformatics 2019, 20(Suppl 22):714https://doi.org/10.1186/s12859-019-3227-1
BackgroundAn important issue in tumor research is that tumorsamples during sampling are always mixed with normalcells, which we refer to as “tumor purity”. The under-standing of the pathogenic mechanism of tumor hasrisen from the physical and chemical carcinogenesis inthe past to the virus and mutation carcinogenesis later,and finally to the multi-step and multi-factor carcino-genesis. Accurate measurements of tumor purity canreduce the variance caused by other mixed genes insamples and help more effectively target which genesmay be closely related to tumor development. In recentyears, estimating the “tumor purity” [1–5] of the sample,i.e. the percentage of tumor cells in tumor sample, hasreceived increasing attention. Traditional tumor purityestimation is basically obtained by pathological re-searchers through image and image analysis. As well asthe later technologies based on cell classification, thesemethods not only cost human resources but also havehigh costs, which are not suitable for large-scale promo-tion. Coincidentally, because of the significant geneticand epigenetic differences between tumor cells and nor-mal cells, it is feasible to use available high-throughputdata to estimate tumor purity. There are many methodsto estimate tumor purity using gene expression [6], copynumber variation [7] and single nucleotide polymorph-ism [8] as predictors, but few are based on methylationdifferences.DNA methylation is a common and important mech-
anism in gene expression regulation, which is involvedin cell differentiation and proliferation, tumorigenesisand other important life activities [9, 10]. Changes innormal methylation patterns of the genome are closelyrelated to the occurrence of tumors [11]. AbnormalDNA methylation patterns (including CpG island hyper-methylation and DNA hypo-methylation) and tumori-genesis have been one of the hot topics in the medicalfield. DNA methylation is found in almost all cancersand occurs before or at an early stage of cancer, so it isexpected to be an ideal marker for early diagnosis ofcancer. An important problem in tumor research is thatthe tumor tissues obtained from clinical trials are highlyheterogeneous. They are a mixture of tumor cells, adja-cent normal cells, stromal and infiltrating immune cells.In high-throughput DNA methylation experiments, thewhole tumor sample is processed to extract DNA fromall cells and then the methylation levels are profiled. So,these measurements are actually mixed signals from dif-ferent cell types [12]. If there is no correct interpretationof the sample mix, there will be deviations in the down-stream data analysis, such as differential methylationanalysis and sample clustering.Methods of using DNA methylation data to estimate
tumor purity have gradually emerged, nowadays. It is
not difficult to find that the current methods of usingmethylation data to estimate tumor purity are mostlybased on the selection of information sites. MethylPurify[1] uses EM algorithm to identify information sites andthen infer tumor purity; InfiniumPurify [5] identifies in-formation sites by rank-sum test and estimates tumorpurity which combined with Gaussian kernel density;PAMES [2] utilizes the methylation levels of dozens ofhighly cloned specific CpG sites to evaluate the purity oftumor samples. The common feature of these methodsis that they need to select the information differencemethylation site first and then carry out purity estima-tion. Currently, methods for identifying differentiallymethylation sites based on differences in mean methyla-tion levels between tumors and normal samples havebeen well studied. However, the estimation results oftumor purity by different methods are disparate. There-fore, it is particularly important to select the differen-tially methylation sites related to tumor as theinformation sites. Early on, IMA [13] used Wilcoxonrank-sum tests to identify differential methylation sitesby comparing mean values. Afterwards, FastDMA [14]used variance analysis based on linear model. Currently,most of the methods which identify differentially methyl-ated sites are based on hypothesis testing, and integrat-ing signal as well as strong correlation among adjacentsites is seldom considered.Here, we present an approach to estimate tumor
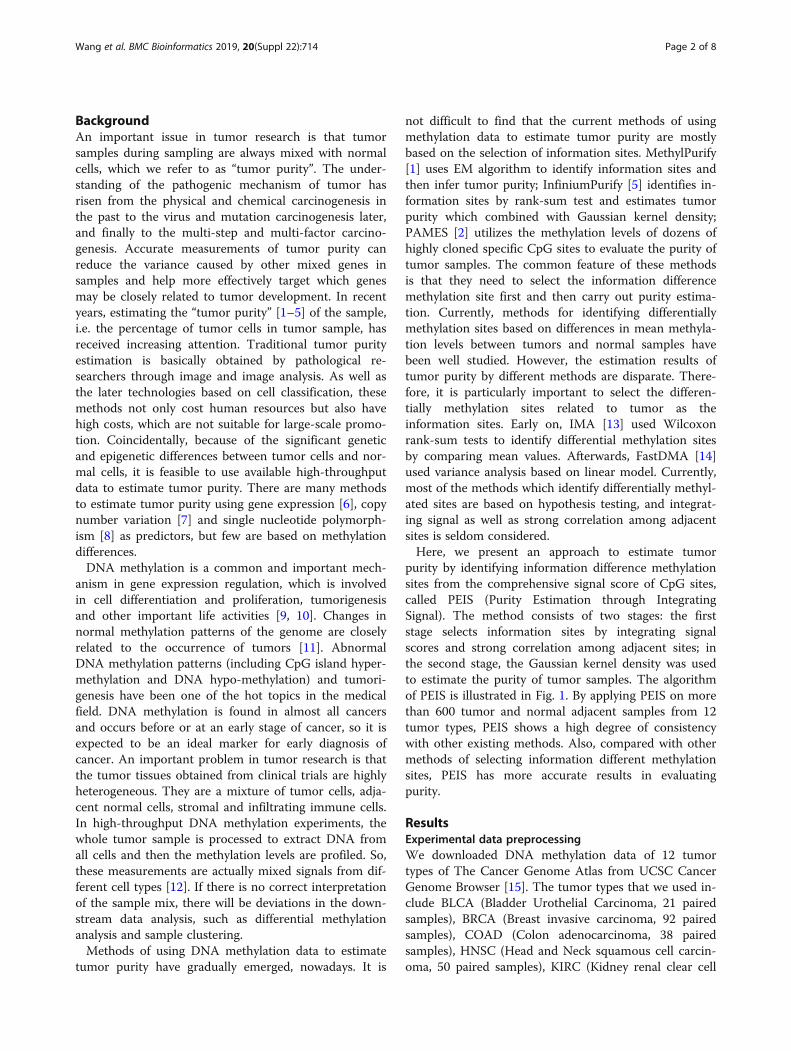
purity by identifying information difference methylationsites from the comprehensive signal score of CpG sites,called PEIS (Purity Estimation through IntegratingSignal). The method consists of two stages: the firststage selects information sites by integrating signalscores and strong correlation among adjacent sites; inthe second stage, the Gaussian kernel density was usedto estimate the purity of tumor samples. The algorithmof PEIS is illustrated in Fig. 1. By applying PEIS on morethan 600 tumor and normal adjacent samples from 12tumor types, PEIS shows a high degree of consistencywith other existing methods. Also, compared with othermethods of selecting information different methylationsites, PEIS has more accurate results in evaluatingpurity.
ResultsExperimental data preprocessingWe downloaded DNA methylation data of 12 tumortypes of The Cancer Genome Atlas from UCSC CancerGenome Browser [15]. The tumor types that we used in-clude BLCA (Bladder Urothelial Carcinoma, 21 pairedsamples), BRCA (Breast invasive carcinoma, 92 pairedsamples), COAD (Colon adenocarcinoma, 38 pairedsamples), HNSC (Head and Neck squamous cell carcin-oma, 50 paired samples), KIRC (Kidney renal clear cell
Wang et al. BMC Bioinformatics 2019, 20(Suppl 22):714 Page 2 of 8
Carcinoma, 160 paired samples), KIRP (Kidney renalpapillary cell carcinoma, 45 paired samples), LIHC (Liverhepatocellular carcinoma, 50 paired samples), LUAD(Lung adenocarcinoma, 29 paired samples), LUSC (Lungsquamous cell carcinoma, 41 paired samples), PRAD(Prostate adenocarcinoma, 50 paired samples), THCA(Thyroid carcinoma, 56 paired samples), UCEC (UterineCorpus Endometrial Carcinoma, 33 paired samples). Thenumber of tumor and normal-adjacent samples of thesetumor types is not less than twenty. And all DNAmethylation CpG sites were filtered for quality controlin advance.
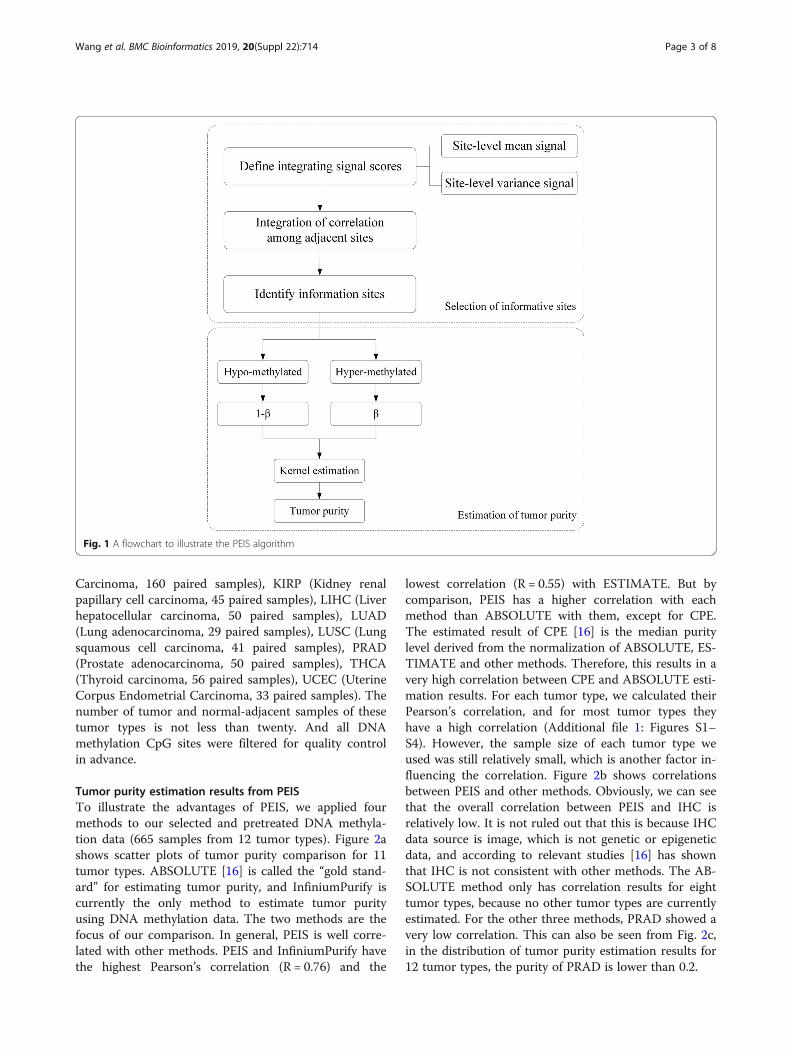
Tumor purity estimation results from PEISTo illustrate the advantages of PEIS, we applied fourmethods to our selected and pretreated DNA methyla-tion data (665 samples from 12 tumor types). Figure 2ashows scatter plots of tumor purity comparison for 11tumor types. ABSOLUTE [16] is called the “gold stand-ard” for estimating tumor purity, and InfiniumPurify iscurrently the only method to estimate tumor purityusing DNA methylation data. The two methods are thefocus of our comparison. In general, PEIS is well corre-lated with other methods. PEIS and InfiniumPurify havethe highest Pearson’s correlation (R = 0.76) and the
lowest correlation (R = 0.55) with ESTIMATE. But bycomparison, PEIS has a higher correlation with eachmethod than ABSOLUTE with them, except for CPE.The estimated result of CPE [16] is the median puritylevel derived from the normalization of ABSOLUTE, ES-TIMATE and other methods. Therefore, this results in avery high correlation between CPE and ABSOLUTE esti-mation results. For each tumor type, we calculated theirPearson’s correlation, and for most tumor types theyhave a high correlation (Additional file 1: Figures S1–S4). However, the sample size of each tumor type weused was still relatively small, which is another factor in-fluencing the correlation. Figure 2b shows correlationsbetween PEIS and other methods. Obviously, we can seethat the overall correlation between PEIS and IHC isrelatively low. It is not ruled out that this is because IHCdata source is image, which is not genetic or epigeneticdata, and according to relevant studies [16] has shownthat IHC is not consistent with other methods. The AB-SOLUTE method only has correlation results for eighttumor types, because no other tumor types are currentlyestimated. For the other three methods, PRAD showed avery low correlation. This can also be seen from Fig. 2c,in the distribution of tumor purity estimation results for12 tumor types, the purity of PRAD is lower than 0.2.
Fig. 1 A flowchart to illustrate the PEIS algorithm
Wang et al. BMC Bioinformatics 2019, 20(Suppl 22):714 Page 3 of 8
This may be due to different methylation rates of pros-tate cancer genes at different stages. Among them, themethylation level of gene Retinoic acid receptor β2(RARβ2) is related to clinical staging [17, 18]. In prostatecancer, the methylation rate of at least two genes instage D is significantly higher than that in stage B and C.It is possible that as the disease progresses, the numberof methylated genes in prostate cancer increases. Forone type of tumor, we evaluated the integrating signalscore of the overall mean and variance of a CpG site inall samples. Through the study on the information sitesof PRAD, we found that the selected information sitesshowed significant differences in the CpG sites of a sin-gle sample, while the remaining samples showed almostno differences. This results in the selected information
sites being specific and not applicable to all samples.Therefore, PEIS estimates low purity. Only one of the50 PRAD tumor samples has a high correlation withother methods, while the rest generally have a low cor-relation. Based on the study of PRAD clinical data, wefind that the initial pathological diagnosis age of thissample is before 45 years old, and the age of theremaining 49 samples is after 50 years old (Additionalfile 2: Table S1). We do not rule out the possibility thatthe results of PRAD tumor purity are age-related.Moreover, the data set used in the experiment is proc-essed to remove the locus on the sex chromosomes,while PRAD mainly affect men after the age of 60, andthe cancer-related locus may be largely located on thesex chromosomes, which would also affect the
Fig. 2 a Scatter plots showing comparison of purities for tumor samples. b Correlations between PEIS and five kinds of estimates for 12 tumortypes. c Distribution of tumor purities estimation results from PEIS for 12 tumor types
Wang et al. BMC Bioinformatics 2019, 20(Suppl 22):714 Page 4 of 8
subsequent tumor purity estimation results. Inaddition, we observed that the bottom edge of theTHCA boxplot using PEIS is significantly longer thanthat using InfiniumPurify and some types of tumorshow slightly lower consistency, all of these becausethe number of samples used in our study is small, soeven small deviations can reduce the consistency withInfiniumPurify. This is also the part that we will con-tinue to study in depth in the follow-up work.
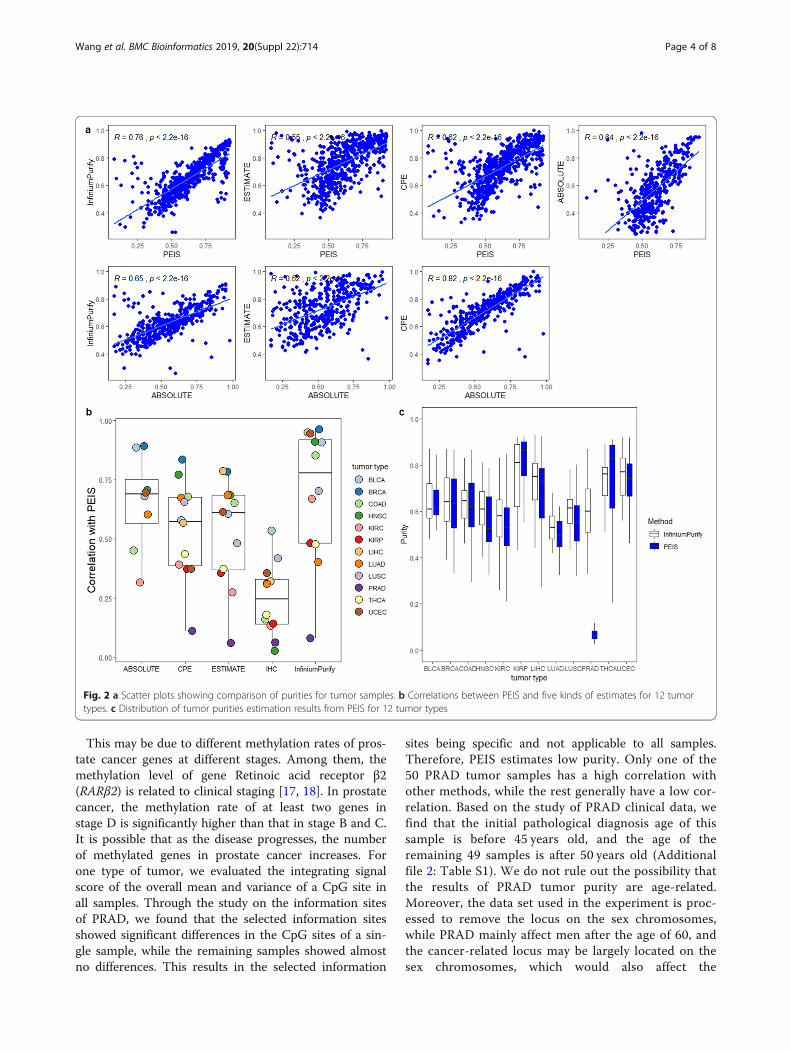
Comparison of purity estimation results from differentmethodsThe different methylation sites selected by different in-formation sites selection methods are not the same. Theselection of tumor-related information sites is crucial forthe estimation of tumor purity. The tumor purity esti-mation results of several different information sites se-lection methods as shown in Fig. 3. And the differentcolored sites in the figure represent different tumortypes. In general, the results estimated by traditional hy-pothesis testing methods have relatively low correlationwith other methods. The purity estimation results ofpaired T-test are generally high and close to 1. Paired T-test estimation, which compares the β-value of the over-all samples, ignores the influence of individual sampleson the whole. As can be seen from Fig. 3a, the purity es-timation of almost all samples of KIRC verges on 1.
Through some understanding and analysis of the tumor,this may be due to KIRC (Kidney renal clear cell carcin-oma) is often clinically mixed with granulosa cell carcin-oma and spindle cell carcinoma. It is difficult todistinguish by using the β-value analysis of the whole, soit may affect the estimation of the true purity. However,this reason is only our speculation at present, whichneeds to be further explored and confirmed. F-test itselfis not suitable for selecting information sites, becausetoo many information sites are selected according to thesignificance of mean difference. Here, the purity estimateobtained is the result of the combination of F-test andT-test to select information sites. It is not difficult to seethat the result of F-test combined with T-test is muchbetter than that of T-test alone, as shown in Fig. 3b. Thehypothesis test method of KL divergence is not suitablefor identifying information sites, because it considers theproportion of β-value of each sample to the whole, andignores the methylation information carried by the sam-ple itself. Here, the KL divergence method we use is im-proved by Zhang et al. [19], hereinafter referred to as KLdivergence. According to Fig. 3c, it can be seen that sometumor purity estimated by KL divergence is obviouslyhigh, while a small part is obviously low. It was found thatthe purity of KIRC tumor samples estimated by KL diver-gence was generally higher, but the PRAD estimationresults were highly correlated with InfiniumPurify. For
Fig. 3 a Scatter plots showing comparison of tumor purities from T-test with ABSOLUTE, ESTIMATE, CPE and InfiniumPurify, respectively. bScatter plots showing comparison of tumor purities from F-test with other methods. c Scatter plots showing comparison of purities for tumorsamples from KL divergence with other methods
Wang et al. BMC Bioinformatics 2019, 20(Suppl 22):714 Page 5 of 8
PRAD which tumor purity estimation are not ideal byPEIS, the result of KL divergence estimation is in goodagreement with other methods. This also indicates thatdue to tumor heterogeneity, information sites identifiedby different methods are not the same and different infor-mation sites selection methods behave differently for dif-ferent types of tumor.
DiscussionAccurate estimation of tumor purity is of great signifi-cance for subsequent differential methylation analysisand genetic analysis. Using the available genetic orepigenetic data to estimate tumor purity has more bio-logical value and reference significance. Tumor hetero-geneity brings difficulties and opportunities to estimatetumor purity. Currently, gene expression data and copynumber variation (CNV) data are mostly used to esti-mate tumor purity. However, methods for estimatingpurity using DNA methylation data are far fewer. Withthese considerations in mind, we propose a method tointegrating signal and correlation among adjacent sitesto identify information sites related to tumor puritybased on DNA methylation data. By applying ourmethod to 12 tumor types, we found that for mosttumor samples, our estimates were highly consistentwith other commonly used methods.There are many types of data on cancer studies, such
as gene mutations, gene expression and DNA methyla-tion. Nevertheless, none of the data was specifically usedto estimate tumor purity, in other words, tumor samplesestimation results from these data are not absolutely ac-curate. Every data has its drawbacks in the estimationprocess. For example, gene expression data can showhuge differences because of slight differences in DNA.The estimation results of copy number variation dataare extremely uncertain. Therefore, comprehensive useof CNV and SNV (somatic number variation) to evaluatetumor purity has emerged. By comparison, DNA methy-lation data are more stable. Of course, the estimation ofDNA methylation data is only a supplement to the exist-ing results, which cannot be said to be the standard.It is worth noting that most methods of estimating
tumor purity by DNA methylation are based on the se-lection of information differential methylation sites. Theselection of information sites has a great influence onthe estimation results. That is because the selected infor-mation sites contain low tumor information. However,this cannot be used as a criterion to evaluate the selec-tion method of differentially methylated sites. Therefore,the key to estimate tumor purity using DNA methylationdata is to select information sites containing more tumorinformation. This is also the direction that we shouldmake continuous efforts in the future. It can also be seenfrom the experimental results in this paper that the same
method has different results for different tumor types,which is caused by tumor heterogeneity.During the experiment, we also tried to calculate the
influence of all the sites within the range of 1000 bps,but the information sites are more likely to be the siteswith close genomic distance, and some of the sites them-selves are not differential methylation sites, which willaffect the subsequent purity estimation. Perhaps apply-ing this approach to CpG islands will yield better results.This is the part we will study in the followingexperiments.
ConclusionsTumor tissue obtained in clinical work is often mixedwith non-tumor cells, which play an important role intumor growth, progression or drug resistance. It is verysignificant to correctly estimate and adjust the purity oftumors for subsequent differential methylation analysisand genetic analysis. In order to select tumor-related in-formation sites to estimate tumor purity, we present anapproach based on integrating multi-signals and strongcorrelation among adjacent sites. We apply our methodto 12 tumor types and show that our method is highlyconsistent with the results of other commonly usedtools. The correlation between sites is taken into ac-count to make the selected information sites morebiological.
MethodsIn this section, we detailedly introduce PEIS which con-siders CpG site’s integrating signal score and correlationamong adjacent sites, and then combine with Gaussiankernel density to estimate the tumor purity. The algo-rithm of PEIS is illustrated in Fig. 1.
Selection of informative CpG sitesIn selecting information sites, we use a two-stage ap-proach. Firstly, the integrating signal scores of the CpGsites are calculated, and secondly, the correlation amongadjacent sites is integrated for score correction.
Step 1: define integrating signal scoresWith reference to [20], the integrating signal score of aCpG site i could be expressed as
Si ¼ Tmij jTmi
λimi þ 1−λið Þvið Þ;
where mi = ϕ−1(1 − pmi) and vi = ϕ−1(1 − pvi). Here, Φ isstandard normal quantile function, and pmi and pvi areP-values from the two-sided paired T-test testing andfrom the one-sided F-test testing at CpG site i, respect-ively. The sites with mean and variance signal scores ofzero and smaller than zero are not considered. Because
Wang et al. BMC Bioinformatics 2019, 20(Suppl 22):714 Page 6 of 8
the P-values of these sites are pmi > 0.5 and pvi > 0.5.Here, Tmi is the T-statistic of the two-sided paired T-
test, wherejTmi jTmi
indicate whether the CpG site i is nega-
tive sign or positive sign. Positive signals indicate hyper-methylated, whereas negative signals indicate hypo-methylated. Since the mean and variance signals havedifferent scales, we weight the two scores by λi and 1− λi, respectively. According to [20], the weight of thebalanced mean and variance signal score is defined as
λi ¼ vimi þ vi
:
In general, we are supposed to multiply our respectiveweights by the corresponding scores, but this will mag-nify the effect of one of the signals, the mean or the vari-ance, on the final result. For instance, the mean andvariance signals of site i are 0 and 38 (i.e. pmi > 0.5 andpvi = 1.0e − 320), and its signal score is 38; the mean andvariance signals of site j are 14.9 and 14.9 (i.e. pmi = 1.0e− 50 and pvi = 1.0e − 50), and its signal score is 14.9. Ob-viously, this can seriously affect the evaluation of the sitesignal score.
Step 2: integration of correlation among adjacent sitesThe significance of the site is not only determined bythe integrating signal of the site itself, but also influ-enced by the adjacent site. For a CpG site i, we define itsfinal integrating signal score (i.e. f Si ) as
f Si ¼ Si þ S0in :
Here, in (n = 1, 2) are the two nearest sites to CpGsite i, and the genomic distance between these two sites
and site i is less than 1000 bps. S0i1 and S
0i2 are the influ-
encing scores of CpG site i1 and i2 on site i. For theCpG site i1 which is close to CpG site i, We define theinfluencing score as
S0in= α � Sin .
Where, α indicates the influence ratio of site in on i,and we consider the influencing ratio to be inverselyproportional to the genomic distance. We define the in-fluencing ratio as
α ¼ 1−distance
1000;
where, distance represents the gene distance of the twosites. On the basis of final integrating signal scores, thetop 1000 sites with the highest score are selected. Thesignificance of CpG site (P-value) is converted into sig-nal score. The higher the signal score, the stronger thesignificance of the site.According to the relevant research and experiments,
the site with a genomic distance of less than 1000 bps
has the most obvious influence on CpG site i [20–22],that is to say, the site with a genomic distance of morethan 1000 bps has negligible influence on CpG site i. Inthe actual calculation process, we also consider the influ-ence of all sites within 1000 bps of the calculated CpGsite i on it. However, some sites were selected as infor-mation sites due to the influence of surrounding sites,and these sites originally were not differential methyla-tion sites. According to names of 1000 CpG sites, thecorresponding original DNA methylation data are se-lected for subsequent purity estimation.
Estimation of tumor purityHere, the method for estimating tumor purity is derivedfrom Zheng’s InfiniumPurify [5, 23]. According to β-values, the selected information sites were divided intohyper-methylated and hypo-methylated sites. The β-value of information sites in tumor samples is trans-formed as follows: the β-value of hyper-methylatedinformation sites remained unchanged, while that ofhypo-methylated information sites were converted to 1-β. These transformation rules are based on whether theβ-value is greater than 0.5, which is not affected by otherfactors. Then the transformed methylation levels of in-formation sites are processed by Gaussian kernel densityestimation method. The purity is estimated by densityfunction.
Supplementary informationSupplementary information accompanies this paper at https://doi.org/10.1186/s12859-019-3227-1.
Additional file 1. Supplementary figures, results and information.
Additional file 2. Supplementary table.
AcknowledgementsThe results published here are based on data downloaded from UCSCCancer Genome Browser. We greatly appreciate Prof. Shudong Wang’scareful guidance. We are grateful to Dr. Zhang who put forward many usefulsuggestions for the problems encountered in the experiment.
About this supplementThis article has been published as part of BMC Bioinformatics Volume 20Supplement 22, 2019: Decipher computational analytics in digital health andprecision medicine. The full contents of the supplement are available onlineat https://bmcbioinformatics.biomedcentral.com/articles/supplements/volume-20-supplement-22.
Authors’ contributionsWSD conceived the idea, wrote and edited the manuscript. WLH and ZYYprepared the experimental data, debugged the code, conducted theexperiments and interpreted the results. PSC and WXZ advised the study andreviewed the manuscript. All authors read and approved the finalmanuscript.
FundingPublication costs are funded by National Natural Science Foundation ofChina (61873281, 61572523, 61672033, 61672248 and 61902430).
Wang et al. BMC Bioinformatics 2019, 20(Suppl 22):714 Page 7 of 8
Availability of data and materialsAll data used in the experiments are from public databases (UCSC). Thedatasets generated during the current study are available from thecorresponding author on reasonable request.
Ethics approval and consent to participateNot applicable.
Consent for publicationNot applicable.
Competing interestsThe authors declare that they have no competing interests.
Author details1College of Computer Science and Technology, China University ofPetroleum (East China), Qingdao, Shandong, China. 2School of Informationand Control Engineering, Qingdao University of Technology, Qingdao,Shandong, China. 3College of Mathematics and Systems Science, ShandongUniversity of Science and Technology, Qingdao, Shandong, China.
Published: 30 December 2019
References1. Zheng X, Qian Z, Wu HJ, Wei L. MethylPurify: tumor purity deconvolution
and differential methylation detection from single tumor DNA methylomes.Genome Biol. 2014;15:419.
2. Benelli M, Romagnoli D, Demichelis F. Tumor purity quantification by clonalDNA methylation signatures. Bioinformatics. 2018;34:1642–9.
3. Wang F, Zhang N, Wang J, Wu H, Zheng X. Tumor purity and differentialmethylation in cancer epigenomics. Brief Funct Genom. 2016;15:elw016.
4. Zhang N, Wu H-J, Zhang W, Wang J, Wu H, Zheng X. Predicting tumorpurity from methylation microarray data. Bioinformatics. 2015;31:3401.
5. Zheng X, Zhang N, Wu HJ, Wu H. Estimating and accounting for tumorpurity in the analysis of DNA methylation data from cancer studies.Genome Biol. 2017;18:17.
6. Yoshihara K, Shahmoradgoli M, Martínez E, Vegesna R, Kim H, Torres-GarciaW, Trevino V, Shen H, Laird PW, Levine DA. Inferring tumour purity andstromal and immune cell admixture from expression data. Nat Commun.2013;4:2612.
7. Loo PV, Nordgard SH, Lingjærde OC, Russnes HG, Rye IH, Sun W, WeigmanVJ, Marynen P, Zetterberg A, Naume B. Allele-specific copy number analysisof tumors. Proc Natl Acad Sci U S A. 2010;107:16910–5.
8. Carter SL, Cibulskis K, Helman E, McKenna A, Shen H, Zack T, Laird PW,Onofrio RC, Winckler W, Weir BA. Absolute quantification of somatic DNAalterations in human cancer. Nat Biotechnol. 2012;30:413–21.
9. Hansen KD, Timp W, Bravo HC, Sabunciyan S, Langmead B, McDonald OG,Wen B, Wu H, Liu Y, Diep D, et al. Increased methylation variation inepigenetic domains across cancer types. Nat Genet. 2011;43:768–75.
10. Lister R, Pelizzola M, Dowen RH, Hawkins RD, Hon G, Tonti-Filippini J, NeryJR, Lee L, Ye Z, Ngo QM, et al. Human DNA methylomes at base resolutionshow widespread epigenomic differences. Nature. 2009;462:315–22.
11. Tycko B. Epigenetic gene silencing in cancer. J Clin Invest. 2000;105:401–7.12. Jaffe AE, Irizarry RA. Accounting for cellular heterogeneity is critical in
epigenome-wide association studies. Genome Biol. 2014;15:R31.13. Wang D, Yan L, Hu Q, Sucheston LE, Higgins MJ, Ambrosone CB, Johnson
CS, Smiraglia DJ, Liu S. IMA: an R package for high-throughput analysis ofIllumina’s 450K Infinium methylation data. Bioinformatics. 2012;28:729–30.
14. Wu D, Gu J, Zhang MQ. FastDMA: an Infinium HumanMethylation450Beadchip analyzer. PLoS One. 2013;8:e74275.
15. Kuhn RM, Haussler D, James Kent W. The UCSC genome browser andassociated tools. Brief Bioinform. 2013;14:144–61.
16. Aran D, Sirota M, Butte AJ. Systematic pan-cancer analysis of tumour purity.Nat Commun. 2015;6:8971.
17. Perry AS, Foley R, Woodson K, Lawler M. The emerging roles of DNAmethylation in the clinical management of prostate cancer. Endocr RelatCancer. 2006;13:357.
18. Gao T, He B, Pan Y, Li R, Xu Y, Chen L, Nie Z, Gu L, Wang SJPO. Theassociation of retinoic acid receptor beta2(RARβ2) methylation status andprostate cancer risk: a systematic review and meta-analysis. PLoS One. 2013;8:e62950.
19. Zhang Y, Zhang J, Shang J. Quantitative identification of differentiallymethylated loci based on relative entropy for matched case–control data.Epigenomics. 2013;5:631–43.
20. Wang Y, Teschendorff AE, Widschwendter M, Wang S. Accounting fordifferential variability in detecting differentially methylated regions. BriefBioinform. 2017;20:47–57.
21. Eckhardt F, Lewin J, Cortese R, Rakyan VK, Attwood J, Burger M, Burton J,Cox TV, Davies R. Down TAJNG: DNA methylation profiling of humanchromosomes 6, 20 and 22. Nat Genet. 2006;38:1378–85.
22. Sofer T, Schifano ED, Hoppin JA, Hou L, Baccarelli AA. A-clustering: a novelmethod for the detection of co-regulated methylation regions, and regionsassociated with exposure. Bioinformatics. 2013;29:2884–91.
23. Qin Y, Hao F, Ming C, Hao W, XJG Z. Diseases: infiniumPurify: an R packagefor estimating and accounting for tumor purity in cancer methylationresearch. Genes Dis. 2018;5:43–5.
Publisher’s NoteSpringer Nature remains neutral with regard to jurisdictional claims inpublished maps and institutional affiliations.
Wang et al. BMC Bioinformatics 2019, 20(Suppl 22):714 Page 8 of 8