pellet market overview - epc.bioenergyeurope.org · we sell 100 % renew - able energy in the form...
TRANSCRIPT

2017European Bioenergy Outlook
PELLETMARKETOVERVIEW

© 2017 European Biomass Association (AEBIOM)All rights reserved. No part of this publication may be reproduced, distributed, or transmitted in any form or by any means, including photocopying, recording, or other electronic or mechanical methods, without the prior written per-mission of the publisher. For permission requests, write to the publisher, addressed “Attention: Permission use AEBIOM European Bioenergy Outlook” at the address below, except in the case of brief quotations embodied in critical reviews and certain other noncommercial uses permitted by copyright law.
European Biomass Association Place du Champ de Mars 21050 BrusselsT : +32 2 318 40 [email protected] www.aebiom.org

List of
Contributors
This report was commissioned by AEBIOM & EPC:
RESEARCH DIRECTION AND LEAD AUTHORSHIP
Gilles GauthierJean-Marc JossartCristina Calderón
RESEARCH SUPPORT
Prakriti Archambeau
COMMUNICATION
Jean-Baptiste BoucherNino AveniVianney Stoll
CONTRIBUTORS
Annalisa Paniz (AIEL), Laura Baù (AIEL), João Ferreira (ANPEB), Pablo Rodero (AVEBIOM), Laura Tovey-Fall (Argus), Ludmila Wach (Baltic Energy Conservation Agency), Agnieszka Kędziora-Urbanowicz (Biocontrol), Ralf Schmersahl (DEPI), Martin Bentele (DEPI), Martin Behr (DEPI), Hannes Tuohiniitty (Bioenergia), Helena Biljuš (Croatian Wood Cluster), Marijan Kavran (Croatian Wood Cluster),Vladimir Stupavsky (CZPC), Arnold Dale (Ekman), Branko Glavonjic (Faculty of Forestry University of Belgrade), Werner Emhofer (Froling), Seth Walker (FutureMetrics), Kelvin Hong (Great Resources(Jilin) Corp.,Plc), Xuenan Xu (Great Re-sources(Jilin) Corp.,Plc), Nikos Damatis (HELLABIOM), Fiona Matthews (Hawkins Wright), Martin Englisch (Institut für Bioenergie ), Noel Gavigan (IrBEA), Didzis Palejs (LATbio), Guna Rasa (LATbio), Vilma Gaubyte (LITBIOMA), Justina Prunskaitė (LITBIOMA), Bengt-Erik Löfgren (Pelletsförbundet), Dorival Pinheiro Garcia (Pellets de Madeira), Martin Smedsrud Kristensen (NOBIO), Christian Schlagitweit (ProPellets AT), Christian Rakos (ProPellets AT), Marianne Gehring (ProPellets CH), Ronnie Kristensen (ProPellets DK), Eric Vial (Propellet FR), Frank Aaskov (UKPC), Nike Krajnc (Slovenian Forestry Institute), Gernot Stadlober ( Stad-lober GmbH), Anton Egor Voronov (Russian Pellet Index), Georgiy Geletukha (Bioenergy Association of Ukraine), John Arsenault (WPAC), Gordon Murray (WPAC), Andrew Lang (WBA).

Members
The European Pellet Council (EPC) is an umbrella organisation of the European Biomass Association (AEBIOM) founded in 2010, representing the interests of the European wood pellet sector. Its members are national pellet associations or related organisations from 16 countries. EPC represents the interests of the sector in Brussels and communicates the contributions the European pellet
sector can make to increase the use of renewable energy in Europe.
The European Pellet Council is a platform for the pellet sector to discuss the issues that need to be managed in the transition from a niche product to a major energy commodity. These issues include the standardisation and certification of pellet quality, safety, security of supply, education and training, and the quality of pellet-using devices.
In this regard, EPC manages the development of ENplus® quality certification.
For more information on the European Pellet Councilwww.epc.aebiom.org
For more information on the ENplus® certificationwww.enplus-pellets.eu
About the
European Pellet Council

A word from the President
2016 was another challenging year for the various actors of the European pellet sector, in stark contrast with the situation in Asia where both wood pellet production and consumption continue to grow rapidly. Last year’s growth rate was in fact the lowest we have experienced so far, with a slight decrease of EU-28 production with 0,4 % (+1 % for Europe), and a limited growth of EU-28 demand of +4,3% coupled with a decrease in heat device sales in most European countries.
In Europe, pellet demand for electricity production slightly decreased (-3.1 % for EU-28) from 2015 to 2016. 2017 will not witness any dramatic growth but 2018 will see more capacity coming online that will increase the consumption. Regarding the pellet heating sector, a third consecutive mild winter has negatively impacted the heating season 2015-2016. Fortunately, the heating season 2016-2017 was much more favourable, allowing the suppliers to clear their stock and improve their financial situation. Together with a slight increase in fossil fuel prices, this brought some optimism to the sector, materialised by a substantial rebound mainly in stove sales. The commercial heating sector, a great potential market for pellets, already shows some interesting developments in Eastern Europe and we hope for the same to happen in the rest of the region. We are now all looking forward to the heating season 2017-2018, the rather cold autumn we are currently experiencing allowing the industry to hope for good business.
However positive this is, it is still not enough as pellet heating remains a tiny part of the European energy mix, far from its rightful place. This technology presents great advantages at all levels of energy consumption, domestic, medium, or large scale, for the environment, for comfort and safety, and in terms of energy independence. We could go on for a while about the many benefits offered by wood pellets but we are all familiar with them, the short of it is simply that pellets are an exceptional way to move forward with the energy transition.In this regard, the sum of our actions for the last 12 months is very positive and we must continue to advocate intensively to our customers, to governments and to the various stakeholders of the energy sector to make wood pellets a key player in national and European energy markets, and ultimately achieve the transition to a decarbonized European energy sector. In this endeavour, there are
two major battles to be led in the near future.
The first one is air quality. In most European countries, air quality has indeed become a major issue, which it is set to remain for at least the next two decades. From one country to the next, situations may of course vary slightly; in Italy and France, pollution is mainly due to traffic and the burning of poor quality wood whereas in Poland, for instance, the use of coal is the main factor. Industry should strive to promote pellet heating as part of the solution to the problem of air quality, and consider this issue not as a threat but as a major opportunity for promotion, on which the whole sector should become very active.
The second battle concerns subsidies and economic support to renewables in general, and wood pellets in particular. In the past, we have experimented with several types of subsidies and while the financial support was good for the development of our industry, there were also some perverse effects to it. A better approach would be to achieve strong carbon taxes in Europe. This solution is costless for the states and a great incentive to switch from fossil fuels to renewables. The success of the Swedish experience, a leading force on this issue with now 120 €/t C eq., is striking and should be an inspiration for the rest of us. France started following this route in 2014 with the implementation of its own carbon tax, and the new government is now pushing to reach 100 €/t C eq. by 2023, an increase of 50% for fossil fuel prices. Unfortunately, or fortunately, carbon tax is a topic that can hardly be coordinated at the European level as it is linked to national tax systems. But with several valuable experiences already in place, there is plenty of opportunity for sharing knowledge and good practice, and I urge each of you to be active promoters of this solution.
In conclusion, the whole sector must speak with one voice to lead these battles. Through its large membership base and no less than seven dedicated working groups, AEBIOM is well-equipped to be this voice, so don’t hesitate to join us if that’s not already the case!
Eric VialPresidentEuropean Pellet Council
“THE HEATING SEASON 2016-2017 WAS MORE FAVOURABLE AFTER THREE CONSECUTIVE MILD WINTERS, ALLOWING SUPPLIERS TO CLEAR THEIR STOCK AND IMPROVE THEIR FINANCIAL SITUATION. THE RATHER COLD AUTUMN WE ARE CURRENTLY EXPERIENCING ALLOWS THE INDUSTRY TO HOPE FOR GOOD BUSINESS. “
Eric Vial, PresidentEUROPEAN PELLET COUNCIL

1 Wood pellets 1
1.1 Overview of world pellet sector 7
1.1.1 World pellet production 71.1.2 World pellet consumption 111.1.3 World pellet trade 15
1.2 Situation in Europe 16
1.2.1 European wood pellet production 161.2.2 Raw materials for European wood pellet production 231.2.3 European non.wood pellet production 291.2.4 European wood pellet consumption 301.2.5 European heating appliances market 391.2.6 European wood pellet price 60
1.3 Latest developments of ENplus® certification 68
1.4 Annexes 70
Table of
Contents

Sponsors
Africa-EU Renewable Energy Cooperation Programme
The Africa-EU Renewable Energy Cooperation Programme (RECP) is a multi-donor programme that supports the development of markets for renewable energy in Africa. It was launched by more than 35 African and European Ministers and Commissioners under the Africa-EU Energy Partnership (AEEP).>>> www.africa-eu-renewables.org
STUV Based in Bois-de-Villers, in the Namur province (Belgium), Stûv designs, produces and markets individual wood, gas and pellet heating solutions. Our stoves, fires, inserts and fireplaces are designed with incredible care, offering customer satisfaction in terms of energy performance, enjoyment and durability.>>> www.stuv.com
BioCurveBioCurve is a biomass boiler manufacturer, leading the design of condensing boilers.Its pio-neering portfolio includes pellet condensing boilers from 25 kW to 150 kW, with efficiencies up to 105,7% and emissions well below the strictest limits.The quality of the most powerful boilers of its kind has been endorsed by twelve international awards and satisfied clients in six countries. BioCurve has recently received the Expobiomasa 2017 Innovation Award for the first woodchip condensing boiler without need of heat recovers, which will be available from 2018. >>> www.biocurve-heating.com
Biomasa PartnerBiomasa Partner Group is a leading and preferred manufacturer supplying annually 80 000 tons of certified wooden pellet and briquette. All of the products are made from the highest quality saw dust and wood chips supplied by our biomass department. We deliver annually 150 000 tons of saw dust together with paper, saw mill and forest wooden chips. Our organization guar-antees the highest quality products and services to all of our partners. Additionally our logistics and forwarding departments provide deliveries by trucks, trains, sea containers and ships all over Europe. >>> www.biomasapartner.pl
Scandbio
Scandbio is Sweden’s largest company within solid processed wood fuels. We sell 100 % renew-able energy in the form of pellets, briquettes, logs and powder.>>> www.scandbio.com
Badger Pellets - François Group
BADGER Pellets are wood fuel pellets formed from sawdust from wood sawing in our regions. The sawdust, without bark, is made into pellets in this form through the combined action of high pressure and lignin, a natural constituent of wood which gives a gloss on the surface of our pellets. BADGER Pellets, no glue or chemical additive is used. It is a 100% natural fuel! They are produced on totally integrated bio-sites in Virton (Recybois) and Thimister (Woodenergy) in Belgium and in Bissen (KIOWATT – www.kiowatt.lu) in Luxembourg. They are real centres of excellence in circular economy. In fact, at BADGER Pellets, nothing is wasted. Wood is used in all its forms with the aim of giving it maximum value at each stage.
>>> www.badgerpellets.com

2017 PELLET MARKET OVERVIEW AN
EXTRACT OF THE AEBIOM STATISTICAL REPORT
AEBIOM 7
1.1 OVERVIEW OF WORLD PELLET SECTOR
WORLD PELLET PRODUCTION
Kelvin Hong
Chairman
Great Resources, China
Christian Rakos
Executive director
ProPellets Austria
China – a major but unknown pellet market
player?
According to the Chinese Renewable Energy Association, CREIA, China locally produced
and used 9 million tonnes in 2016. Despite the difficulty to collect solid statistics, this
would make China the world’s largest user of pellets and a very important pellet
producer. 80 % of these pellets are made of wood, which amounts to 7,2 million tonnes.
The rest is made of straw or other agricultural residues. According to China’s National
Energy Administration’s 13th five-year plan the use of pellets will reach 30 million tonnes
by 2020, mostly locally produced. A characteristic of the Chinese pellet market is the
use of a wide range of different raw materials, including agricultural residues and waste
wood. There seem to be no standards and no quality certification in use in China yet.
A key driver for pellet use in China is its environmental policy. A decree published in
2013 prohibits the use of coal in industrial steam boilers smaller than 7 MW by the end
of 2017. In addition, in urban areas also coal boilers up to 14 MW should be replaced.
Total coal use in these units amounts to 80 million tonnes. While most boilers are
replaced by natural gas boilers, there are also considerable opportunities for pellets.
According to CREIA the levelized cost of steam from pellets is around 2,5 cent/kWh,
compared to 4 cent/kWh for steam generated by using natural gas.
Consequently, in contrast to Europe pellet use in China is focused on commercial use in
mid-sized steam boilers for diverse industries and for heating large buildings such as
hospitals or schools. Interestingly, most conversions are carried out by ESCOs that plan,
build and operate the pellet boilers and sell steam to their clients. The domestic use of
pellets is less developed and mainly takes place in the western part of China where
pellets are used in cook stoves and stoves.

2017 PELLET MARKET OVERVIEW AN
EXTRACT OF THE AEBIOM STATISTICAL REPORT
AEBIOM 8
Note: The three following figures (i.e. Figures 8.1 – 8.2 and Table 8.1) integrate the data one could collect over China to
better appreciate how this fairly unknown market would impact the global figures. Due to a relative uncertainty of the
Chinese data the rest of the report will not include it.
Figure 1.1 World pellet production overview 2000.2016 (million tonnes)
Sources: EPC survey, 2017; IEA Bioenergy Task 40; FAO; CREIA
Global pellet production continues to expand year after year, amounting to 36,1 million tonnes of pellets produced in
2016, showing a growth of 11% compared to 2015. With 16,6 million tonnes produced, the production in Europe
stagnated while maintaining its position of the biggest producer, accounting for 39 % of world pellet production. This
stagnation is mainly due to EU28 production, decreasing slightly (<1%) whereas the production in the rest of Europe1
increased by 9% and reached 2,6 million tonnes. Production increased again in North America by 5%. Asian countries
Thailand, Indonesia, Vietnam, Malaysia and China, have shown a massive growth rate of 45% altogether (31% China
excluded).
1 The list of countries corresponding to the different areas defined in the report are available in the appendix.
0
5
10
15
20
25
30
35
40
2000 2001 2002 2003 2004 2005 2006 2007 2008 2009 2010 2011 2012 2013 2014 2015 2016
Rest of
world
Rest of
Asia
China
North
Americ
a
Other
Europe
EU281,7
18,3 19,4
21,7
26,5
32,6
36,2
15,7
11,7 9,7
14,5
7,6
5,2 4,0
3,0 2,6 2,2

2017 PELLET MARKET OVERVIEW AN
EXTRACT OF THE AEBIOM STATISTICAL REPORT
AEBIOM 9
Figure 1.2 World wood pellet production shares in 2016 (%)
Source: EPC survey, 2017; IEA Bioenergy Task 40; FAO; CREIA
Table 1.1 Evolution of world wood pellet actual production in 2013.2016 (tonnes)
2013 2014 2015 2016
Europe 13.793.606 15.533.640 16.431.329 16.590.960
North
America 6.781.000 7.978.000 9.450.000 9.900.000
South
America 61.500 49.390 75.000 125.350
Asia 1.042.296 2.763.200 6.455.035 9.341.000
Oceania 105.000 153.000 160.000
Total 21.678.402 26.429.230 32.564.364 36.117.310
Source: EPC survey, 2017; IEA Bioenergy Task 40; FAOstat; CREIA
EU28
39%
Other Europe
7%
North America
27%
China
20%
Rest of Asia
6%
Rest of world
1%
2017 PELLET MARKET OVERVIEW AN
EXTRACT OF THE AEBIOM STATISTICAL REPORT
AEBIOM 10
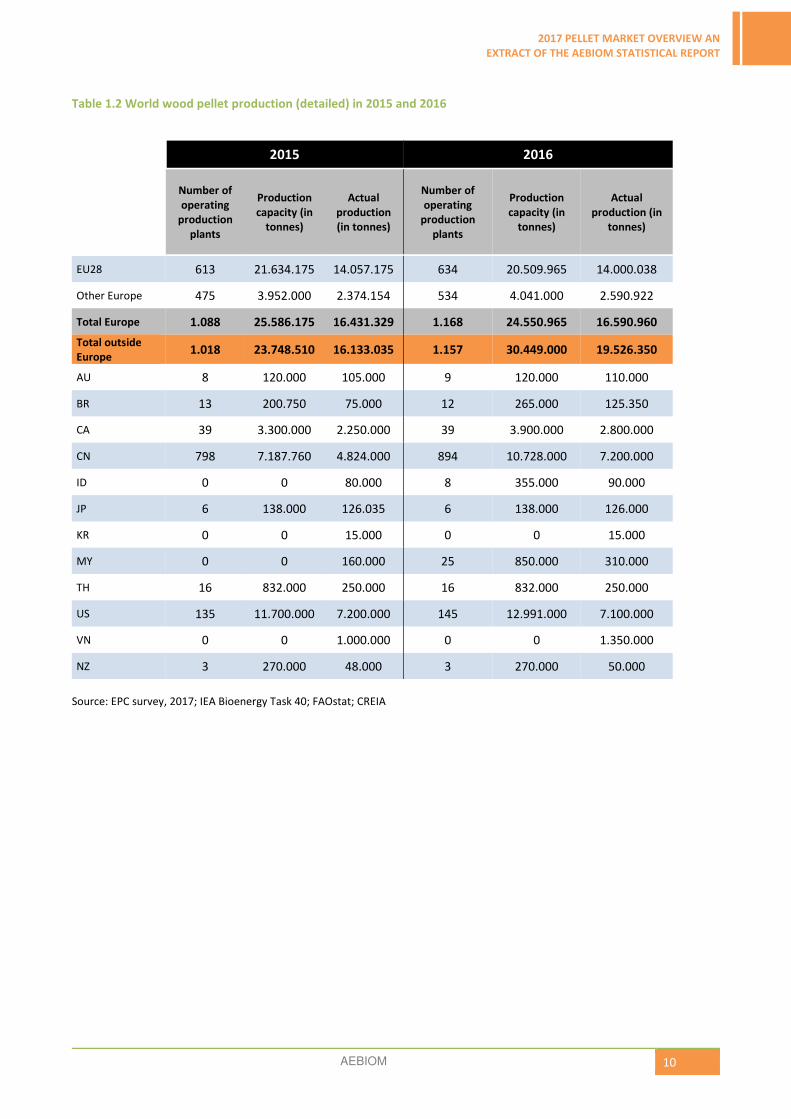
Table 1.2 World wood pellet production (detailed) in 2015 and 2016
2015 2016
Number of
operating
production
plants
Production
capacity (in
tonnes)
Actual
production
(in tonnes)
Number of
operating
production
plants
Production
capacity (in
tonnes)
Actual
production (in
tonnes)
EU28 613 21.634.175 14.057.175 634 20.509.965 14.000.038
Other Europe 475 3.952.000 2.374.154 534 4.041.000 2.590.922
Total Europe 1.088 25.586.175 16.431.329 1.168 24.550.965 16.590.960
Total outside
Europe 1.018 23.748.510 16.133.035 1.157 30.449.000 19.526.350
AU 8 120.000 105.000 9 120.000 110.000
BR 13 200.750 75.000 12 265.000 125.350
CA 39 3.300.000 2.250.000 39 3.900.000 2.800.000
CN 798 7.187.760 4.824.000 894 10.728.000 7.200.000
ID 0 0 80.000 8 355.000 90.000
JP 6 138.000 126.035 6 138.000 126.000
KR 0 0 15.000 0 0 15.000
MY 0 0 160.000 25 850.000 310.000
TH 16 832.000 250.000 16 832.000 250.000
US 135 11.700.000 7.200.000 145 12.991.000 7.100.000
VN 0 0 1.000.000 0 0 1.350.000
NZ 3 270.000 48.000 3 270.000 50.000
Source: EPC survey, 2017; IEA Bioenergy Task 40; FAOstat; CREIA
2017 PELLET MARKET OVERVIEW AN
EXTRACT OF THE AEBIOM STATISTICAL REPORT
AEBIOM 11
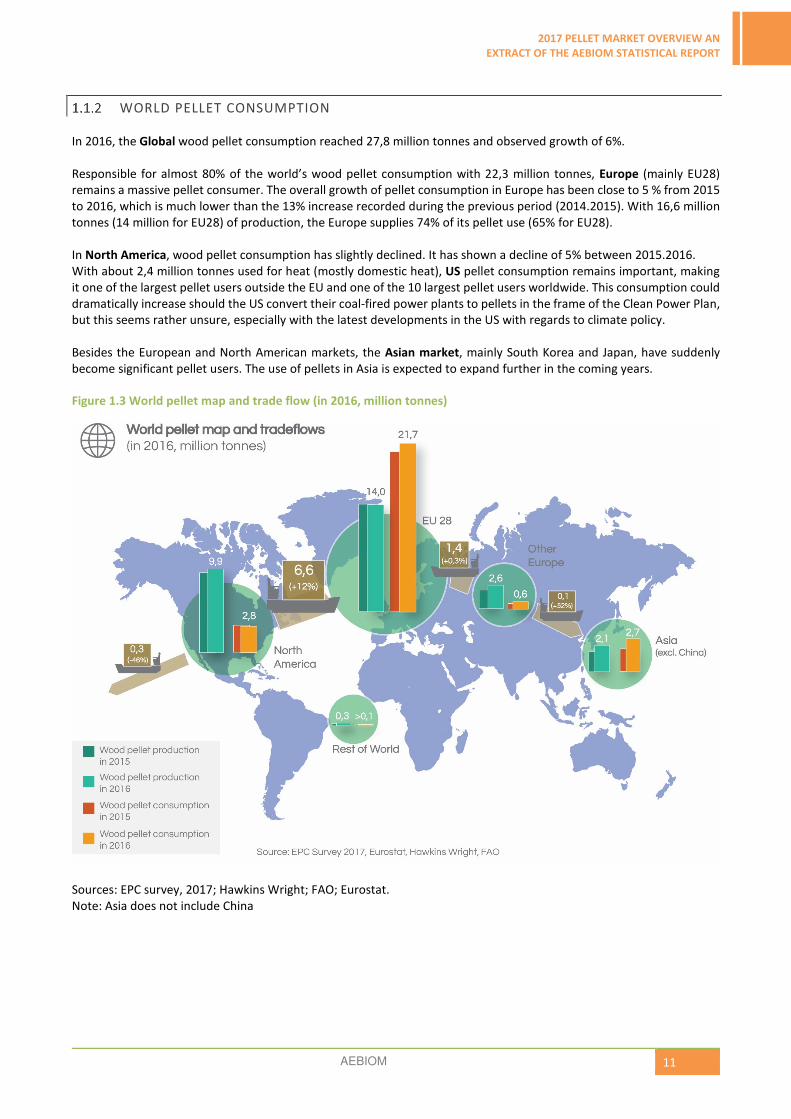
WORLD PELLET CONSUMPTION
In 2016, the Global wood pellet consumption reached 27,8 million tonnes and observed growth of 6%.
Responsible for almost 80% of the world’s wood pellet consumption with 22,3 million tonnes, Europe (mainly EU28)
remains a massive pellet consumer. The overall growth of pellet consumption in Europe has been close to 5 % from 2015
to 2016, which is much lower than the 13% increase recorded during the previous period (2014.2015). With 16,6 million
tonnes (14 million for EU28) of production, the Europe supplies 74% of its pellet use (65% for EU28).
In North America, wood pellet consumption has slightly declined. It has shown a decline of 5% between 2015.2016.
With about 2,4 million tonnes used for heat (mostly domestic heat), US pellet consumption remains important, making
it one of the largest pellet users outside the EU and one of the 10 largest pellet users worldwide. This consumption could
dramatically increase should the US convert their coal-fired power plants to pellets in the frame of the Clean Power Plan,
but this seems rather unsure, especially with the latest developments in the US with regards to climate policy.
Besides the European and North American markets, the Asian market, mainly South Korea and Japan, have suddenly
become significant pellet users. The use of pellets in Asia is expected to expand further in the coming years.
Figure 1.3 World pellet map and trade flow (in 2016, million tonnes)
Sources: EPC survey, 2017; Hawkins Wright; FAO; Eurostat.
Note: Asia does not include China

2017 PELLET MARKET OVERVIEW AN
EXTRACT OF THE AEBIOM STATISTICAL REPORT
AEBIOM 12
Figure 1.4 World wood pellet demand in 2016. power, CHP and heat (million tonnes)
Sources: EPC survey, 2017; Hawkins Wright
Note: Asia does not include China
Figure 1.5 Distribution of world wood pellet consumption in 2016 (%)
Sources: EPC survey, 2017; Hawkins Wright
Note: Asia does not include China
0
2
4
6
8
10
12
14
16
18
Power CHP Heat (Residential and Commercial)
Rest of
the world
Asia
North
America
Other
Europe
EU28
9,6
2,4
15,7
EU28
78%
Other Europe
2%
North America
10%
Asia
10%

2017 PELLET MARKET OVERVIEW AN
EXTRACT OF THE AEBIOM STATISTICAL REPORT
AEBIOM 13
Table 1.3 Evolution of wood pellet consumption in different continents 2013-2016 (tonnes)
2013 2014 2015 2016
Europe 18.150.890 18.819.160 21.311.701 22.300.688
North America 2.506.000 2.875.000 2.902.000 2.760.000
South America 58.000 90.000
Asia 1.806.000 2.676.000
Oceania 22.500 27.500
Total 20.656.890 21.752.160 26.132.201 27.764.188
Sources: EPC survey, 2017; Hawkins Wright Note: Asia does not include China
Figure 1.6 Top 10 wood pellet consuming countries by end-use in 2016 (million tonnes)
Sources: EPC survey, 2017; Hawkins Wright
Note: For UK, the split between residential and commercial not available. However, a significant share of wood pellet consumption
goes to commercial scale thanks due to the Renewable Heat Incentive.
0
1
2
3
4
5
6
7
8
UK IT US DK DE SE BE FR AT FI
Heat (Residential +Commercial) CHP Power
3,2
2,4 2,2 2,01,6
1,3 1,20,9
0,5
6,9

2017 PELLET MARKET OVERVIEW AN
EXTRACT OF THE AEBIOM STATISTICAL REPORT
AEBIOM 14
Table 1.4 World wood pellet consumption (detailed) in 2015 and 2016
2015 2016
Residential Commercial CHP Dedicated
power
Total Residential Commercial CHP Dedicated
power
Total
EU28 8.406.264 2.268.367 2.335.530 7.805.000 20.815.161 9.241.913 2.565.894 2.373.081 7.525.000 21.705.888
Other
Europe 418.500 78.040 0 0 496.540 503.500 91.300 0 0 594.800
Total
Europe 8.824.764 2.346.407 2.335.530 7.805.000 21.311.701 9.745.413 2.657.194 2.373.081 7.525.000 22.300.688
Total
outside
Europe
2.808.500 110.000 0 1.902.000 4.820.500 2.958.500 355.000 0 2.150.000 5.463.500
AU 5.000 5.000 10.000 10.000
BR 30.000 60.000 90.000
CA 225.000 25.000 96.000 346.000 210.000 25.000 100.000 335.000
JP 376.000 376.000 136.000 350.000 486.000
KR 1.430.000 1.430.000 190.000 1.700.000 1.890.000
Other
Asia 300.000 300.000
US 2.531.000 25.000 2.556.000 2.395.000 30.000 2.425.000
NZ 17.500 17.500 17.500 17.500
Sources: EPC survey, 2017; Hawkins Wright Note: Asia does not include China

2017 PELLET MARKET OVERVIEW AN
EXTRACT OF THE AEBIOM STATISTICAL REPORT
AEBIOM 15
WORLD PELLET TRADE
Europe, especially EU28, is the largest pellet importer in the world. The EU28 produces 14 million tonnes but consumes
21,7 million tonnes. The imported pellets are mainly sourced from North America and European countries outside EU28.
The EU28 imports from North America significantly increased from 5,76 million tonnes in 2015 to 6,58 million tonnes in
2016. The imports from European countries outside EU28 have also reached 1,4 million tonnes in 2016. The trade within
Europe (import and export) is further detailed later in this report.
Besides Europe, Asia, especially South Korea and Japan, became very important pellet importers over a short period. In
2016, they imported together 2 million tonnes2 mainly from Asia (Vietnam, Malaysia, Indonesia, Thailand) but also from
Canada and Russia.
2 Hawkins Wright 2017

2017 PELLET MARKET OVERVIEW AN
EXTRACT OF THE AEBIOM STATISTICAL REPORT
AEBIOM 16
1.2 SITUATION IN EUROPE
EUROPEAN WOOD PELLET PRODUCTION
With 16,6 million tonnes of pellets produced in 2016, Europe is the largest producer in the world amounting to nearly
57% of global production (With 14,0 million tonnes, EU28 accounts for 48%). After showing a continuous expansion over
the last years, actual European production stagnated in 2016 with growth of only 1% (EU28 observed a slight decrease of
0,4%). As a majority of the European pellet production is used in the heating market, it has been strongly impacted by
the contraction of the demand due to the mild winter of 2015.2016 and the decrease of sales of heating appliances. The
use of pellets in the industrial market was also below the projections in 2016, further compounding the situation of
overcapacity and oversupply of European pellet producers. Thankfully, the heating season 2016.2017 witnessed more
favourable weather conditions allowing to rebalance the offer and the demand and offering most European pellet
suppliers a chance to recover from 3 difficult consecutive years.
However, when looking at national level, the situation differs significantly with some countries experiencing a growth
while others stagnate or even decrease. Germany remains the biggest producer with 1,9 million tonnes produced in 2016,
followed by Sweden with 1,7 million tonnes. Among the Baltic States, Latvia and Estonia remain big market players
respectively showing a production of 1,4 million tonnes and 1,2 million tonnes even though their production decreased
in 2016 adapting the challenging 2016 market conditions. France experienced a continuous production growth over the
years amounting to 1,2 million tonnes in 2016.
Figure 1.7 Map of European wood pellet production in 2016
Source: EPC survey, 2017, FAO

2017 PELLET MARKET OVERVIEW AN
EXTRACT OF THE AEBIOM STATISTICAL REPORT
AEBIOM 17
Figure 1.8 Trend of wood pellet production in 2010.2016 for the 10 largest producers of EU28 (million tonnes)
Source: EPC survey, 2017
Germany: Production has grown over the years making Germany the biggest EU pellet producer. This evolution was mainly due to
the growing local use of pellets for heating, even if Germany exports (decreasing) a part of its production to other EU countries. In
2016, the pellet production in Germany was lower than expected as the suppliers had to adapt to the difficult market conditions
affecting the heating sector and because exports decreased significantly. German production was also impacted by the bankruptcy of
the largest German producer, German pellets, in early 2016. German pellets production sites operated on a low level for some
months before the new owners increased their production.
A most favourable heating season 2016.2017 coupled with sufficient raw material will most probably allow the production to grow
by 15 to 20 percent in 2017.
Sweden: The pellet production of the second largest EU pellet producer has significantly fluctuated in the past, mainly due to the
variable local pellet consumption. But for four consecutive years, Sweden has seen its production growing, reaching the highest
production ever recorded in 2016. It can be observed that Sweden was producing pellets mainly for local use but is gradually
developing its exports.
Latvia: Over a short period, pellet production in Latvia boomed making the country the 3rd largest pellet producer and the biggest
exporter in the EU. In 2016, the actual production decreased to adapt to market conditions while the capacity slightly increased. The
Latvian pellet producers, of whom the vast majority export pellets to large European industrial users, suffered from the slowdown in
industrial demand while the conditions of the heating sector did not offer them an opportunity to make the most of their production
capacity.
Latvian production still offers an important potential for further growth but production is only expected to show a limited increase in
the near future despite its big potential.
Estonia: Very similarly to Latvia, the pellet production in Estonia grew dramatically over the past years, allowing Estonia to become
the 4th largest producer in Europe. As the Estonian pellet producers are also largely producing pellets for export to European
industrial users, they experienced the same difficulties as the Latvian producers and had to adapt their production.
As for Latvia, production is expected to grow slowly in the coming years.
France: Over recent years, France witnessed a dramatic increase in its production to supply the growing local use of pellets for
heating. The use of pellets and sales of heating appliances, especially stoves, is expected to follow this expansion in France, allowing
local production to continue growing.
The potential for raw material remains high, signalling a bright future for further production expansion.
0,00
0,50
1,00
1,50
2,00
2,50
2010 2011 2012 2013 2014 2015 2016
DE SE LV EE FR RU AT PL PT RO

2017 PELLET MARKET OVERVIEW AN
EXTRACT OF THE AEBIOM STATISTICAL REPORT
AEBIOM 18
Russia: Late comer in the pellet business but showing an impressive potential for further growth, Russia is gradually becoming an
important market player having the 3rd largest production capacity after Germany and Sweden. The actual production of 1.100.000
tonnes allows Russia to rank as the 6th largest producer in Europe but shows a rather low saturation of capacity. A steady growth is
foreseen for pellet production in Russia in the coming years.
Austria: Having shown intense growth in the early stages of pellet history, the Austrian pellet production growth slowed down in
recent years with lower pellet demand growth. Thankfully the heating season 2016.2017 improved the local demand and even
created some tensions on the local supply. A slight increase of pellet production capacity is expected in 2017.
Poland: Initially, a significant part of the pellet production in Poland was made from agro-resources, mainly straw. Those agropellets
were mostly used in local biomass power plants. The crash of green certificates strongly impacted this market. Recently, Poland
increased its wood pellet production and exports either by converting agropellet production units to wood pellets or by building up
new capacity. This trend is expected to continue in 2017 with the conversion of 5 straw pelleting plants to wood pellets.
Portugal: Having shown a continuous growth from 2010 to 2015, the Portuguese pellet production has witnessed a considerable
contraction, mainly explained by the limited availability and high prices of raw material. Producers have adapted to this situation by
reducing their production.
Romania: Romanian production grew rather drastically over the past years but slowed down in 2015 due to the unfavourable
conditions of the pellet heating markets in the surrounding countries, but the industry recovered in 2016.
2017 PELLET MARKET OVERVIEW AN
EXTRACT OF THE AEBIOM STATISTICAL REPORT
AEBIOM 19
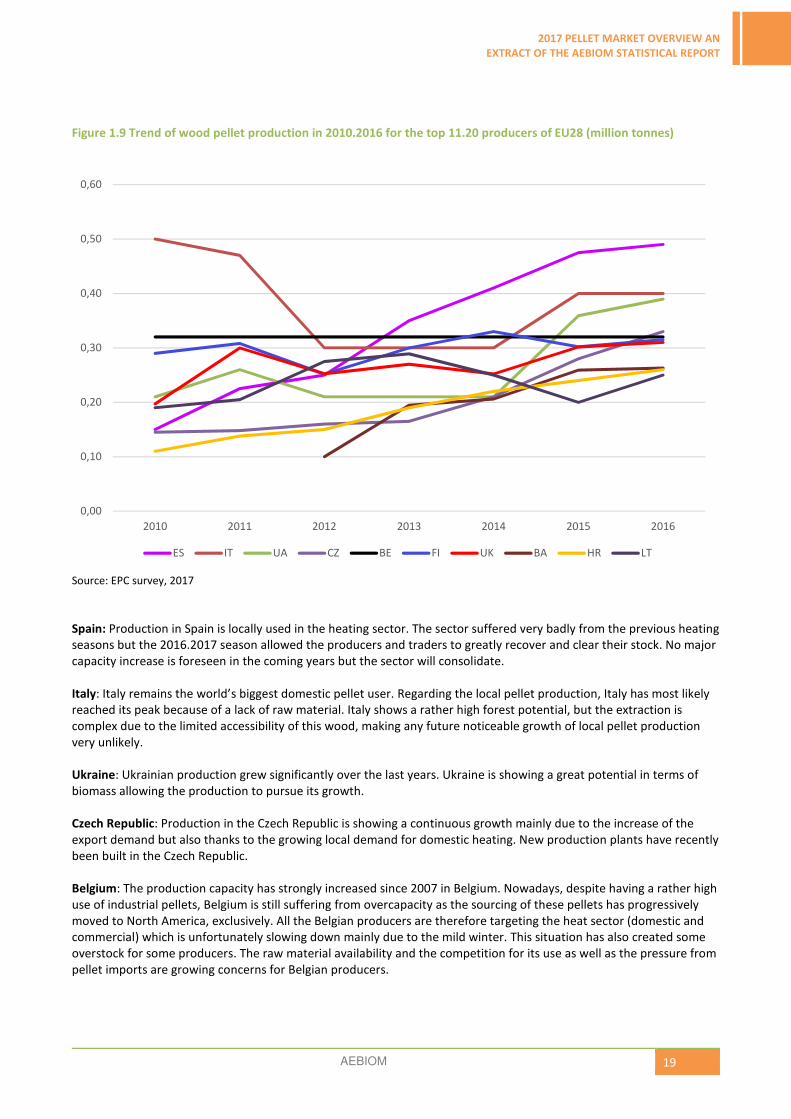
Figure 1.9 Trend of wood pellet production in 2010.2016 for the top 11.20 producers of EU28 (million tonnes)
Source: EPC survey, 2017
Spain: Production in Spain is locally used in the heating sector. The sector suffered very badly from the previous heating
seasons but the 2016.2017 season allowed the producers and traders to greatly recover and clear their stock. No major
capacity increase is foreseen in the coming years but the sector will consolidate.
Italy: Italy remains the world’s biggest domestic pellet user. Regarding the local pellet production, Italy has most likely
reached its peak because of a lack of raw material. Italy shows a rather high forest potential, but the extraction is
complex due to the limited accessibility of this wood, making any future noticeable growth of local pellet production
very unlikely.
Ukraine: Ukrainian production grew significantly over the last years. Ukraine is showing a great potential in terms of
biomass allowing the production to pursue its growth.
Czech Republic: Production in the Czech Republic is showing a continuous growth mainly due to the increase of the
export demand but also thanks to the growing local demand for domestic heating. New production plants have recently
been built in the Czech Republic.
Belgium: The production capacity has strongly increased since 2007 in Belgium. Nowadays, despite having a rather high
use of industrial pellets, Belgium is still suffering from overcapacity as the sourcing of these pellets has progressively
moved to North America, exclusively. All the Belgian producers are therefore targeting the heat sector (domestic and
commercial) which is unfortunately slowing down mainly due to the mild winter. This situation has also created some
overstock for some producers. The raw material availability and the competition for its use as well as the pressure from
pellet imports are growing concerns for Belgian producers.
0,00
0,10
0,20
0,30
0,40
0,50
0,60
2010 2011 2012 2013 2014 2015 2016
ES IT UA CZ BE FI UK BA HR LT

2017 PELLET MARKET OVERVIEW AN
EXTRACT OF THE AEBIOM STATISTICAL REPORT
AEBIOM 20
Finland: Production slightly decreased in 2015 to adapt to lower demand but in 2016 the pellet consumption recovered
and the production adapted again. The long-term perspective for the Finnish market is still positive thanks to the pellet
use with pellet peak up plants and a growing mid-scale sector.
United Kingdom: Despite the limited raw material potential of United Kingdom, local production increased overall in
recent years most likely due to an encouraging growth in pellet use where the Renewable Heat Incentive subsidy
scheme had a very positive impact. But the growth is still disappointing mainly due to fierce competition with imported
pellets. The recent changes in this scheme will certainly affect boiler sales and hence the further growth of pellet
production.
Bosnia Herzegovina: The production grew significantly in the past but plateaued in 2016 mainly due to the lack of
competitiveness in price compared to other countries exporting to Italy.
Croatia: Within a few years, pellet production grew significantly in Croatia despite limited local use. Most of the
Croatian pellets are exported to Italy.
Lithuania: The third Baltic country is not witnessing the same boom as Latvia and Estonia, but is seeing some additional
investments being made. The production of pellets, mainly dedicated to export for industrial use, grew slightly in 2016.
In 2017, two new plants, for an overall capacity of 220.000 t per annum will start producing pellets.

2017 PELLET MARKET OVERVIEW AN
EXTRACT OF THE AEBIOM STATISTICAL REPORT
AEBIOM 21
Figure 1.10 Trend of wood pellet production in 2010.2016 for the Baltics countries (million tonnes)
Source: EPC survey, 2017
0,00
0,50
1,00
1,50
2,00
2,50
3,00
3,50
LV EE LT Total
2010 2011 2012 2013 2014 2015 2016
1,4
1,2
0,3
2,9
Wood pellets are being produced almost all over Europe. But two regions are
noteworthy because they produce primarily for export rather than local
consumption. These two regions are the Baltics and the Balkans. The Baltics are
Europe’s largest manufacturing base for industrial wood pellets, whilst in the
Balkans almost all the pellets produced are for the residential market.
The Baltic States (Estonia, Latvia and Lithuania) together produce more than 3
million tons for export. However, what used to be a very diverse market with many
pellet plants in the 50-100 000 million tonnes range making both industrial and
residential wood pellets have witnessed consolidation resulting in a few industrial
pellet producers dominating the landscape. Whilst this has made purchasing easier
for the large utilities it has in turn made life more difficult for the wood industry in
the region by reducing options for selling their sawdust and shavings. A lack of sales
options drove raw material prices down. Slowly but surely this has resulted in small
sawmills and wood industry participants looking at becoming niche suppliers for the
residential wood pellets market. The investment required is not too onerous and
the prospect of getting more for the waste they generate has meant an increase in
the number of small producers. There are companies making containerized pellet
plants that can be quickly erected and do not require expensive groundworks. Now
we are witnessing an increase in raw material prices as volumes of sawdust that
were formerly sold are being pelletized on the spot.
Arnold Dale
Vice President Bioenergy
Ekman

2017 PELLET MARKET OVERVIEW AN
EXTRACT OF THE AEBIOM STATISTICAL REPORT
AEBIOM 22
Figure 1.11 Trend of wood pellet production in 2010.2016 for the Balkan countries (million tonnes)
Source: EPC survey, 2017
0,26 0,26 0,25
0,11 0,11
0,03 0,03
1,05
0,000
0,200
0,400
0,600
0,800
1,000
1,200
BA HR RS BG SI ME AL Total2010 2011 2012 2013 2014 2015 2016
The pellet production recently boomed in the Balkans amounting to 1 million tonnes
in 2016. The growth rate declined in 2016 due to a small decrease in pellet production
witnessed in Albania, Bulgaria, and Slovenia. The appealing Italian market initiated
this vast increase of production plants reaching 100 units in 2015 for exporting 80 %
of its volume to Italy.
During the last two years, the exports to Italy decreased significantly due to limited
competitiveness of Balkan producers. Most of the losses in export were anticipated
by an increase in local demand. Due to the supply of local boilers and stoves and due
to the local availability of pellets this enormous boom was invisible for the rest of the
world. Within only 3 years, the pellet consumption per capita increased from
practically 0 kg to 32 kg in 2016 in Kosovo, which is a higher demand than in Germany
(27 kg per capita). Serbia currently exports more pellets to Macedonia and Kosovo
than to Italy. In Serbia, more than 12.000 pellet stoves and boilers were sold in 2015
and there is still a significant increase. In most of the Balkan countries pellets replace
old, low efficient wood stoves and coal boilers. This improves air quality remarkably.
With current national growth rates Balkan countries will soon use their complete
production locally, becoming a good example of local, sustainable heat production.
Dr. Martin Englisch
General Manager
BEA Institut für Bioenergie

2017 PELLET MARKET OVERVIEW AN
EXTRACT OF THE AEBIOM STATISTICAL REPORT
AEBIOM 23
RAW MATERIALS FOR EUROPEAN WOOD PELLET PRODUCTION
Within the data collection run by EPC, the partners3 have identified the main raw materials used for pellets production
in Europe.
Three categories have been defined:
� Primary feedstock = Roundwood and harvesting residues (i.e. wood extracted for pellet production.)
� Secondary feedstock = any by-products from wood industry e.g. sawdust, shavings, etc.
� Tertiary feedstock = any used wood (reclaimed wood, waste wood)
As illustrated by the below figure, at European level, over 85% of wood pellets’ raw material consists of wood industry
residues and waste wood.
Figure 1.12 Estimate of the shares of raw materials used in local pellet production per European country (%)
Source: EPC survey, 2017
3 For this survey, only the national pellet associations were consulted. Not all of them have consulted their local producers.
0
10
20
30
40
50
60
70
80
90
100
Tertiary feedstocks (reclaimed wood, etc.)
Secondary feedstocks (sawdust, wood industry residues, shavings
etc.)

2017 PELLET MARKET OVERVIEW AN
EXTRACT OF THE AEBIOM STATISTICAL REPORT
AEBIOM 24
The partners have also reported on the use of hard wood and soft wood use for their local pellet production.
Figure 1.13 Estimate of the shares of hard wood and soft wood in local pellet production in Europe (%)
Source: EPC survey, 2017
0
10
20
30
40
50
60
70
80
90
100
% of softwood % of hardwood

2017 PELLET MARKET OVERVIEW AN
EXTRACT OF THE AEBIOM STATISTICAL REPORT
AEBIOM 25
Table 1.5 European wood pellet production in 2016 compared to 2015
2015 2016
Number of operating
production plants
Production
capacity (in
tonnes)
Actual production
(in tonnes)
Number of
operating
production
plants
Production capacity
(in tonnes)
Actual production
(in tonnes)
EU28 613 21.634.175 14.057.175 634 20.509.965 14.000.038
AT 37 1.481.000 1.001.000 38 1.496.000 1.070.000
BE 12 760.000 320.000 12 760.000 320.000
BG 5 200.000 150.000 5 200.000 112.000
CY no data no data no data no data no data no data
CZ 22 380.000 280.000 25 400.000 330.000
DE 54 3.200.000 2.000.000 55 3.200.000 1.930.000
DK 5 250.000 150.000 5 300.000 150.000
EE 18 1.440.000 1.308.500 19 1.500.000 1.167.364
EL 14 130.000 40.000 16 140.000 50.000
ES 79 1.250.000 475.000 82 1.600.000 490.000
FI 28 623.500 302.000 29 623.500 315.000
FR 50 1.800.000 950.000 52 1.800.000 1.150.000
HR 16 300.000 240.000 18 340.000 260.000
HU 6 145.000 3.140 6 122.000 3.139
IE 1 40.000 31.000 1 40.000 31.000
IT 30 450.000 400.000 30 450.000 400.000
LT 9 350.000 200.000 11 360.000 250.000
LU 1 50.000 50.000 1 50.000 50.000
LV 27 1.750.000 1.577.000 28 1.850.000 1.438.337
MT no data no data no data no data no data no data
NL 4 350.000 265.500 4 350.000 200.000
PL 50 1.050.000 870.000 52 1.100.000 900.000
PT 26 1.941.875 850.000 25 1.941.875 700.000
RO 22 750.000 420.000 22 750.000 500.000
SE 65 2.236.185 1.662.525 65 2.236.185 1.663.198
SI 14 130.000 110.000 18 140.000 110.000
SK 10 200.000 100.000 10 200.000 100.000
UK 8 376.615 301.510 8 376.615 310.000
Other
Europe 475 3.952.000 2.374.154 534 4.041.000 2.590.922
AL 8 33.000 28.000 7 30.000 25.000
BA 33 305.000 259.000 31 350.000 263.000
BY 14 209.000 300.000 14 209.000 300.000
CH 24 280.000 160.000 24 280.000 180.000
ME 2 35.000 21.600 4 55.000 28.900
NO 4 75.000 56.874 4 75.000 56.892
RS 56 485.000 229.650 52 387.000 247.560
RU 80 2.000.000 960.000 85 2.125.000 1.100.000
UA 254 530.000 359.030 313 530.000 389.570
Source: EPC survey, 2017

2017 PELLET MARKET OVERVIEW AN
EXTRACT OF THE AEBIOM STATISTICAL REPORT
AEBIOM 26
A consultation was carried out for the partners4 to identify the main markets for the pellets produced in each European
country. Two main categories were identified: countries mainly producing pellets for the heating market (domestic and
commercial), and countries mainly producing pellets for industrial use. Latvia, Estonia and Portugal are the only countries
mainly producing for industrial use. For the remaining countries, most of the pellets produced go for the heat market. In
Europe, 78% of pellets produced go to the heat market with 57% going to small scale appliances and 21% going to mid-
scale appliances.
Belgium: A large part of the production was dedicated to local use in power plants from 2007 to 2011. However, utilities
have increasingly sourced their pellets from abroad (mainly from North America). Consequently, Belgian producers have
switched to the domestic heating market creating a severe overcapacity.
Portugal: The majority of the Portuguese pellets have been dedicated to the industrial users for years. But it can be noted
that these trends are changing with market opportunities. Indeed, in 2015 some volumes could be sold to neighbouring
countries for domestic heat while in 2016 the favourable dollar-euro exchange rate offered SPOT opportunities in the
industrial market.
Figure 1.14 Estimate of European wood pellet producers’ main markets by end-use in 2016 (percentage)
Source: EPC survey, 2017
4 For this survey, only the national pellet associations were consulted. Not all of them have consulted their local producers.
0
10
20
30
40
50
60
70
80
90
100
Small scale domestic appliances (under 50 kW) Mid-scale appliances (between 50 kW and 2 MW) Power plants
2017 PELLET MARKET OVERVIEW AN
EXTRACT OF THE AEBIOM STATISTICAL REPORT
AEBIOM 27
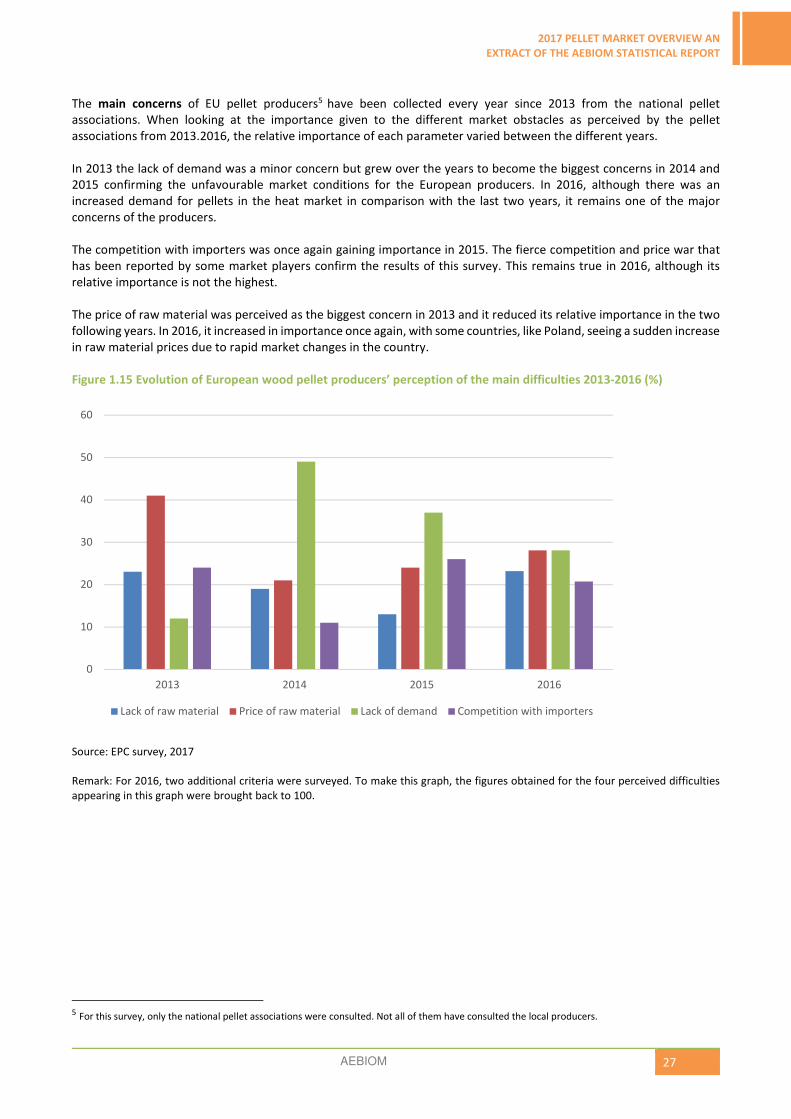
The main concerns of EU pellet producers5 have been collected every year since 2013 from the national pellet
associations. When looking at the importance given to the different market obstacles as perceived by the pellet
associations from 2013.2016, the relative importance of each parameter varied between the different years.
In 2013 the lack of demand was a minor concern but grew over the years to become the biggest concerns in 2014 and
2015 confirming the unfavourable market conditions for the European producers. In 2016, although there was an
increased demand for pellets in the heat market in comparison with the last two years, it remains one of the major
concerns of the producers.
The competition with importers was once again gaining importance in 2015. The fierce competition and price war that
has been reported by some market players confirm the results of this survey. This remains true in 2016, although its
relative importance is not the highest.
The price of raw material was perceived as the biggest concern in 2013 and it reduced its relative importance in the two
following years. In 2016, it increased in importance once again, with some countries, like Poland, seeing a sudden increase
in raw material prices due to rapid market changes in the country.
Figure 1.15 Evolution of European wood pellet producers’ perception of the main difficulties 2013-2016 (%)
Source: EPC survey, 2017
Remark: For 2016, two additional criteria were surveyed. To make this graph, the figures obtained for the four perceived difficulties
appearing in this graph were brought back to 100.
5 For this survey, only the national pellet associations were consulted. Not all of them have consulted the local producers.
0
10
20
30
40
50
60
2013 2014 2015 2016
Lack of raw material Price of raw material Lack of demand Competition with importers

2017 PELLET MARKET OVERVIEW AN
EXTRACT OF THE AEBIOM STATISTICAL REPORT
AEBIOM 28
A lack of demand has been identified as one of the biggest concerns in the past years. In the 2017 survey, pellet stock
management was added as an additional difficulty. Although not identified as the biggest difficulty of this year, it is still a
significant concern for the pellet producers in 2016.
Figure 1.16 European wood pellet producers’ perception of the main difficulties in 2016 (%)
Source: EPC survey, 2017
Lack of raw material
19%
Price of raw
material
23%
Lack of demand
23%
Competition with
importers
17%
Pellet stock
management
14%
Other
4%

2017 PELLET MARKET OVERVIEW AN
EXTRACT OF THE AEBIOM STATISTICAL REPORT
AEBIOM 29
EUROPEAN NON.WOOD PELLET PRODUCTION
Despite the difficulties encountered by some EU producers to source wood, the agropellet market is not properly taking
off as it has been stagnating at 10% of European pellet production. The main European agropellet producers are Ukraine
(934.000 tonnes in 2016), Poland (450.000 tonnes in 2016) and the Czech Republic with 200.000 tonnes. These pellets,
made of agricultural (by)products (e.g. straw, sunflower husks, etc.), are mainly used in industrial plants (power plants
and CHP).
The biggest agropellet user is Poland, having used 1 million tonnes before the crash of the green certificate prices which
has strongly impacted the market. No expansion of agropellet use is foreseen in some countries like Austria and
Switzerland due to boiler emissions limitations.
Figure 1.17 European pellet production by raw material in 2016 (%)
Source: EPC survey, 2017
Figure 1.18 Evolution of the production of non-wood pellets in Europe (in million tonnes)
Source: EPC surveys, 2014.2017
Wood pellets
90%
Non-wood pellets
10%
0,0
0,2
0,4
0,6
0,8
1,0
1,2
1,4
1,6
1,8
2,0
2014 2015 2016
UA PL CZ LT RO RS ES LV FI SE EL BA
1,7 1,8 1,8
2017 PELLET MARKET OVERVIEW AN
EXTRACT OF THE AEBIOM STATISTICAL REPORT
AEBIOM 30
EUROPEAN WOOD PELLET CONSUMPTION
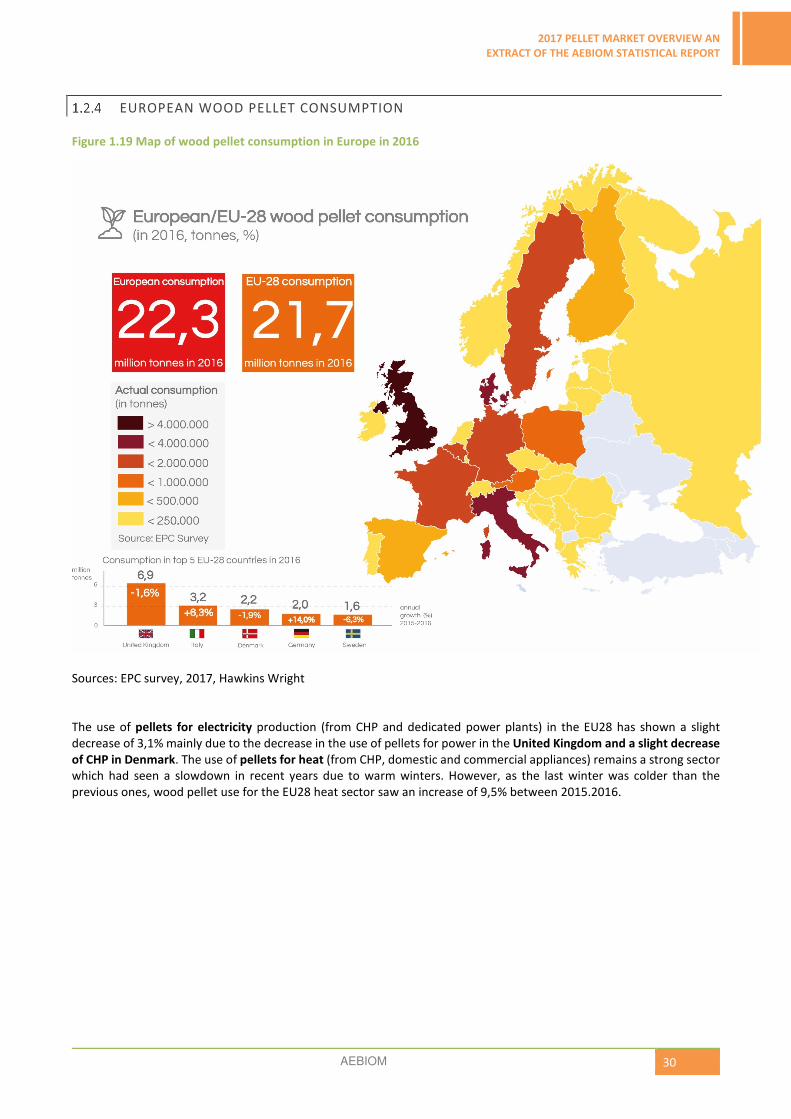
Figure 1.19 Map of wood pellet consumption in Europe in 2016
Sources: EPC survey, 2017, Hawkins Wright
The use of pellets for electricity production (from CHP and dedicated power plants) in the EU28 has shown a slight
decrease of 3,1% mainly due to the decrease in the use of pellets for power in the United Kingdom and a slight decrease
of CHP in Denmark. The use of pellets for heat (from CHP, domestic and commercial appliances) remains a strong sector
which had seen a slowdown in recent years due to warm winters. However, as the last winter was colder than the
previous ones, wood pellet use for the EU28 heat sector saw an increase of 9,5% between 2015.2016.

2017 PELLET MARKET OVERVIEW AN
EXTRACT OF THE AEBIOM STATISTICAL REPORT
AEBIOM 31
1.2.4.1 PELLET CONSUMPTION FOR HEATING
Figure 1.20 Map of wood pellet consumption for heating in Europe in 2016
Sources: EPC survey, 2017, Hawkins Wright
The use of pellets for producing heat remains a strong sector in the EU, showing a noticeable expansion over the years.
While the EU pellet for power market relies on policy frameworks, the EU pellet for heating market, which is less
“support-dependent”, has shown to be stronger and more reliable.
From 2013 to 2016, Europe experienced three consecutive mild winters, leading to a rather disappointing growth of
pellet consumption in the heat market. Thankfully, the last heating season was colder, resulting in pellet use for heat
(residential and commercial excluding CHP) showing a growth of 10,6 % over the 2016-2017 period. This sudden rise in
consumption generated some tensions in the supply leading to shortage in some areas and generating a price increase.
2017 volumes might even be more positive if Europe experiences at least a normal heating season 2017.2018.
Despite this market recovery, the contraction of pellet heating appliance sales (especially domestic boilers) that can be
observed in most Europe is concerning as this will impact the future growth of pellet sales.
2017 PELLET MARKET OVERVIEW AN
EXTRACT OF THE AEBIOM STATISTICAL REPORT
AEBIOM 32
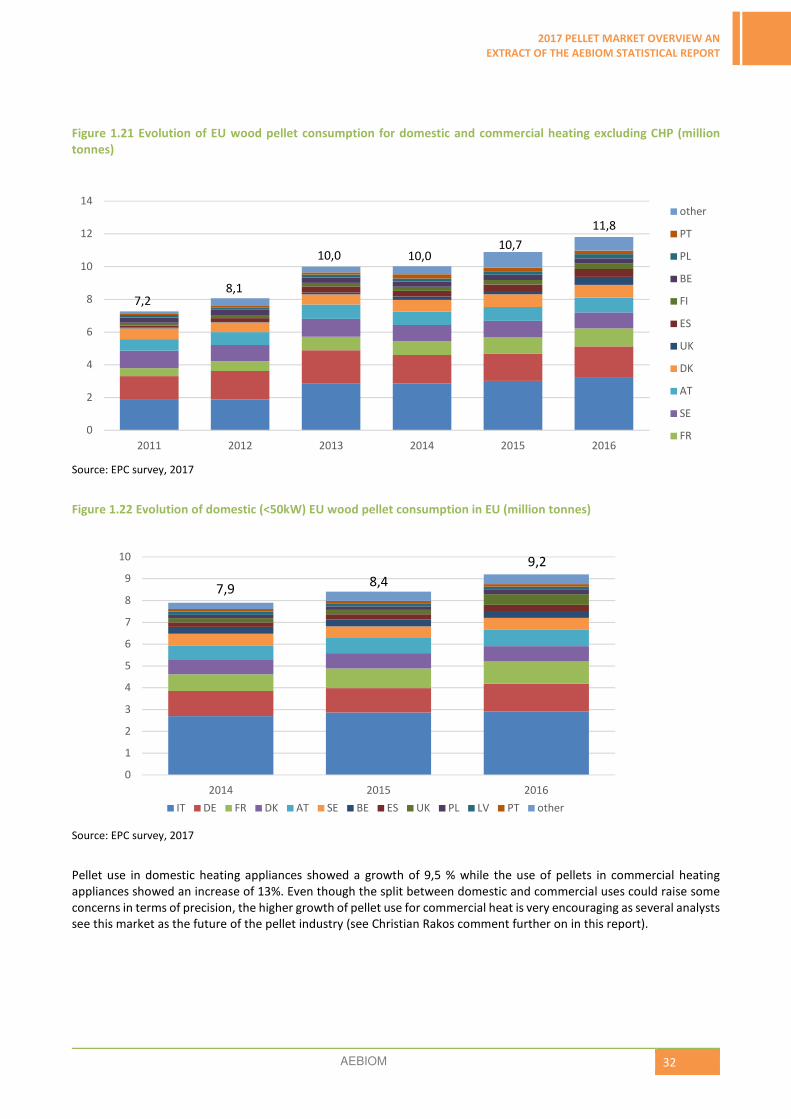
Figure 1.21 Evolution of EU wood pellet consumption for domestic and commercial heating excluding CHP (million
tonnes)
Source: EPC survey, 2017
Figure 1.22 Evolution of domestic (<50kW) EU wood pellet consumption in EU (million tonnes)
Source: EPC survey, 2017
Pellet use in domestic heating appliances showed a growth of 9,5 % while the use of pellets in commercial heating
appliances showed an increase of 13%. Even though the split between domestic and commercial uses could raise some
concerns in terms of precision, the higher growth of pellet use for commercial heat is very encouraging as several analysts
see this market as the future of the pellet industry (see Christian Rakos comment further on in this report).
0
2
4
6
8
10
12
14
2011 2012 2013 2014 2015 2016
other
PT
PL
BE
FI
ES
UK
DK
AT
SE
FR
10,0 10,010,7
11,8
8,17,2
0
1
2
3
4
5
6
7
8
9
10
2014 2015 2016
IT DE FR DK AT SE BE ES UK PL LV PT other
8,4
9,2
7,9

2017 PELLET MARKET OVERVIEW AN
EXTRACT OF THE AEBIOM STATISTICAL REPORT
AEBIOM 33
Figure 1.23 Evolution of commercial (>50kW) EU wood pellet consumption in 2016 (million tonnes)
Source: EPC survey, 2017
Figure 1.24 EU28 pellet consumption in heat production (excluding CHP) in 2016 (million tonnes)
Source: EPC survey, 2017
Note: For the UK, the split between residential and commercial was not available. However, a significant share of wood
pellet consumption goes to commercial scale due to their national support scheme, RHI (Renewable Heat Incentive).
0,0
0,5
1,0
1,5
2,0
2,5
3,0
2014 2015 2016
DE SE IT FI ES AT NL PT DK FR Other EU28
2,3
2,6
2,1
3,20
1,96
1,10
0,98 0,90
0,80
0,49 0,48 0,33 0,32
0,25 0,22 0,16 0,19 0,15 0,14 0,10 0,06 0,04 0,01 0,10

2017 PELLET MARKET OVERVIEW AN
EXTRACT OF THE AEBIOM STATISTICAL REPORT
AEBIOM 34
Figure 1.25 Evolution of wood pellet consumption for residential and commercial heating (excluding CHP) in the 10
highest consuming EU countries in 2014.2016 (million tonnes)
Source: EPC survey, 2017
Note: For the UK, the split between residential and commercial was not available. However, a significant share of wood
pellet consumption goes to commercial scale due to their national support scheme, RHI (Renewable Heat Incentive).
Even though each market has its specificities one can see that the more favourable market conditions of last heating
season positively impacted the European pellet heat market. Unfortunately, for most markets having a long history of
pellet use for heating (AT, DE, IT, SE, etc.) the sales of heating appliances are decreasing either showing a conjunctural
problem or a structural problem. The latter would mean that the market is changing, requiring the sector to adapt by,
among others, diversifying its market segments.
Italy: Italy remains the European champion of pellet use for heating with 3,2 million tonnes used in 2016. Even if a careful
approach is needed for pellet use and appliance sales for this big and scattered market, it is sure that Italy will remain an
extremely important player even if the annual sales of stoves tend to decrease. On the other hand, some interesting sales
of domestic and commercial boilers are currently recorded in Italy, which may be signalling a market change. Germany:
The end of 2016 witnessed a noticeable growth of pellet use in Germany and the sales of early 2017 were also
encouraging due to the more favourable market conditions, even if the trends of heating appliance sales are creating
some concerns.
France: In a short period, France became an important pellet market player showing a continuous growth of pellet use
despite the difficult heating seasons experienced over the last years. The French market is also one of the few showing a
continuous growth of pellet stove sales but unfortunately not for domestic pellet boilers.
Sweden: The Swedish heating market (CHP excluded) is showing a rather stable trend over the years but it can be noted
that the CHP operators are suffering from a very low electricity price.
Austria: Having a long history of pellet use for heating, Austria is following a path very similar to Germany.
Denmark: The domestic heating market is showing encouraging continuous growth in Denmark.
United Kingdom: The split between domestic pellet heating and commercial pellet heating seems rather difficult to
establish in the UK pellet market, but it is clear that the RHI support scheme allowed the pellet heat sector to take off in
the UK, even favouring the commercial sector. Unfortunately, the brutal change of RHI is strongly affecting the sales of
appliances and seriously damaging the entire UK pellet industry.
Spain: In a short period, Spain also became an important market player showing strong growth of pellet use for heating.
As a consequence, Spain, which was some years ago a net pellet exporter, is since 3 years using as many pellets as they
produce, even with some imports that can be observed depending on market conditions.
0
1
1
2
2
3
3
4
20
14
20
15
20
16
20
14
20
15
20
16
20
14
20
15
20
16
20
14
20
15
20
16
20
14
20
15
20
16
20
14
20
15
20
16
20
14
20
15
20
16
20
14
20
15
20
16
20
14
20
15
20
16
20
14
20
15
20
16
IT DE FR SE AT DK UK ES FI BE
Residential heating < 50 kW (tonnes) Commercial heating >50 kW (tonnes)
1,10 0,980,90 0,80
0,49 0,48 0,33 0,32
1,96
3,20
2017 PELLET MARKET OVERVIEW AN
EXTRACT OF THE AEBIOM STATISTICAL REPORT
AEBIOM 35
Finland: The Finnish heating market is showing strong and very constant growth over the years. The long-term
perspective for the Finnish market is still positive thanks to the pellet use with pellet peak up plants and a growing
mid-scale sector.
Belgium: Despite the difficulties in collecting precise data about the Belgian heating market, pellet sales benefited
from the more favourable conditions of the last heating season but the sales of heating appliances, especially boilers,
face difficulties in recovering after having experienced an important drop in 2016.

2017 PELLET MARKET OVERVIEW AN
EXTRACT OF THE AEBIOM STATISTICAL REPORT
AEBIOM 36
EPC ran a consultation to get the partners6 to identify the pellet quality classes most used in the residential heat market
and commercial heat market for each European country.
Several observations can be made on the results below. Some countries are mainly or even exclusively using premium
quality both for the residential and commercial markets. Some other countries use lower quality pellets only in the
commercial sector while some countries are also using lower quality pellets even in the residential market.
Figure 1.26 Estimate of pellet quality class shares for residential heat market per European country (%)
Source: EPC survey, 2017
Figure 1.27 Estimate of pellet quality class shares for commercial heat market per European country (%)
Source: EPC survey, 2017
6 For this survey, only the national pellet associations were consulted. Not all of them have consulted the local producers.
0
10
20
30
40
50
60
70
80
90
100
AT CZ DE DK EL ES FR IT LV PT SE SI BA CH RS
A1 A2 B Out of B quality
0
10
20
30
40
50
60
70
80
90
100
AT CZ DK EL ES FR IT LV PT SE SI BA CH RS
A1 A2 B Out of B quality
2017 PELLET MARKET OVERVIEW AN
EXTRACT OF THE AEBIOM STATISTICAL REPORT
AEBIOM 37
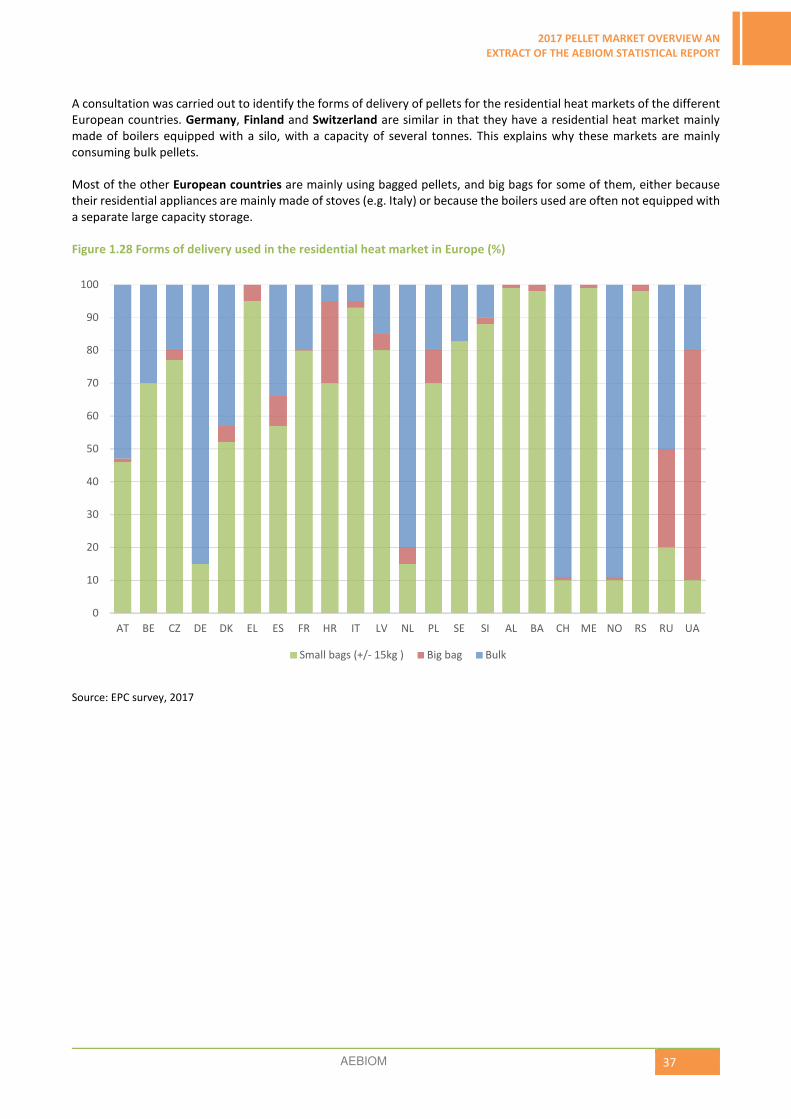
A consultation was carried out to identify the forms of delivery of pellets for the residential heat markets of the different
European countries. Germany, Finland and Switzerland are similar in that they have a residential heat market mainly
made of boilers equipped with a silo, with a capacity of several tonnes. This explains why these markets are mainly
consuming bulk pellets.
Most of the other European countries are mainly using bagged pellets, and big bags for some of them, either because
their residential appliances are mainly made of stoves (e.g. Italy) or because the boilers used are often not equipped with
a separate large capacity storage.
Figure 1.28 Forms of delivery used in the residential heat market in Europe (%)
Source: EPC survey, 2017
0
10
20
30
40
50
60
70
80
90
100
AT BE CZ DE DK EL ES FR HR IT LV NL PL SE SI AL BA CH ME NO RS RU UA
Small bags (+/- 15kg ) Big bag Bulk

2017 PELLET MARKET OVERVIEW AN
EXTRACT OF THE AEBIOM STATISTICAL REPORT
AEBIOM 38
Table 1.6 European wood pellet consumption for heating in 2016 compared to 2015 (tonnes)
2015 2016
Residential Commercial 2/3 CHP Total Residential Commercial 2/3 CHP Total
EU28 8.406.264 2.268.367 1.557.020 12.231.651 9.241.913 2.565.894 1.582.054 13.389.861
AT 700.000 145.000 0 845.000 745.000 150.000 0 895.000
BE 315.000 8.000 13.333 336.333 315.000 8.000 13.333 336.333
CZ 63.000 25.000 0 88.000 64.000 30.000 0 94.000
DE 1.120.000 560.000 43.333 1.723.333 1.280.000 640.000 46.667 1.966.667
DK 700.000 83.000 1.000.000 1.783.000 705.000 84.000 966.667 1.755.667
EE 28.000 8.000 0 36.000 30.000 10.000 0 40.000
EL 57.000 10.000 0 67.000 75.000 15.000 0 90.000
ES 240.000 160.000 0 400.000 285.000 190.000 0 475.000
FI 70.000 200.000 33.333 303.333 80.000 250.000 106.667 436.667
FR 900.000 75.000 0 975.000 1.020.000 80.000 0 1.100.000
HR 6.000 3.000 0 9.000 10.500 5.500 0 16.000
IT 2.860.000 150.000 0 3.010.000 2.900.000 300.000 0 3.200.000
LT 39.000 11.000 0 50.000 47.500 12.500 0 60.000
LV 143.000 7.000 0 150.000 148.000 7.000 0 155.000
NL 30.000 130.000 0 160.000 60.000 130.000 0 190.000
PL 160.000 50.000 0 210.000 200.000 50.000 16.667 266.667
PT 115.000 100.000 0 215.000 115.000 100.000 0 215.000
SE 535.264 478.367 467.020 1.480.651 549.370 428.894 418.721 1.396.985
SI 90.000 40.000 0 130.000 85.000 50.000 13.333 148.333
SK 35.000 25.000 0 60.000 35.000 25.000 0 60.000
UK 200.000 0 200.000 492.543 0 492.543
Other
Europe 418.500 78.040 0 496.540 503.500 91.300 0 594.800
AL 20.000 1.000 0 21.000 22.500 1.200 0 23.700
BA 73.000 8.200 0 81.200 117.500 11.000 0 128.500
CH 150.000 50.000 0 200.000 165.000 55.000 0 220.000
ME 4.800 940 0 5.740 12.600 1.000 0 13.600
RS 163.500 1.100 0 164.600 176.900 2.100 0 179.000
RU 7.200 16.800 0 24.000 9.000 21.000 0 30.000
Source: EPC survey, 2017
Note: For the UK, the split between residential and commercial was not available. However, a significant share of wood
pellet consumption goes to commercial scale due to their national support scheme, RHI (Renewable Heat Incentive).

2017 PELLET MARKET OVERVIEW AN
EXTRACT OF THE AEBIOM STATISTICAL REPORT
AEBIOM 39
EUROPEAN HEATING APPLIANCES MARKET
1.2.5.1 EUROPEAN STOVE MARKET
Collecting data on heating appliance sales is rather difficult but one can extract some trends. Generally, in 2014, 2015
and early 2016 the sales of stoves suffered in most of the countries, mainly due to the mild winters and the low price of
heating oil. But the purchase of a stove is seen much less as an investment, having to rapidly pay off, than is that of a
boiler for the customer. As a consequence, the better heating season 2016.2017 allowed the market to recover rather
fast in most countries.
Italy: Italy remains the European champion having nearly 2.500.000 pellets stoves being installed. However, the annual
sales showed a decrease. Fortunately, the sales started to recover by the end of 2016, mainly due to a rather rigorous
winter, allowing optimistic projections for 2017. A support scheme, named “Conto Termico” has recently been launched.
If the 2017.2018 heating season is cold, then the combination of these market drivers might lead to the replacement of
old pellet stoves, generating all important hope in the sector.
France: Within a few years France became a very interesting market showing an impressive and continuous growth of
the pellet stove sales. In 2016, the annual pellet stove sales reached 105.000 units, showing a growth of 15% from 2014,
progressively reaching Italy showing 170.000 units a year. It is also noticeable that the stove sales continued to grow in
2014 and 2015 while most of the other markets witnessed a sales drop. As for the other markets, the severity of
2017.2018 winter and the price difference between fossil fuels and pellets will be an important driver. Thanks to the
recent implementation of a carbon tax in France, the price difference should increasingly favour pellets over fossil fuels.
The French carbon tax might become a real game changer as it was recently decided to increase the tax from 30 €/t C eq.
in 2017 to 100 €/t C eq.
Spain: After having plateaued due to the unfavourable market conditions, 2016 was a good year in Spain witnessing a
significant growth in stove sales. The market seems rather optimistic about the sales for the coming years.
Germany: The sales of stoves is slightly growing over the years in Germany but the overall results remain below industry
expectations.
Serbia: unexpectedly Serbia is witnessing strong growth of pellet stove sales, confirming the boom of local pellet use in
the Balkans previously reported in this report.
Figure 1.29 Evolution of total amount of installed pellet stoves (thousand units) in 2013.2016 in selected countries
Source: EPC survey, 2017
2.450 584 175149
47
0
50
100
150
200
250
300
350
400
450
500
IT FR ES DE AT
2014 2015 2016
1102.280
2.200139
381
479
44
117133
41

2017 PELLET MARKET OVERVIEW AN
EXTRACT OF THE AEBIOM STATISTICAL REPORT
AEBIOM 40
Figure 1.30 Evolution of installed pellet stoves (thousand units) in 2003.2016 in some European countries with Italy in
secondary axis
Source: EPC survey, 2017
Figure 1.31 Annual sales (2014.2016) of pellet stoves in selected countries (thousand units)
Source: EPC survey, 2017
0
500.000
1.000.000
1.500.000
2.000.000
2.500.000
3.000.000
0
100.000
200.000
300.000
400.000
500.000
600.000
700.000
2003 2004 2005 2006 2007 2008 2009 2010 2011 2012 2013 2014 2015 2016
FR ES DE AT RS IT
170
105
36
16
30,0
50,0
100,0
150,0
200,0
250,0
IT FR ES DE AT
2014 2015 2016

2017 PELLET MARKET OVERVIEW AN
EXTRACT OF THE AEBIOM STATISTICAL REPORT
AEBIOM 41
1.2.5.2 EUROPEAN RESIDENTIAL BOILER MARKET
Contrary to the pellet stoves, acquiring a residential pellet boiler is seen by most individuals as an investment that should
pay off within a reasonable time. Very low heating oil prices severely impacted the sector in most of the developed
markets and the recovery seems difficult. Indeed, in these markets, the better heating season of 2016.2017 did not allow
the sales to catch up, but one noticed an increasing interest of potential customers investing in a boiler, but this did not
materialise in actual sales. Some other parameters, e.g. improving energetic performance of buildings and competition
with other heating systems, are also impacting some markets questioning if the market will recover or if a structural
change is occurring.
Three important countries where reliable data could be collected are showing very similar trends in terms of residential
boiler sales:
Germany: Despite the existence of an incentive for pellet boilers, the growth in sales is still very restrained in Germany.
Only a limited increase is expected in 2017.
Austria: Despite the long and strong history of its pellet industry, Austria is facing the same difficulties as Germany.
France: The sales of stoves showed impressive resistance to the recent difficult market conditions in France but the
boilers have been strongly impacted and this market seem to be encountering difficulties to recover.
Italy, and especially Poland, are showing encouraging trends.
Italy: Despite being a “stove market” Italy is witnessing some sales of residential boilers and these sales recovered in late
2016 thanks to the rigorous winter. This trend is yet to be confirmed in 2017 and the recently launched scheme, named
“Conto Termico”, might have some positive impacts.
Poland: Sales of residential boilers are experiencing strong growth in Poland with 150 % growth from 2014 to 2016. This
might confirm the boom of the Polish pellet industry both in terms of production and local use.

2017 PELLET MARKET OVERVIEW AN
EXTRACT OF THE AEBIOM STATISTICAL REPORT
AEBIOM 42
Figure 1.32 Evolution of total amount of installed residential pellet boilers (<50kW) in 2014.2016 (thousand units) in
selected countries
Source: EPC survey, 2017
Figure 1.33 Evolution (2003.2016) of installed residential pellet boilers (<50kW) (thousand units) in European countries
Source: EPC survey, 2017
261
120
90 87
54
0
50
100
150
200
250
300
DE AT IT SE FR
2014 2015 2016
0
50000
100000
150000
200000
250000
300000
2003 2004 2005 2006 2007 2008 2009 2010 2011 2012 2013 2014 2015 2016
DE AT IT SE FR CZ FI CH ES PL

2017 PELLET MARKET OVERVIEW AN
EXTRACT OF THE AEBIOM STATISTICAL REPORT
AEBIOM 43
Figure 1.34 Annual sales (2014.2016) of residential pellet boilers (<50kW) in selected countries (thousand units)
Source: EPC survey, 2017
18,5
6,2
10,0
0,0
5,9
4,0
15,0
5,0
8,7
1,3
4,4
6,0
14,5
4,1
9,0
0,8
3,9
10,0
0,0
2,0
4,0
6,0
8,0
10,0
12,0
14,0
16,0
18,0
20,0
DE AT IT SE FR PL
2014 2015 2016

2017 PELLET MARKET OVERVIEW AN
EXTRACT OF THE AEBIOM STATISTICAL REPORT
AEBIOM 44
Over the last 3-4 years the marketplace for domestic pellet boilers became more
competitive all over the world. It is mainly the low oil prices that create this higher
pressure and makes the environment more competitive.
However, with pellets being a commodity that is worldwide available, we are also
expanding the horizon of application. Pellet in the early days was simply limited to
small stoves and step by step established a position in the residential hydraulic boiler
market over the last two decades. Over time it conquered also medium to large output
sizes so that today multi-family homes or district heating is regularly done with pellets.
Especially the fact that pellet boilers can run on high temperatures and, even during
very cold outside temperatures, is a huge advantage compared to electricity based
heating.
The newer developments are condensing pellet boilers with even lower dust emissions
that fulfil today’s expectations of highest efficiency and cleanliness. Fröling, as a
pioneer, has a broad share of this still very new market by, offering condensing boilers
for pellets and even log wood and chipped wood boilers.
Another area of activity where Fröling is staking a claim is the production of electricity
on basis of wood pellets. With CHP units – in our case based on wood gasification
technology – we see a market pattern that can be very different from the classic
heating market as far as geography and customer types are concerned. This represents
a very interesting complement to existing structures and makes us to believe strongly
in the further growth potential of the pellets as a worldwide source of energy. Of
course, availability and stability in quality and price are indispensable if we want to
have a reliable fuel in the future.
Werner Emhofer
Export Sales Manager
Fröling

2017 PELLET MARKET OVERVIEW AN
EXTRACT OF THE AEBIOM STATISTICAL REPORT
AEBIOM 45
1.2.5.3 EUROPEAN COMMERCIAL BOILER MARKET
Pellets for commercial heat (dedicated heat boilers > 50 kW output used in residential buildings, public buildings, services,
industry, etc.) remains a niche market for most areas in Europe, but is identified by several observers as key for
establishing pellet use in the long run. Despite the difficulties in collecting reliable data, one can see some encouraging
growth in some countries:
Spain: Sales of commercial heating appliances are progressing in Spain, confirming a growing interest for pellet use in
this sector.
Poland: As for the sales of residential boilers, Poland is experiencing a strong growth in this market. A new subsidy
programme was launched in 2017, bringing hope for further growth in the sector.
Unfortunately, the drop in residential boiler sales observed in Austria and Germany is also occurring in the commercial
sector.
Italy: The commercial scale market is still a niche when compared to the residential market, but Italy is among the biggest
markets in Europe. A deeper investigation recently performed showed that this market was bigger than expected.
Hospitals and agroindustry were identified as the most promising sectors. One also observed that pellet solutions are
gaining market shares against wood chips systems in Italy.
UK: Thanks to RHI, a boom occurred in the sales of commercial heating appliances in the UK but the recent brutal changes
in the scheme stopped the sales.
Figure 1.35 Evolution of total amount of installed commercial pellet boilers (>50kW) in 2014.2016 (thousand units) in
top 5 countries
Source: EPC survey, 2017
12,4
10,28
6,5
5,8
3,9
0,0
2,0
4,0
6,0
8,0
10,0
12,0
14,0
DE ES IT UK AT
2014 2015 2016

2017 PELLET MARKET OVERVIEW AN
EXTRACT OF THE AEBIOM STATISTICAL REPORT
AEBIOM 46
Figure 1.36 Evolution (2003.2016) of installed commercial scale pellet boilers (>50kW) (thousand units) in European
countries
Source: EPC survey, 2017
Figure 1.37 Top 5 countries with highest sales in commercial scale pellet boilers (>50kW) in 2014.2016 (thousand units)
Source: EPC survey, 2017
0
2
4
6
8
10
12
14
2003 2004 2005 2006 2007 2008 2009 2010 2011 2012 2013 2014 2015 2016
DE ES IT UK AT FI LV CH
1,51,3
0,4
4,2
0,3 0,3
0,91,0
0,2 0,2
0,5
0,0
0,5
1,0
1,5
2,0
2,5
3,0
3,5
4,0
4,5
DE ES IT UK AT PL
2014
2015
2016

2017 PELLET MARKET OVERVIEW AN
EXTRACT OF THE AEBIOM STATISTICAL REPORT
AEBIOM 47
The market for medium scale pellet boilers has seen more consistent growth
recently than the market for domestic pellet heating systems. The total
amount of installed systems grew between 2015 and 2016 by 10 – 20 % in
most countries collecting data. Particularly high growth rates can be observed
in eastern Europe, with especially high numbers in Poland. The success of
pellets in Eastern European countries can coma as a surprise as these
countries are generally not known for enthusiastic support of renewable
energy. However, it is not primarily policy support that drives the use of
pellets. It is the fact that pellets are a significantly more convenient and clean
fuel than coal which is still predominant in the heat market of many of these
countries.
While growth rates seem positive, it is still a fact that pellet boilers play a
marginal role in the commercial heat market. Several reasons for this can be
mentioned. The awareness of the need to make a contribution to climate
protection is on the rise but still limited and often satisfied with cheap
mitigation certificates. Energy costs for most companies are small compared
to overall operational costs and have declined in recent years. The perception
of risk associated with the change to a different fuel is also a barrier. It is
interesting to notice that in China pellets are used almost exclusively in mid
and large scale commercial heat applications. Energy service companies have
played a critical role in this development. Could the lack of professional ESCOs
offering competitive heat services to commercial clients be an explanation for
the low market penetration of pellet heating in this segment? In Austria we
have conducted several campaigns to promote the use of pellets in
commercial heat applications. The success was very limited and our
conclusion is that this will not change until prices for fossil fuels rise
significantly as a result of CO2 taxation.
Christian Rakos
Managing Director
ProPellets Austria

2017 PELLET MARKET OVERVIEW AN
EXTRACT OF THE AEBIOM STATISTICAL REPORT
AEBIOM 48
Table 1.7 Annual sales of boilers and stoves in Europe (units)
Stoves Residential boiler < 50 kW Commercial boiler > 50 kW
2015 2016 2020 2015 2016 2020 2015 2016 2020
AT 2.400 2.500 4.000 5.029 4.100 6.000 250 200 300
CZ 400 600 na 2.753 2.200 na na na na
DE 16.500 16.000 na 15.000 14.500 na 1.000 900 na
EE 225 na na 750 na na 150 na na
EL 3.000 2.000 3.000 1.000 1.000 2.000 200 200 100
ES 29.000 35.815 51.000 2.400 2.021 2.200 925 1.015 1.250
FI 100 200 500 500 500 700 100 100 200
FR 98.000 105.000 160.000 4.400 3.890 10.000 na na na
IE 250 na na 50 na na na na na
IT 190.000 170.000 200.000 8.700 9.000 12.000 300 220 350
LT na 10 40 na 700 2.800 na na na
LV 175 200 250 575 400 500 150 150 200
PL na na na na 10.000 na 400 500 na
RO 12 15 2.000 11 15 2.000 250 300 350
SE na 900 na 1.300 800 na na 100 na
SI 42 na na 331 na na na na na
Other Europe
CH 500 500 500 617 900 900 194 200 300
RS 11.910 13.230 na 4.820 2.160 na 17 53 na
Source: EPC survey, 2017
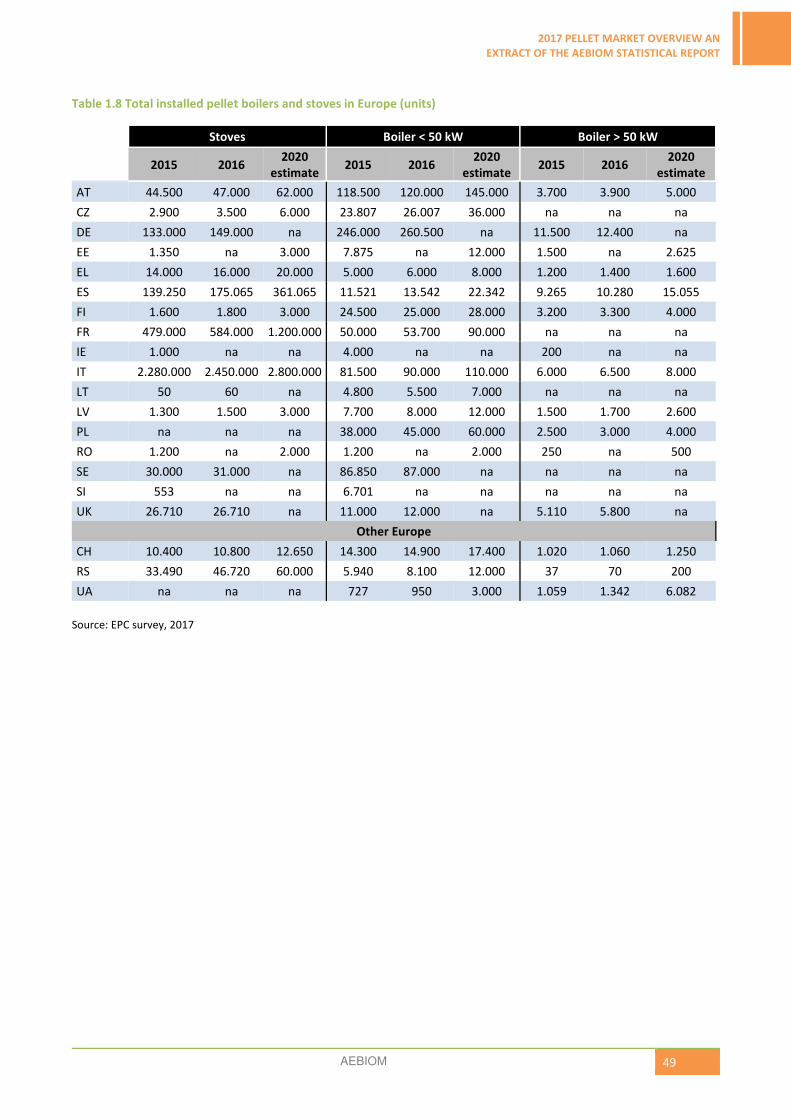
2017 PELLET MARKET OVERVIEW AN
EXTRACT OF THE AEBIOM STATISTICAL REPORT
AEBIOM 49
Table 1.8 Total installed pellet boilers and stoves in Europe (units)
Stoves Boiler < 50 kW Boiler > 50 kW
2015 2016 2020
estimate 2015 2016
2020
estimate 2015 2016
2020
estimate
AT 44.500 47.000 62.000 118.500 120.000 145.000 3.700 3.900 5.000
CZ 2.900 3.500 6.000 23.807 26.007 36.000 na na na
DE 133.000 149.000 na 246.000 260.500 na 11.500 12.400 na
EE 1.350 na 3.000 7.875 na 12.000 1.500 na 2.625
EL 14.000 16.000 20.000 5.000 6.000 8.000 1.200 1.400 1.600
ES 139.250 175.065 361.065 11.521 13.542 22.342 9.265 10.280 15.055
FI 1.600 1.800 3.000 24.500 25.000 28.000 3.200 3.300 4.000
FR 479.000 584.000 1.200.000 50.000 53.700 90.000 na na na
IE 1.000 na na 4.000 na na 200 na na
IT 2.280.000 2.450.000 2.800.000 81.500 90.000 110.000 6.000 6.500 8.000
LT 50 60 na 4.800 5.500 7.000 na na na
LV 1.300 1.500 3.000 7.700 8.000 12.000 1.500 1.700 2.600
PL na na na 38.000 45.000 60.000 2.500 3.000 4.000
RO 1.200 na 2.000 1.200 na 2.000 250 na 500
SE 30.000 31.000 na 86.850 87.000 na na na na
SI 553 na na 6.701 na na na na na
UK 26.710 26.710 na 11.000 12.000 na 5.110 5.800 na
Other Europe
CH 10.400 10.800 12.650 14.300 14.900 17.400 1.020 1.060 1.250
RS 33.490 46.720 60.000 5.940 8.100 12.000 37 70 200
UA na na na 727 950 3.000 1.059 1.342 6.082
Source: EPC survey, 2017

2017 PELLET MARKET OVERVIEW AN
EXTRACT OF THE AEBIOM STATISTICAL REPORT
AEBIOM 50
1.2.5.4 PELLET CONSUMPTION FOR ELECTRICITY PRODUCTION
Figure 1.38 Overview of pellet consumption for electricity production in Europe in 2016
Source: EPC survey, 2017; Hawkins Wright, EPC calculation
Figure 1.39 European pellet consumption for electricity production in 2016 (million tonnes)
Sources: (BE, DK, FR, FI PL, UK) Hawkins Wright; (DE, SI) EPC survey, 2017, EPC calculation
0
1.000.000
2.000.000
3.000.000
4.000.000
5.000.000
6.000.000
7.000.000
8.000.000
2015 2016 2015 2016 2015 2016 2015 2016 2015 2016 2015 2016 2015 2016 2015 2016 2015 2016
UK BE DK SE FR FI DE PL SI
CHP power Dedicated power
6,81
1,00
0,500,21 0,10 0,05 0,02 0,05 0,02

2017 PELLET MARKET OVERVIEW AN
EXTRACT OF THE AEBIOM STATISTICAL REPORT
AEBIOM 51
Fiona Matthews
Research Manager (Bioenergy)
Hawkins Wright Ltd.
The global wood pellet market endured a challenging 2016. Acute oversupply in both the industrial and heating sectors,
combined with relatively warm temperatures and overrunning maintenance at Drax power station, pressured pellet mill
operating rates and led to a record drop in industrial pellet prices.
Data from Hawkins Wright’s Outlook for Wood Pellets report shows that global industrial pellet demand increased by
+3% (+330kt) in 2016, much lower than the +21% growth in 2015 and +15% in 2014. Total global industrial demand in
2016 was 13.4Mt, compared to 13.0Mt in 2015. Demand for industrial pellets actually declined by 190kt in Europe in
2016, but this drop was offset by increased demand in Asia.
In Demark the major consumers of industrial pellets in 2016 were Dong’s three converted CHP plants. Studstrup, Herning
and Avedøre. which collectively used 1.2Mt of pellets. In addition, HOFOR’s Amager CHP plant consumed just under 300kt
of pellets. The other major industrial pellet user in Europe was Engie, which consumed approximately 1.0Mt of pellets at
its Les Awirs and ‘Max Green’ plants converted coal plants in Belgium. The outlook for demand in Belgium has recently
decreased due to the cancellation of a project by Graanul to convert the Langerlo coal plant to wood pellets.
Until 2013 the Netherlands was a major user of industrial pellets, but a hiatus in subsidy support for cofiring caused
demand to drop to zero in 2015 and 2016. Four projects have been successful in obtaining support under the new SDE+
subsidy regime, with RWE’s Amer #9 project expected to be online before the end of 2017. When all four projects become
operational, total industrial pellet demand in the Netherlands is likely to reach 3.5Mt/y.
In Asia, demand for industrial pellets increased in both South Korea and Japan in 2016. Consumption in Japan increased
by +52%, to 350kt, thanks in part to demand at Showa Shell Sekiyu’s 49MW Kanagawa power plant, which started
operating at the end of 2015. Pellet demand in South Korea, meanwhile, rose +21% to 1.7Mt in 2016, reversing the
decline between 2014.2015. Gunjang Energy began operating its 250MW biomass plant, which cofires around 30% wood
pellets, in mid.2016.
There is a healthy pipeline of new pellet-fired power projects in Asia – including both cofiring and new-build 100%
biomass power plants – that will increase demand for pellets in South Korea and Japan over the coming decade. Current
market intelligence indicates that by the late 2020’s the Asian industrial pellet market could be comparable in size to that
in Europe.
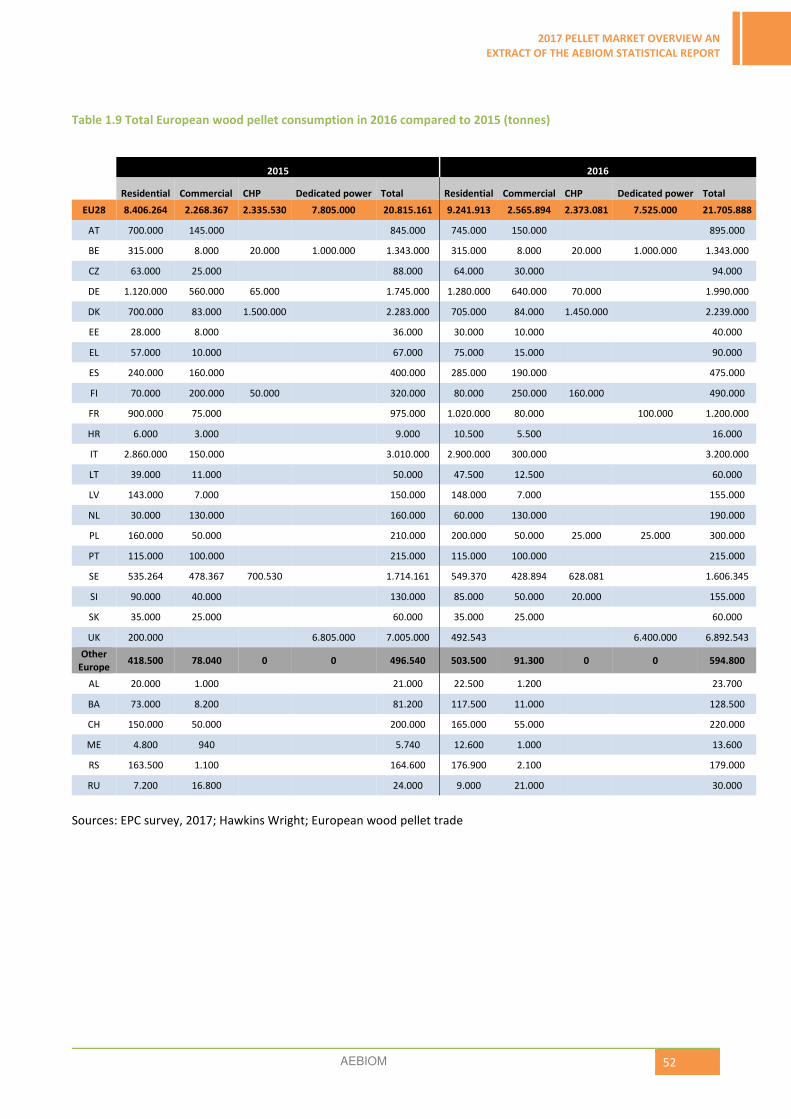
2017 PELLET MARKET OVERVIEW AN
EXTRACT OF THE AEBIOM STATISTICAL REPORT
AEBIOM 52
Table 1.9 Total European wood pellet consumption in 2016 compared to 2015 (tonnes)
2015 2016
Residential Commercial CHP Dedicated power Total Residential Commercial CHP Dedicated power Total
EU28 8.406.264 2.268.367 2.335.530 7.805.000 20.815.161 9.241.913 2.565.894 2.373.081 7.525.000 21.705.888
AT 700.000 145.000 845.000 745.000 150.000 895.000
BE 315.000 8.000 20.000 1.000.000 1.343.000 315.000 8.000 20.000 1.000.000 1.343.000
CZ 63.000 25.000 88.000 64.000 30.000 94.000
DE 1.120.000 560.000 65.000 1.745.000 1.280.000 640.000 70.000 1.990.000
DK 700.000 83.000 1.500.000 2.283.000 705.000 84.000 1.450.000 2.239.000
EE 28.000 8.000 36.000 30.000 10.000 40.000
EL 57.000 10.000 67.000 75.000 15.000 90.000
ES 240.000 160.000 400.000 285.000 190.000 475.000
FI 70.000 200.000 50.000 320.000 80.000 250.000 160.000 490.000
FR 900.000 75.000 975.000 1.020.000 80.000 100.000 1.200.000
HR 6.000 3.000 9.000 10.500 5.500 16.000
IT 2.860.000 150.000 3.010.000 2.900.000 300.000 3.200.000
LT 39.000 11.000 50.000 47.500 12.500 60.000
LV 143.000 7.000 150.000 148.000 7.000 155.000
NL 30.000 130.000 160.000 60.000 130.000 190.000
PL 160.000 50.000 210.000 200.000 50.000 25.000 25.000 300.000
PT 115.000 100.000 215.000 115.000 100.000 215.000
SE 535.264 478.367 700.530 1.714.161 549.370 428.894 628.081 1.606.345
SI 90.000 40.000 130.000 85.000 50.000 20.000 155.000
SK 35.000 25.000 60.000 35.000 25.000 60.000
UK 200.000 6.805.000 7.005.000 492.543 6.400.000 6.892.543
Other
Europe 418.500 78.040 0 0 496.540 503.500 91.300 0 0 594.800
AL 20.000 1.000 21.000 22.500 1.200 23.700
BA 73.000 8.200 81.200 117.500 11.000 128.500
CH 150.000 50.000 200.000 165.000 55.000 220.000
ME 4.800 940 5.740 12.600 1.000 13.600
RS 163.500 1.100 164.600 176.900 2.100 179.000
RU 7.200 16.800 24.000 9.000 21.000 30.000
Sources: EPC survey, 2017; Hawkins Wright; European wood pellet trade

2017 PELLET MARKET OVERVIEW AN
EXTRACT OF THE AEBIOM STATISTICAL REPORT
AEBIOM 53
Figure 1.40 EU28 Member States pellet balance by country in 2015 - production, consumption, export, import (million
tonnes)
Source: EPC survey, 2017; Hawkins Wright; Eurostat; FAO
-8,0 -6,0 -4,0 -2,0 0,0 2,0 4,0 6,0 8,0
AT
BE
BG
CZ
DE
DK
EE
EL
ES
FI
FR
HR
HU
IE
IT
LT
LU
LV
NL
PL
PT
RO
SE
SI
SK
UK
Consumption Export Production Import

2017 PELLET MARKET OVERVIEW AN
EXTRACT OF THE AEBIOM STATISTICAL REPORT
AEBIOM 54
1.2.5.5 EU28 EXPORTING COUNTRIES
Latvia: Over the period 2011 to 2016, Latvia was the fastest growing country for exports showing an increase of almost
1 million tonnes which is equivalent to 160% growth. This incredible growth is due to several factors: very high wood
resources, good location (Baltic sea) and logistics (harbour), flexible wood industry, low working costs and very limited
local use. The export volumes mirror the production growth. This is because there is limited local demand. However, from
2015 onwards, the exports from Latvia stagnated mainly due to the industrial consumption which was lower than
expected and the disappointing heating market price and demand (except for late 2016). Interestingly, Latvia exported
more pellets than actually produced in 2016. Indeed, the production has been completed by some 2015 stocks and
imports.
Estonia: This Baltic country shows very similar trends to Latvia with nearly 500.000 t increase or 125% from 2011 to 2016.
Austria: For years, Austria was a net pellet exporter. Traditional business relationships with Italy lead to an annual export
of approximately 500.000t to Italy. Strong local demand in Austria and close ties to major Austrian sawmill industries in
Germany, Czech Republic and Romania lead to significant imports from these countries to balance supply and demand.
Portugal: Over the years, Portugal became an important industrial pellet producer but no further increase is foreseen
mainly due to insufficient raw material availability and its high price. Portuguese exports have been following a declining
trend from 2013 onwards, because the production declined and the local use of pellets increased. In 2016 a strong dollar
allowed some Portuguese producers to supply some utilities above the existing long-term contracts.
Germany: Since 2012, Germany saw its exports severely decreasing mainly because pellet production decreased while
local consumption grew significantly. Exports were also facing fierce competition from other countries.
Poland: One can observe an increase in Polish exports again confirming the constant growth of this sector.
Croatia: A continuous growth in pellet exports can be observed in Croatia. This is due to a production increase and limited
local consumption. It can be noted that the vast majority of pellets are sold in Italy.
Figure 1.41 Top 10 of the EU28 wood pellet exporting countries 2011.2016 (million tonnes)
Source: Eurostat
0,0
0,2
0,4
0,6
0,8
1,0
1,2
1,4
1,6
1,8
2011 2012 2013 2014 2015 2016
LV EE AT PT DE LT CZ PL RO HR

2017 PELLET MARKET OVERVIEW AN
EXTRACT OF THE AEBIOM STATISTICAL REPORT
AEBIOM 55
Figure 1.42 Division of total EU28 exports in 2016 (percentage)
Source: Eurostat
LV
24%
EE
14%
AT
9%PT
7%
DE
5%
LT
5%
CZ
4%
PL
4%
RO
4%
HR
3%
Rest of Europe
21%

2017 PELLET MARKET OVERVIEW AN
EXTRACT OF THE AEBIOM STATISTICAL REPORT
AEBIOM 56
Table 1.10 Top 10 wood pellet exporting countries in the EU28 in 2011.2015 (tonnes)
2012 2013 2014 2015 2016
LV
DK 436.771 DK 504.857 DK 492.887 DK 537.619 EE 634.876
EE 130.040 EE 179.940 EE 306.500 EE 489.186 DK 572.750
SE 103.898 UK 161.703 UK 304.320 UK 391.960 UK 294.369
Rest of EU28 231.124 Rest of EU28 209.181 Rest of EU28 172.593 Rest of EU28 201.042 Rest of EU28 109.749
Rest of the world 126 Rest of the world 250 Rest of the world 458 Rest of the world 643 Rest of the world 597,1
EE
DK 264.728 DK 375.956 DK 423.156 DK 257.360 DK 493.870
SE 122.465 SE 119.640 IT 56.223 SE 49.408 UK 210.178
UK 20.011 IT 43.735 SE 55.104 UK 48.131 NL 116.589
Rest of EU28 18.200 Rest of EU28 83.821 Rest of EU28 106.284 Rest of EU28 11.854 Rest of EU28 123.275
Rest of the world 5.022 Rest of the world 23 Rest of the world 72 Rest of the world 48 Rest of the world 115,3
AT
IT 404.455 IT 429.268 IT 440.114 IT 486.604 IT 550.796
DE 53.102 DE 36.494 DE 28.575 DE 29.368 DE 21.584
CZ 5.701 CH 8.119 CH 7.266 CZ 20.046 SI 17.102
Rest of EU28 9.689 Rest of EU28 7.498 Rest of EU28 8.021 Rest of EU28 20.766 Rest of EU28 7.371
Rest of the world 3.365 Rest of the world 1.420 Rest of the world 1.396 Rest of the world 2.344 Rest of the world 12.694
PT
DK 210.006 UK 277.251 UK 481.609 DK 172.448 UK 211.646
NL 137.080 DK 252.076 DK 141.071 UK 155.807 DK 147.835
UK 107.248 NL 70.059 ES 71.718 NL 138.802 ES 69.879
Rest of EU28 121.097 Rest of EU28 170.504 Rest of EU28 54.816 Rest of EU28 91.808 Rest of EU28 52.308
Rest of the world 20 Rest of the world 7 Rest of the world 43 Rest of the world 21 Rest of the world 235,5
DE
DK 178.196 AT 167.421 AT 201.240 UK 173.031 IT 120.094
AT 166.986 DK 121.539 IT 166.847 AT 141.294 AT 83.813
IT 160.223 IT 112.408 FR 89.445 IT 136.486 FR 59.165
Rest of EU28 308.852 Rest of EU28 243.452 Rest of EU28 164.654 Rest of EU28 185.527 Rest of EU28 55.833
Rest of the world 34.520 Rest of the world 75.408 Rest of the world 43.129 Rest of the world 52.749 Rest of the world 47.746
LT
IT 130.070 IT 159.211 IT 173.315 IT 137.574 IT 125.009
DK 94.581 DK 77.547 DK 55.346 DK 49.352 LV 54.444
DE 18.286 BE 31.272 BE 20.764 EE 27.647 UK 33.010
Rest of EU28 21.891 Rest of EU28 53.238 Rest of EU28 48.549 Rest of EU28 95.210 Rest of EU28 94.002
Rest of the world 170 Rest of the world 212 Rest of the world 227 Rest of the world 520 Rest of the world 1192
CZ
AT 49.604 AT 57.507 IT 53.175 IT 114.493 IT 134.603
IT 48.971 IT 40.765 AT 44.352 AT 64.882 AT 105.324
DE 28.081 DE 28.374 DE 38.982 DE 37.065 DE 33.015
Rest of EU 28 20.741 Rest of EU 28 23.896 Rest of EU 28 16.727 Rest of EU 28 12.565 Rest of EU28 14.074
Rest of the world 89 Rest of the world 105 Rest of the world 152 Rest of the world 1.109 Rest of the world 1.067
PL
DK 51.793 DE 80.362 DE 82.822 DE 85.631 DK 95.753
DE 45.490 DK 69.265 DK 58.057 DK 70.953 DE 95.445
CZ 6.121 IT 25.850 IT 29.729 IT 42.224 IT 65.280
Rest of EU28 8.015 Rest of EU28 11.051 Rest of EU28 10.799 Rest of EU28 16.291 Rest of EU28 18.659
Rest of the world 310 Rest of the world 297 Rest of the world 303 Rest of the world 513 Rest of the world 526,7
RO
IT 117.267 AT 205.191 AT 192.022 AT 120.887 AT 117.978
AT 94.362 IT 167.123 IT 128.826 IT 101.027 IT 40.241
EL 18.327 EL 28.047 BG 25.364 SI 35.544 BG 37.799
Rest of EU28 46.540 Rest of EU28 56.856 Rest of EU28 65.818 Rest of EU28 65.217 Rest of EU28 64.290
Rest of the world 205 Rest of the world 272 Rest of the world 886 Rest of the world 651 Rest of the world 799
HR
IT 120.281 IT 152.005 IT 139.122 IT 176.890 IT 205.764
SI 16.978 SI 16.312 SI 11.031 SI 11.576 SI 13.482
AT 692 AT 1.987 AT 8.278 AT 5.184 RO 6.702
Rest of EU28 79 Rest of EU28 377 Rest of EU28 2.881 Rest of EU28 6.665 Rest of EU28 6.485
Rest of the world 24 Rest of the world 23 Rest of the world 24 Rest of the world 48 Rest of the world 24
Source: Eurostat
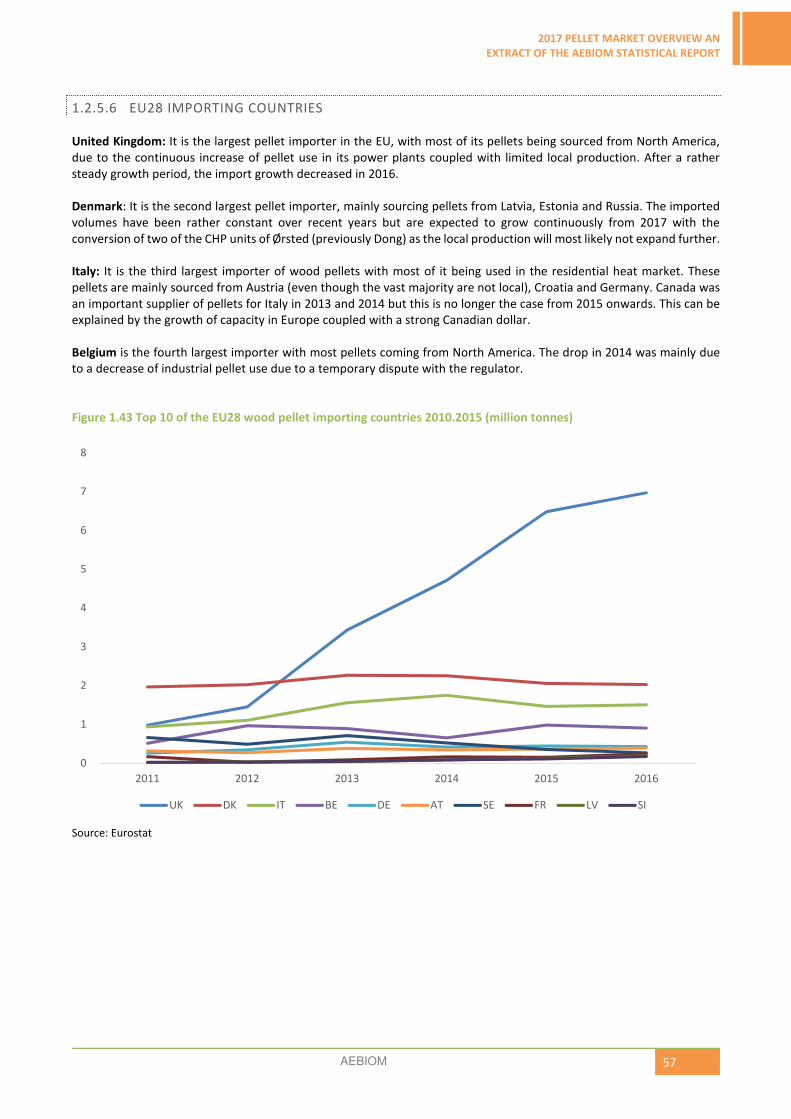
2017 PELLET MARKET OVERVIEW AN
EXTRACT OF THE AEBIOM STATISTICAL REPORT
AEBIOM 57
1.2.5.6 EU28 IMPORTING COUNTRIES
United Kingdom: It is the largest pellet importer in the EU, with most of its pellets being sourced from North America,
due to the continuous increase of pellet use in its power plants coupled with limited local production. After a rather
steady growth period, the import growth decreased in 2016.
Denmark: It is the second largest pellet importer, mainly sourcing pellets from Latvia, Estonia and Russia. The imported
volumes have been rather constant over recent years but are expected to grow continuously from 2017 with the
conversion of two of the CHP units of Ørsted (previously Dong) as the local production will most likely not expand further.
Italy: It is the third largest importer of wood pellets with most of it being used in the residential heat market. These
pellets are mainly sourced from Austria (even though the vast majority are not local), Croatia and Germany. Canada was
an important supplier of pellets for Italy in 2013 and 2014 but this is no longer the case from 2015 onwards. This can be
explained by the growth of capacity in Europe coupled with a strong Canadian dollar.
Belgium is the fourth largest importer with most pellets coming from North America. The drop in 2014 was mainly due
to a decrease of industrial pellet use due to a temporary dispute with the regulator.
Figure 1.43 Top 10 of the EU28 wood pellet importing countries 2010.2015 (million tonnes)
Source: Eurostat
0
1
2
3
4
5
6
7
8
2011 2012 2013 2014 2015 2016
UK DK IT BE DE AT SE FR LV SI
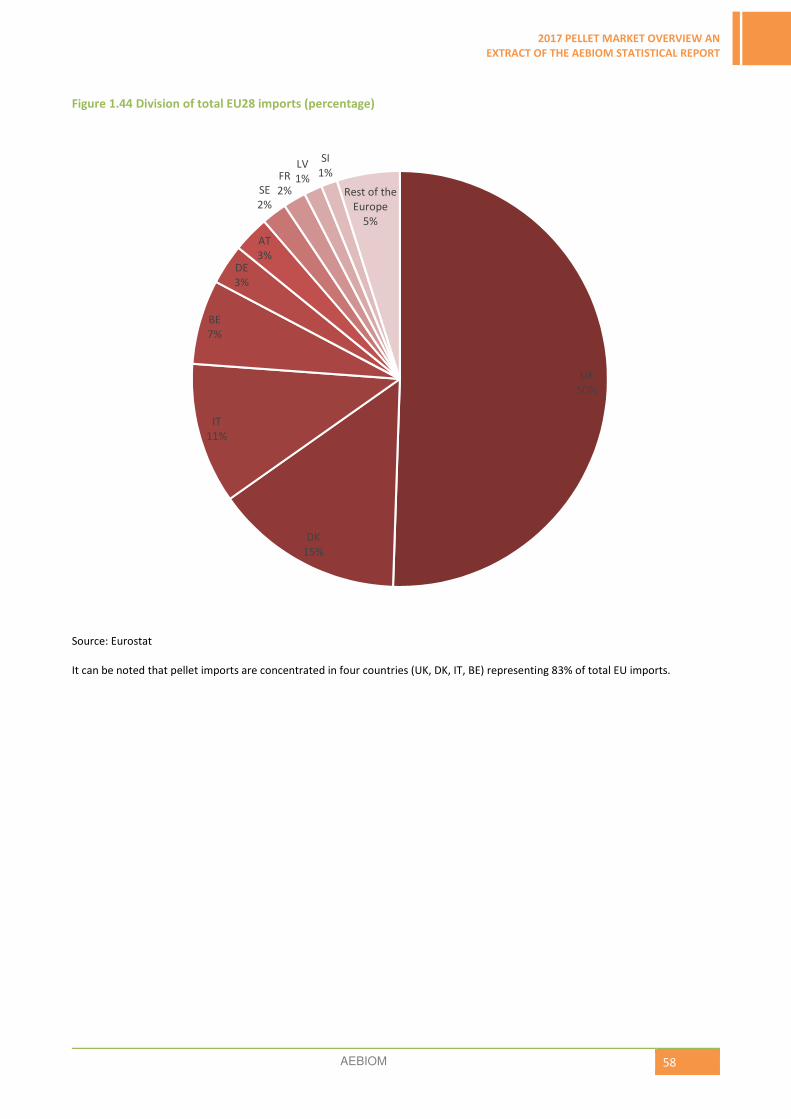
2017 PELLET MARKET OVERVIEW AN
EXTRACT OF THE AEBIOM STATISTICAL REPORT
AEBIOM 58
Figure 1.44 Division of total EU28 imports (percentage)
Source: Eurostat
It can be noted that pellet imports are concentrated in four countries (UK, DK, IT, BE) representing 83% of total EU imports.
UK
50%
DK
15%
IT
11%
BE
7%
DE
3%
AT
3%
SE
2%
FR
2%
LV
1%
SI
1%
Rest of the
Europe
5%

2017 PELLET MARKET OVERVIEW AN
EXTRACT OF THE AEBIOM STATISTICAL REPORT
AEBIOM 59
Table 1.11 Top 10 wood pellet importing countries in the EU28 with breakdown of origin in 2010.2015 (tonnes)
2012 2013 2014 2015 2016
EU
US 1.764.394 US 2.775.929 US 3.889.833 US 4.286.614 US 4.901.682
CA 1.346.237 CA 1.963.270 CA 1.259.087 CA 1.474.785 CA 1.685.203
RU 645.258 RU 701.722 RU 825.842 RU 786.214 RU 845.398
Other non.EU28 4.588.223 Other non.EU28 655.456 Other non.EU28 571.972 Other non.EU 317.425 Other non.EU 674.354
UK
CA 854.602 US 1.573.493 US 2.894.916 US 3.527.986 USA 4.127.578
US 475.337 CA 1.466.782 CA 889.353 CA 1.161.425 CA 1.384.774
LV 101.783 LV 165.190 PT 439.537 LV 995.125 LV 936.256
Rest of EU28 20.960 Rest of EU28 225.654 Rest of EU28 486.825 Rest of EU28 789.599 Rest of EU28 461.449
Rest of the world 34.217 Rest of the world 1.068 Rest of the world 4.460 Rest of the world 44.746 Rest of the world 158.595
DK
LV 586.254 LV 705.984 LV 608.954 LV 601.771 EE 595.566
RU 347.961 EE 363.127 EE 465.257 EE 552.114 LV 548.605
EE 292.422 RU 333.964 RU 388.704 RU 333.085 RU 257.655
Rest of EU28 701.738 Rest of EU28 750.347 Rest of EU28 561.747 Rest of EU28 551.896 Rest of EU28 1.119.189
Rest of the world 71.864 Rest of the world 166.779 Rest of the world 104.211 Rest of the world 37.562 Rest of the world 385.914
IT
AT 313.933 AT 349.491 AT 395.014 AU 405.017 AT 458.810
DE 137.445 CA 186.001 CA 229.435 HR 127.732 HR 150.035
HR 114.266 HR 129.338 US 179.966 DE 108.638 DE 107.445
Rest of EU28 404.465 Rest of EU28 705.622 Rest of EU28 822.506 Rest of EU28 580.822 Rest of EU28 733.319
Rest of the world 223.590 Rest of the world 385.510 Rest of the world 309.043 Rest of the world 418.029 Rest of the world 321.656
BE
US 571.933 US 587.619 US 422.774 US 628.970 CA 237.359
CA 205.469 CA 160.151 CA 107.238 CA 227.940 RU 85.836
UK 81.360 NL 78.160 NL 73.662 NL 65.440 USA 533.133
Rest of EU28 108.640 Rest of EU28 67.144 Rest of EU28 49.145 Rest of EU28 25.581 Rest of EU28 49.114
Rest of the world 3.068 Rest of the world 3.115 Rest of the world 4.557 Rest of the world 40.721 Rest of the world 86.871
DE
DK 86.966 DK 109.292 NL 73.966 RU 74.931 PL 104.449
AT 40.164 NL 97.826 AT 52.517 PO 68.792 BE 72.773
FR 32.569 BE 54.861 DK 51.048 DK 62.701 RU 53.538
Rest of EU28 118.555 Rest of EU28 210.258 Rest of EU28 147.719 Rest of EU28 199.969 Rest of EU28 172.407
Rest of the world 69.213 Rest of the world 74.386 Rest of the world 69.740 Rest of the world 28.279 Rest of the world 27.742
AT
RO 103.724 RO 205.785 RO 190.941 RO 189.336 RO 190.011
DE 86.619 DE 83.201 DE 66.314 DE 92.956 CZ 104.139
CZ 57.721 CZ 57.215 CZ 53.289 CZ 70.645 DE 82.558
Rest of EU28 19.415 Rest of EU28 28.053 Rest of EU28 30.398 Rest of EU28 12.521 Rest of EU28 10.202
Rest of the world 4.694 Rest of the world 11.204 Rest of the world 3.003 Rest of the world 2.385 Rest of the world 5.313
SE
RU 211.298 RU 236.256 RU 220.984 RU 150.726 RU 136.809
EE 101.314 EE 177.397 LV 80.925 LV 60.448 EE 84.247
DK 42.874 LV 63.542 EE 77.437 UK 57.230 DK 21.311
Rest of EU28 73.096 Rest of EU28 176.902 Rest of EU28 95.202 Rest of EU28 79.066 Rest of EU28 19.292
Rest of the world 64.457 Rest of the world 58.543 Rest of the world 47.364 Rest of the world 7.473 Rest of the world 9.577
FR
DE 17.087 EE 29.992 EE 34.689 DE 53.810 USA 94.989
LU 4.648 DE 21.971 DE 32.321 BE 53.570 BE 78.788
BE 2.022 BE 13.942 BE 29.740 US 12.917 DE 29.128
Rest of EU28 1.072 Rest of EU28 22.653 Rest of EU28 39.157 Rest of EU28 15.999 Rest of EU28 41.455
Rest of the world 719 Rest of the world 527 Rest of the world 729 Rest of the world 497 Rest of the world 559
LV
BY 28.314 BY 24.507 BY 46.761 BY 75.162 LT 70.590
RU 4.797 RU 12.131 RU 29.081 RU 23.781 BY 62.977
EE 657 LT 2.171 LT 6.162 LT 20.132 RU 48.112
Rest of EU28 249 Rest of EU28 2.175 Rest of EU28 5.810 Rest of EU28 10.045 Rest of EU28 14.003
Rest of the world 0 Rest of the world 344 Rest of the world 60 Rest of the world 65 Rest of the world 0
SI
HR 21.807 RO 20.392 RO 62.283 CZ 7.956 UA 7.309
RO 3.354 HR 17.102 AT 7.202 UK 6.152 CZ 6.990
UE 1.453 UK 2.343 HR 6.565 IT 3.120 PL 1.235
Rest of EU28 4.419 Rest of EU28 5.915 Rest of EU28 3.900 Rest of EU28 2.502 Rest of EU28 470
Rest of the world 29133 Rest of the world 72873 Rest of the world 82371 Rest of the world 6544 Rest of the world 348,6
Source: Eurostat

2017 PELLET MARKET OVERVIEW AN
EXTRACT OF THE AEBIOM STATISTICAL REPORT
AEBIOM 60
EUROPEAN WOOD PELLET PRICE
1.2.6.1 EUROPEAN PRICE DEVELOPMENT OF RESIDENTIAL PELLETS
One can identify some common trends even though most of the countries have their own specificities.
The unfavourable market conditions occurring during the last three consecutive heating seasons impacted the residential
pellet market as well as the price of residential pellets. With these mild winters, the demand for pellets for heat
production decreased, leading to overproduction and overstocking. This situation has been exacerbated by fierce
competition with external pellet importers in several countries. Consequently, the pellet price reached its lowest level
for years in May-June-July 2016, well beyond the annual drop in prices occurring between the heating seasons.
Thanks to a good start of the 2016.2017 heating season, the production-demand could be rebalanced in most areas.
Unfortunately, this situation led to some tensions in the supply or even lead to shortage in some countries. Logically, the
price increased from that time, but one can highlight how fast and strong this recovery was, allowing the price to reach
one of its highest levels since 2014 over a very short period in most countries. Quite differently, the price in some
countries did not recover completely.
Spain shows a rather different trend: prices have been going down for years reaching their lowest level in December
2016. The price slightly recovered in the coldest moments of the heating season but went down again after this.
Figure 1.45 Estimation of bagged wood pellet prices in most expensive European countries between September 2014
and June 2017 (retail price, 1 pallet in €/t VAT incl.)
Note: IT, ES: quarterly prices
Source: EPC survey, 2017
150
170
190
210
230
250
270
290
310
330
20
14
Se
p
20
14
Oct
20
14
No
v
20
14
De
c
20
15
Ja
n
20
15
Fe
b
20
15
Ma
r
20
15
Ap
r
20
15
Ma
y
20
15
Ju
n
20
15
Ju
l
20
15
Au
g
20
15
Se
p
20
15
Oct
20
15
No
v
20
15
De
c
20
16
Ja
n
20
16
Fe
b
20
16
Ma
r
20
16
Ap
r
20
16
Ma
y
20
16
Ju
n
20
16
Ju
l
20
16
Au
g
20
16
Se
p
20
16
Oct
20
16
No
v
20
16
De
c
20
17
Ja
n
20
17
Fe
b
20
17
Ma
r
20
17
Ap
r
20
17
Ma
y
20
17
Ju
n
20
17
Ju
l
IT DE EL FR AT ES SE BA

2017 PELLET MARKET OVERVIEW AN
EXTRACT OF THE AEBIOM STATISTICAL REPORT
AEBIOM 61
Figure 1.46 Estimation of bagged wood pellet prices in European countries with lowest prices between September
2014 and June 2017 (with: retail price, 1 pallet in €/t VAT incl.)
Note: IT, ES: quarterly prices
Source: EPC survey, 2017
Figure 1.47 Variation of bagged wood pellet prices between July 2016 and June 2017 (with: retail price, 1 pallet in €/t
VAT incl.)
Source: EPC survey, 2017
0
50
100
150
200
250
300
20
14
Se
p
20
14
Oct
20
14
No
v
20
14
De
c
20
15
Ja
n
20
15
Fe
b
20
15
Ma
r
20
15
Ap
r
20
15
Ma
y
20
15
Ju
n
20
15
Ju
l
20
15
Au
g
20
15
Se
p
20
15
Oct
20
15
No
v
20
15
De
c
20
16
Ja
n
20
16
Fe
b
20
16
Ma
r
20
16
Ap
r
20
16
Ma
y
20
16
Ju
n
20
16
Ju
l
20
16
Au
g
20
16
Se
p
20
16
Oct
20
16
No
v
20
16
De
c
20
17
Ja
n
20
17
Fe
b
20
17
Ma
r
20
17
Ap
r
20
17
Ma
y
20
17
Ju
n
20
17
Ju
l
CZ BA ME RS AL PL LT UA
100
150
200
250
300
350
CZ DE EL ES FR HR LT LV PL SE AL BA CH ME RS
Highest
Average
Lowest

2017 PELLET MARKET OVERVIEW AN
EXTRACT OF THE AEBIOM STATISTICAL REPORT
AEBIOM 62
Table 1.12 Estimation of bagged wood pellet prices between September 2016 and July 2017 in Europe (with: retail
price, 1 pallet in €/t VAT incl.)
September
2016
October
2016
November
2016
December
2016
January
2017
February
2017
March
2017
April
2017
May
2017
June
2017
July
2017
CZ 214 220 231 233 233 235 225
DE 277 282 282 282 289 300 296 279 279 EL 280 290 300 300 310 310 300 260 260 260 270
ES 253 250 250 250 254 254 254 251 251 251 FR 269 284 284 284 292 292 292
HR 245 250 270 270 270 270 250 220 220 230 230
IT 290 306
LT 159 151 161 164 164 162 165 165 165 155 LV 230 230 240 260 270 260 250 235 235 235
PL 150 155 160 160 170 180 180 160 160 SE 253 254 254 254 253 253 253
Other Europe
SI 245 253 AL 175 190 195 200 200 200 192 180 180 180
BA 215 220 225 240 290 280 240 220 220 220 ME 188 190 200 208
RS 198 204 205 205 230 240 224 202 202 202 Source: EPC survey, 2017
Limitation of liability: Under no circumstance shall EPC and its contributors be liable for the exactitude or the use made
of the price information available in this section.
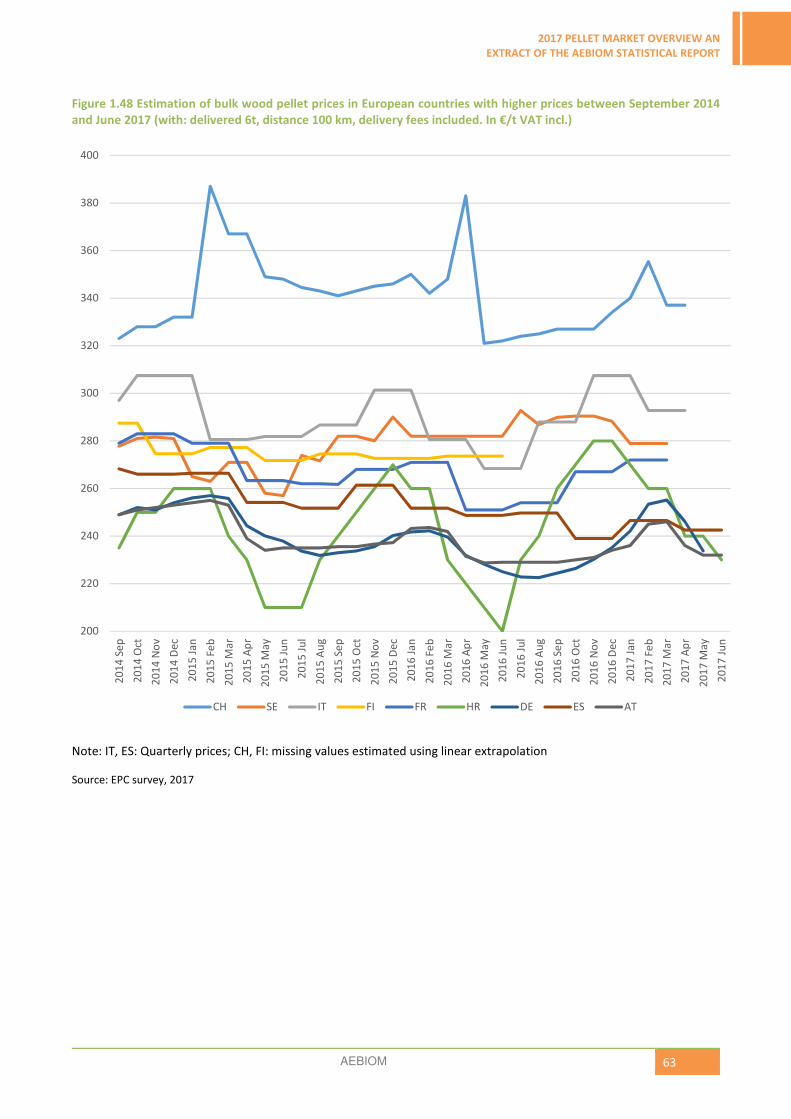
2017 PELLET MARKET OVERVIEW AN
EXTRACT OF THE AEBIOM STATISTICAL REPORT
AEBIOM 63
Figure 1.48 Estimation of bulk wood pellet prices in European countries with higher prices between September 2014
and June 2017 (with: delivered 6t, distance 100 km, delivery fees included. In €/t VAT incl.)
Note: IT, ES: Quarterly prices; CH, FI: missing values estimated using linear extrapolation
Source: EPC survey, 2017
200
220
240
260
280
300
320
340
360
380
400
20
14
Se
p
20
14
Oct
20
14
No
v
20
14
De
c
20
15
Ja
n
20
15
Fe
b
20
15
Ma
r
20
15
Ap
r
20
15
Ma
y
20
15
Ju
n
20
15
Ju
l
20
15
Au
g
20
15
Se
p
20
15
Oct
20
15
No
v
20
15
De
c
20
16
Ja
n
20
16
Fe
b
20
16
Ma
r
20
16
Ap
r
20
16
Ma
y
20
16
Ju
n
20
16
Ju
l
20
16
Au
g
20
16
Se
p
20
16
Oct
20
16
No
v
20
16
De
c
20
17
Ja
n
20
17
Fe
b
20
17
Ma
r
20
17
Ap
r
20
17
Ma
y
20
17
Ju
n
CH SE IT FI FR HR DE ES AT

2017 PELLET MARKET OVERVIEW AN
EXTRACT OF THE AEBIOM STATISTICAL REPORT
AEBIOM 64
Figure 1.49 Estimation of bulk wood pellet prices in selected markets in European countries with lower prices between
September 2014 and June 2017 (with: delivered 6t, distance 100 km, delivery fees included. In €/t VAT incl.)
Source: EPC survey, 2017
Figure 1.50 Variation of bulk wood pellet prices between July 2016 and June 2017 (with: delivered 6t, distance 100 km,
delivery fees included. In €/t VAT incl.)
Source: EPC survey, 2017
0
50
100
150
200
250
300
20
14
Se
p
20
14
Oct
20
14
No
v
20
14
De
c
20
15
Ja
n
20
15
Fe
b
20
15
Ma
r
20
15
Ap
r
20
15
Ma
y
20
15
Ju
n
20
15
Ju
l
20
15
Au
g
20
15
Se
p
20
15
Oct
20
15
No
v
20
15
De
c
20
16
Ja
n
20
16
Fe
b
20
16
Ma
r
20
16
Ap
r
20
16
Ma
y
20
16
Ju
n
20
16
Ju
l
20
16
Au
g
20
16
Se
p
20
16
Oct
20
16
No
v
20
16
De
c
20
17
Ja
n
20
17
Fe
b
20
17
Ma
r
20
17
Ap
r
20
17
Ma
y
20
17
Ju
n
BA CZ RS LV ME AL LT PL UA
100
150
200
250
300
350
400
AT CZ DE DK ES FR HR IT LT LV PL PT SE SI AL BA CH ME RS UA
Highest
Average
Lowest

2017 PELLET MARKET OVERVIEW AN
EXTRACT OF THE AEBIOM STATISTICAL REPORT
AEBIOM 65
Table 1.13 Estimation of bulk wood pellet prices between September 2016 and June 2017 (with: delivered 6t, distance
100 km, delivery fees included. In €/t VAT incl.)
2016
September
2016
October
2016
November
2016
December
2017
January
2017
February
2017
March
2017
April
2017
May
2017
June
AT 229 230 231 234 236 245 246 236 232 232
CZ 212 218 230 232 232 234 225 220 DE 224 226 230 235 242 253 255 246 234 232
DK 240 240 240 240 240 240
ES 250 239 239 239 247 247 247 243 243 243
FR 254 267 267 267 272 272 272 HR 260 270 280 280 270 260 260 240 240 230
IT 288 288 307 307 307 293 293 293 LT 136 145 137 146 149 147 150 148 150 141
LV 170 175 185 195 210 205 200 190 180 180
PL 140 140 142 145 145 150 150 145 145
PT 175 175 175 175 175 166
SE 290 290 290 288 279 279 279
SI 235 235 235 Other Europe
AL 170 180 185 190 190 185 183 183 172 172
BA 204 208 216 235 280 270 230 220 210 210
CH 327 327 327 334 340 355 337 337
ME 175 180 190 196 RS 188 195 195 195 225 235 220 200 194 194
UA 72 72 74 76 78 77 75 0 0 0
Source: EPC survey,2017
Limitation of liability: Under no circumstance shall EPC and its contributors be liable for the exactitude or the use made
of the price information available in this section.

2017 PELLET MARKET OVERVIEW AN
EXTRACT OF THE AEBIOM STATISTICAL REPORT
AEBIOM 66
Some countries are implementing a reduced VAT rate for pellets (orange font in the table below) but the situation has
changed lately for some of them.
Austria: In January 2016, the VAT was increased from 10 % to 13% in 2016. The pellets price did not increase
correspondingly, showing that most of the increase was absorbed by the producers and traders.
France: The VAT rate on pellets has gradually increased from 5,5 % before 2012 to 10% in 2014. No clear impact of sales
has been noted and no further VAT increase is foreseen.
Italy: The VAT rate increased from 10 to 22 % in the second semester of 2014. This change showed a limited impact on
end-user behaviour but had an impact on the pellet suppliers’ profitability as most of the price increase was absorbed
by the pellet producers and traders. In 2016, the sector attempted to reduce the VAT back to 10% but this was rejected
by the government.
Latvia: In Latvia there is reverse VAT applied for B2B pellet trade to avoid any shadow economy while the VAT rate is of
12% for any B2C trade.
Table 1.14 VAT rate for wood pellets compared with general VAT rate applied in European countries in 2016 in
percentage
2016
Wood pellets General
AT 13 20
BE 6 21
CZ 15 21
DE 7 19
DK 25 25
EE 20 20
EL 24 24
ES 21 21
FI 24 24
FR 10 20
HR 25 25
HU 27 27
IT 22 22
LT 21 21
LU 6 15
LV 12 21
NL 21 21
PL 23 23
PT 23 23
RO na na
SE 25 25
SI 22 22
UK 5 20
Other
Europe
AL 20 20
BA 17 17
CH 8 8
ME 19 19
RS 20 20
Source: EPC survey, 2017

2017 PELLET MARKET OVERVIEW AN
EXTRACT OF THE AEBIOM STATISTICAL REPORT
AEBIOM 67
1.2.6.2 PRICE DEVELOPMENT OF INDUSTRIAL PELLETS
Source: Argus Media
The Argus cif ARA spot wood pellet price started to climb in February after more
than two years of near-continuous decline.
Weak demand, delays to planned projects, fluctuating political support and low
prices for competing generation fuels had all weighed on wood pellet prices
through much of 2015 and 2016. A strong US dollar to the Euro and increasing
trans-Atlantic freight costs had added extra pressure for US producers delivering
to the ARA region last year.
But new demand projects have come online, including Dong’s two Danish CHP
conversions in late 2016, while a cold winter compared to recent years boosted
heating demand. The UK’s Drax began trialling pellets at its fourth unit in March,
although it will revert to coal-burn in winter 2017-2018. The stronger European
demand has supported industrial wood pellet prices and Argus’ cif ARA spot price
rose by 29pc over the first eight months of this year.
Biomass consumption in Asia is also expanding, particularly in leading market
South Korea and swiftly-growing Japan. Growth in both countries is supported by
government policies. As biomass producers in North America — especially Canada
— increasingly look to supply Asian buyers, the global wood pellet market is slowly
becoming more integrated, with the potential for competition between buyers in
Europe and Asia a possibility.
Forward cif ARA prices have also climbed since the start of the year as major new
projects are expected to start up in the UK and the Netherlands later this year,
supporting 2018 demand, with further projects in both countries planned in the
next three years.
Laura Tovey Fall
Editor Biomass Markets
Argus Media
Figure 1.51 Development of Argus cif ARA wood pellet index (Nov 2015- August 2017)

2017 PELLET MARKET OVERVIEW AN
EXTRACT OF THE AEBIOM STATISTICAL REPORT
AEBIOM 68
1.3 LATEST DEVELOPMENTS OF ENPLUS® CERTIFICATION
Figure 1.52 Worldwide ENplus certified producers
The ENplus® certification scheme ensures wood pellet quality for the customer by guaranteeing the quality of the pellets
over the entire supply chain (i.e. producers and traders). This certification is governed and managed by the European
Pellet Council with the support of National Associations, managing the certification on a national level.
Since its introduction, the number of countries with certified ENplus® producers has rapidly grown, reaching 42 countries
with a total volume of 9,2 million tonnes of certified pellets produced according to the 2017 projections. According to
the latest figures, there are several encouraging predictions for 2018. Continued growth is expected as in previous years
and could be supported by a significant growth of ENplus® certified producers in countries such as Bulgaria, Belarus,
Croatia, Poland and Russia.
The number of ENplus® certified producers worldwide once again a sizeable growth, now reaching 411 producers.
As a result of this continuous growth, the production of certified pellets is now estimated to reach more than 9 million
tonnes by the end of 2017. This would result in a growth of approximately 13% compared to 2016.
With these results, ENplus® is well on its way to reaching the aim of harmonised pellet quality at a global level.

2017 PELLET MARKET OVERVIEW AN
EXTRACT OF THE AEBIOM STATISTICAL REPORT
AEBIOM 69
Figure 1.53 Worldwide ENplus certified pellet production
With more than 8,1 million tonnes of production certified in 2016, ENplus® covered around 70 % of the pellets being
used in the European heating pellet sector (residential + commercial).
Figure 1.54 Estimate of pellet quality classes produced per country in Europe (%)
Source: EPC survey, 2017
0%
10%
20%
30%
40%
50%
60%
70%
80%
90%
100%
AT CZ DE ES FR LV PT SE BA RS RU
A1 quality pellets (tonnes) A2 quality pellets (tonnes) B quality pellets (tonnes) out of B quality (tonnes)
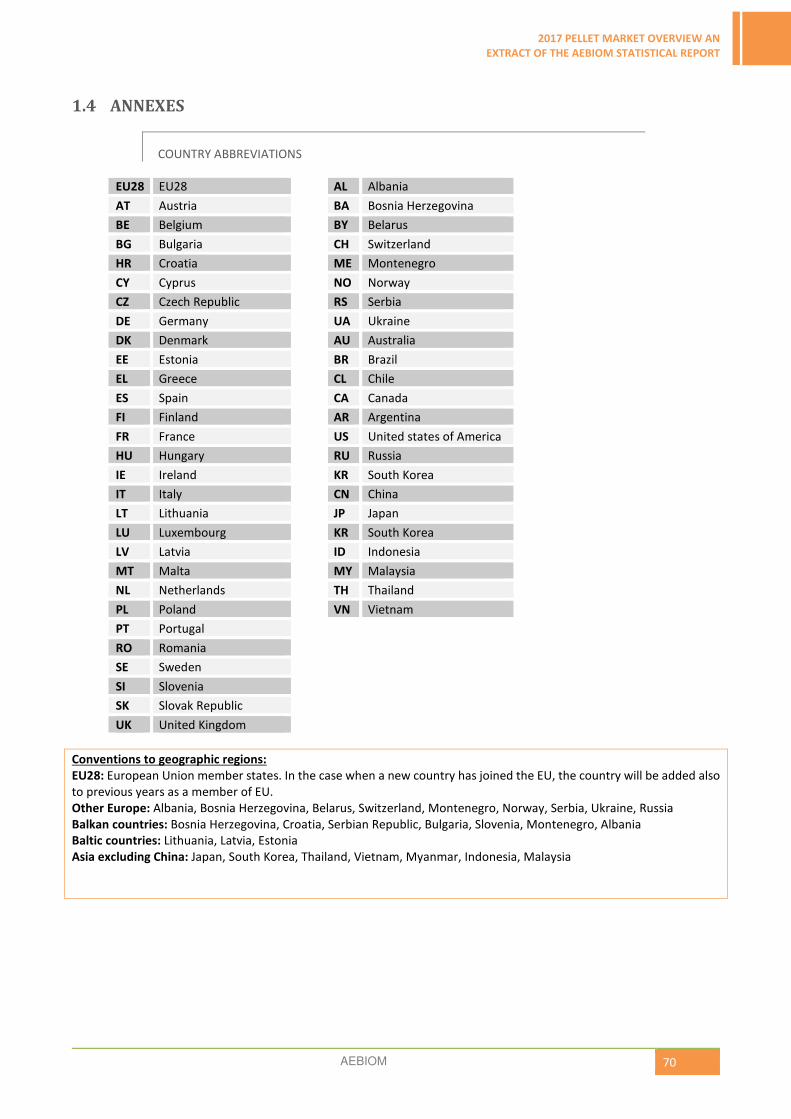
2017 PELLET MARKET OVERVIEW AN
EXTRACT OF THE AEBIOM STATISTICAL REPORT
AEBIOM 70
1.4 ANNEXES
COUNTRY ABBREVIATIONS
EU28 EU28 AL Albania
AT Austria BA Bosnia Herzegovina
BE Belgium BY Belarus
BG Bulgaria CH Switzerland
HR Croatia ME Montenegro
CY Cyprus NO Norway
CZ Czech Republic RS Serbia
DE Germany UA Ukraine
DK Denmark AU Australia
EE Estonia BR Brazil
EL Greece CL Chile
ES Spain CA Canada
FI Finland AR Argentina
FR France US United states of America
HU Hungary RU Russia
IE Ireland KR South Korea
IT Italy CN China
LT Lithuania JP Japan
LU Luxembourg KR South Korea
LV Latvia ID Indonesia
MT Malta MY Malaysia
NL Netherlands TH Thailand
PL Poland VN Vietnam
PT Portugal
RO Romania
SE Sweden
SI Slovenia
SK Slovak Republic
UK United Kingdom
Conventions to geographic regions:
EU28: European Union member states. In the case when a new country has joined the EU, the country will be added also
to previous years as a member of EU.
Other Europe: Albania, Bosnia Herzegovina, Belarus, Switzerland, Montenegro, Norway, Serbia, Ukraine, Russia
Balkan countries: Bosnia Herzegovina, Croatia, Serbian Republic, Bulgaria, Slovenia, Montenegro, Albania
Baltic countries: Lithuania, Latvia, Estonia
Asia excluding China: Japan, South Korea, Thailand, Vietnam, Myanmar, Indonesia, Malaysia

2017 PELLET MARKET OVERVIEW AN
EXTRACT OF THE AEBIOM STATISTICAL REPORT
AEBIOM 71
SYMBOLS AND ABBREVIATIONS AND DECIMAL PREFIXES
Symbol Meaning
, Decimal separator
. Thousand
- / na Data not available

2017 PELLET MARKET OVERVIEW AN
EXTRACT OF THE AEBIOM STATISTICAL REPORT
AEBIOM 72
GENERAL CONVERSION FACTORS FOR ENERGY
to
from
1 MJ 1kWh 1 kg oe Mcal
1 MJ 1 0.278 0.024 0.239
1 kWh 3.6 1 0.086 0.86
1 kg oe 41.868 11.63 1 10
1 Mcal 4.187 1.163 0.1 1
FUEL PROPERTIES OF SELECTED BIOMASS FUELS
Fuel
Net calorific
value,
dry content
kWh/kg
(moisture
content 0%)
(qp,net,d)
Moisture
content
w-%
(Mar)
Net calorific
value, as
received=act
ual value
kWh/kg
(qp,net,ar)
Bulk density
kg/loose m3
Energy
density
(MWh/loose
m3)
Ash content,
dry, %
Sawdust 5,28-5,33 45-60 0,60-2,77 250-350 0,45-0,70 0,4-0,5
Bark, birch 5,83-6,39 45-55 2,22-3,06 300-400 0,60-0,90 1-3
Bark, coniferous 5,14-5,56 50-65 1,38-2,50 250-350 0,50-0,70 1-3
Plywood chips 5,28-5,33 5-15 4,44-5,00 200-300 0,9-1,1 0,4-0,8
Wood pellets 5,26-5,42 7-8 4,60-4,90 550-650 2,6-3,3 0,2-0,5
Steam wood
chips
5,14-5,56 40-55 1,94-3,06 250-350 0,7-0,9 0,5-2,0
Lof wood (oven-
ready)
5,14-5,28 20-25 3,72-4,03 240-320 1,35-1,95
Logging residue
chips
5,14-5,56 50-60 1,67-2,50 250-400 0,7-0,9 1,0-3,0
Whole tree
chips
5,14-5,56 45-55 1,94-2,78 250-350 0,7-0,9 1,0-2,0
Reed canary
grass (spring
harvested)
4,78-5,17 8-20 3,70-4,70 70 0,3-0,4 1,0-10,0
Reed canary
grass (autumn
harvested)
4,64-4,92 20-30 3,06-3,81 80 0,2-0,3 5,1-7,1
Grain 4,8 11 4,30 600 2,6 2
Straw, chopped 4,83 12-20 3,80-4,20 80 0,3-0,4 5
Miscanthus,
chopped
5,0 8-20 3,86-4,06 110-140 1,72-2,19 2,0-3,5
Straw pellets 4,83 8-10 4,30-4,40 550-650 2,4-2,8 5
Olive cake (olive
pomace)
4,9-5,3 55-70 1,00-3,10 800-900 1,46-1,64 2-7
Olive cake (olive
marc)
4,9-5,3 <10 4,30-4,70 600-650 2,6-2,9 2-7
1kWh/kg = 1 MWh/ton = 3.6 GJ/ton
Source: EUBIONET “Biomass fuel supply chains for solid biofuels”
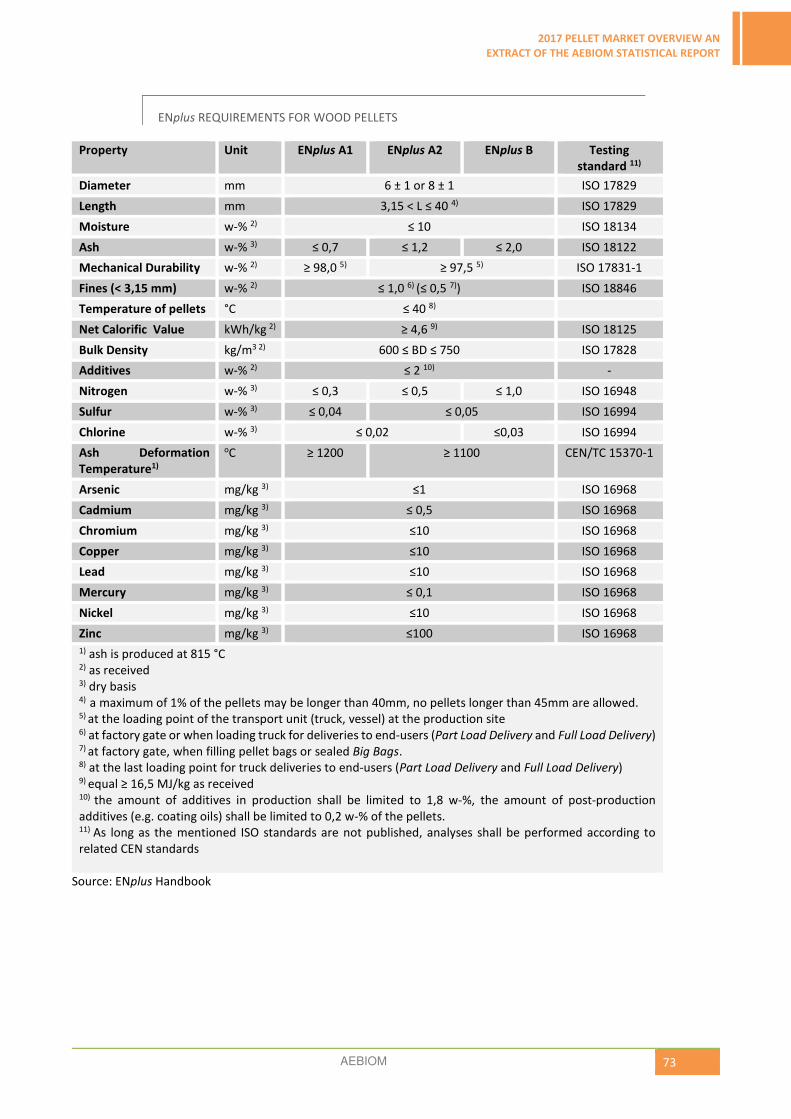
2017 PELLET MARKET OVERVIEW AN
EXTRACT OF THE AEBIOM STATISTICAL REPORT
AEBIOM 73
ENplus REQUIREMENTS FOR WOOD PELLETS
Property Unit ENplus A1 ENplus A2 ENplus B Testing
standard 11)
Diameter mm 6 ± 1 or 8 ± 1 ISO 17829
Length mm 3,15 < L ≤ 40 4) ISO 17829
Moisture w-% 2) ≤ 10 ISO 18134
Ash w-% 3) ≤ 0,7 ≤ 1,2 ≤ 2,0 ISO 18122
Mechanical Durability w-% 2) ≥ 98,0 5) ≥ 97,5 5) ISO 17831-1
Fines (< 3,15 mm) w-% 2) ≤ 1,0 6) (≤ 0,5 7)) ISO 18846
Temperature of pellets °C ≤ 40 8)
Net Calorific Value kWh/kg 2) ≥ 4,6 9) ISO 18125
Bulk Density kg/m3 2) 600 ≤ BD ≤ 750 ISO 17828
Additives w-% 2) ≤ 2 10) -
Nitrogen w-% 3) ≤ 0,3 ≤ 0,5 ≤ 1,0 ISO 16948
Sulfur w-% 3) ≤ 0,04 ≤ 0,05 ISO 16994
Chlorine w-% 3) ≤ 0,02 ≤0,03 ISO 16994
Ash Deformation
Temperature1)
oC ≥ 1200 ≥ 1100 CEN/TC 15370-1
Arsenic mg/kg 3) ≤1 ISO 16968
Cadmium mg/kg 3) ≤ 0,5 ISO 16968
Chromium mg/kg 3) ≤10 ISO 16968
Copper mg/kg 3) ≤10 ISO 16968
Lead mg/kg 3) ≤10 ISO 16968
Mercury mg/kg 3) ≤ 0,1 ISO 16968
Nickel mg/kg 3) ≤10 ISO 16968
Zinc mg/kg 3) ≤100 ISO 16968
1) ash is produced at 815 °C 2) as received 3) dry basis 4) a maximum of 1% of the pellets may be longer than 40mm, no pellets longer than 45mm are allowed. 5) at the loading point of the transport unit (truck, vessel) at the production site 6) at factory gate or when loading truck for deliveries to end-users (Part Load Delivery and Full Load Delivery) 7) at factory gate, when filling pellet bags or sealed Big Bags. 8) at the last loading point for truck deliveries to end-users (Part Load Delivery and Full Load Delivery) 9) equal ≥ 16,5 MJ/kg as received 10) the amount of additives in production shall be limited to 1,8 w-%, the amount of post-production
additives (e.g. coating oils) shall be limited to 0,2 w-% of the pellets. 11) As long as the mentioned ISO standards are not published, analyses shall be performed according to
related CEN standards
Source: ENplus Handbook

2017 PELLET MARKET OVERVIEW AN
EXTRACT OF THE AEBIOM STATISTICAL REPORT
AEBIOM 74
GLOSSARY
CHP heat pellets
consumption/use
Volume of pellets used for the heat production within a combined heat and power appliance (CHP)
corresponding to 2/3 of the total volume of pellets used in the CHP.
CHP electricity
pellets
consumption/use
Volume of pellets used for electricity production within a combined heat and power appliance (CHP)
corresponding to 1/3 of the total volume of pellets used in the CHP.
Commercial heating
pellets
consumption/use
Volume of pellets used in dedicated heat boilers with a capacity greater than 50 kW. This class
includes dedicated heat boilers used in residential buildings, public buildings, services, industry and
excludes combined heat and power appliances (CHP).
Dedicated power
pellets
consumption/use
Volume of pellets used for electricity production in a plant only producing electricity without
recovering the heat generated during the process.
Pellet consumption
for electricity
production
Without a specific note this corresponds to the total volume of pellets used in dedicated power
plants and 1/3 of the total volume of pellets used in combined heat and power plants (CHP)
Pellet consumption
for heat production
Without a specific note this corresponds to the volume of pellets used for residential heating,
commercial heating and 2/3 of the total volume of pellets used in combined heat and power plants
(CHP)
Residential heating
pellets
consumption/use
Volume of pellets used in domestic’s stoves and dedicated heat boilers with a capacity below 50 kW

2017 PELLET MARKET OVERVIEW AN
EXTRACT OF THE AEBIOM STATISTICAL REPORT
AEBIOM 75
LIST OF FIGURES
Figure 1.1 World pellet production overview 2000.2016 (million tonnes) ............................................................................ 8 Figure 1.2 World wood pellet production shares in 2016 (%) ............................................................................................... 9 Figure 1.3 World pellet map and trade flow (in 2016, million tonnes) ............................................................................... 11 Figure 1.4 World wood pellet demand in 2016. power, CHP and heat (million tonnes) ..................................................... 12 Figure 1.5 Distribution of world wood pellet consumption in 2016 (%) .............................................................................. 12 Figure 1.6 Top 10 wood pellet consuming countries by end-use in 2016 (million tonnes) ................................................. 13 Figure 1.7 Map of European wood pellet production in 2016 ............................................................................................ 16 Figure 1.8 Trend of wood pellet production in 2010.2016 for the 10 largest producers of EU28 (million tonnes) ............. 17 Figure 1.9 Trend of wood pellet production in 2010.2016 for the top 11.20 producers of EU28 (million tonnes) .............. 19 Figure 1.10 Trend of wood pellet production in 2010.2016 for the Baltics countries (million tonnes) ............................... 21 Figure 1.11 Trend of wood pellet production in 2010.2016 for the Balkan countries (million tonnes) ............................... 22 Figure 1.12 Estimate of the shares of raw materials used in local pellet production per European country (%) ............... 23 Figure 1.13 Estimate of the shares of hard wood and soft wood in local pellet production in Europe (%) ........................ 24 Figure 1.14 Estimate of European wood pellet producers’ main markets by end-use in 2016 (percentage) ..................... 26 Figure 1.15 Evolution of European wood pellet producers’ perception of the main difficulties 2013-2016 (%) ................. 27 Figure 1.16 European wood pellet producers’ perception of the main difficulties in 2016 (%) .......................................... 28 Figure 1.17 European pellet production by raw material in 2016 (%) ................................................................................ 29 Figure 1.18 Evolution of the production of non-wood pellets in Europe (in million tonnes) ............................................... 29 Figure 1.19 Map of wood pellet consumption in Europe in 2016 ....................................................................................... 30 Figure 1.20 Map of wood pellet consumption for heating in Europe in 2016 ..................................................................... 31 Figure 1.21 Evolution of EU wood pellet consumption for domestic and commercial heating excluding CHP (million tonnes)
............................................................................................................................................................................................ 32 Figure 1.22 Evolution of domestic (<50kW) EU wood pellet consumption in EU (million tonnes) ...................................... 32 Figure 1.23 Evolution of commercial (>50kW) EU wood pellet consumption in 2016 (million tonnes) .............................. 33 Figure 1.24 EU28 pellet consumption in heat production (excluding CHP) in 2016 (million tonnes) .................................. 33 Figure 1.25 Evolution of wood pellet consumption for residential and commercial heating (excluding CHP) in the 10 highest
consuming EU countries in 2014.2016 (million tonnes) ...................................................................................................... 34 Figure 1.26 Estimate of pellet quality class shares for residential heat market per European country (%) ....................... 36 Figure 1.27 Estimate of pellet quality class shares for commercial heat market per European country (%) ...................... 36 Figure 1.28 Forms of delivery used in the residential heat market in Europe (%) ............................................................... 37 Figure 1.29 Evolution of total amount of installed pellet stoves (thousand units) in 2013.2016 in selected countries ...... 39 Figure 1.30 Evolution of installed pellet stoves (thousand units) in 2003.2016 in some European countries with Italy in
secondary axis ..................................................................................................................................................................... 40 Figure 1.31 Annual sales (2014.2016) of pellet stoves in selected countries (thousand units) ........................................... 40 Figure 1.32 Evolution of total amount of installed residential pellet boilers (<50kW) in 2014.2016 (thousand units) in
selected countries ............................................................................................................................................................... 42 Figure 1.33 Evolution (2003.2016) of installed residential pellet boilers (<50kW) (thousand units) in European countries
............................................................................................................................................................................................ 42 Figure 1.34 Annual sales (2014.2016) of residential pellet boilers (<50kW) in selected countries (thousand units) .......... 43 Figure 1.35 Evolution of total amount of installed commercial pellet boilers (>50kW) in 2014.2016 (thousand units) in top
5 countries .......................................................................................................................................................................... 45 Figure 1.36 Evolution (2003.2016) of installed commercial scale pellet boilers (>50kW) (thousand units) in European
countries ............................................................................................................................................................................. 46 Figure 1.37 Top 5 countries with highest sales in commercial scale pellet boilers (>50kW) in 2014.2016 (thousand units)
............................................................................................................................................................................................ 46 Figure 1.38 Overview of pellet consumption for electricity production in Europe in 2016 ................................................. 50 Figure 1.39 European pellet consumption for electricity production in 2016 (million tonnes) ........................................... 50 Figure 1.40 EU28 Member States pellet balance by country in 2015 - production, consumption, export, import (million
tonnes) ................................................................................................................................................................................ 53 Figure 1.41 Top 10 of the EU28 wood pellet exporting countries 2011.2016 (million tonnes) ........................................... 54 Figure 1.42 Division of total EU28 exports in 2016 (percentage) ....................................................................................... 55 Figure 1.43 Top 10 of the EU28 wood pellet importing countries 2010.2015 (million tonnes)........................................... 57 Figure 1.44 Division of total EU28 imports (percentage) .................................................................................................... 58

2017 PELLET MARKET OVERVIEW AN
EXTRACT OF THE AEBIOM STATISTICAL REPORT
AEBIOM 76
Figure 1.45 Estimation of bagged wood pellet prices in most expensive European countries between September 2014 and
June 2017 (retail price, 1 pallet in €/t VAT incl.) ................................................................................................................. 60 Figure 1.46 Estimation of bagged wood pellet prices in European countries with lowest prices between September 2014
and June 2017 (with: retail price, 1 pallet in €/t VAT incl.) ................................................................................................. 61 Figure 1.47 Variation of bagged wood pellet prices between July 2016 and June 2017 (with: retail price, 1 pallet in €/t VAT
incl.) .................................................................................................................................................................................... 61 Figure 1.48 Estimation of bulk wood pellet prices in European countries with higher prices between September 2014 and
June 2017 (with: delivered 6t, distance 100 km, delivery fees included. In €/t VAT incl.) ................................................... 63 Figure 1.49 Estimation of bulk wood pellet prices in selected markets in European countries with lower prices between
September 2014 and June 2017 (with: delivered 6t, distance 100 km, delivery fees included. In €/t VAT incl.) ................ 64 Figure 1.50 Variation of bulk wood pellet prices between July 2016 and June 2017 (with: delivered 6t, distance 100 km,
delivery fees included. In €/t VAT incl.) ............................................................................................................................... 64 Figure 1.51 Development of Argus cif ARA wood pellet index (Nov 2015- August 2017) ................................................... 67 Figure 1.52 Worldwide ENplus certified producers ............................................................................................................. 68 Figure 1.53 Worldwide ENplus certified pellet production ................................................................................................. 69 Figure 1.54 Estimate of pellet quality classes produced per country in Europe (%) ............................................................ 69
LIST OF TABLES
Table 1.1 Evolution of world wood pellet actual production in 2013.2016 (tonnes) ............................................................ 9 Table 1.2 World wood pellet production (detailed) in 2015 and 2016 ............................................................................... 10 Table 1.3 Evolution of wood pellet consumption in different continents 2013-2016 (tonnes) ........................................... 13 Table 1.4 World wood pellet consumption (detailed) in 2015 and 2016 ............................................................................ 14 Table 1.5 European wood pellet production in 2016 compared to 2015 ............................................................................ 25 Table 1.6 European wood pellet consumption for heating in 2016 compared to 2015 (tonnes) ........................................ 38 Table 1.7 Annual sales of boilers and stoves in Europe (units) ........................................................................................... 48 Table 1.8 Total installed pellet boilers and stoves in Europe (units) ................................................................................... 49 Table 1.9 Total European wood pellet consumption in 2016 compared to 2015 (tonnes) ................................................. 52 Table 1.10 Top 10 wood pellet exporting countries in the EU28 in 2011.2015 (tonnes) .................................................... 56 Table 1.11 Top 10 wood pellet importing countries in the EU28 with breakdown of origin in 2010.2015 (tonnes) ........... 59 Table 1.12 Estimation of bagged wood pellet prices between September 2016 and July 2017 in Europe (with: retail price,
1 pallet in €/t VAT incl.) ...................................................................................................................................................... 62 Table 1.13 Estimation of bulk wood pellet prices between September 2016 and June 2017 (with: delivered 6t, distance 100
km, delivery fees included. In €/t VAT incl.) ........................................................................................................................ 65 Table 1.14 VAT rate for wood pellets compared with general VAT rate applied in European countries in 2016 in percentage
............................................................................................................................................................................................ 66
European Biomass Association Place du Champ de Mars 21050 BrusselsT : +32 2 318 40 [email protected] www.aebiom.org
www.aebiom.org
Africa-EU Renewable Energy Cooperation Programme
The Africa-EU Renewable Energy Cooperation Programme (RECP) is a multi-donor programme that supports the development of markets for renewable energy in Africa. It was launched by more than 35 African and European Ministers and Commissioners under the Africa-EU Energy Partnership (AEEP).>>> www.africa-eu-renewables.org
STUV Based in Bois-de-Villers, in the Namur province (Belgium), Stûv designs, produces and markets individual wood, gas and pellet heating solutions. Our stoves, fires, inserts and fireplaces are designed with incredible care, offering customer satisfaction in terms of energy performance, enjoyment and durability.>>> www.stuv.com
BioCurveBioCurve is a biomass boiler manufacturer, leading the design of condensing boilers.Its pio-neering portfolio includes pellet condensing boilers from 25 kW to 150 kW, with efficiencies up to 105,7% and emissions well below the strictest limits.The quality of the most powerful boilers of its kind has been endorsed by twelve international awards and satisfied clients in six countries. BioCurve has recently received the Expobiomasa 2017 Innovation Award for the first woodchip condensing boiler without need of heat recovers, which will be available from 2018. >>> www.biocurve-heating.com
Biomasa PartnerBiomasa Partner Group is a leading and preferred manufacturer supplying annually 80 000 tons of certified wooden pellet and briquette. All of the products are made from the highest quality saw dust and wood chips supplied by our biomass department. We deliver annually 150 000 tons of saw dust together with paper, saw mill and forest wooden chips. Our organization guar-antees the highest quality products and services to all of our partners. Additionally our logistics and forwarding departments provide deliveries by trucks, trains, sea containers and ships all over Europe. >>> www.biomasapartner.pl
Scandbio
Scandbio is Sweden’s largest company within solid processed wood fuels. We sell 100 % renew-able energy in the form of pellets, briquettes, logs and powder.>>> www.scandbio.com
Badger Pellets - François Group
BADGER Pellets are wood fuel pellets formed from sawdust from wood sawing in our regions. The sawdust, without bark, is made into pellets in this form through the combined action of high pressure and lignin, a natural constituent of wood which gives a gloss on the surface of our pellets. BADGER Pellets, no glue or chemical additive is used. It is a 100% natural fuel! They are produced on totally integrated bio-sites in Virton (Recybois) and Thimister (Woodenergy) in Belgium and in Bissen (KIOWATT – www.kiowatt.lu) in Luxembourg. They are real centres of excellence in circular economy. In fact, at BADGER Pellets, nothing is wasted. Wood is used in all its forms with the aim of giving it maximum value at each stage.
>>> www.badgerpellets.com
Thanks to our sponsors: