pemex audited financial results report as of december 31,...
TRANSCRIPT
Investor Relations
(5255) 1944 9700 [email protected]
May 4, 2005
PEMEX audited financial results report as of December 31, 2004
Financial highlights
PEMEX, Mexico’s oil and gas company and the world’s ninth largest integrated oil and gas company1, announced its audited consolidated financial results for the twelve months ending December 31, 2004.
Total sales increased 18%, compared to 2003, reaching Ps. 773.6 billion (US$68.7 billion)2
Crude oil exports averaged 1,870 thousand barrels per day (Mbd), up 1% from 2003
Income before taxes and duties increased 29%, to Ps. 459.3 billion (US$40.8 billion)
Net loss for 2004 decreased Ps. 17.3 billion compared to 2003, resulting in a net loss of Ps. 25.5 billion (US$2.7 billion)
Table 1
Petróleos Mexicanos, Subsidiary Entities and Subsidiary CompaniesFinancial results summary
Twelve months ending December 31, 2003 2004 Change 2004
(Ps. mm) (US$mm)Total sales 657,893 773,587 18% 115,694 68,673
Domestic sales(1) 407,337 449,013 10% 41,675 39,860 Exports 250,556 324,574 30% 74,018 28,813
-
357,423 459,308 29% 101,885 40,774 -
Taxes and duties 402,294 474,334 18% 72,040 42,108 -
Net income (loss) (42,754) (25,496) -40% 17,258 (2,263) -
EBITDA(2) 374,411 506,603 35% 132,192 44,972 EBITDA / Interest expense(3) 15.2 15.9
*Audited consolidated financial statements prepared in accordance with Mexican Generally Accepted Accounting Principles (MEXGAAP) issued by the Instituto Mexicano de Contadores Públicos. Inflation recognition is also in accordance with MEXGAAP. Accordingly, peso figures are presented in constant Mexican pesos as of December 31, 2004.
Note: Numbers may not total due to rounding.
(1) Includes the Special Tax on Production and Services (IEPS). As of December 31, 2003 this figure was Ps. 98,960 million and as of December 31, 2004, Ps. 54,705 million.
Income before taxes and duties(1)
(2) Excludes IEPS.(3) Excludes capitalized interest.
1 Petroleum Intelligence Weekly Ranking, December 2004. 2 Amounts in US dollars are translated at the December 31, 2004 exchange rate of Ps. 11.2648 per US dollar.
PEMEX Investor Relations
PEMEX financial results report as of December 31, 2004 2/37 www.pemex.com
Operational highlights
Total liquid hydrocarbons production in 2004 totaled 3,825 Mbd, 1% greater than the production of 2003:
Crude oil production increased 12 Mbd, to 3,383 Mbd Natural gas production rose 2% to 4,573 million cubic feet per day (MMcfd)
Natural gas liquids production increased 6% to 442 Mbd In 2004, gas flaring represented 3.3% of total natural gas production
Operating items Exploration and production Production levels
In 2004, crude oil and natural gas productions totaled 3,383 Mbd and 4,573 MMcfd, respectively. Heavy crude oil represented 73% of total crude oil production and non-associated natural gas was 34% of total natural gas production. During the fourth quarter of 2004, crude oil production decreased 2%, because of adverse weather conditions. On the other hand, non-associated natural gas production increased 12% while total natural gas production grew 1%.
Gas flaring In 2004, gas flaring represented 3.3% of total natural gas production,
compared to 5.6% in 2003. During the fourth quarter of 2004, gas flaring was 2.9% of total natural gas production, compared to 5.9% in the same period of 2003. This decrease was an effect of the start-up of the offshore gas treatment facility within the Akal-C complex in Cantarell.
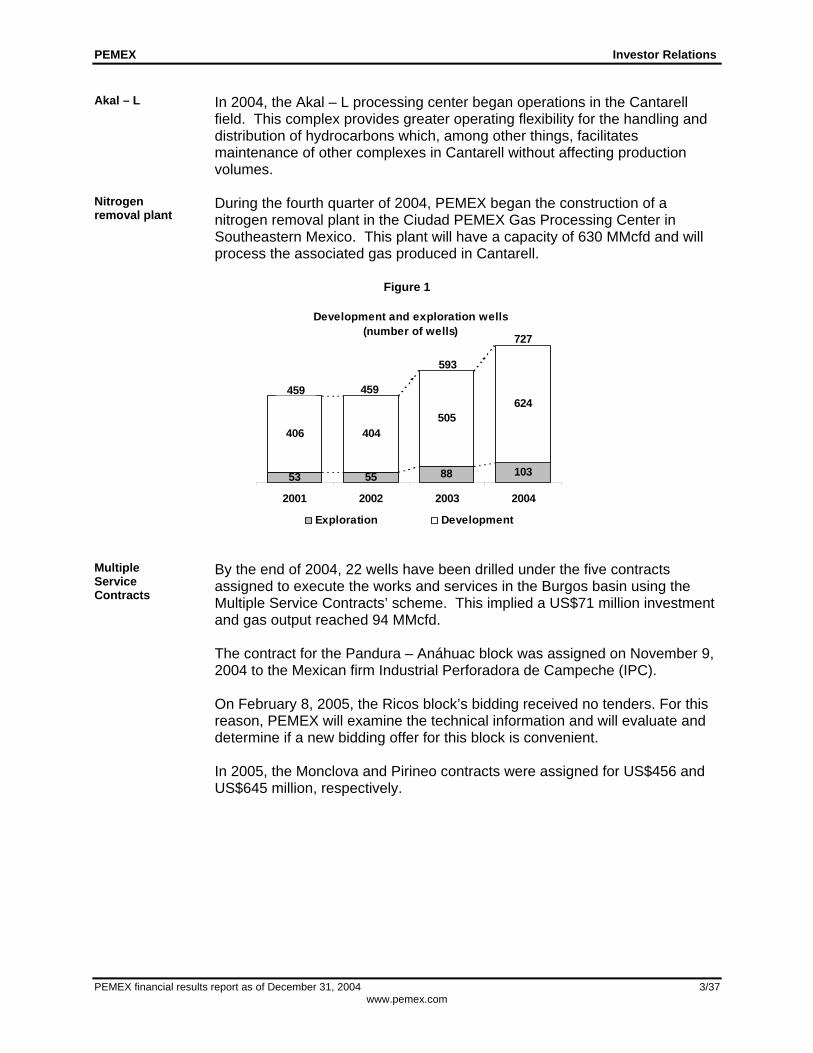
Drilling activity In 2004, exploration drilling activity rose 17% year on year from 88 exploratory
wells to 103. Development drilling activity rose 24%, from 505 development wells to 624 (see figure 1). During the fourth quarter of 2004, exploratory and development drilling activity diminished 7% and 1%, respectively, relative to the same quarter of 2003. In 2004, PEMEX completed successfully the exploratory well Nab-1, at a water depth of 681 meters. This is the deepest marine well drilled by PEMEX. The reserves associated to this finding are in the process of evaluation and, therefore, they still do not modify the reserves volume of Mexico.
PEMEX Investor Relations
PEMEX financial results report as of December 31, 2004 3/37 www.pemex.com
Akal – L In 2004, the Akal – L processing center began operations in the Cantarell
field. This complex provides greater operating flexibility for the handling and distribution of hydrocarbons which, among other things, facilitates maintenance of other complexes in Cantarell without affecting production volumes.
Nitrogen removal plant
During the fourth quarter of 2004, PEMEX began the construction of a nitrogen removal plant in the Ciudad PEMEX Gas Processing Center in Southeastern Mexico. This plant will have a capacity of 630 MMcfd and will process the associated gas produced in Cantarell.
Figure 1
Development and exploration wells (number of wells)
55 88 103
406 404505
624
53
2001 2002 2003 2004
Exploration Development
459 459
727
593
Multiple Service Contracts
By the end of 2004, 22 wells have been drilled under the five contracts assigned to execute the works and services in the Burgos basin using the Multiple Service Contracts’ scheme. This implied a US$71 million investment and gas output reached 94 MMcfd. The contract for the Pandura – Anáhuac block was assigned on November 9, 2004 to the Mexican firm Industrial Perforadora de Campeche (IPC). On February 8, 2005, the Ricos block’s bidding received no tenders. For this reason, PEMEX will examine the technical information and will evaluate and determine if a new bidding offer for this block is convenient. In 2005, the Monclova and Pirineo contracts were assigned for US$456 and US$645 million, respectively.
PEMEX Investor Relations
PEMEX financial results report as of December 31, 2004 4/37 www.pemex.com
Table 2
Bloque Reynosa-Monterrey Cuervito Misión Fronterizo Olmos Pandura-
Anáhuac Monclova Pirineo Total
Contract signed 14-Nov-03 21-Nov-03 28-Nov-03 8-Dec-03 9-Feb-04 9-Nov-04 -- --
Expected production(2) 222 36 91 34 42 110 50 70 655
Total expected investment(1) 2,437 260 1,036 265 344 900 456 645 6,343
Investment 2004(1) 44 7 13 7 -- -- -- 71
Multiple Service Contracts
IPC
Hullera Mexicana,Energy Milenium,
Andrews Technologies de
México,Yuma E&P Inc.,
Aries Operating LP
PetrobrasDiavazTeikoku
Constructora Industrial Monclova,
Materiales la Gloria,Alianz Petroleum,
Steel Serv,Suelopetrol,
NCT, Estudios y Proyectos,
Petrotesting Colombia
(1) Millions of USD(2) Million cubic feet daily
Lewis EnergyWinning bidder(s) Repsol
PetrobrasDiavazTeikoku
TecpetrolIPC
Techint
Gas and basic petrochemicals
Gas processing
In 2004, given the greater supply of wet natural gas and condensates for processing, the production of dry gas from the processing plants increased 4% compared to the production registered in 2003, averaging 3,144 MMcfd. Likewise, gas liquids production, including condensates, was 442 Mbd, 6% greater than that observed in 2003. During the fourth quarter of 2004, dry gas from processing plants and gas liquids productions increased 4% and 2%, respectively, relative to the fourth quarter of 2003.
Additional cryogenic plants
In 2004 PEMEX started operations of two modular cryogenic plants in the Burgos Gas Processing Center (GPC) in northern Mexico. Both plants have a processing capacity of 200 MMcfd of sweet wet gas and 6 Mbd of condensates. Additionally, in the third quarter of 2004, PEMEX signed a contract to build a third modular cryogenic plant and expects to sign a new contract, in the first half of 2005, to build a fourth plant. Both plants will be constructed at the GPC Burgos and will have the same processing capacity as the first two. At the end of 2004, PEMEX carried out the initial phase to build a liquefied petroleum gas (LPG) pipeline with a transport capacity up to 30 Mbd from the GPC Burgos to Monterrey.
PEMEX Investor Relations
PEMEX financial results report as of December 31, 2004 5/37 www.pemex.com
Refining
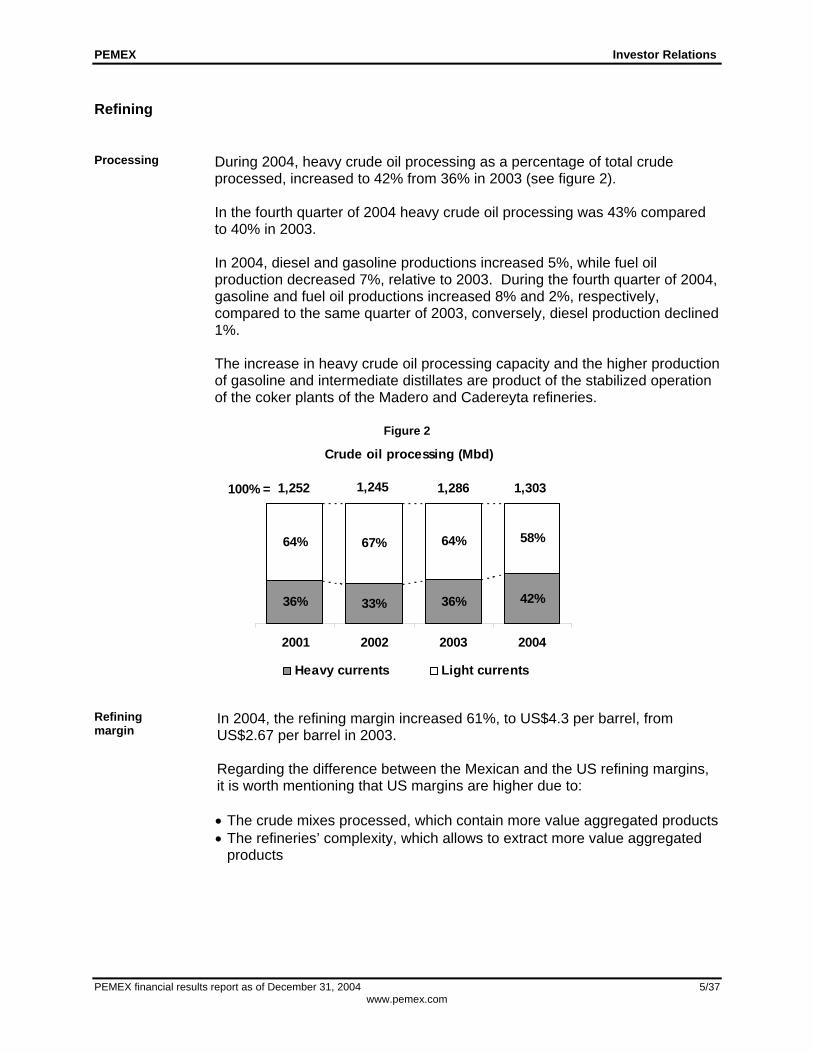
Processing During 2004, heavy crude oil processing as a percentage of total crude
processed, increased to 42% from 36% in 2003 (see figure 2). In the fourth quarter of 2004 heavy crude oil processing was 43% compared to 40% in 2003. In 2004, diesel and gasoline productions increased 5%, while fuel oil production decreased 7%, relative to 2003. During the fourth quarter of 2004, gasoline and fuel oil productions increased 8% and 2%, respectively, compared to the same quarter of 2003, conversely, diesel production declined 1%. The increase in heavy crude oil processing capacity and the higher production of gasoline and intermediate distillates are product of the stabilized operation of the coker plants of the Madero and Cadereyta refineries.
Figure 2
Crude oil processing (Mbd)
33% 36% 42%
64% 67% 64% 58%
36%
2001 2002 2003 2004
Heavy currents Light currents
100% = 1,286 1,3031,2451,252
Refining margin
In 2004, the refining margin increased 61%, to US$4.3 per barrel, from US$2.67 per barrel in 2003. Regarding the difference between the Mexican and the US refining margins, it is worth mentioning that US margins are higher due to: • The crude mixes processed, which contain more value aggregated products • The refineries’ complexity, which allows to extract more value aggregated
products
PEMEX Investor Relations
PEMEX financial results report as of December 31, 2004 6/37 www.pemex.com
Minatitlán The project for the reconfiguration of the Minatitlán refinery is divided into six
engineering, procurement and construction (EPC’s) packages. The first package (EPC-1) was awarded at the end of 2003, beginning the reconfiguration project. During the third quarter of 2004 two EPC packages were assigned, the EPC-2 which includes: • A utilities plant • A sour water treatment plant • Integration works, caustic waste and effluents treatment
and the EPC -3, which includes the construction of: • An atmospheric and vacuum distillation plant • An intermediate distillates hydro-treatment plant • A fluid catalytic cracker
Franchises The number of franchised gas stations rose 9% to 6,732 as of December 31,
2004, from 6,164 as of December 31, 2003.
Petrochemicals
Petrochemicals production
Total accumulated petrochemicals annual production for 2004 was 10,731 thousand tons (Mt), 4% higher than in 2003. This growth is partly attributed to the modernization and enlargement of the installed capacity at the petrochemical plant La Cangrejera. Specifically, ethylene production grew 3%, relative to 2003. During the fourth quarter of 2004, total accumulated petrochemicals production increased 6% compared to the same period of 2003, from 2,641 Mt to 2,809 Mt. Ethylene output totaled 243 Mt, i.e. a 2% year on year increase.
Subsidiary companies
On September 15, 2004, the Secretary of Energy was authorized to carry out the merger of the following subsidiary companies of PEMEX Petroquímica: • Petroquímica Camargo, S.A. de C.V. • Petroquímica La Cangrejera, S.A. de C.V. • Petroquímica Cosoleacaque, S.A. de C.V. • Petroquímica Escolín, S.A. de C.V. • Petroquímica Morelos, S.A. de C.V. • Petroquímica Pajaritos, S.A. de C.V. • Petroquímica Tula, S.A. de C.V. This merger is expected to be completed during 2005.

PEMEX Investor Relations
PEMEX financial results report as of December 31, 2004 7/37 www.pemex.com
Fénix Project On October 2004, PEMEX announced the names of its partners for the
execution of the Fénix Project: • Indelpro, S.A. de C.V. (affiliate of Alfa) • Grupo Idesa, S.A. de C.V. • Nova Chemicals Corporation The Fénix Project requires budgetary approvals and, therefore, it is still under discussion.
International trade3
Crude oil exports
In 2004, PEMEX’s crude oil exports averaged 1,870 Mbd, 1% higher than the volume registered in 2003. Approximately 87% of the total crude oil exports were heavy crude oil (Maya) and the rest was light and extra-light crude oil (Isthmus and Olmeca). 79% of the total crude oil exports were to the United States, while the remaining 21% went to Europe (10%), the Far East (2%), and the rest of America (9%). The 2004 annual weighted average export price of the Mexican crude oil basket is US$31.02 per barrel, compared to US$24.78 per barrel in 2003. In the fourth quarter of 2004, crude oil exports averaged 1,968 Mbd, 4% higher than that registered in the same quarter of 2003. Approximately, 85% of these exports were heavy crude oil. The weighted average export price of the Mexican crude oil basket, during the fourth quarter of 2004, was US$33.32 per barrel, compared to US$25.03 per barrel in the same quarter of 2003.
3 Source: PMI.
PEMEX Investor Relations
PEMEX financial results report as of December 31, 2004 8/37 www.pemex.com
Refined products and petrochemicals
Refined products exports in 2004, averaged 152 Mbd, 15% less than those in 2003. This was due to a decrease in the exports of fuel oil, asphalt and jet fuel. Petrochemical exports increased 10% on a yearly basis, totaling 916 Mt. Refined products imports increased 8%, to 310 Mbd in 2004 from 287 Mbd in 2003 as a result of a higher regular gasoline demand in urban areas. Petrochemicals imports decreased 48%, to 277 Mt, as a consequence of imports substitution by a larger domestic production. Natural gas imports increased 1% to 766 MMcfd in 2004 from 757 MMcfd in 2003. During the fourth quarter of 2004, refined products exports averaged 136 Mbd, 27% below the exports registered in the same period of 2003. In the same quarter, petrochemicals exports declined 12%, to 223 Mt from 254 Mt in the fourth quarter of 2003. Also, during the fourth quarter of 2004, refined products imports increased 32%, to 392 Mbd from 297 Mbd in the same period of 2003. Meanwhile, petrochemicals imports decreased 10%, to 70 Mt from 78 Mt. Last quarter natural gas imports decreased 1%, to 801 MMcfd from 810 MMcfd, in the comparable period of 2003.
Financial results as of December 31, 2004
Total sales
Total sales Total sales (including the special tax on production and services, IEPS)
increased 18% in constant pesos to Ps. 773.6 billion (US$68.7 billion) for 2004, compared to Ps. 657.9 billion in 2003.

PEMEX Investor Relations
PEMEX financial results report as of December 31, 2004 9/37 www.pemex.com
Domestic sales
Total domestic sales (including IEPS) increased 10% to Ps. 449 billion (US$39.9 billion) during 2004, from Ps. 407.3 billion in 2003. Total domestic sales (excluding IEPS) increased 28% to Ps. 394.3 billion (US$35 billion) during 2004, from Ps. 308.4 billion in 2003: • Sales of refined products4, net of IEPS, grew 27% to Ps. 304.7 billion
(US$27.1 billion) from Ps. 239.4 billion. Refined products sales volume increased 2% to 1,718 Mbd, from 1,684 Mbd. The IEPS generated by these sales decreased 45% to Ps. 54.7 billion (US$4.9 billion) from Ps. 99 billion. Sales of refined products, including IEPS, increased 6% to Ps. 359.4 billion (US$31.9 billion) from Ps. 338.4 billion
• Natural gas sales rose 27% to Ps. 71.1 billion (US$6.3 billion) from Ps. 55.8 billion. Natural gas sales volume increased 5% to 2,757 MMcfd from 2,621 MMcfd. The average sales price of natural gas for 2004 was US$6.09 per million of British Thermal Unit, for 2003, average sales price was US$5.04 per MMBtu
• Petrochemical sales5 increased 40% to Ps. 18.4 billion (US$1.6 billion) from Ps. 13.2 billion. Petrochemicals sales volume grew 12% to 3,531 Mt from 3,144 Mt
Exports Export sales totaled Ps. 324.6 billion (US$28.8 billion), 30% higher than the
export sales registered in 2003 of Ps. 250.6 billion: • Crude oil and condensates export sales increased 30% to Ps. 294.9 billion
(US$26.2 billion) from Ps. 226.6 billion. Crude oil exports volume rose 1% to 1,870 Mbd from 1,844 Mbd
• Refined products export sales6 rose 21% to Ps. 27.1 billion (US$2.4 billion) from Ps. 22.4 billion. Refined products exports volume fell 15% to 152 Mbd from 179 Mbd. This reduction was due mainly to a decrease of 19 Mbd of fuel oil exports as a result of a lower fuel oil output
• Petrochemical products export sales7 increased 68% to Ps. 2.6 billion (US$0.2 billion) from Ps. 1.6 billion. Petrochemical products exports volume grew 10% to 916 Mt from 835 Mt
4 Mainly Magna Gasoline, Premium Gasoline, Pemex Diesel, industrial diesel, special marine diesel, heavy fuel oil, jet fuel, asphalts and liquefied petroleum gas. 5 Mainly raw material for carbon black, hexane, solvent, vinyl chloride, styrene, ethylene oxide, toluene, xylene, polyethylene, acrylonitrile, ammonia and monoethyleneglicol. 6 Mainly naphtas, long residue, asphalts, diesel, gasoline and jet fuel. 7 Mainly ammonia, ethylene, styrene, acrylonitrile, acetaldehyde, polyethylene, butadiene, vinyl chloride, toluene, benzene y monoethyleneglicol.
PEMEX Investor Relations
PEMEX financial results report as of December 31, 2004 10/37 www.pemex.com
Costs and operating expenses
Costs and expenses grew 17%
Costs and operating expenses increased 17% with respect to 2003, reaching Ps. 318.4 billion (US$28.3 billion).
Cost of sales Cost of sales increased 21%, or Ps. 46.2 billion (US$4.1 billion), to Ps. 264.1
billion (US$23.4 billion). The increase is composed of the following changes: • Ps. 16.9 billion (US$1.5 billion) increase in imports of products • Ps. 15.8 billion (US$1.4 billion) increase in operational maintenance • Ps. 14.6 billion (US$ 1.3 billion) in the cost of sales of the subsidiary
companies, mainly PMI • Ps. 2.9 billion (US$0.3 billion) increase in the cost of the reserve for
retirement payments, pensions and indemnities • Ps. 1.3 billion (US$0.1 billion) increase in products manufacturing
expenses • Ps. 1.2 billion (US$0.1 billion) resulting from an increase in operating
expenses • A favorable effect of Ps. 3.3 billion (US$0.3 billion) resulting from negative
variation in inventories • A favorable effect of Ps. 1.8 billion (US$0.2 billion) in depreciation and
amortization expenses • An offsetting favorable effect of Ps. 1.4 billion (US$0.1 billion) due to the
elimination of the specific oil-field exploration and depletion reserve, as a consequence of the implementation of the successful efforts method for the accounting of costs incurred in exploration, acquisition and development of oil and gas reserves
Transportation and distribution expenses
Transportation and distribution expenses increased 7% to Ps. 17.6 billion (US$1.6 billion) in 2004, from Ps. 16.4 billion in 2003.
Administrative expenses
Administrative expenses decreased 1% to Ps. 36.7 billion (US$3.3 billion) in 2004, from Ps. 37 billion in 2003.
Cost of the reserve for retirement payments
The cost of the reserve for retirement payments, pensions and indemnities increased 30% to Ps. 53 billion (US$4.7 billion) in 2004 from Ps. 41 billion in 2003. This cost is distributed among cost of sales, transportation and distribution expenses and administrative expenses. The growth in the cost of the reserve for retirement payments results not only from the natural evolution of the reserve but also from the incorporation of medical services into the reserve

PEMEX Investor Relations
PEMEX financial results report as of December 31, 2004 11/37 www.pemex.com
Operating income
Operating income
Operating income in 2004 totaled Ps. 455.2 billion (US$40.4 billion), 18% higher than the comparable figure for 2003 of Ps. 386.6 billion. Excluding IEPS, operating income grew 39%, that is Ps. 112.8 billion (US$10 billion), going from Ps. 287.7 billion in 2003 to Ps. 400.5 billion (US$35.6 billion) in 2004.
Comprehensive financing cost
Decrease of comprehensive financing cost
The comprehensive financing cost decreased 78% from a cost of Ps. 32.3 billion in 2003 to Ps. 7.1 billion (US$0.6 billion) in 2004 (see table 2). This variation from was caused by: • A increase of Ps. 5.5 billion in net interest • A decrease of Ps. 23.4 billion in foreign exchange loss • An increase of Ps. 7.5 billion in gains on monetary position
Net interest Net interest expense increased 31% to Ps. 23.1billion (US$2.1 billion) in
2004, from Ps. 17.6 billion in 2003. Interest expense increased Ps. 7.1 billion, while interest income increased Ps. 1.5 billion.
Foreign exchange loss
The foreign exchange loss totaled Ps. 3.5 billion (US$0.3 billion) in 2004 as compared to a foreign exchange loss of Ps. 26.8 billion in 2003. This decrease of Ps. 23.4 billion was primarily a consequence of a lower depreciation of the Mexican peso against the dollar. The depreciation of the Mexican peso against the US dollar from December 31, 2002 to December 30, 2003 was 9% (from Ps. 10.3125 to Ps. 11.236 per US$), while from December 31, 2003 to December 31, 2004 it was 0.3% (from Ps. 11.236 to Ps. 11.2648 per US$).
Monetary gain The monetary gain for 2004 was Ps. 19.6 billion (US$1.7 billion),
representing a 62% increase over the monetary gain during 2003. The Ps. 7.5 billion (US$0.7 billion) monetary gain increase is a consequence of a higher annual inflation observed in 2004 relative to 2003 (5.19% vs 3.98%).

PEMEX Investor Relations
PEMEX financial results report as of December 31, 2004 12/37 www.pemex.com
Table 3
Petróleos Mexicanos, Subsidiary Entities and Subsidiary Companies
Twelve months ending December 31, 2003 2004 Change 2004
(Ps. mm) (US$mm)Comprehensive financing cost 32,338 7,048 -78% (25,290) 626
Interest income (7,108) (8,641) 22% (1,533) (767) Interest expense 24,706 31,765 29% 7,058 2,820 Foreign exchange loss (gain) 26,830 3,471 -87% (23,360) 308 Monetary loss (gain) (12,091) (19,546) 62% (7,455) (1,735)
Note: Numbers may not total due to rounding.
Comprehensive financing cost
*Audited consolidated financial statements prepared in accordance with Mexican Generally Accepted Accounting Principles (MEXGAAP) issued by the Instituto Mexicano de Contadores Públicos. Inflation recognition is also in accordance with MEXGAAP. Accordingly, peso figures are presented in constant Mexican pesos as of December 31, 2004.
Other revenues
Other net revenues
During 2004, other net revenues increased 258% to Ps. 11.2 billion (US$1 billion). The corresponding figure for 2003 was of Ps. 3.1 billion. The Ps. 8 billion (US$0.7 billion) increase was mainly due to: • The capital gains from the investment in shares of Repsol YPF, S.A. (in
2003, most part of these shares were held in swaps on assets, the accounting registration was based on mark-to-market)
• Higher net income from the Deer Park refinery in which PEMEX has participation
• The Federal Government contribution to the Voluntary Retirement Fund
Income before taxes and duties
Income before taxes
Income before taxes and duties for 2004 was Ps. 459.3 billion (US$40.8 billion), 29% higher than the Ps. 357.4 billion observed in 2003. From 2003 to 2004, operating income increased Ps. 68.6 billion (US$6.1 billion), while income before taxes grew Ps. 101.9 billion (US$9 billion). The difference between these increments is due to: • A reduction of Ps. 25.3 billion (US$2.3 billion) in the comprehensive
financing cost • An increase of Ps. 8 billion (US$0.7 billion) in other net revenues
PEMEX Investor Relations
PEMEX financial results report as of December 31, 2004 13/37 www.pemex.com
Taxes and duties
18% increase Petróleos Mexicanos and its subsidiary entities pay taxes and duties
equivalent to 60.8% of total sales8. This includes the special tax on production and services (IEPS) that applies to gasoline. From 2003 to 2004 the taxes and duties paid increased 18%, from Ps. 402.3 billion to Ps. 473 billion (US$42.1 billion).
IEPS IEPS is paid by the end consumer of gasoline and PEMEX is an intermediary
between the Ministry of Finance (SHCP) and the end consumer. The Ministry of Finance determines the price of the gasoline. Recently, gasoline prices have remained nearly unchanged because its increments are tied to inflation. When PEMEX sells gasoline, it collects an rough calculation of its production cost, based on the assumption of an efficient refinery. The difference between the retail price and the cost that PEMEX collects is primarily IEPS. Therefore, given the retail price, when the crude price is high and so is the gasoline’s production cost, the IEPS decreases and when the crude price is low and so is the gasoline’s production cost, the IEPS increases. In 2003, the weighted average crude oil export price was US$24.78 per barrel. For 2004, this price was 25% higher, reaching US$31.02 per barrel. For 2004, IEPS totaled to Ps. 54.7 billion (US$4.9 billion) and for 2003, it totaled Ps. 99 billion (US$8.8 billion).
Duty for infrastructure
In 2004, the duty for exploration, gas, refining and petrochemicals infrastructure replaced the prior excess gains duty. Both duties are equal to 39.2% of the revenues from crude oil export sales in excess of a threshold crude oil price set by the Mexican Government. In 2004, the threshold price was US$20.00 per barrel, compared to US$18.35 per barrel in 2003. Until 2004, there was no difference between both duties. In 2004, the duty for exploration, gas, refining and petrochemicals infrastructure was reimbursed to PEMEX. The Income Law (Ley de Ingresos de la Federación9) for the fiscal year 2004 established that: “the proceeds from this duty… will be allocated to the investment in infrastructure in exploration, gas, refining and petrochemicals that Petróleos Mexicanos and its subsidiary entities perform.” In 2003, the excess gains duty paid by PEMEX was Ps. 19.7 billion (US$1.7 billion) and in 2004, the duty for infrastructure was Ps. 34.4 billion (US$3.1 billion).
8 PEMEX’s subsidiary companies that are located in México pay corporate income tax on the same basis as private sector companies in México. 9 Section XI “Aprovechamiento para Obras de Infraestructura en Materia de Exploración, Gas, Refinación y Petroquímica”, of Article 7, Chapter II “De las Obligaciones de Petróleos Mexicanos”.
PEMEX Investor Relations
PEMEX financial results report as of December 31, 2004 14/37 www.pemex.com
Reimbursement of the duty for infrastructure
PEMEX received the reimbursement of the duty for exploration, gas, refining and petrochemicals infrastructure (Ps. 33 billion) from the Ministry of Finance: • Ps. 12.5 billion received on September 30, 2004 • Ps. 8 billion received on December 15, 2004 • Ps. 12.5 billion received on December 31, 2004 The reimbursement will be destined to finance non-PIDIREGAS capital expenditure and amortizations of PIDIREGAS projects.
Accounting of the duty for infrastructure
Most part of the Ps. 33 billion was exchanged into US dollars, based on the allocation of the non-PIDIREGAS investment and the PIDIREGAS projects amortizations. Since the Mexican peso appreciated in dollar terms the accounting of the reimbursement of this duty resulted in a Ps. 0.4 billion exchange loss. The Ps. 32.6 billion difference was deposited by PEMEX in a Trust. Therefore, the accounting registered was a credit in an account receivable and a debit in PEMEX equity.
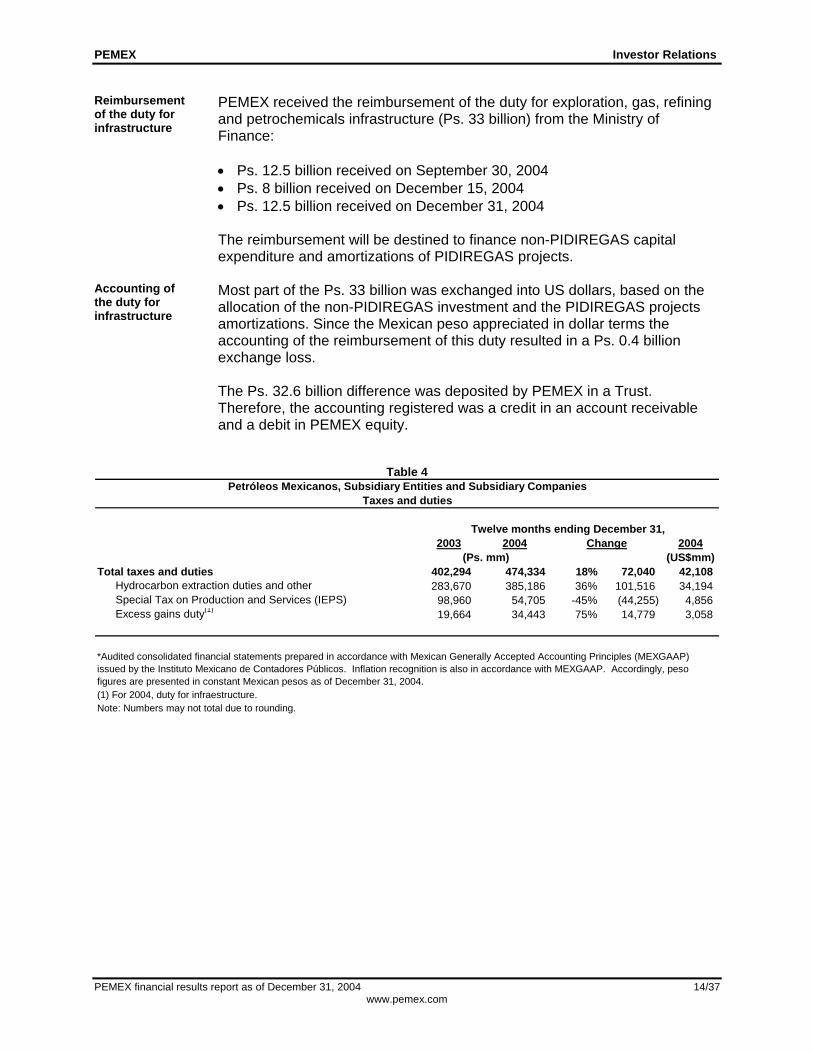
Table 4 Petróleos Mexicanos, Subsidiary Entities and Subsidiary Companies
Taxes and duties
Twelve months ending December 31, 2003 2004 Change 2004
(Ps. mm) (US$mm)Total taxes and duties 402,294 474,334 18% 72,040 42,108
Hydrocarbon extraction duties and other 283,670 385,186 36% 101,516 34,194 Special Tax on Production and Services (IEPS) 98,960 54,705 -45% (44,255) 4,856 Excess gains duty(1) 19,664 34,443 75% 14,779 3,058
(1) For 2004, duty for infraestructure.Note: Numbers may not total due to rounding.
*Audited consolidated financial statements prepared in accordance with Mexican Generally Accepted Accounting Principles (MEXGAAP) issued by the Instituto Mexicano de Contadores Públicos. Inflation recognition is also in accordance with MEXGAAP. Accordingly, peso figures are presented in constant Mexican pesos as of December 31, 2004.

PEMEX Investor Relations
PEMEX financial results report as of December 31, 2004 15/37 www.pemex.com
Net loss
Net loss of Ps. 25.5 billion
In 2004, PEMEX recorded a net loss of Ps. 25.5 billion (US$2.3 billion), compared to a net loss of Ps. 42.8 billion in 2003. The Ps. 17.3 billion (US$1.5 billion) decrease in the net loss is explained by: • An increase of Ps. 68.6 billion (US$6.1 billion) in operating income.
Excluding IEPS, operating income grew Ps. 112.8 billion (US$10 billion) • A favorable effect of Ps. 25.3 billion (US$2.2 billion) in the comprehensive
financing cost • A favorable effect of Ps. 8 billion (US$0.7 billion) in other net revenues • An increase of Ps. 72 billion (US$6.4 billion) in taxes and duties. Excluding
IEPS, the increase in taxes and duties is Ps. 116.3 billion (US$10.3 billion) • A favorable offsetting effect of Ps. 12.6 billion (US$1.1 billion) due to the
initial accumulated effect of the implementation of Bulletin C-15.
EBITDA
EBITDA increased 35%
EBITDA increased 35% to Ps. 507 billion (US$45 billion) in 2004 from Ps. 374.4 billion in 2003. EBITDA is reconciled to net loss as shown in the following table:
Table 5
Petróleos Mexicanos, Subsidiary Entities and Subsidiary Companies
Twelve months ending December 31, 2003 2004 Change 2004
(Ps. mm) (US$mm)Net income (loss) (42,754) (25,496) -40% 17,258 (2,263) + Taxes and duties 402,294 474,334 18% 72,040 42,108 - Special Tax on Production and Services (IEPS) 98,960 54,705 -45% (44,255) 4,856 + Comprehensive financing cost 32,338 7,048 -78% (25,290) 626 + Depreciation and amortization 42,649 41,900 -2% (749) 3,720 + Cost of the reserve for retirement payments 40,961 53,052 30% 12,091 4,710 - Cummulative effect due to the adoption of new accounting standards 2,117 (10,469) (12,586) (929) EBITDA 374,411 506,603 35% 132,192 44,972
Note: Numbers may not total due to rounding.
EBITDA reconciliation
*Audited consolidated financial statements prepared in accordance with Mexican Generally Accepted Accounting Principles (MEXGAAP) issued by the Instituto Mexicano de Contadores Públicos. Inflation recognition is also in accordance with MEXGAAP. Accordingly, peso figures are presented in constant Mexican pesos as of December 31, 2004.
PEMEX Investor Relations
PEMEX financial results report as of December 31, 2004 16/37 www.pemex.com
Total assets
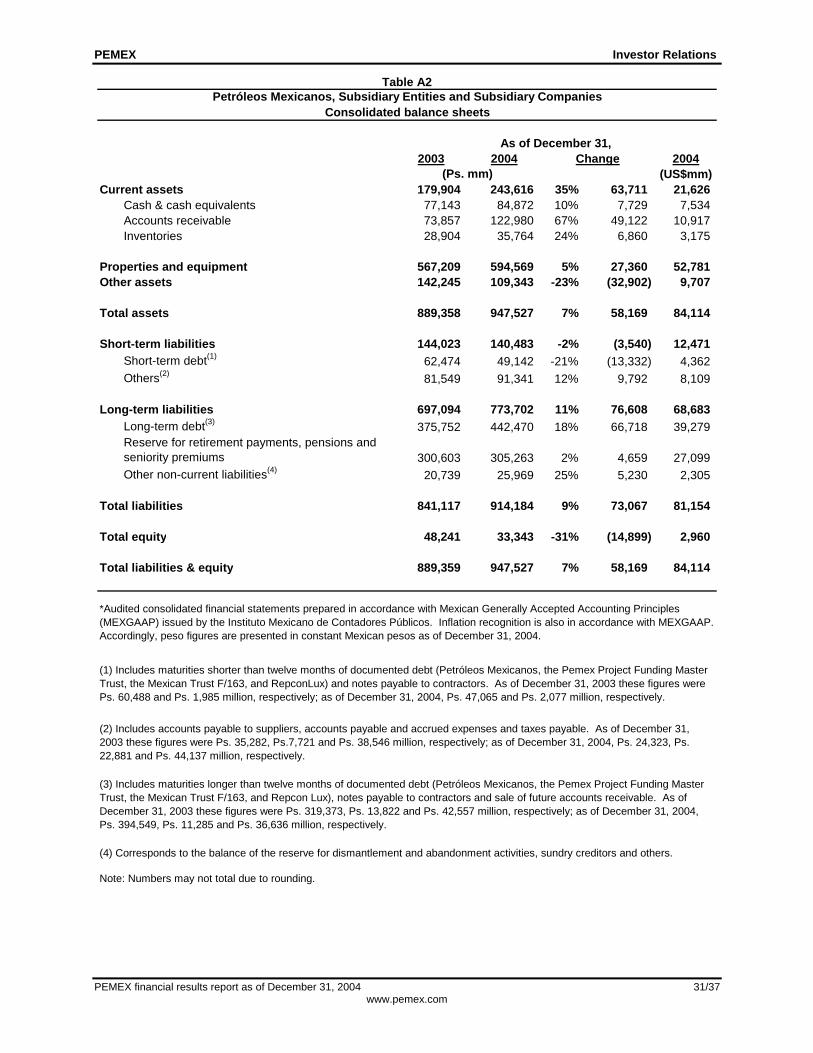
Total assets increased 7%
As of December 31, 2004, total assets were Ps. 947.5 billion (US$84.1 billion), representing a 7%, or Ps. 58.2 billion (US$5.1 billion), increase with respect to total assets as of December 31, 2003. • Cash and cash equivalents increased 10%, or Ps. 7.7 billion (US$0.7
billion) • Accounts receivable increased 67%, or Ps. 49.1 billion (US$4.4 billion) • Inventory valuation increased 24%, or Ps. 6.9 billion (US$0.6 billion), as a
result of higher hydrocarbons’ prices • Properties and equipment rose 5%, or Ps. 27.4 billion (US$2.4 billion),
reflecting new investments • Other assets decreased 23%, or Ps. 32.9 billion (US$2.9 billion), mainly as
a result of the intangible asset derived from the reserve of retirement payments according to the new methodology established in Bulletin D-3 “Labor Obligations”
Total liabilities
Liabilities increased 9%
Total liabilities increased 9% to Ps. 914.2 billion (US$81.2 billion), with respect to December 31, 2003. • Short-term liabilities decreased 2% to Ps. 140.5 billion (US$12.5 billion),
primarily as a result of the decrease in short term documented debt • Long-term liabilities increased 11% to Ps. 773.7 billion (US$68.7 billion),
due to the increase in long-term documented debt Total debt is discussed at greater length under “Financing Activities”.
PEMEX Investor Relations
PEMEX financial results report as of December 31, 2004 17/37 www.pemex.com
Reserve for retirement payments
The reserve for retirement payments, pensions and seniority premiums increased 2% to Ps. 305.3 billion (US$27.1 billion) from Ps. 300.6 billion as of December 31, 2003. The increase of Ps. 4.7 billion (US$0.4 billion) resulted from: • An increase of Ps. 14.9 billion (US$1.3 billion) due to a decrease of one
year in the funding period • An increase of Ps. 12.6 billion (US$1.1 billion) due to the difference
between the realized and the expected wages’ negotiation • An increase of Ps. 11.3 billion (US$1 billion) due to a decrease in the
pension fund • An increase of Ps. 8.4 billion (US$0.7 billion) due to the application of the
Voluntary Retirement Program • An increase of Ps. 4.7 billion (US$0.4 billion) due to the seniority annual
growth • A decrease of Ps. 37.7 billion (US$3.3 billion) caused by the change in
accounting methodology in accordance to Bulletin D-3 “Labor Obligations” • A decrease of Ps. 9.5 billion (US$0.8) due to the inflationary adjustment of
the 2003 figures • A decrease of Ps. 0.03 billion (US$0.003 billion) due to changes in
actuarial assumptions
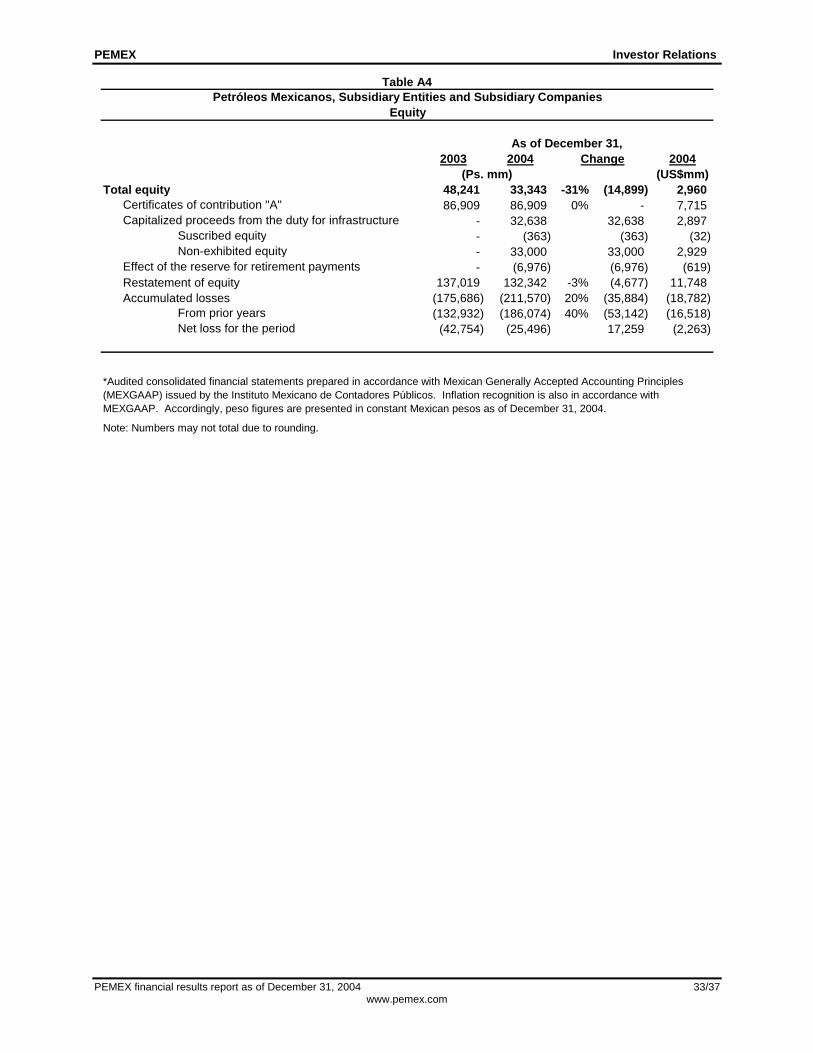
Equity
Equity increase of Ps. 14.9 billion
As of December 31, 2004, PEMEX’s equity decreased 31%, or Ps. 14.9 billion (US$1.3 billion) to Ps 33.3 billion (US$3 billion) from Ps. 48.2 billion as of December 31, 2003. The decrease is primarily explained by: • An increase in accumulated losses of Ps. 35.9 billion (US$3.2 billion) • A reduction of Ps. 7 billion (US$0.6 billion) attributable to the excess of the
threshold affecting the intangible asset associated with the reserve for the retirement payments, pensions and seniority premiums in accordance with Bulletin D-3 “Labor Obligations”
• A decrease of Ps. 4.7 billion (US$0.4 billion) due to the restatement of equity
• An offsetting favorable effect of Ps. 32.6 billion (US$2.9 billion) due to the capitalization of the duty for infrastructure registered in 2004
PEMEX Investor Relations
PEMEX financial results report as of December 31, 2004 18/37 www.pemex.com
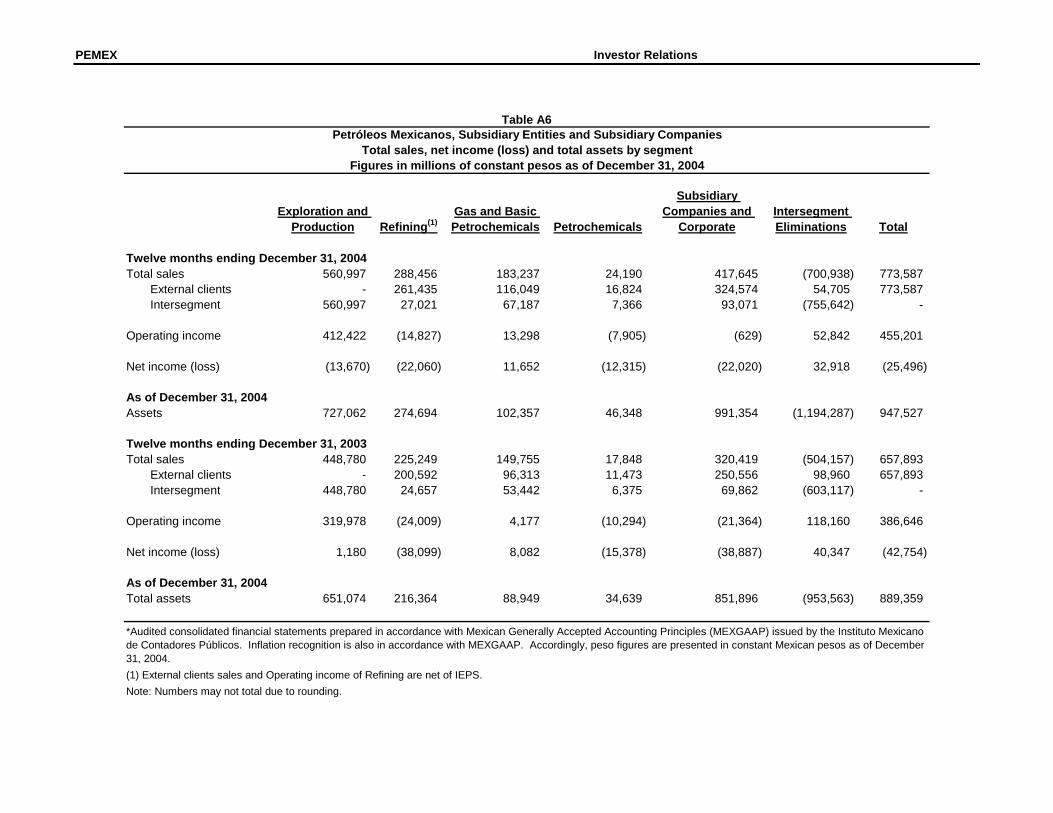
Business lines results Sales increase Total sales and operating income on each business line increased from 2003
to 2004. Likewise, each segment’s assets register an increase reflecting a greater total asset.
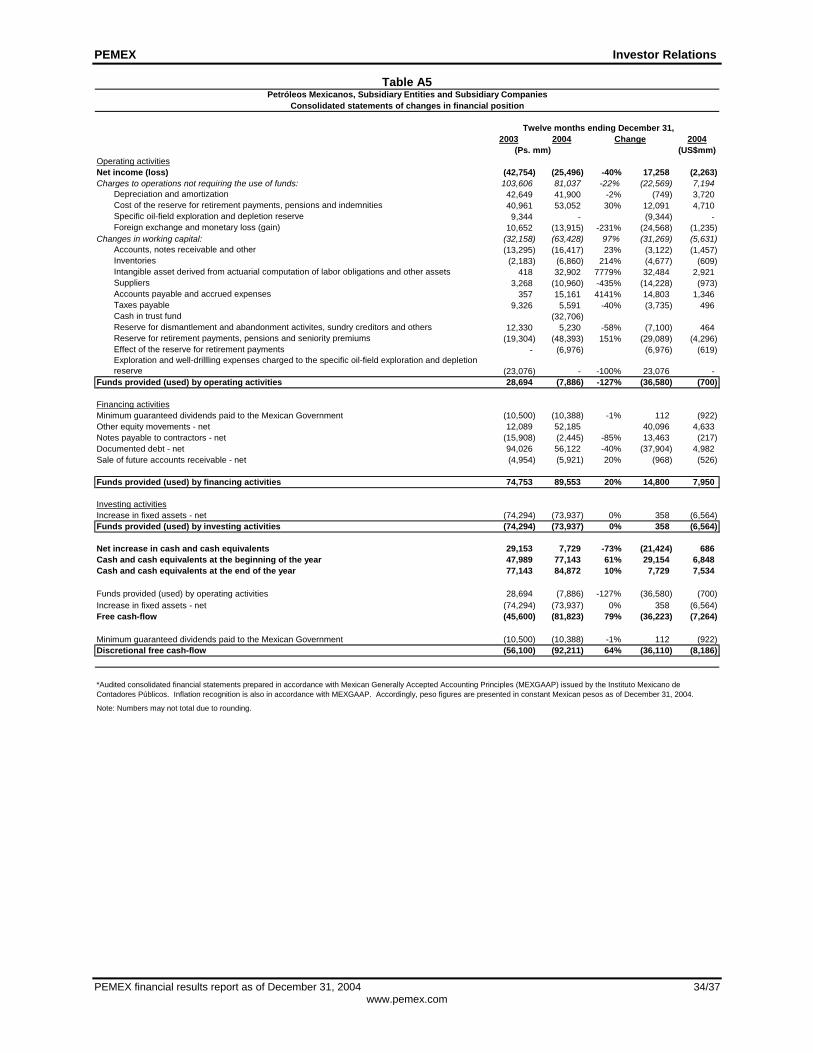
Statements of changes in financial position Funds used in operating activities
During 2004 the funds used in operating activities totaled Ps. 7.9 billion (US$0.7 billion). Proceeds were generated by: • An increase in accounts, notes receivable and other due to the
reimbursement of the duty for exploration, gas, refining and petrochemicals infrastructure
• The monetary gains result as a consequence of a higher annual inflation observed in 2004 as compared to 2003. This is a non cash item.
Funds used in investing activities
During 2004 the funds used in investing activities totaled Ps. 73.9 billion (US$6.6 billion) as a result of an increase in fixed assets. The main difference between realized capital expenditure and the increase in fixed assets is due to exploration investment and maintenance expense.
PEMEX Investor Relations
PEMEX financial results report as of December 31, 2004 19/37 www.pemex.com
Financing activities
Capital expenditure (CAPEX)
2004 CAPEX allocation
Capital expenditure for 2004 totaled US$10.9 billion, based on an exchange rate of Ps. 11.2648 per dollar. CAPEX was allocated as follows: • Exploration and Production 92% • Refining 4% • Gas and basic petrochemicals 2% • Petrochemicals 1% • Others 1% 90% of 2004 capital expenditures, i.e. US$9.8 billion, were in the form of PIDIREGAS.
2005 CAPEX projected allocation
In 2005, projected capital expenditure is US$11.2 billion, based on an exchange rate of Ps. 11.6 per dollar, and is expected to be allocated as follows: • Exploration 18.6% • Production 49% • Maintenance 17% • Refining 10% • Gas and basic petrochemicals 3% • Petrochemicals 2% • Others 0.4% Nearly 88% of 2005 projected capital expenditures, i.e. US$9.9 billion, will be in the form of PIDIREGAS.
PEMEX Investor Relations
PEMEX financial results report as of December 31, 2004 20/37 www.pemex.com
Financing requirements
2004 financing As of December 31, 2004, US$9.5 billion have been raised as follows:
• US$4.3 billion in foreign capital markets • US$2.5 billion in the Mexican capital market • US$1.4 billion from export credit agencies (ECA’s) • US$1.3 billion in bank loans Approximately 60% has been raised in foreign capital markets and the rest in the Mexican market. Since market conditions were favorable, PEMEX pre-funded part of its 2005 financing requirements by approximately US$1.5 billion.
2005 financing program
In 2005, PEMEX plans to raise approximately US$8.5 billion. Around 60% will be raised in foreign capital markets and the rest in the Mexican market. • US$2.5 billion in foreign capital markets • US$2.7 billion in the Mexican capital market • US$0.8 billion from export credit agencies (ECA’s) • US$2.5 billion in bank loans
Capital markets
Offering exchange
PEMEX strategy in the capital markets aims to reduce the number of issues and increase their liquidity. As a consequence, in December 2004, Petróleos Mexicanos and the Pemex Project Funding Master Trust established a securities offering exchange between both entities. The principal amount exchanged was US$2.3 billion, which is 78% of the total principal amount considered in the offering exchange. The market value of the amount exchanged as of December 31, 2004 was US$2.9 billion.
PEMEX Investor Relations
PEMEX financial results report as of December 31, 2004 21/37 www.pemex.com
Short-term bond program
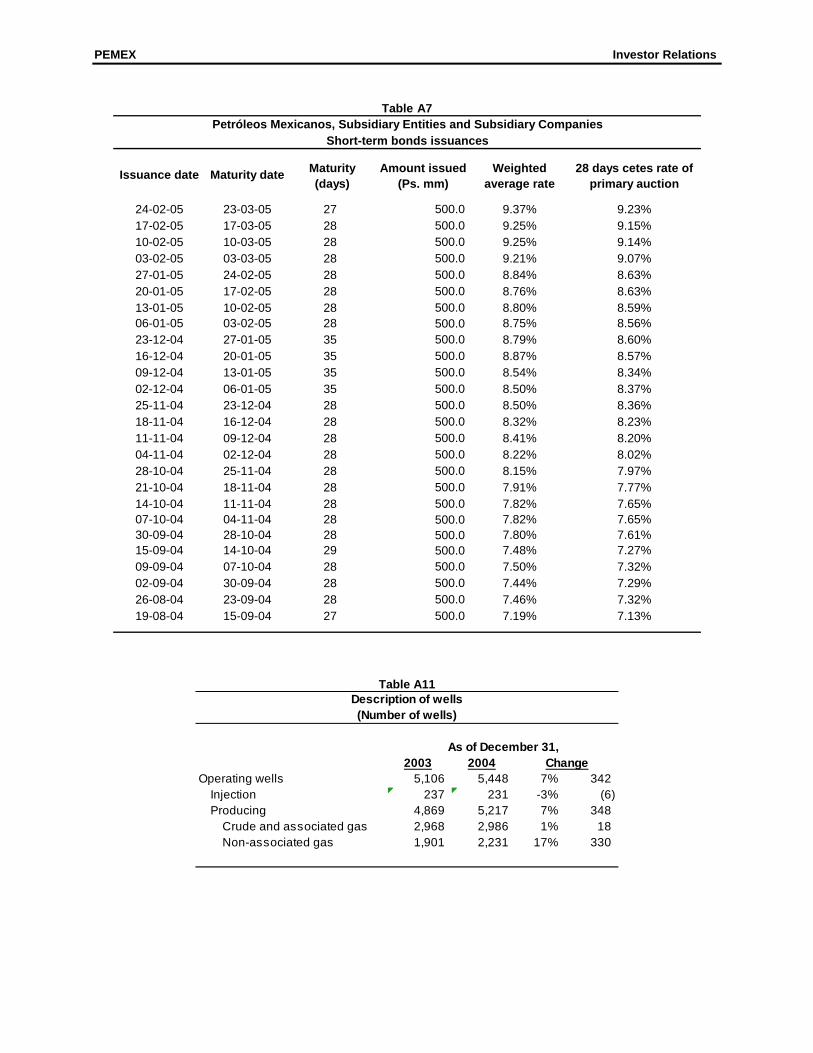
Petróleos Mexicanos and the Mexican Trust F/163 established a Ps.10 billion short term notes program, which will also be used to fund working capital needs. Under this program, either Petróleos Mexicanos or Trust F/163 may issue notes having maturities of less than 360 days. The characteristics of note issuances under this program are found in annex Table A7.
Master Trust During 2004, the Pemex Project Funding Master Trust, a Delaware trust
controlled by, and whose debt is guaranteed by PEMEX, issued: • On June 15, 2004, US$1.5 billion of its floating-rate notes due 2010 • On August 5, 2004, €850 million of its 6.375% notes due 2016 • On September 28, 2004, US$1.75 billion of its 7.75% perpetual bond with
an option to redeem in full since year five F/163 In 2004, the Trust F/163 reopened its peso bond issuances of October, 2003.
Including the first issuance of October 24, 2003 and the reopenings of January and March, 2004, the aggregate amount of peso bonds issued by PEMEX totals Ps. 32.7 billion, distributed as follows: • Ps. 13 billion of floating rate instruments due 2007 • Ps. 13.5 billion of floating rate instruments due 2009 • Ps. 6.2 billion of 8.38% instruments due 2010 On December 23, 2004, Trust F/163 issued notes in the Mexican market. The amount was settled in UDI’s equivalent to Ps. 5.0 billion. The notes issued are zero-coupon with a 9.01% interest rate and 15 years maturity. On February 1, 2005, the notes issuance like those aforementioned was reopened. The terms were a principal of Ps. 6 billion in UDI’s with a 9.07% interest rate and 15 years maturity. On February 11, 2005 Trust F/163 issued Ps.15 billion notes in the Mexican market. The issuance was done in two tranches: • A principal amount of Ps. 7.5 billion, with an interest rate equal to 91 days
CETES plus 51 basis points due in 2010 • A principal amount of Ps. 7.5 billion, with an interest rate equal to 182 days
CETES plus 57 basis points due in 2013 During the last quarter of 2004, Trust F/163 undertook bilateral credit agreements for Ps. 11 billion and 8 years maturity.
PEMEX Investor Relations
PEMEX financial results report as of December 31, 2004 22/37 www.pemex.com
Petróleos Mexicanos
On June 30, 2004, Petróleos Mexicanos obtained a syndicated revolving credit facility that will be used to fund working capital needs. The facility is divided in two tranches: • US$600 million maturing on December 31, 2007 with an interest rate of
LIBOR plus 0.55% • US$650 million maturing on June 30, 2009 with an interest rate of LIBOR
plus 0.75% This syndicated revolving credit facility replaced two bankers acceptance credit facilities totaling US$785 million, and a commercial paper program of US$445 million. As of today, this syndicated revolving credit facility has not been used.
RepCon Lux On January 26, 2004, RepCon Lux S.A., a financing vehicle formed in
Luxembourg, issued US$1.37 billion of its 4.5% guaranteed exchangeable bonds due 2011. These bonds are guaranteed by PEMEX and are exchangeable into shares of Repsol YPF, S.A. or, at the option of the issuer, the cash equivalent thereof.
Total debt
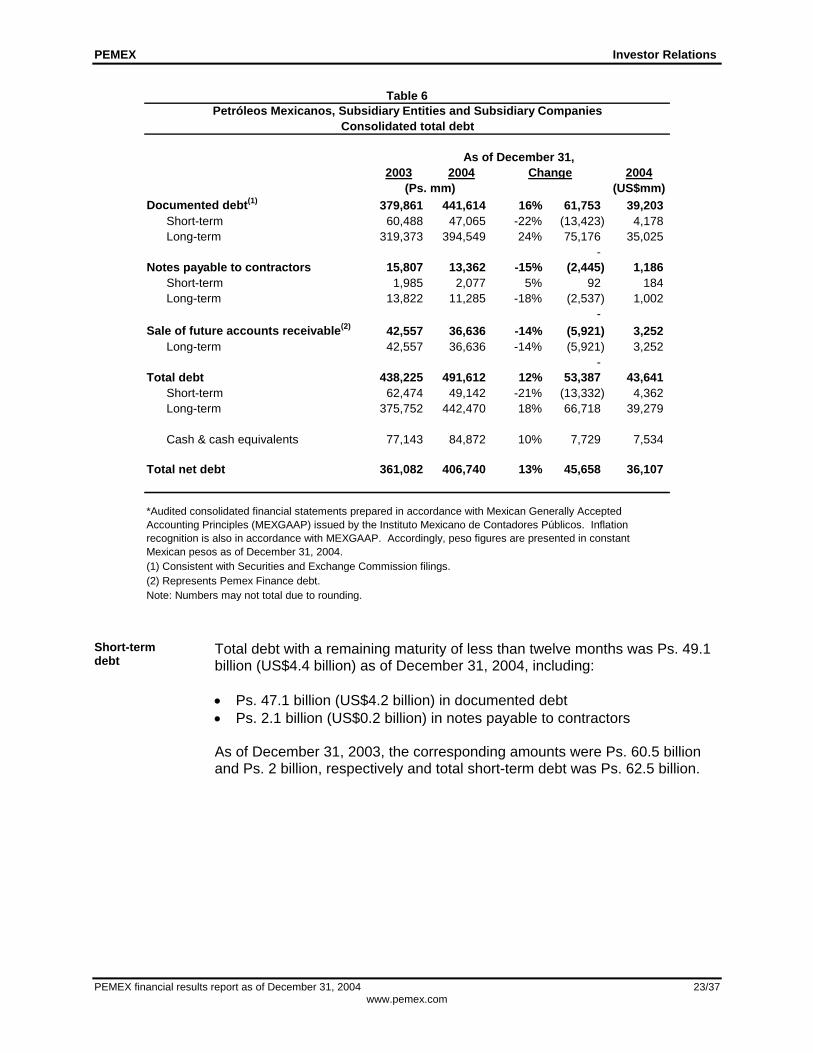
Total net debt of US$36.1 billion
As of December 31, 2004, total consolidated debt including accrued interest was Ps. 491.6 billion (US$43.6 billion). This figure represents an increase of 12%, or Ps.53.4 billion, compared to the figure recorded on December 31, 2003. Total debt includes: • Documented debt of Petróleos Mexicanos, the Pemex Project Funding
Master Trust, Trust F/163 and RepCon Lux, S.A. • Notes payable to contractors • Sale of future accounts receivable (representing Pemex Finance debt of
US$3.7 billion as of December 31, 2004) Net debt, or the difference between debt and cash equivalents, increased Ps. 45.7 billion, to Ps. 406.7 billion (US$ 36.1 billion) as of December 31, 2004, from Ps. 361.1 billion as of December 31, 2003.
PEMEX Investor Relations
PEMEX financial results report as of December 31, 2004 23/37 www.pemex.com
Table 6
As of December 31,2003 2004 Change 2004
(Ps. mm) (US$mm)Documented debt(1) 379,861 441,614 16% 61,753 39,203
Short-term 60,488 47,065 -22% (13,423) 4,178 Long-term 319,373 394,549 24% 75,176 35,025
- Notes payable to contractors 15,807 13,362 -15% (2,445) 1,186
Short-term 1,985 2,077 5% 92 184 Long-term 13,822 11,285 -18% (2,537) 1,002
- Sale of future accounts receivable(2) 42,557 36,636 -14% (5,921) 3,252
Long-term 42,557 36,636 -14% (5,921) 3,252 -
438,225 491,612 12% 53,387 43,641 Short-term 62,474 49,142 -21% (13,332) 4,362 Long-term 375,752 442,470 18% 66,718 39,279
Cash & cash equivalents 77,143 84,872 10% 7,729 7,534
Total net debt 361,082 406,740 13% 45,658 36,107
(1) Consistent with Securities and Exchange Commission filings.(2) Represents Pemex Finance debt.Note: Numbers may not total due to rounding.
*Audited consolidated financial statements prepared in accordance with Mexican Generally Accepted Accounting Principles (MEXGAAP) issued by the Instituto Mexicano de Contadores Públicos. Inflation recognition is also in accordance with MEXGAAP. Accordingly, peso figures are presented in constant Mexican pesos as of December 31, 2004.
Petróleos Mexicanos, Subsidiary Entities and Subsidiary CompaniesConsolidated total debt
Total debt
Short-term debt
Total debt with a remaining maturity of less than twelve months was Ps. 49.1 billion (US$4.4 billion) as of December 31, 2004, including: • Ps. 47.1 billion (US$4.2 billion) in documented debt • Ps. 2.1 billion (US$0.2 billion) in notes payable to contractors As of December 31, 2003, the corresponding amounts were Ps. 60.5 billion and Ps. 2 billion, respectively and total short-term debt was Ps. 62.5 billion.
PEMEX Investor Relations
PEMEX financial results report as of December 31, 2004 24/37 www.pemex.com
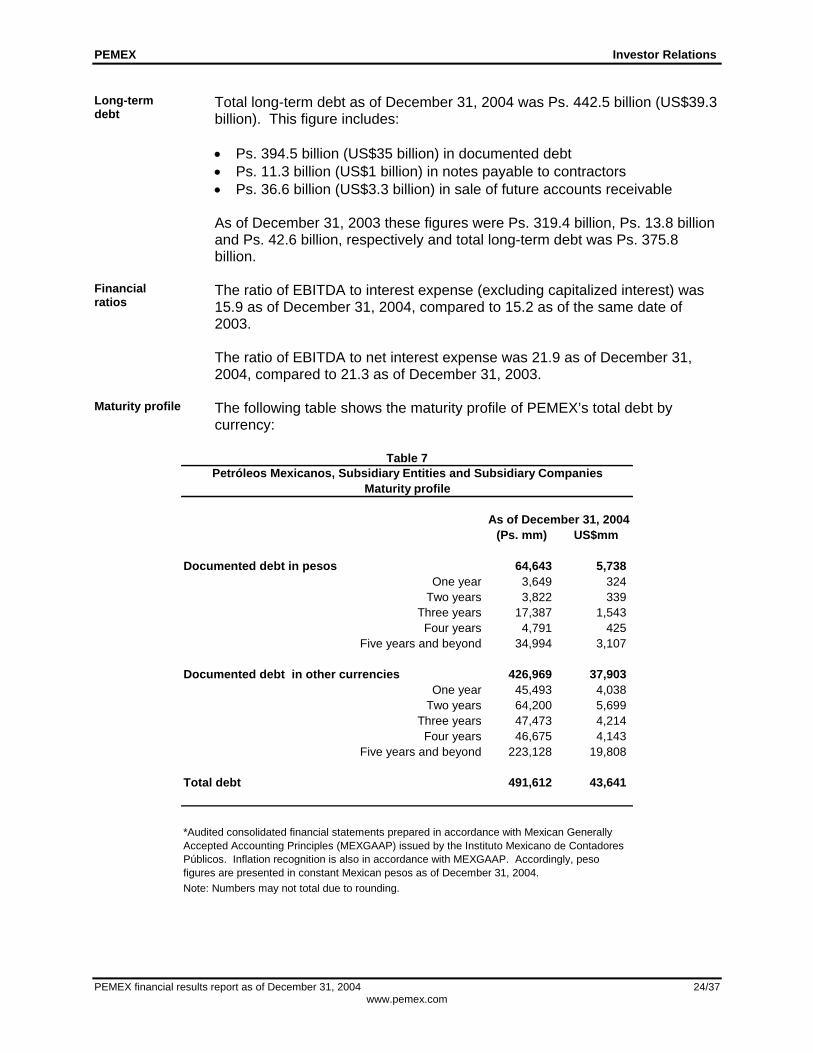
Long-term debt
Total long-term debt as of December 31, 2004 was Ps. 442.5 billion (US$39.3 billion). This figure includes: • Ps. 394.5 billion (US$35 billion) in documented debt • Ps. 11.3 billion (US$1 billion) in notes payable to contractors • Ps. 36.6 billion (US$3.3 billion) in sale of future accounts receivable As of December 31, 2003 these figures were Ps. 319.4 billion, Ps. 13.8 billion and Ps. 42.6 billion, respectively and total long-term debt was Ps. 375.8 billion.
Financial ratios
The ratio of EBITDA to interest expense (excluding capitalized interest) was 15.9 as of December 31, 2004, compared to 15.2 as of the same date of 2003. The ratio of EBITDA to net interest expense was 21.9 as of December 31, 2004, compared to 21.3 as of December 31, 2003.
Maturity profile The following table shows the maturity profile of PEMEX’s total debt by
currency:
Table 7
As of December 31, 2004(Ps. mm) US$mm
Documented debt in pesos 64,643 5,738 One year 3,649 324
Two years 3,822 339 Three years 17,387 1,543 Four years 4,791 425
Five years and beyond 34,994 3,107
Documented debt in other currencies 426,969 37,903 One year 45,493 4,038
Two years 64,200 5,699 Three years 47,473 4,214 Four years 46,675 4,143
Five years and beyond 223,128 19,808
Total debt 491,612 43,641
Note: Numbers may not total due to rounding.
*Audited consolidated financial statements prepared in accordance with Mexican Generally Accepted Accounting Principles (MEXGAAP) issued by the Instituto Mexicano de Contadores Públicos. Inflation recognition is also in accordance with MEXGAAP. Accordingly, peso figures are presented in constant Mexican pesos as of December 31, 2004.
Petróleos Mexicanos, Subsidiary Entities and Subsidiary CompaniesMaturity profile
PEMEX Investor Relations
PEMEX financial results report as of December 31, 2004 25/37 www.pemex.com
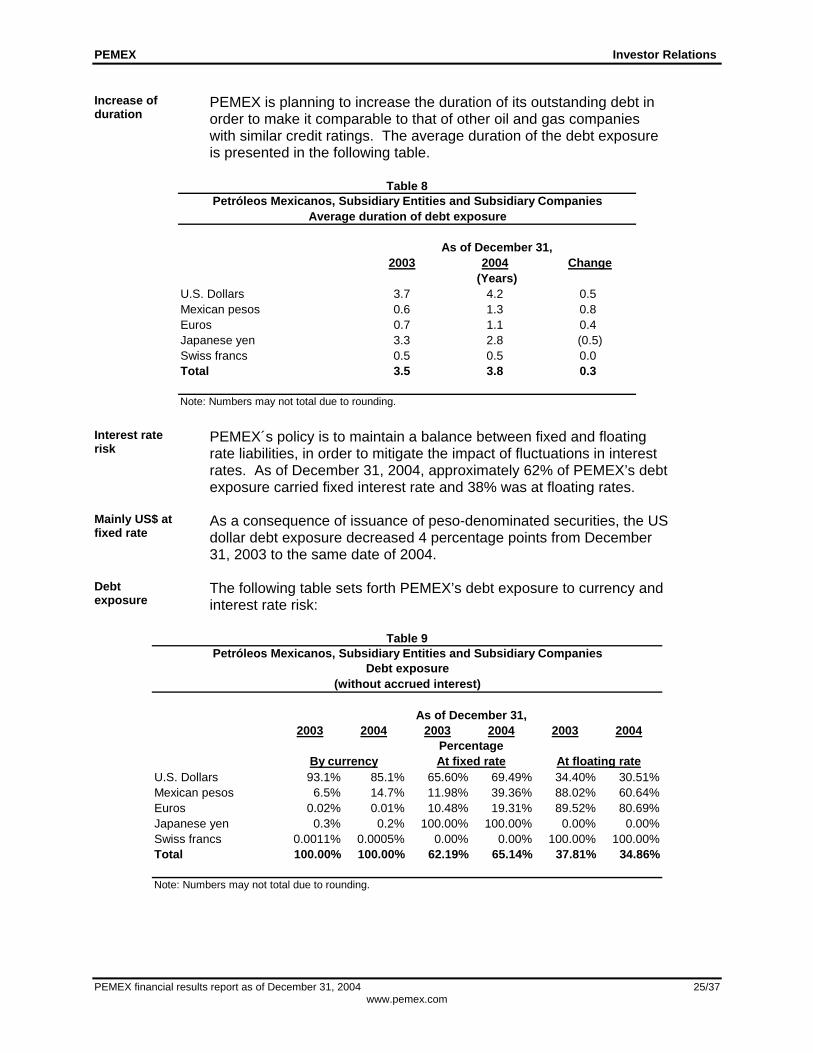
Increase of duration
PEMEX is planning to increase the duration of its outstanding debt in order to make it comparable to that of other oil and gas companies with similar credit ratings. The average duration of the debt exposure is presented in the following table.
Table 8
Petróleos Mexicanos, Subsidiary Entities and Subsidiary CompaniesAverage duration of debt exposure
As of December 31,2003 2004 Change
(Years)U.S. Dollars 3.7 4.2 0.5Mexican pesos 0.6 1.3 0.8Euros 0.7 1.1 0.4Japanese yen 3.3 2.8 (0.5)Swiss francs 0.5 0.5 0.0Total 3.5 3.8 0.3
Note: Numbers may not total due to rounding.
Interest rate risk
PEMEX´s policy is to maintain a balance between fixed and floating rate liabilities, in order to mitigate the impact of fluctuations in interest rates. As of December 31, 2004, approximately 62% of PEMEX’s debt exposure carried fixed interest rate and 38% was at floating rates.
Mainly US$ at fixed rate
As a consequence of issuance of peso-denominated securities, the US dollar debt exposure decreased 4 percentage points from December 31, 2003 to the same date of 2004.
Debt exposure
The following table sets forth PEMEX’s debt exposure to currency and interest rate risk:
Table 9
Petróleos Mexicanos, Subsidiary Entities and Subsidiary CompaniesDebt exposure
(without accrued interest)
As of December 31,2003 2004 2003 2004 2003 2004
PercentageBy currency At fixed rate At floating rate
U.S. Dollars 93.1% 85.1% 65.60% 69.49% 34.40% 30.51%Mexican pesos 6.5% 14.7% 11.98% 39.36% 88.02% 60.64%Euros 0.02% 0.01% 10.48% 19.31% 89.52% 80.69%Japanese yen 0.3% 0.2% 100.00% 100.00% 0.00% 0.00%Swiss francs 0.0011% 0.0005% 0.00% 0.00% 100.00% 100.00%Total 100.00% 100.00% 62.19% 65.14% 37.81% 34.86%
Note: Numbers may not total due to rounding.
PEMEX Investor Relations
PEMEX financial results report as of December 31, 2004 26/37 www.pemex.com
Crude oil price risk
In September 2004, PEMEX arranged a short term hedging program in order to mitigate the impact of crude oil price volatility in its cash flows. The program consists of the acquisition of options in order to hedge against potential price crude oil reductions for the rest of the year. The underlying crude volume accounted for approximately 7% of PEMEX’s annual crude oil production. This program ended in December 31, 2004. Due to high crude prices, these options expired out of the money.
Other relevant topics Accidents To date in 2005, the following accidents occurred in the State of Veracruz.
• On January 24, 2005, a light naptha spillage was registered in the region of
Agua Dulce, Veracruz. The accident occurred due to the rupture of a 12-inch gasoline pipeline running from the Cactus Gas Processing Center to La Cangrejera Petrochemical Center
• On February 2, 2005, a crude oil spillage of approximately 60 liters took place in the Christmas tree of the Tonalá No. 3 well on kilometer 39 of the Coatzacoalcos – Villahermosa highway. The spillage was caused by a herd of cattle striking the facility
• On March 12, 2005, a diesel and crude oil leak of approximately 100 liters was registered in the 5-A pumping station of the 24-30 inch oil pipeline in Nogales, Veracruz
• On April 13, 2005, an ammonia spillage took place in the pipeline running from the Cosoleacaque petrochemical facilities to the Pajaritos Maritime Terminal. The accident occurred while personnel of a company hired by PEMEX were performing maintenance duties
In collaboration with the Government of the state of Veracruz, the Mexican Army and Navy, municipal authorities and Civil Protection, among others, PEMEX has implemented contingency plans to protect and reestablish the health and integrity of the population of the affected areas and counteract the negative environmental impact.
Health, Safety and Environmental Protection Program
On April 29, 2005, the Director General of Petróleos Mexicanos, Luis Ramírez Corzo, announced the Health, Safety and Environmental Protection Program which purpose is to strengthen the existing programs to identify and correct any potential failure in order to guaranty the safety of the population and the company, as well as to protect the environment. The Corporate Direction of Operations coordinates this program.
Corporate Direction of Operations
On April 29, 2005, Mr. Marcos Ramírez Silva was appointed as Corporate Director of Operations.
Mexican On April 29, 2005, Mr. José Antonio Ceballos Soberanis was appointed as

PEMEX Investor Relations
PEMEX financial results report as of December 31, 2004 27/37 www.pemex.com
Petroleum Institute
Director General of the Mexican Petroleum Institute.
Proposed PEMEX’s fiscal regime
On April 27, 2005, the Senate discussed and approved a proposal to modify the fiscal regime of PEMEX as an alternative to the one approved by the Chamber of Deputies. The tax regime for PEMEX Exploration and Production would be governed by the “Ley Federal de Derechos” and the taxes for the other subsidiary entities would continue to be governed by the “Ley de Ingresos de la Federación”. The Senate’s approved counterproposal for PEMEX Exploration and Production would consist of the following duties: • Ordinary duty on hydrocarbons with a variable tax rate -- depending on
the average Mexican crude oil export price and the specific year after the implementation of the new proposal 10-- on the value of extracted production minus certain permitted deductions (including specific investments, some costs and expenses, part of the funds for scientific and technological research and for the support of fiscal monitoring of oil activities and the other duties)11. The rate would vary from 78.68% to 87.81% (depending on the Mexican crude oil export price) in 2006, and would become a uniform rate of 79% in 2010 and thereafter
• Duty on hydrocarbons for the stabilization fund, which is paid on the value of the extracted crude oil production, would range from 1% to 10%, depending on the average Mexican crude oil export price, and only if the crude oil export price exceeds US$22 per barrel12
• Extraordinary duty on crude oil exports of 13.1%, paid on the realized value of oil exports in excess of estimated budgeted value of oil exports. This duty is to be credited against the duty for hydrocarbons for the stabilization fund
Relative to the proposal approved on October 28, 2004 by the Chamber of Deputies, the Senate´s counterproposal removed the duty on hydrocarbons extraction. This duty distinguished crude oil from natural gas production and separated existing from new hydrocarbons. In addition, the counterproposal of the Senate establishes a variable tax rate for the ordinary duty for hydrocarbons, while the proposal of the Chamber of Deputies established a fixed rate of 69%. For the ordinary duty for hydrocarbons, the new proposal allows, in addition to the permitted deductions described in the proposal of the Chamber of Deputies, deductions for a part of the funds for scientific and technological research and for the support of fiscal monitoring of oil activities. The purpose of the new fiscal regime is to strengthen PEMEX’s competitiveness and to contribute to improving its financial position. The counterproposal of the Senate was sent to the Chamber of Deputies for analysis, discussion and potential approval in the next Ordinary Session13 or in an Extraordinary Session. If passed, the new fiscal regime will go into effect on January 1, 2006.
10 See Table A7 11 See Table A8 12 See Table A9 13 From September 1 to December 15, 2005.
PEMEX Investor Relations
PEMEX financial results report as of December 31, 2004 28/37 www.pemex.com
Comparisons between preliminary and audited financial results as of December 31, 2004 Income Statement Export sales Export sales decreased Ps. 5 billion as a consequence of the elimination of
intersegment operations derived from the commercialization of products. Other revenues Other revenues decreased Ps. 4.4 billion, primarily due to the recognition of
the impairment of assets of PEMEX Exploration and Production and of PEMEX Petrochemicals, in accordance to the Bulletin C-15 “Impairment on the Value of Fixed Assets and Disposals”
Cost of sales The decrease of Ps. 8 billion is mainly explained by:
• The elimination of intersegment operations derived from the
commercialization of products (Ps. 5 billion) • Variations in the value of inventories (Ps. 0.7 billion) • The reversal of the assets’ capitalization of maintenance expenditures
(Ps. 1.5 billion) Comprehensive financing cost
The Ps. 10.3 billion increase of the comprehensive financing cost is primarily attributed to: • An increase of Ps. 7.4 billion in net interest due to a reduction in interest
income and an increase in interest expense, derived from the adjustment in the registration of preliminary hedge figures of RepCon Lux
• An increase of Ps. 2.1 billion in net foreign exchange loss due to the restatement of the value of assets by means of exchange rate
Assets Accounts receivable
The decrease of Ps. 2.3 billion was a result of the reclassification of payments made in advance by clients.
Inventories The increase of Ps. 0.7 billion in inventories is due to the adjustment in the
valuation of product inventories based on specific indexes.
PEMEX Investor Relations
PEMEX financial results report as of December 31, 2004 29/37 www.pemex.com
Fixed asset The decrease of Ps. 18.9 billion is mainly due to:
• Recognition of the impairment of assets according to Bulletin C-15
“Impairment on the Value of Fixed Assets and Disposals” • Restatement of the value of assets by means of exchange rate • Cancellation of unfounded registration of work contracts in Minatitlán (Ps.
14.9 billion) and unfounded registration of land properties (Ps. 1.4 billion) Other assets The decrease of Ps. 48 billion was due to the implementation of the new
Bulletin D-3 “Labor Obligations” for the registration of the Reserve for retirement payments, pensions and seniority premiums.
Pasivos Accounts payable
The increase of accounts payable of Ps. 11.3 billion was mainly due to: • The adjustment in the registration of preliminary hedge figures of RepCon
Lux • The registration of Ps. 1.6 billion as a consequence of the natural gas price
hedging program Suppliers The decrease of Ps. 2.2 billion in suppliers was a result of a reclassification of
payments made in advance by clients. Pidiregas contractors
The decrease of Ps. 14 billion reflects the cancellation of unfounded registration of work contracts in Minatitlán.
Reserve for retirement payments, pensions and seniority premiums
The reduction of Ps. 41.9 billion as a consequence of the implementation of the new Bulletin D-3 “Labor Obligations” for the registration of the Reserve for retirement payments, pensions and seniority premiums. This effect was reflected in intangible assets and on the equity.
Equity Equity Equity decreased Ps. 24.7 due to:
• The implementation of the new Bulletin D-3 “Labor Obligations” for the
registration of the Reserve for retirement payments, pensions and seniority premiums
• Cancellation of the unfounded registration of land properties • The registration of Ps. 1.6 billion of the natural gas price hedging program • The results of movements in income statement accounts previously
mentioned (Ps. 11.3 billion)
PEMEX Investor Relations
PEMEX financial results report as of December 31, 2004 30/37 www.pemex.com
Annex
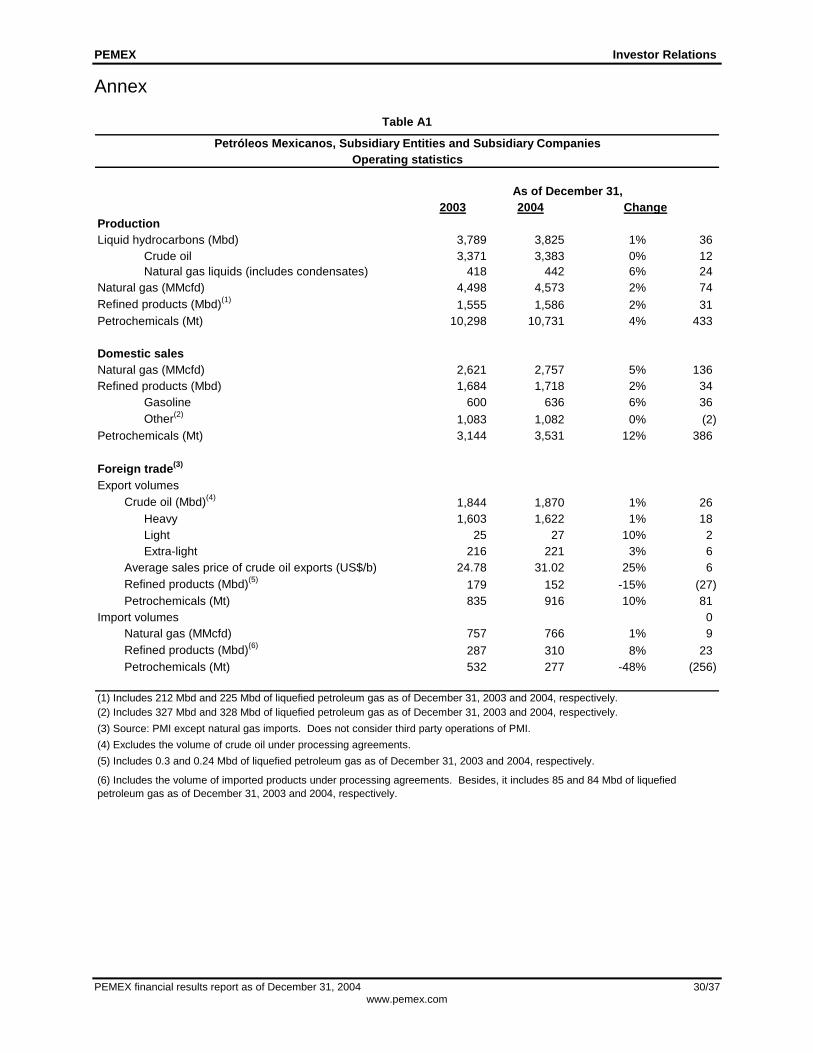
Table A1
Petróleos Mexicanos, Subsidiary Entities and Subsidiary CompaniesOperating statistics
As of December 31,2003 2004 Change
ProductionLiquid hydrocarbons (Mbd) 3,789 3,825 1% 36
Crude oil 3,371 3,383 0% 12Natural gas liquids (includes condensates) 418 442 6% 24
Natural gas (MMcfd) 4,498 4,573 2% 74Refined products (Mbd)(1) 1,555 1,586 2% 31Petrochemicals (Mt) 10,298 10,731 4% 433
Domestic salesNatural gas (MMcfd) 2,621 2,757 5% 136Refined products (Mbd) 1,684 1,718 2% 34
Gasoline 600 636 6% 36Other(2) 1,083 1,082 0% (2)
Petrochemicals (Mt) 3,144 3,531 12% 386
Foreign trade(3)
Export volumesCrude oil (Mbd)(4) 1,844 1,870 1% 26
Heavy 1,603 1,622 1% 18Light 25 27 10% 2Extra-light 216 221 3% 6
Average sales price of crude oil exports (US$/b) 24.78 31.02 25% 6Refined products (Mbd)(5) 179 152 -15% (27)Petrochemicals (Mt) 835 916 10% 81
Import volumes 0Natural gas (MMcfd) 757 766 1% 9Refined products (Mbd)(6) 287 310 8% 23Petrochemicals (Mt) 532 277 -48% (256)
(1) Includes 212 Mbd and 225 Mbd of liquefied petroleum gas as of December 31, 2003 and 2004, respectively.(2) Includes 327 Mbd and 328 Mbd of liquefied petroleum gas as of December 31, 2003 and 2004, respectively.(3) Source: PMI except natural gas imports. Does not consider third party operations of PMI.(4) Excludes the volume of crude oil under processing agreements.(5) Includes 0.3 and 0.24 Mbd of liquefied petroleum gas as of December 31, 2003 and 2004, respectively.
(6) Includes the volume of imported products under processing agreements. Besides, it includes 85 and 84 Mbd of liquefied petroleum gas as of December 31, 2003 and 2004, respectively.
PEMEX Investor Relations
PEMEX financial results report as of December 31, 2004 31/37 www.pemex.com
Table A2 Petróleos Mexicanos, Subsidiary Entities and Subsidiary Companies
Consolidated balance sheets
As of December 31,2003 2004 Change 2004
(Ps. mm) (US$mm)Current assets 179,904 243,616 35% 63,711 21,626
Cash & cash equivalents 77,143 84,872 10% 7,729 7,534 Accounts receivable 73,857 122,980 67% 49,122 10,917 Inventories 28,904 35,764 24% 6,860 3,175
Properties and equipment 567,209 594,569 5% 27,360 52,781 Other assets 142,245 109,343 -23% (32,902) 9,707
Total assets 889,358 947,527 7% 58,169 84,114
Short-term liabilities 144,023 140,483 -2% (3,540) 12,471 Short-term debt(1) 62,474 49,142 -21% (13,332) 4,362 Others(2) 81,549 91,341 12% 9,792 8,109
Long-term liabilities 697,094 773,702 11% 76,608 68,683 Long-term debt(3) 375,752 442,470 18% 66,718 39,279 Reserve for retirement payments, pensions and seniority premiums 300,603 305,263 2% 4,659 27,099 Other non-current liabilities(4) 20,739 25,969 25% 5,230 2,305
Total liabilities 841,117 914,184 9% 73,067 81,154
Total equity 48,241 33,343 -31% (14,899) 2,960
Total liabilities & equity 889,359 947,527 7% 58,169 84,114
Note: Numbers may not total due to rounding.
(4) Corresponds to the balance of the reserve for dismantlement and abandonment activities, sundry creditors and others.
*Audited consolidated financial statements prepared in accordance with Mexican Generally Accepted Accounting Principles (MEXGAAP) issued by the Instituto Mexicano de Contadores Públicos. Inflation recognition is also in accordance with MEXGAAP. Accordingly, peso figures are presented in constant Mexican pesos as of December 31, 2004.
(1) Includes maturities shorter than twelve months of documented debt (Petróleos Mexicanos, the Pemex Project Funding Master Trust, the Mexican Trust F/163, and RepconLux) and notes payable to contractors. As of December 31, 2003 these figures were Ps. 60,488 and Ps. 1,985 million, respectively; as of December 31, 2004, Ps. 47,065 and Ps. 2,077 million, respectively.
(2) Includes accounts payable to suppliers, accounts payable and accrued expenses and taxes payable. As of December 31, 2003 these figures were Ps. 35,282, Ps.7,721 and Ps. 38,546 million, respectively; as of December 31, 2004, Ps. 24,323, Ps. 22,881 and Ps. 44,137 million, respectively.
(3) Includes maturities longer than twelve months of documented debt (Petróleos Mexicanos, the Pemex Project Funding Master Trust, the Mexican Trust F/163, and Repcon Lux), notes payable to contractors and sale of future accounts receivable. As of December 31, 2003 these figures were Ps. 319,373, Ps. 13,822 and Ps. 42,557 million, respectively; as of December 31, 2004, Ps. 394,549, Ps. 11,285 and Ps. 36,636 million, respectively.

PEMEX Investor Relations
PEMEX financial results report as of December 31, 2004 32/37 www.pemex.com
Table A3
Petróleos Mexicanos, Subsidiary Entities and Subsidiary CompaniesConsolidated income statement
Twelve months ending December 31, 2003 2004 Change 2004
(Ps. mm) (US$mm)Total sales 657,893 773,587 18% 115,694 68,673
Domestic sales(1) 407,337 449,013 10% 41,675 39,860 Exports 250,556 324,574 30% 74,018 28,813
Costs and expenses(2) 271,247 318,386 17% 47,139 28,264 Cost of sales 217,869 264,106 21% 46,236 23,445 Transportation and distribution expenses 16,356 17,574 7% 1,218 1,560 Administrative expenses 37,022 36,706 -1% (316) 3,258
386,646 455,201 18% 68,555 40,409
Comprehensive financing cost(3) 32,338 7,048 -78% (25,290) 626 Other expenses (revenues) (3,115) (11,154) -258% (8,040) (990)
Income before taxes and duties 357,423 459,308 29% 101,885 40,774
Taxes and duties 402,294 474,334 18% 72,040 42,108 Hydrocarbon extraction duties and other 303,335 419,629 38% 116,295 37,251 Special Tax on Production and Services (IEPS) 98,960 54,705 -45% (44,255) 4,856
2,117 (10,469) -594% (12,586) (929)
Net income (loss) (42,754) (25,496) 40% 17,258 (2,263)
Note: Numbers may not total due to rounding.
(1) Includes the Special Tax on Production and Services (IEPS). As of December 31, 2003 this figure was Ps. 98,960 million and as of December 31, 2004, Ps. 54,705 million.
(3) Includes net interest, foreign exchange loss and monetary loss (gain). As of December 31, 2003 these figures were Ps. 17,599, Ps. 26,830 and Ps. (12,091) million, respectively; as of December 31 2004, Ps. 23,124, Ps. 3,471 and Ps. (19,546) million, respectively.
(2) Includes the cost of the reserve for retirment payments, pensions and indemnities. As of December 31, 2003 this figure was Ps. 40,961 million and as of December 31, 2004, Ps. 53,052 million.
Operating income
*Audited consolidated financial statements prepared in accordance with Mexican Generally Accepted Accounting Principles (MEXGAAP) issued by the Instituto Mexicano de Contadores Públicos. Inflation recognition is also in accordance with MEXGAAP. Accordingly, peso figures are presented in constant Mexican pesos as of December 31, 2004.
Cummulative effect due to the adoption of new
PEMEX Investor Relations
PEMEX financial results report as of December 31, 2004 33/37 www.pemex.com
Table A4
As of December 31,2003 2004 Change 2004
(Ps. mm) (US$mm)Total equity 48,241 33,343 -31% (14,899) 2,960
Certificates of contribution "A" 86,909 86,909 0% - 7,715 Capitalized proceeds from the duty for infrastructure - 32,638 32,638 2,897
Suscribed equity - (363) (363) (32) Non-exhibited equity - 33,000 33,000 2,929
Effect of the reserve for retirement payments - (6,976) (6,976) (619) Restatement of equity 137,019 132,342 -3% (4,677) 11,748 Accumulated losses (175,686) (211,570) 20% (35,884) (18,782)
From prior years (132,932) (186,074) 40% (53,142) (16,518) Net loss for the period (42,754) (25,496) 17,259 (2,263)
Note: Numbers may not total due to rounding.
Petróleos Mexicanos, Subsidiary Entities and Subsidiary CompaniesEquity
*Audited consolidated financial statements prepared in accordance with Mexican Generally Accepted Accounting Principles (MEXGAAP) issued by the Instituto Mexicano de Contadores Públicos. Inflation recognition is also in accordance with MEXGAAP. Accordingly, peso figures are presented in constant Mexican pesos as of December 31, 2004.
PEMEX Investor Relations
PEMEX financial results report as of December 31, 2004 34/37 www.pemex.com
Table A5 Petróleos Mexicanos, Subsidiary Entities and Subsidiary Companies
Consolidated statements of changes in financial position
Twelve months ending December 31, 2003 2004 Change 2004
(Ps. mm) (US$mm)Operating activitiesNet income (loss) (42,754) (25,496) -40% 17,258 (2,263)
103,606 81,037 -22% (22,569) 7,194 Depreciation and amortization 42,649 41,900 -2% (749) 3,720 Cost of the reserve for retirement payments, pensions and indemnities 40,961 53,052 30% 12,091 4,710 Specific oil-field exploration and depletion reserve 9,344 - (9,344) - Foreign exchange and monetary loss (gain) 10,652 (13,915) -231% (24,568) (1,235)
(32,158) (63,428) 97% (31,269) (5,631) Accounts, notes receivable and other (13,295) (16,417) 23% (3,122) (1,457) Inventories (2,183) (6,860) 214% (4,677) (609) Intangible asset derived from actuarial computation of labor obligations and other assets 418 32,902 7779% 32,484 2,921 Suppliers 3,268 (10,960) -435% (14,228) (973) Accounts payable and accrued expenses 357 15,161 4141% 14,803 1,346 Taxes payable 9,326 5,591 -40% (3,735) 496 Cash in trust fund (32,706) Reserve for dismantlement and abandonment activites, sundry creditors and others 12,330 5,230 -58% (7,100) 464 Reserve for retirement payments, pensions and seniority premiums (19,304) (48,393) 151% (29,089) (4,296) Effect of the reserve for retirement payments - (6,976) (6,976) (619) Exploration and well-drillling expenses charged to the specific oil-field exploration and depletion reserve (23,076) - -100% 23,076 -
28,694 (7,886) -127% (36,580) (700)
Financing activities(10,500) (10,388) -1% 112 (922) 12,089 52,185 40,096 4,633
(15,908) (2,445) -85% 13,463 (217) 94,026 56,122 -40% (37,904) 4,982 (4,954) (5,921) 20% (968) (526)
74,753 89,553 20% 14,800 7,950
Investing activities(74,294) (73,937) 0% 358 (6,564) (74,294) (73,937) 0% 358 (6,564)
29,153 7,729 -73% (21,424) 686 47,989 77,143 61% 29,154 6,848 77,143 84,872 10% 7,729 7,534
28,694 (7,886) -127% (36,580) (700) (74,294) (73,937) 0% 358 (6,564)
Free cash-flow (45,600) (81,823) 79% (36,223) (7,264)
(10,500) (10,388) -1% 112 (922) Discretional free cash-flow (56,100) (92,211) 64% (36,110) (8,186)
Note: Numbers may not total due to rounding.
*Audited consolidated financial statements prepared in accordance with Mexican Generally Accepted Accounting Principles (MEXGAAP) issued by the Instituto Mexicano de Contadores Públicos. Inflation recognition is also in accordance with MEXGAAP. Accordingly, peso figures are presented in constant Mexican pesos as of December 31, 2004.
Charges to operations not requiring the use of funds:
Changes in working capital:
Funds provided (used) by operating activities
Minimum guaranteed dividends paid to the Mexican GovernmentOther equity movements - netNotes payable to contractors - netDocumented debt - netSale of future accounts receivable - net
Funds provided (used) by financing activities
Increase in fixed assets - netFunds provided (used) by investing activities
Net increase in cash and cash equivalents
Minimum guaranteed dividends paid to the Mexican Government
Cash and cash equivalents at the beginning of the yearCash and cash equivalents at the end of the year
Funds provided (used) by operating activitiesIncrease in fixed assets - net
PEMEX Investor Relations
Table A6
Petróleos Mexicanos, Subsidiary Entities and Subsidiary CompaniesTotal sales, net income (loss) and total assets by segment
Figures in millions of constant pesos as of December 31, 2004
Exploration and Production Refining(1)
Gas and Basic Petrochemicals Petrochemicals
Subsidiary Companies and
CorporateIntersegment Eliminations Total
Twelve months ending December 31, 2004Total sales 560,997 288,456 183,237 24,190 417,645 (700,938) 773,587
External clients - 261,435 116,049 16,824 324,574 54,705 773,587 Intersegment 560,997 27,021 67,187 7,366 93,071 (755,642) -
Operating income 412,422 (14,827) 13,298 (7,905) (629) 52,842 455,201
Net income (loss) (13,670) (22,060) 11,652 (12,315) (22,020) 32,918 (25,496)
As of December 31, 2004Assets 727,062 274,694 102,357 46,348 991,354 (1,194,287) 947,527
Twelve months ending December 31, 2003Total sales 448,780 225,249 149,755 17,848 320,419 (504,157) 657,893
External clients - 200,592 96,313 11,473 250,556 98,960 657,893 Intersegment 448,780 24,657 53,442 6,375 69,862 (603,117) -
Operating income 319,978 (24,009) 4,177 (10,294) (21,364) 118,160 386,646
Net income (loss) 1,180 (38,099) 8,082 (15,378) (38,887) 40,347 (42,754)
As of December 31, 2004Total assets 651,074 216,364 88,949 34,639 851,896 (953,563) 889,359
Note: Numbers may not total due to rounding.
*Audited consolidated financial statements prepared in accordance with Mexican Generally Accepted Accounting Principles (MEXGAAP) issued by the Instituto Mexicano de Contadores Públicos. Inflation recognition is also in accordance with MEXGAAP. Accordingly, peso figures are presented in constant Mexican pesos as of December 31, 2004.(1) External clients sales and Operating income of Refining are net of IEPS.
PEMEX Investor Relations
Table A7
Petróleos Mexicanos, Subsidiary Entities and Subsidiary CompaniesShort-term bonds issuances
Issuance date Maturity date Maturity(days)
Amount issued(Ps. mm)
Weighted average rate
28 days cetes rate of primary auction
24-02-05 23-03-05 27 500.0 9.37% 9.23%17-02-05 17-03-05 28 500.0 9.25% 9.15%10-02-05 10-03-05 28 500.0 9.25% 9.14%03-02-05 03-03-05 28 500.0 9.21% 9.07%27-01-05 24-02-05 28 500.0 8.84% 8.63%20-01-05 17-02-05 28 500.0 8.76% 8.63%13-01-05 10-02-05 28 500.0 8.80% 8.59%06-01-05 03-02-05 28 500.0 8.75% 8.56%23-12-04 27-01-05 35 500.0 8.79% 8.60%16-12-04 20-01-05 35 500.0 8.87% 8.57%09-12-04 13-01-05 35 500.0 8.54% 8.34%02-12-04 06-01-05 35 500.0 8.50% 8.37%25-11-04 23-12-04 28 500.0 8.50% 8.36%18-11-04 16-12-04 28 500.0 8.32% 8.23%11-11-04 09-12-04 28 500.0 8.41% 8.20%04-11-04 02-12-04 28 500.0 8.22% 8.02%28-10-04 25-11-04 28 500.0 8.15% 7.97%21-10-04 18-11-04 28 500.0 7.91% 7.77%14-10-04 11-11-04 28 500.0 7.82% 7.65%07-10-04 04-11-04 28 500.0 7.82% 7.65%30-09-04 28-10-04 28 500.0 7.80% 7.61%15-09-04 14-10-04 29 500.0 7.48% 7.27%09-09-04 07-10-04 28 500.0 7.50% 7.32%02-09-04 30-09-04 28 500.0 7.44% 7.29%26-08-04 23-09-04 28 500.0 7.46% 7.32%19-08-04 15-09-04 27 500.0 7.19% 7.13%
Table A11 Description of wells(Number of wells)
As of December 31,2003 2004 Change
Operating wells 5,106 5,448 7% 342 Injection 237 231 -3% (6) Producing 4,869 5,217 7% 348
Crude and associated gas 2,968 2,986 1% 18 Non-associated gas 1,901 2,231 17% 330
PEMEX Investor Relations
PEMEX financial results report as of December 31, 2004 37/37 www.pemex.com
If you need to contact Investor Relations or to be included in the distribution list, please call or send an e-mail to: Telephone: (52 55) 1944 9700 Voice mail: (52 55) 1944 2500 ext. 59412 [email protected] Esteban Levin Celina Torres [email protected] [email protected] David Ruelas Rolando Galindo [email protected] [email protected] Armando Acosta Alejandro Reyes [email protected] [email protected] PEMEX is Mexico’s national oil and gas company. Created in 1938, it is the exclusive producer of Mexico’s oil and gas resources. The operating subsidiary entities are PEMEX Exploración y Producción, PEMEX Refinación, PEMEX Gas y Petroquímica Básica and PEMEX Petroquímica. The principal subsidiary company is PMI, its international trading arm. Amounts in US dollars are translated at the December 31, 2004 exchange rate of Ps. 11.2648 per US dollar. This report contains forward-looking statements. Statements that are not historical facts, including statements about our beliefs and expectations, are forward looking-statements. These are good faith statements based on current plans, estimates and projections and therefore you should not place undue reliance on them. Forward-looking statements speak only as of the date they were made, and we undertake no obligation to update publicly any of them in light of new information or future events. Forward-looking statements involve inherent risks and uncertainties. These risks and uncertainties include crude oil price volatility; production, equipment, and transportation risks inherent in the oil industry; environmental regulations in Mexico; actions of the Mexican government with respect to our operations, budget, taxation, commercial activities, control of hydrocarbon reserves, or debt service payments; any limitations on exports resulting from agreements of the Mexican government; and economic, political, and foreign exchange risks affecting Mexico. These risks and uncertainties are more fully detailed in PEMEX most recent Form 20-F filing with the U.S. Securities and Exchange Commission (www.sec.gov) and the PEMEX Prospectus filed with the National Banking and Securities Commission (CNBV) and available through the Mexican Stock Exchange (wwww.bmv.com.mx). These factors could cause actual results to differ materially from those contained in any forward-looking statement. The U.S. Securities and Exchange Commission (SEC) permits oil and gas companies, in their filings with the SEC, to disclose only proved reserves that a company has demonstrated by actual production or conclusive formation tests to be economically and legally producible under existing economic and operating conditions. We use certain terms in this document, such as total reserves, probable reserves and possible reserves, that the SEC's guidelines strictly prohibit us from including in filings with the SEC. Investors are urged to consider closely the disclosure in our Form 20-F, “File No. 0-99”, available from us at www.pemex.com or Marina Nacional 329 Floor 38 Col. Huasteca, Mexico City 11311 or at (52 55) 1944 9700. You can also obtain this Form from the SEC by calling 1-800-SEC-0330. EBITDA, free cash-flow and discretionary cash-flow are non-GAAP measures, which are calculated as described above. They are presented because PEMEX believes that they are widely accepted financial indicator of its ability to service or incur debt. EBITDA, free cash-flow and discretionary cash-flow should not be considered as indicators of financial performance, as an alternative to cash flow, as a measure of liquidity, or as being comparable to similarly named measures of other companies. The total debt calculation includes, in addition to documented debt, the items that are usually considered as debt by the financial markets.