pendulum testing of the box culvert posts
TRANSCRIPT
8/24/2007 Page 1 of 40
PENDULUM TESTING OF GUARDRAIL POSTS ON BOX CULVERTS
INTRODUCTION The objective of this project was to develop a guardrail design for typical box culverts
that will meet the safety performance guidelines set forth in National Cooperative Highway Research Program (NCHRP) Report 350. Low-speed pendulum tests were performed on a prototype guardrail post on a simulated box culvert as a surrogate for full-scale crash testing.
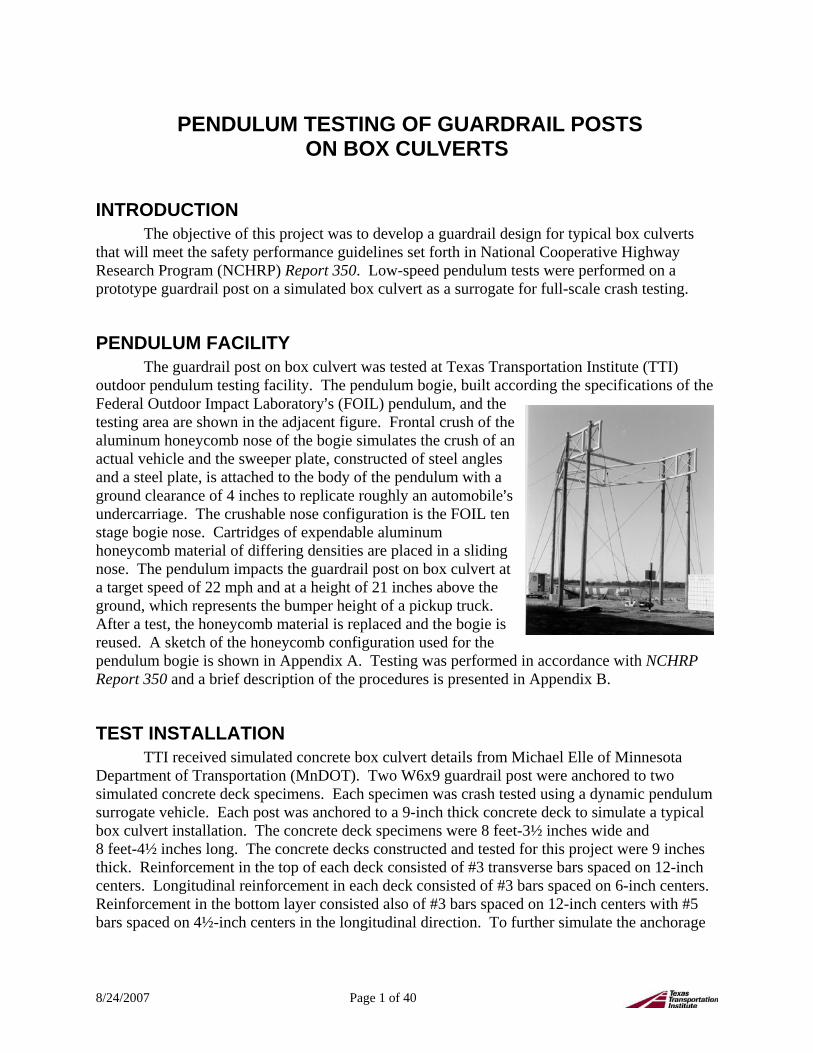
PENDULUM FACILITY The guardrail post on box culvert was tested at Texas Transportation Institute (TTI)
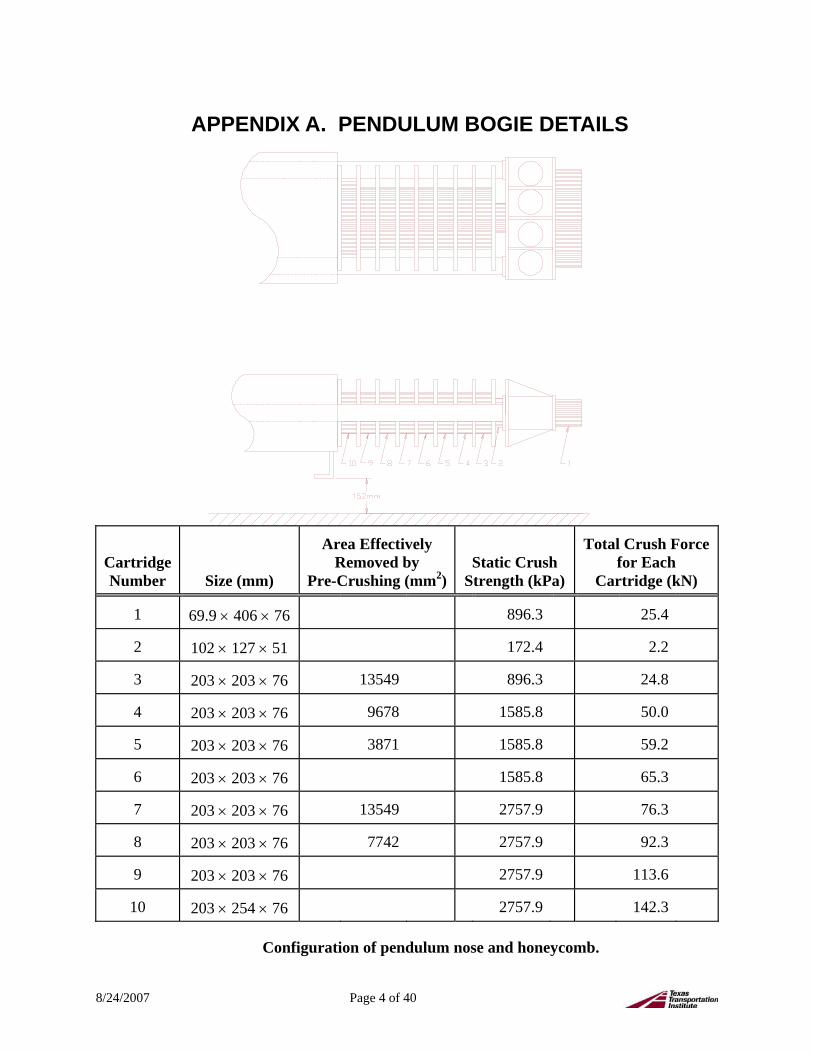
outdoor pendulum testing facility. The pendulum bogie, built according the specifications of the Federal Outdoor Impact Laboratory=s (FOIL) pendulum, and the testing area are shown in the adjacent figure. Frontal crush of the aluminum honeycomb nose of the bogie simulates the crush of an actual vehicle and the sweeper plate, constructed of steel angles and a steel plate, is attached to the body of the pendulum with a ground clearance of 4 inches to replicate roughly an automobile=s undercarriage. The crushable nose configuration is the FOIL ten stage bogie nose. Cartridges of expendable aluminum honeycomb material of differing densities are placed in a sliding nose. The pendulum impacts the guardrail post on box culvert at a target speed of 22 mph and at a height of 21 inches above the ground, which represents the bumper height of a pickup truck. After a test, the honeycomb material is replaced and the bogie is reused. A sketch of the honeycomb configuration used for the pendulum bogie is shown in Appendix A. Testing was performed in accordance with NCHRP Report 350 and a brief description of the procedures is presented in Appendix B.
TEST INSTALLATION TTI received simulated concrete box culvert details from Michael Elle of Minnesota
Department of Transportation (MnDOT). Two W6x9 guardrail post were anchored to two simulated concrete deck specimens. Each specimen was crash tested using a dynamic pendulum surrogate vehicle. Each post was anchored to a 9-inch thick concrete deck to simulate a typical box culvert installation. The concrete deck specimens were 8 feet-3½ inches wide and 8 feet-4½ inches long. The concrete decks constructed and tested for this project were 9 inches thick. Reinforcement in the top of each deck consisted of #3 transverse bars spaced on 12-inch centers. Longitudinal reinforcement in each deck consisted of #3 bars spaced on 6-inch centers. Reinforcement in the bottom layer consisted also of #3 bars spaced on 12-inch centers with #5 bars spaced on 4½-inch centers in the longitudinal direction. To further simulate the anchorage
8/24/2007 Page 2 of 40
to a typical concrete box culvert installation, the posts were anchored 2 ft-4 inches from the edge of the culvert. Additional details are shown in Appendix C.
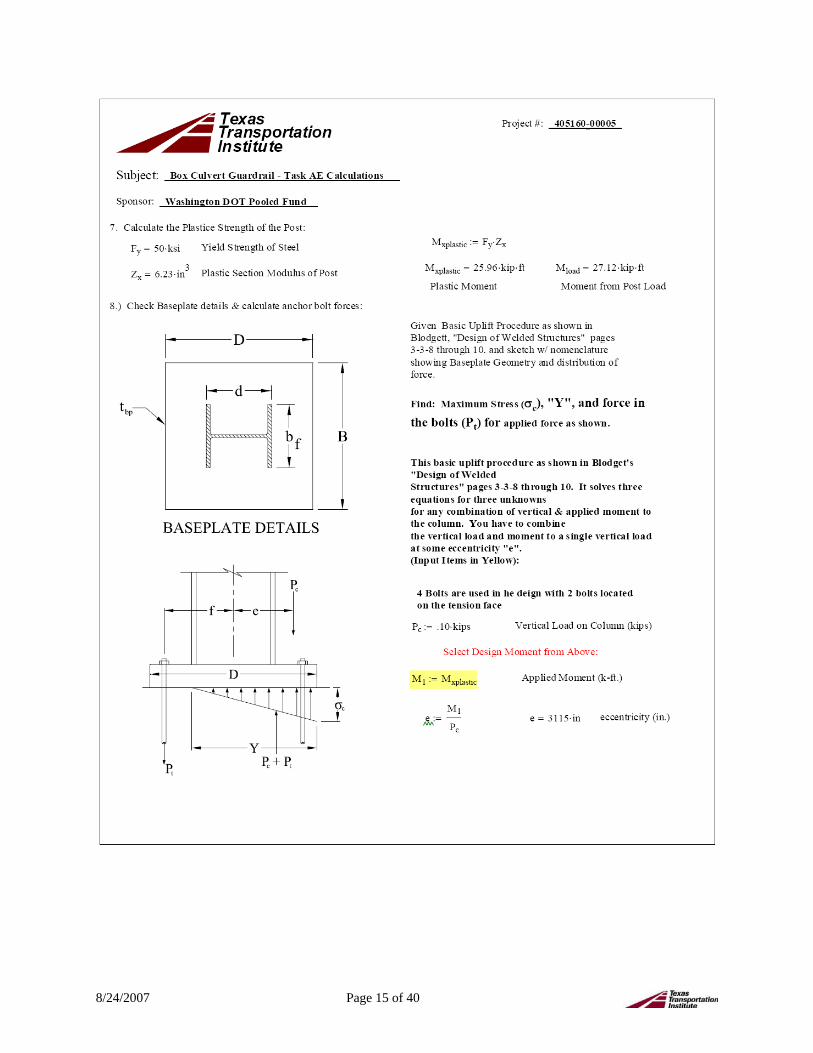
A detailed design of the W6x9 post anchorage and base plate tested was performed. A
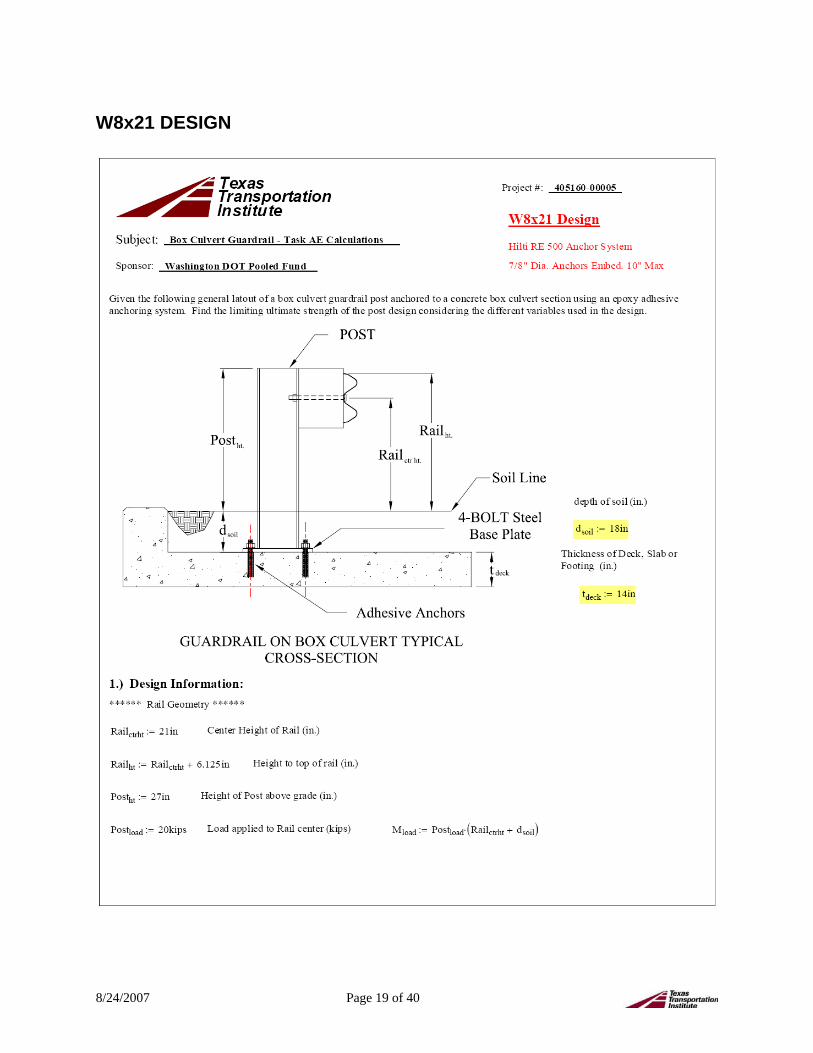
second design utilizing W8x21 posts was also performed. However, based on the proposed frequent use, only the system utilizing W6x9 posts was tested. Based on the information provided by the participating states in this pooled fund project, the preferred anchoring system for post anchorage to the top of the box culvert system was Hilti’s RE 500 Adhesive Anchoring System. The W6x9 posts were welded to 12 inch x 12 inch x 7/8-inch thick base plates and anchored to the 9-inch thick concrete box culvert decks utilizing 7/8-inch diameter super Hilti Anchoring System (HAS) rods. These rods were embedded a minimum of 6 inches into 1-inch diameter drilled holes in the concrete decks and anchored to the deck using Hilti RE 500 Epoxy Anchoring System. A larger base plate utilizing deeper adhesive anchors was designed for the W8x21 posts to simulate anchorage to the top of a concrete footing. The base plate and anchorage designs were based on the minimum strengths to cause plastic failure in the posts. These designs can be utilized for the direct anchorage to either the box culvert or concrete footing without any contribution from soil embedment above the box culvert or footing. The anchorage and base plate designs for both the W6x9 and the W8x21 posts are provided in Appendix D.
TEST RESULTS
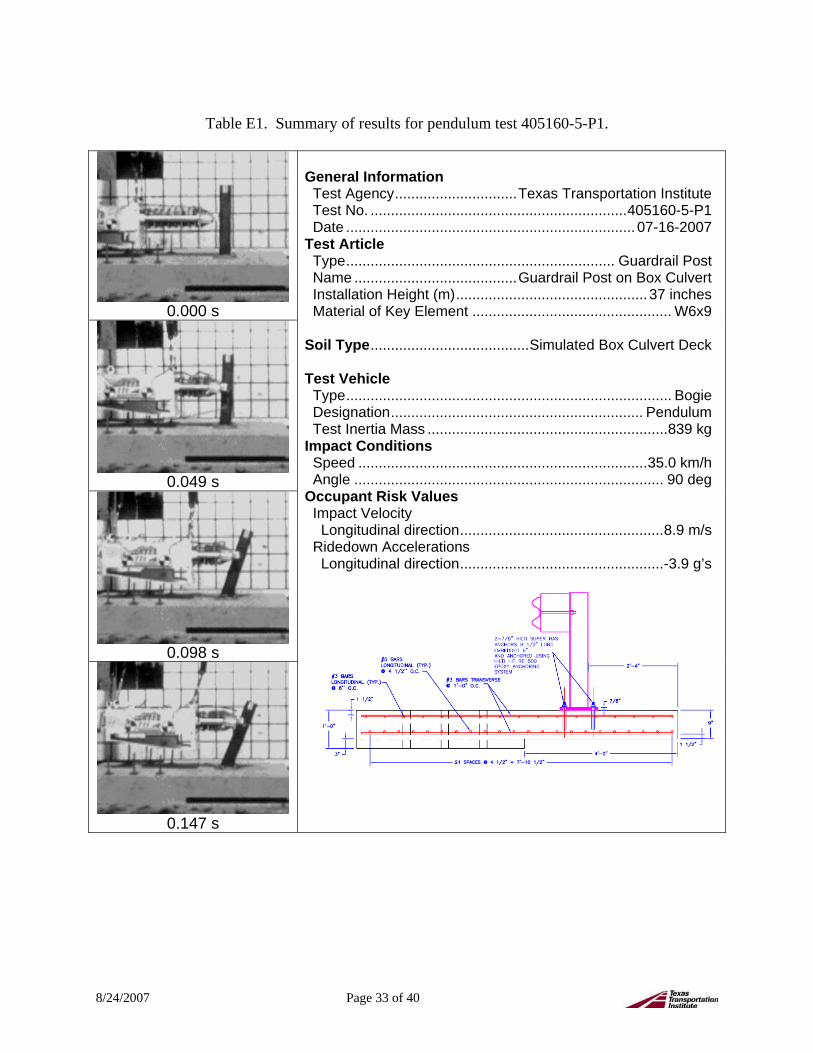
Test P1 The pendulum bogie, traveling at an impact speed of 21.7 mi/h, impacted the guardrail
post at a height of 21 inches. At 0.012 s, the post began to deflect toward the field side, and at 0.017 s, the post returned to its upright position. The post began to deflect toward the field side again at 0.022 s, and the pendulum began to ride up the face of the post at 0.091 s. Forward motion of the pendulum stopped at 0.157 s.
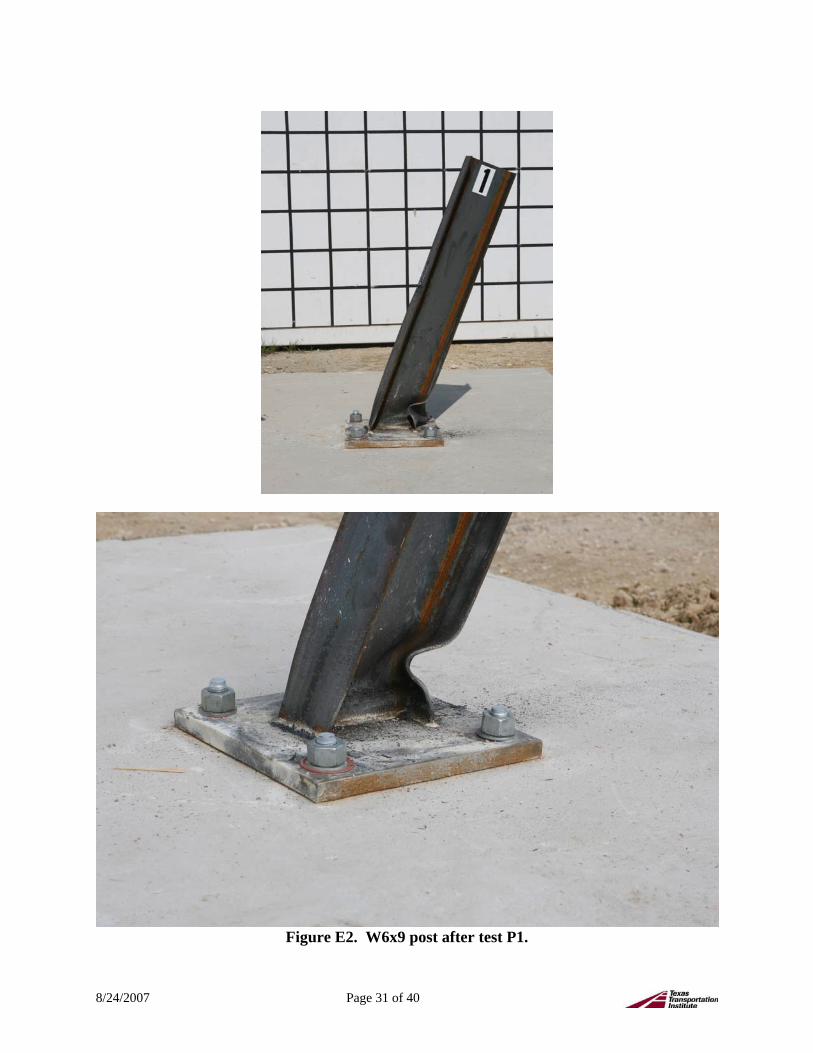
The top of the post was deformed toward field side 10.8 inches. Total crush of the honeycomb nose was 14.0 inches. Photographs of the post before and after the test are shown in Appendix E.
Longitudinal occupant impact velocity was 8.9 m/s, longitudinal occupant ridedown acceleration was -3.9 g’s, and the maximum 50-ms average acceleration was -10.0 g’s. Graphs for this test are shown in Appendix F.
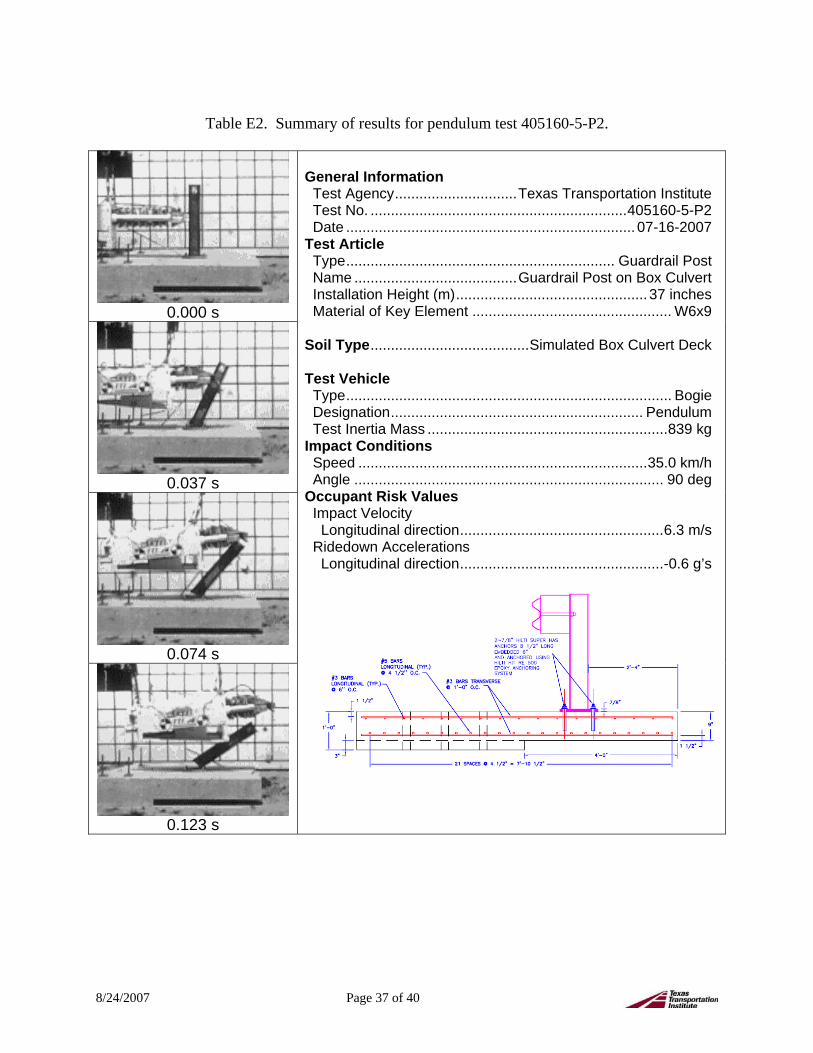
Test P2 The pendulum bogie, traveling at an impact speed of 21.1 mi/h, impacted the guardrail
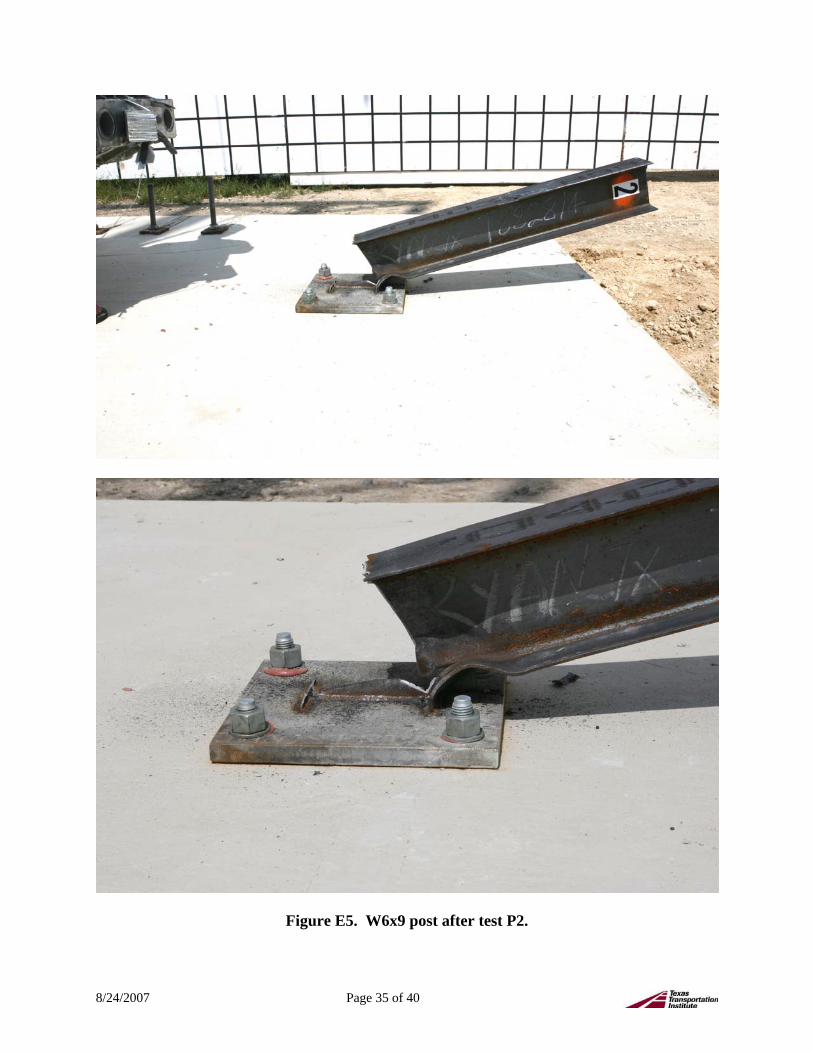
post at a height of 21 inches. At 0.010 s, the post began to deflect toward the field side, and at 0.015 s, the post returned to its upright position. The post began to deflect toward the field side again at 0.020 s, and the pendulum began to ride up the face of the post at 0.067 s. The post began to shear at the front of the base at 0.106 s.
The top of the post was deformed toward field side 10.8 inches. Total crush of the honeycomb nose was 13.7 inches. Photographs of the post before and after the test are shown in Appendix E.

8/24/2007 Page 3 of 40
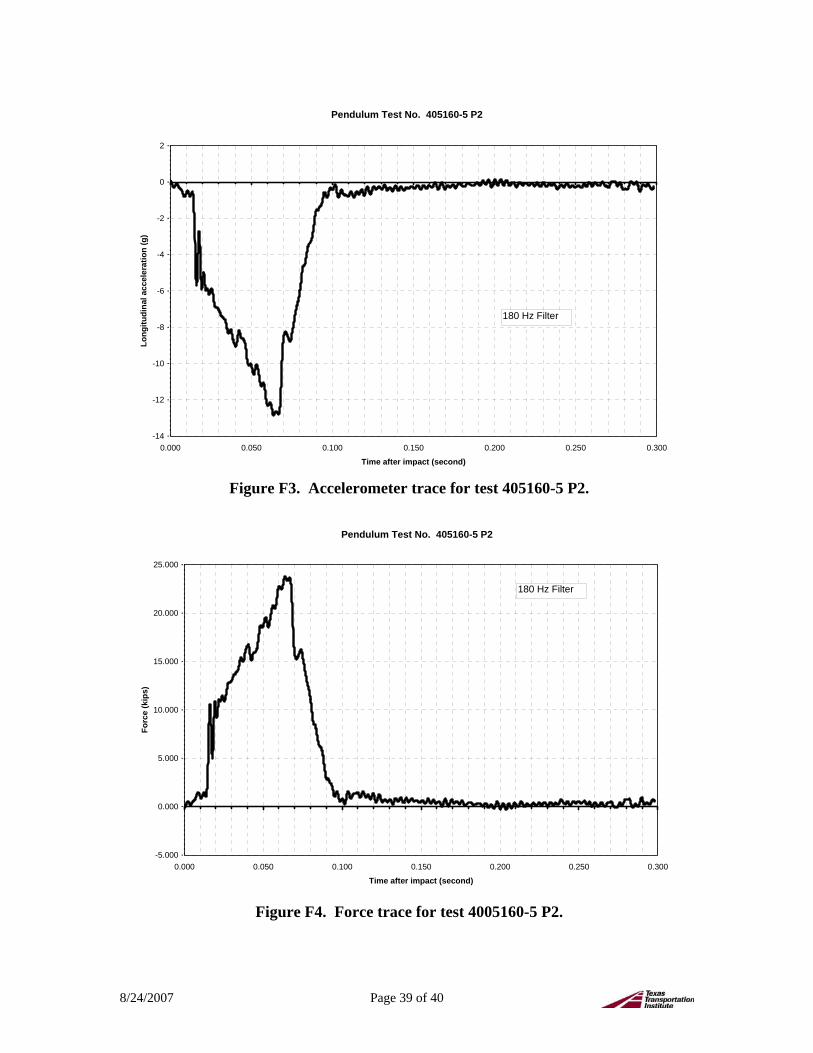
Longitudinal occupant impact velocity was 6.3 m/s, longitudinal occupant ridedown acceleration was -0.6 g’s, and the maximum 50-ms average acceleration was -9.6 g’s. Graphs for this test are shown in Appendix F.
CONCLUSIONS TTI performed low-speed pendulum tests as a surrogate for full-scale crash testing. The
W6x9 post and baseplate design using 7/8-inch high strength anchor rods and anchored using the Hilti RE 500 Adhesive System and presented herein performed well in the full scale tests. Based on the testing results, the W6x9 post and anchorage details presented in this report are recommended for full-scale crash testing.
8/24/2007 Page 4 of 40
APPENDIX A. PENDULUM BOGIE DETAILS
Cartridge Number
Size (mm)
Area Effectively
Removed by Pre-Crushing (mm2)
Static Crush
Strength (kPa)
Total Crush Force
for Each Cartridge (kN)
1
69.9 × 406 × 76
896.3
25.4
2
102 × 127 × 51
172.4
2.2
3
203 × 203 × 76
13549
896.3
24.8
4
203 × 203 × 76
9678
1585.8
50.0
5
203 × 203 × 76
3871
1585.8
59.2
6
203 × 203 × 76
1585.8
65.3
7
203 × 203 × 76
13549
2757.9
76.3
8
203 × 203 × 76
7742
2757.9
92.3
9
203 × 203 × 76
2757.9
113.6
10
203 × 254 × 76
2757.9
142.3
Configuration of pendulum nose and honeycomb.
8/24/2007 Page 5 of 40
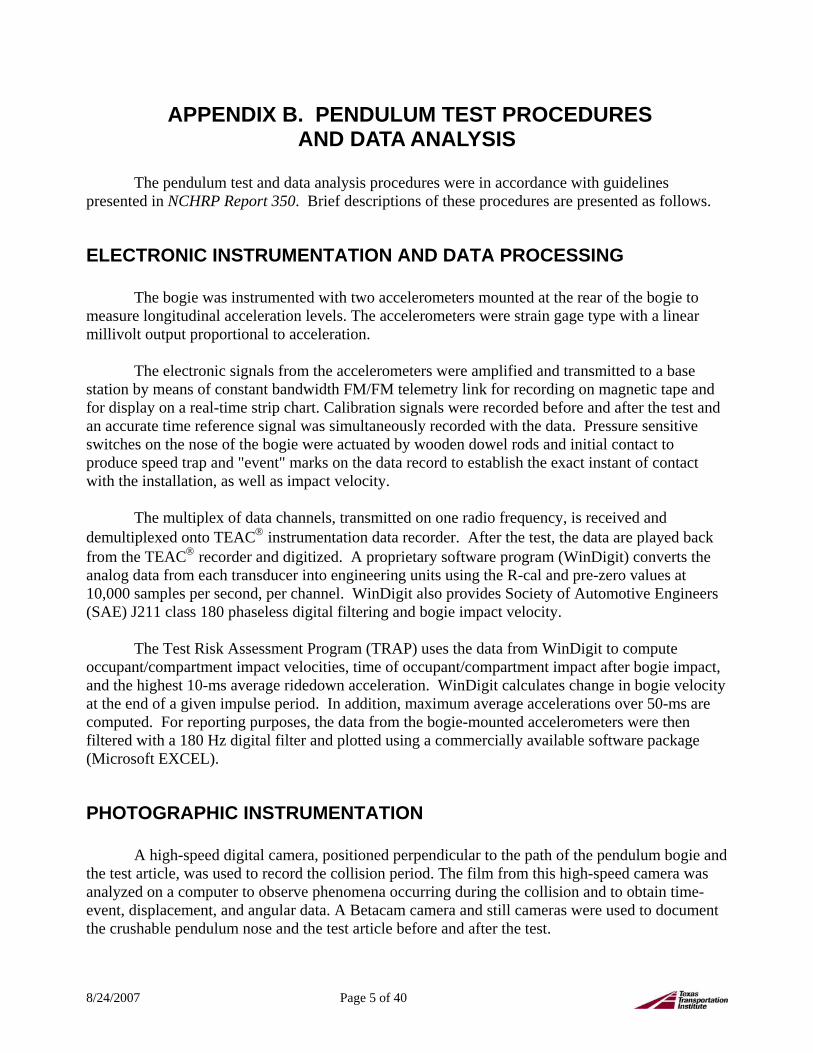
APPENDIX B. PENDULUM TEST PROCEDURES AND DATA ANALYSIS
The pendulum test and data analysis procedures were in accordance with guidelines
presented in NCHRP Report 350. Brief descriptions of these procedures are presented as follows.
ELECTRONIC INSTRUMENTATION AND DATA PROCESSING
The bogie was instrumented with two accelerometers mounted at the rear of the bogie to measure longitudinal acceleration levels. The accelerometers were strain gage type with a linear millivolt output proportional to acceleration.
The electronic signals from the accelerometers were amplified and transmitted to a base station by means of constant bandwidth FM/FM telemetry link for recording on magnetic tape and for display on a real-time strip chart. Calibration signals were recorded before and after the test and an accurate time reference signal was simultaneously recorded with the data. Pressure sensitive switches on the nose of the bogie were actuated by wooden dowel rods and initial contact to produce speed trap and "event" marks on the data record to establish the exact instant of contact with the installation, as well as impact velocity.
The multiplex of data channels, transmitted on one radio frequency, is received and demultiplexed onto TEAC® instrumentation data recorder. After the test, the data are played back from the TEAC® recorder and digitized. A proprietary software program (WinDigit) converts the analog data from each transducer into engineering units using the R-cal and pre-zero values at 10,000 samples per second, per channel. WinDigit also provides Society of Automotive Engineers (SAE) J211 class 180 phaseless digital filtering and bogie impact velocity.
The Test Risk Assessment Program (TRAP) uses the data from WinDigit to compute
occupant/compartment impact velocities, time of occupant/compartment impact after bogie impact, and the highest 10-ms average ridedown acceleration. WinDigit calculates change in bogie velocity at the end of a given impulse period. In addition, maximum average accelerations over 50-ms are computed. For reporting purposes, the data from the bogie-mounted accelerometers were then filtered with a 180 Hz digital filter and plotted using a commercially available software package (Microsoft EXCEL).
PHOTOGRAPHIC INSTRUMENTATION A high-speed digital camera, positioned perpendicular to the path of the pendulum bogie and
the test article, was used to record the collision period. The film from this high-speed camera was analyzed on a computer to observe phenomena occurring during the collision and to obtain time-event, displacement, and angular data. A Betacam camera and still cameras were used to document the crushable pendulum nose and the test article before and after the test.

8/24/2007 Page 6 of 40
APPENDIX C. DETAILS OF TEST ARTICLES

8/24/2007 Page 7 of 40

8/24/2007 Page 8 of 40
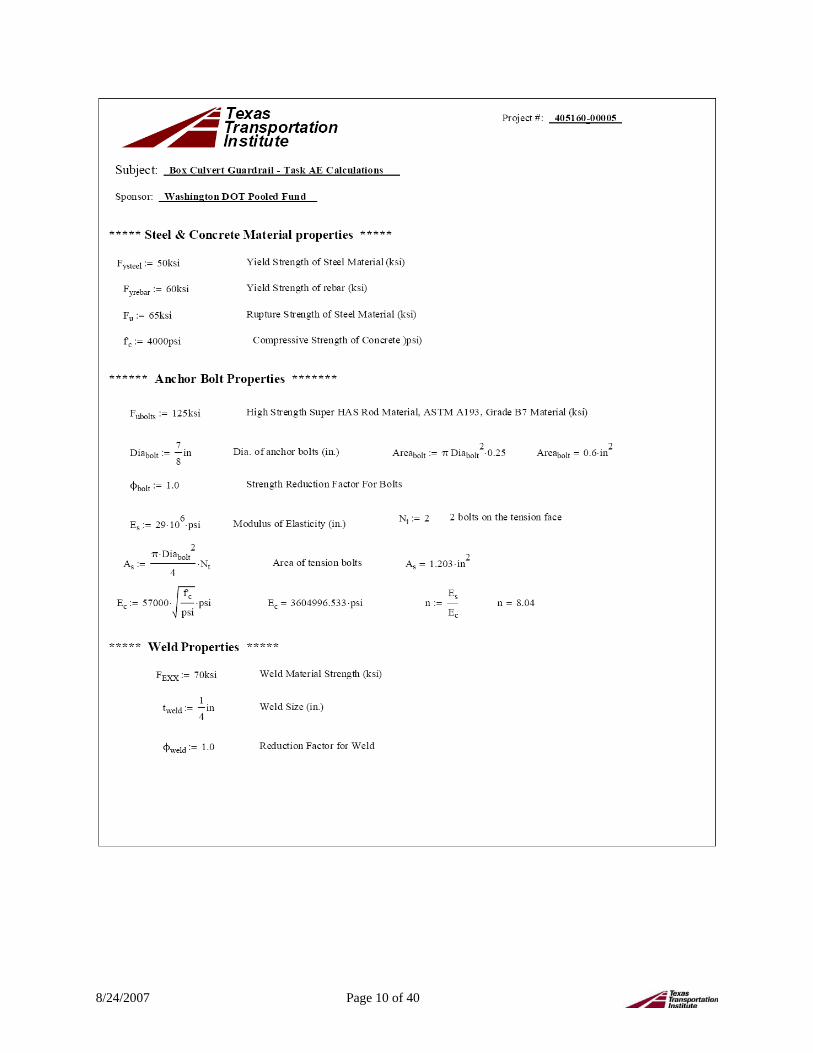
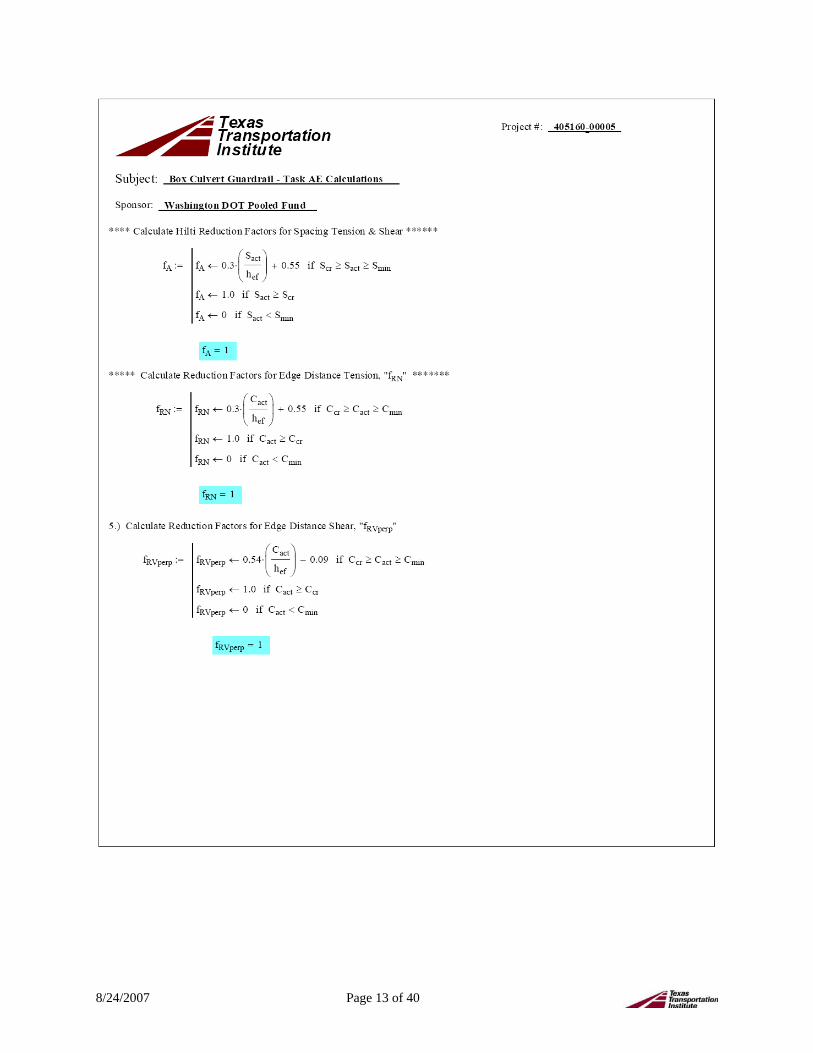
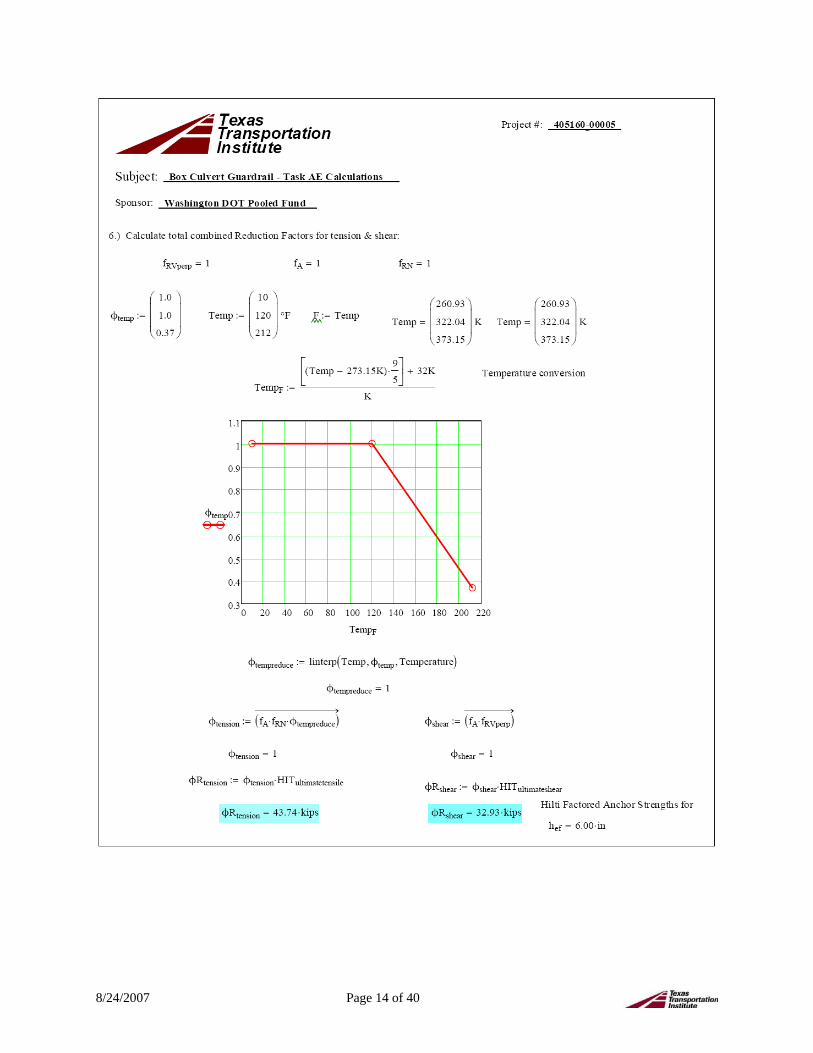
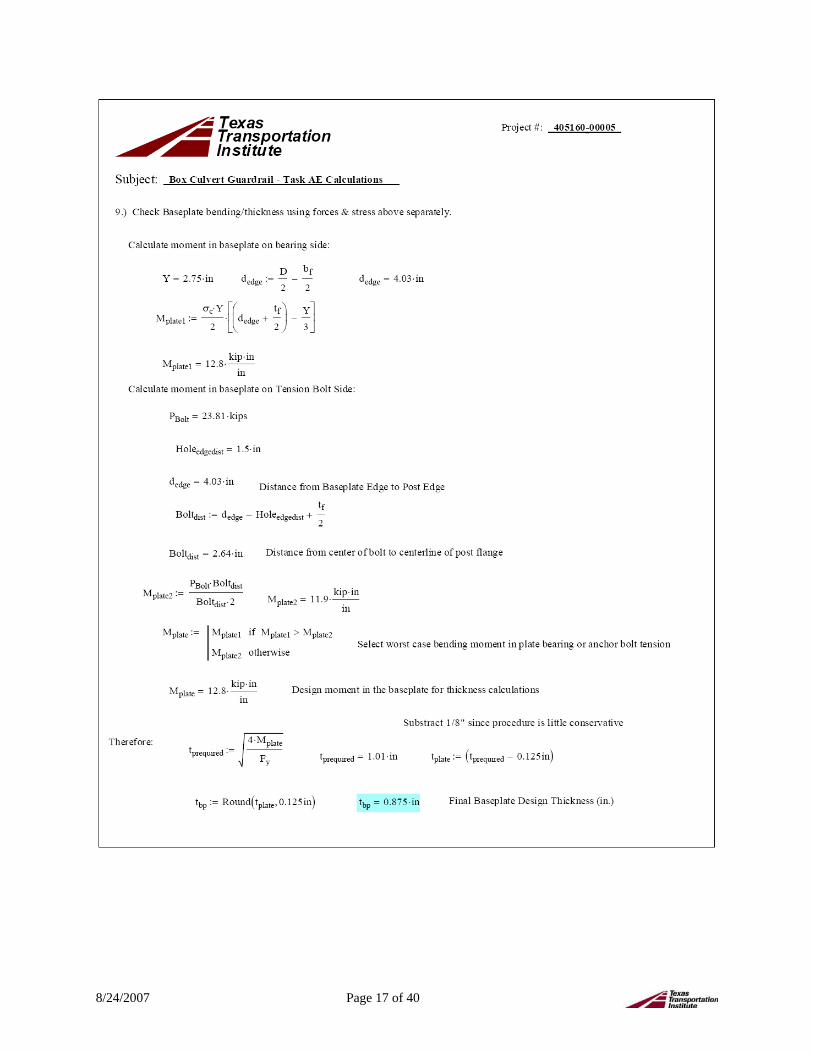
APPENDIX D. DESIGN CALCULATIONS
W6x9 DESIGN
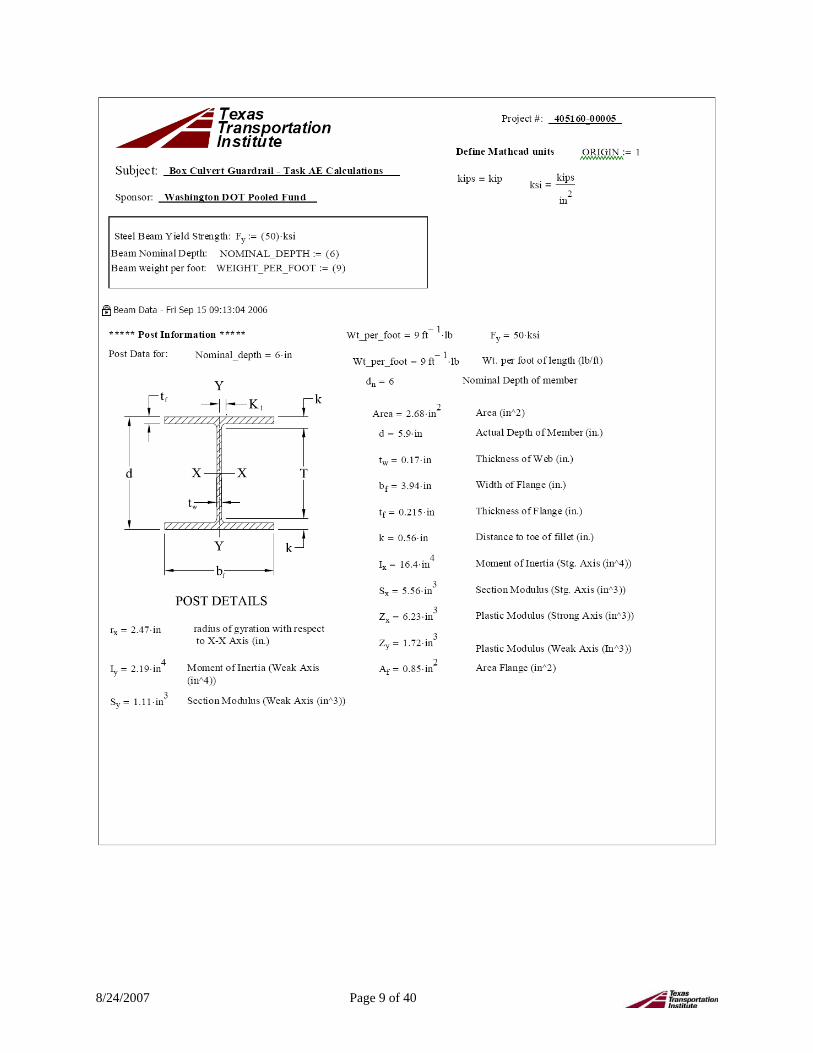
8/24/2007 Page 9 of 40
8/24/2007 Page 10 of 40

8/24/2007 Page 11 of 40

8/24/2007 Page 12 of 40
8/24/2007 Page 13 of 40
8/24/2007 Page 14 of 40
8/24/2007 Page 15 of 40

8/24/2007 Page 16 of 40
8/24/2007 Page 17 of 40

8/24/2007 Page 18 of 40
8/24/2007 Page 19 of 40
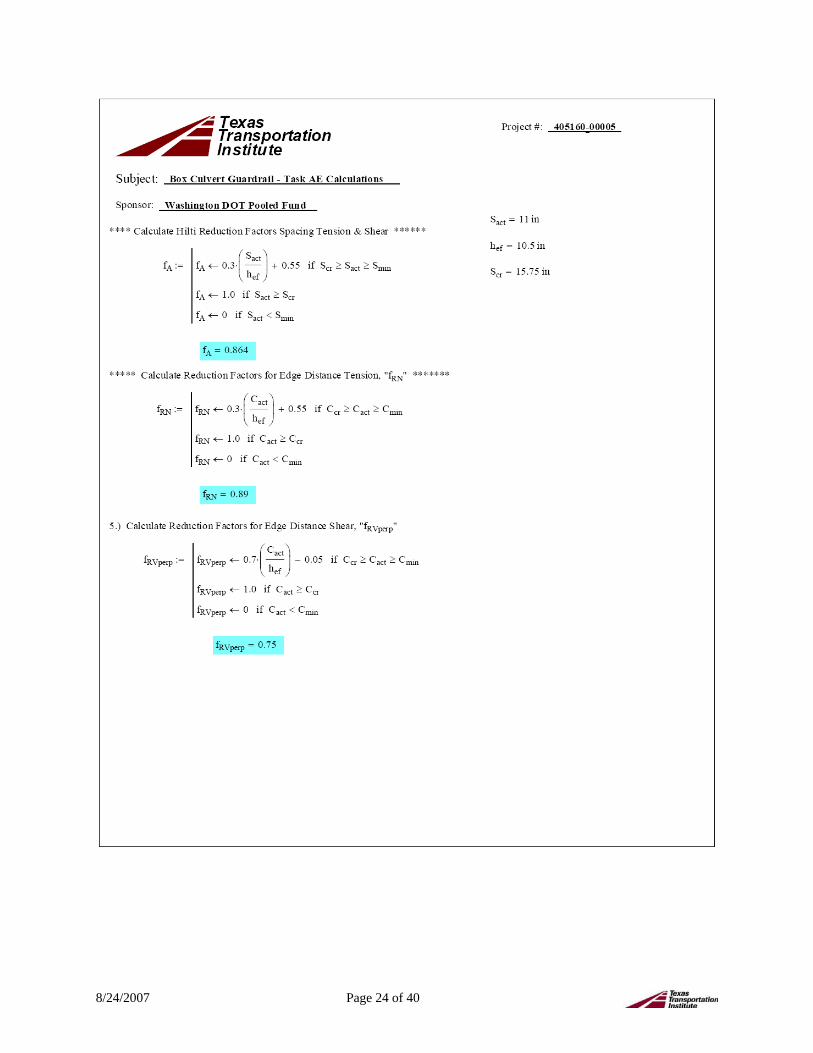
W8x21 DESIGN

8/24/2007 Page 20 of 40

8/24/2007 Page 21 of 40

8/24/2007 Page 22 of 40

8/24/2007 Page 23 of 40
8/24/2007 Page 24 of 40

8/24/2007 Page 25 of 40

8/24/2007 Page 26 of 40
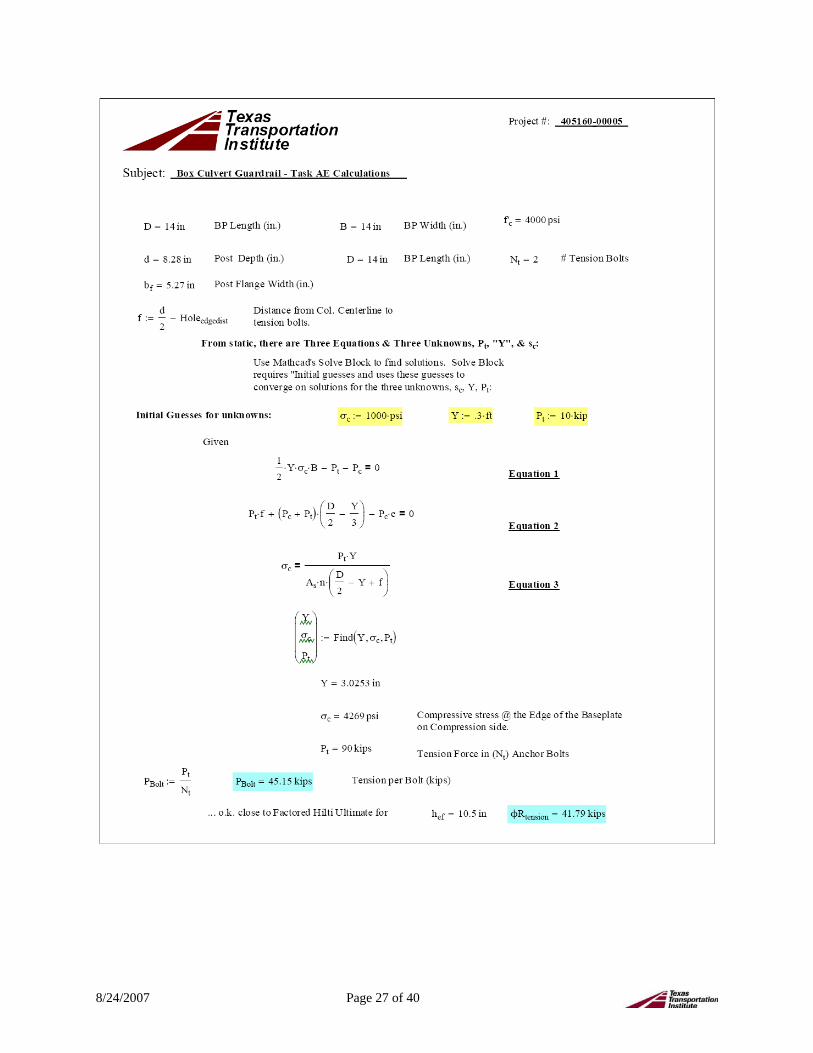
8/24/2007 Page 27 of 40
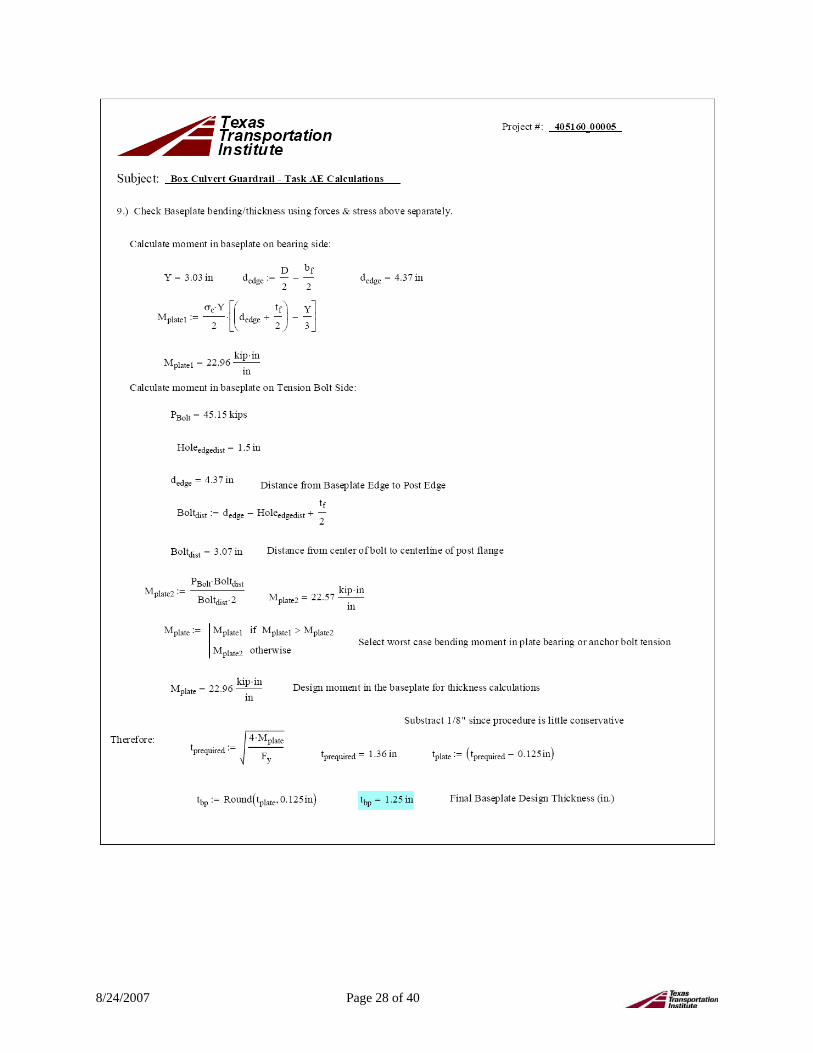
8/24/2007 Page 28 of 40

8/24/2007 Page 29 of 40
8/24/2007 Page 30 of 40
APPENDIX E. PHOTOGRAPHS OF TESTING
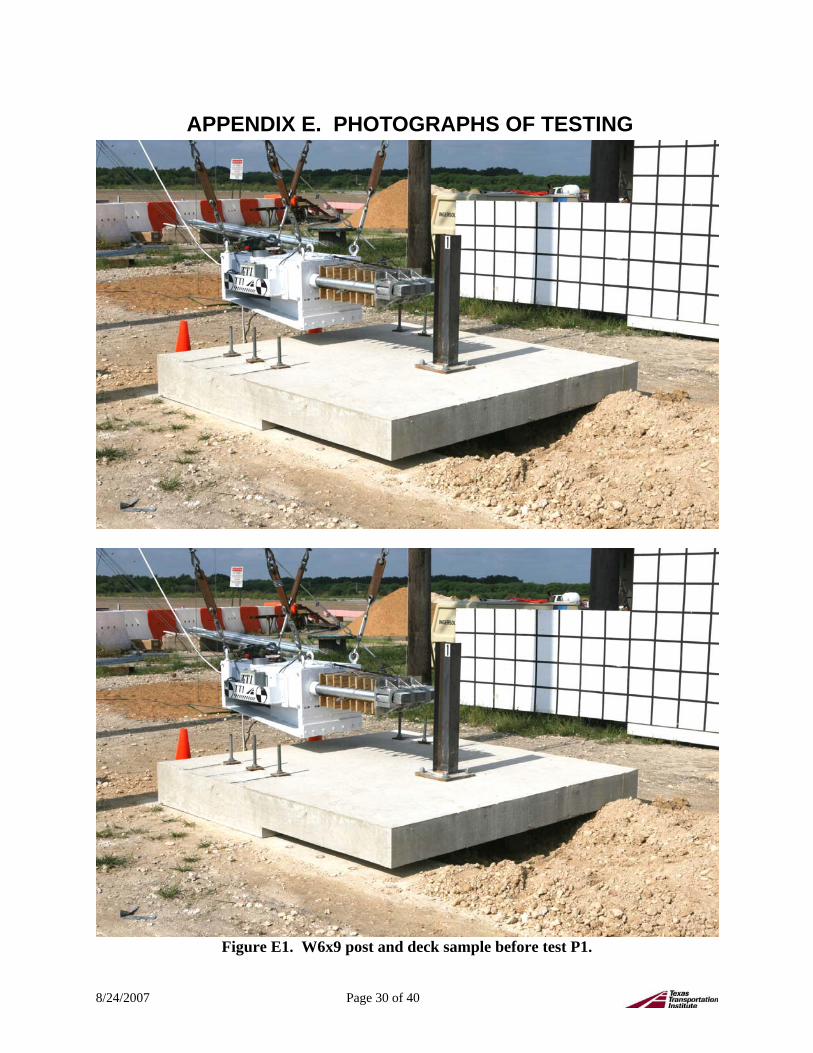
Figure E1. W6x9 post and deck sample before test P1.
8/24/2007 Page 31 of 40
Figure E2. W6x9 post after test P1.

8/24/2007 Page 32 of 40
Figure E3. Pendulum bogie nose before and after test P1.
8/24/2007 Page 33 of 40
Table E1. Summary of results for pendulum test 405160-5-P1.
0.000 s
0.049 s
0.098 s
0.147 s
General Information Test Agency..............................Texas Transportation Institute Test No. ...............................................................405160-5-P1 Date ....................................................................... 07-16-2007 Test Article Type.................................................................. Guardrail Post Name ........................................Guardrail Post on Box Culvert Installation Height (m)............................................... 37 inches Material of Key Element ................................................. W6x9 Soil Type.......................................Simulated Box Culvert Deck Test Vehicle Type................................................................................ Bogie Designation.............................................................. Pendulum Test Inertia Mass ...........................................................839 kg Impact Conditions Speed .......................................................................35.0 km/h Angle ............................................................................ 90 deg Occupant Risk Values Impact Velocity Longitudinal direction..................................................8.9 m/s Ridedown Accelerations Longitudinal direction..................................................-3.9 g’s

8/24/2007 Page 34 of 40
Figure D4. W6x9 post and deck sample before test P2.
8/24/2007 Page 35 of 40
Figure E5. W6x9 post after test P2.

8/24/2007 Page 36 of 40
Figure E6. Pendulum bogie nose before and after test P2.
8/24/2007 Page 37 of 40
Table E2. Summary of results for pendulum test 405160-5-P2.
0.000 s
0.037 s
0.074 s
0.123 s
General Information Test Agency..............................Texas Transportation Institute Test No. ...............................................................405160-5-P2 Date ....................................................................... 07-16-2007 Test Article Type.................................................................. Guardrail Post Name ........................................Guardrail Post on Box Culvert Installation Height (m)............................................... 37 inches Material of Key Element ................................................. W6x9 Soil Type.......................................Simulated Box Culvert Deck Test Vehicle Type................................................................................ Bogie Designation.............................................................. Pendulum Test Inertia Mass ...........................................................839 kg Impact Conditions Speed .......................................................................35.0 km/h Angle ............................................................................ 90 deg Occupant Risk Values Impact Velocity Longitudinal direction..................................................6.3 m/s Ridedown Accelerations Longitudinal direction..................................................-0.6 g’s

8/24/2007 Page 38 of 40
Pendulum Test No. 405160-5 P1
-16
-14
-12
-10
-8
-6
-4
-2
0
2
0.000 0.050 0.100 0.150 0.200 0.250 0.300
Time after impact (second)
Long
itudi
nal a
ccel
erat
ion
(g)
180 Hz Filter
Pendulum Test No. 405160-5 P1
-5.000
0.000
5.000
10.000
15.000
20.000
25.000
30.000
0.000 0.050 0.100 0.150 0.200 0.250 0.300
Time after impact (second)
Forc
e (k
ips)
180 Hz Filter
APPENDIX F. ACCELERATION AND FORCE TRACES
Figure F1. Accelerometer trace for test 405160-5 P1.
Figure F2. Force trace for test 4005160-5 P1.
8/24/2007 Page 39 of 40
Pendulum Test No. 405160-5 P2
-14
-12
-10
-8
-6
-4
-2
0
2
0.000 0.050 0.100 0.150 0.200 0.250 0.300
Time after impact (second)
Long
itudi
nal a
ccel
erat
ion
(g)
180 Hz Filter
Pendulum Test No. 405160-5 P2
-5.000
0.000
5.000
10.000
15.000
20.000
25.000
0.000 0.050 0.100 0.150 0.200 0.250 0.300
Time after impact (second)
Forc
e (k
ips)
180 Hz Filter
Figure F3. Accelerometer trace for test 405160-5 P2.
Figure F4. Force trace for test 4005160-5 P2.

8/24/2007 Page 40 of 40
APPENDIX G. VIDEOS
TEST 405160-5-P1 VIDEO 405160-P1 -- real time 405160-P1 -- high-speed
TEST 405160-5-P2 VIDEO 405160-P2 -- real time 405160-P2 -- high-speed