pennsylvania game commission wind … game commission wind energy voluntary cooperation agreement...
TRANSCRIPT
PENNSYLVANIA GAME COMMISSION
WIND ENERGY VOLUNTARY COOPERATION AGREEMENT
SECOND SUMMARY REPORT
Tracey Librandi Mumma, Wildlife Biologist III
William Capouillez, Director
Bureau of Wildlife Habitat Management
March 4, 2011 (Revised March 16, 2011)

2
TABLE OF CONTENTS` PAGE
Acknowledgements 3
Executive Summary 4
Introduction/Background 8
Cooperators 8
Non-cooperators 9
Objectives and Goals 10
Risk Assessments and PGC Review of Projects 10
Pennsylvania Wind Project Site Location 11
Survey Results Summary 13
Pre-construction Results 15
Birds: Raptor Migration Surveys 15
Birds: Breeding Bird Surveys 18
Birds: Species of Special Concern Surveys 20
Bats: Potential Hibernacula Investigations 20
Bats: Acoustic Monitoring 21
Bats: Mist Net Surveys 23
Bats: Telemetry 23
Other Mammals of Special Concern Surveys 25
Post-construction Results 26
Mortality 26
Bat Mortality 27
Bird Mortality 31
Mortality in Relation to Turbine 34
Searcher Efficiency 35
Scavenger Removal 35
Incidental Mortality 36
Large Mortality Events 37
Eagle Mortality 37
Threatened and Endangered Species Mortality 37
Mortality – Weather Correlation 38
Can Mortality be Predicted? 38
Post-construction Raptor Migration Surveys 38
Post-construction Bat Acoustic Surveys 40
Post-construction Radar Surveys 41
Correlation between Pre-construction Breeding Bird Surveys and
Post-construction Mortality 41
Post-construction Woodrat Surveys 41
Contributions to Other Wind Related Studies 41
Significant Findings From Cooperator Surveys 42
Best Management Practices 42
Avoidance, Minimize, and Mitigation 43
Research 44
Overall Successes/Challenges 45
Future 46
References 48
Appendices 50
3
ACKNOWLEDGEMENTS
We thank our colleagues in the Pennsylvania Game Commission who provided helpful
comments and contributions to earlier drafts of this report particularly Stacy Wolbert, Douglas
Gross, Calvin Butchkoski, and Catherine Haffner. In addition, several wind energy Cooperators
provided useful feedback to enhance this document, namely AES, Acciona Wind Energy USA,
LLC, Edison Mission Energy, E.ON Climate and Renewables North America Inc., Gamesa
Energy USA, and PPL Renewables Energy, LLC. We thank all of the Pennsylvania Game
Commission Voluntary Wind Energy Agreement Cooperators for their continued efforts to
minimize impacts to wildlife.
Cooperator Date Signed
AES 04/18/2007
E. ON Climate & Renewables North America, Inc. 04/18/2007
Competitive Power Ventures, Inc. 04/18/2007
Energy Unlimited, Inc. 04/18/2007
Freedom Wind Energy, LLC 04/18/2007
Gamesa Energy USA 04/18/2007
Iberdrola Renewable Energies USA 04/18/2007
PPM Atlantic Renewable 04/18/2007
ReEnergy, LLC 04/18/2007
First Wind 04/18/2007
US Wind Force 04/18/2007
Acconia Wind Energy USA, LLC 08/20/2007
Global Winds Harvest, Inc. 08/20/2007
Penn Wind 09/28/2007
Laurel Hill Wind Energy, LLC 01/08/2008
Everpower Renewables 02/01/2008
AMP-Ohio/MESA 02/15/2008
Lookout Windpower, LLC 03/21/2008
Forward Windpower, LLC 03/21/2008
BP Alternative Energy 06/24/2008
Wind Park Bear Creek, LLC 04/03/2009
Invenergy Wind Development, LLC 06/01/2009
Tuthill Corporation Dba Blue Mountain Ski Area 12/18/2009
PPL Renewable Energy LLC 12/29/2009
New Tech Wind Inc. 12/30/2009
Duke Energy 02/16/2010
Apex Wind Energy Holdings LLC 03/10/2010
Allegheny Ridge Wind Farm LLC 06/03/2010
Volkswind USA 07/20/2010

4
EXECUTIVE SUMMARY
The Pennsylvania Alternative Energy Portfolio Standards Act, signed in 2004, requires
that 18% of electricity sold to retail customers come from renewable energy sources within 15
years. To further understand, avoid, and minimize potential impacts to wildlife and its habitat
from wind energy development, the Pennsylvania Game Commission (PGC) worked
collaboratively with the wind industry to develop a Voluntary Wind Energy Cooperative
Agreement (Cooperative Agreement) in 2007. The Cooperative Agreement requires at least one
year of standardized pre-construction surveys and two years of standardized post-construction
mortality monitoring at proposed or active wind energy facilities. Effort level for surveys is
determined by assigned risk levels designated by the PGC using criteria outlined in the
Cooperative Agreement. The results of pre-construction surveys are used by the PGC to
prescribe avoidance and minimization measures whereas post-construction monitoring enables
the PGC to assess the impacts of wind energy development to wildlife in Pennsylvania and apply
adaptive management techniques to further avoid, minimize, and mitigate wildlife impacts. This
report summarizes pre- and post-construction survey data gathered by Cooperators through June
30, 2010.
During that time, 28 Cooperators were signatories of the Cooperative Agreement,
representing 73% of wind projects in Pennsylvania, and 88% of the total number of
developers who have active operations in Pennsylvania. See the Cooperators section for
further information.
Over 150 wildlife surveys have been conducted by Cooperators since 2007, resulting in
better turbine placement to minimize potential impacts, protection of bat roosting
locations, abandonment of sites for development, and start of the assessment process to
further understand the scale of mortality at Pennsylvania wind sites. See the Survey
Results Summary section for further information.
o Most sites observed at least one bald eagle (Haliaeetus leucocephalus) or golden
eagle (Aquila chrysaetos) during pre-construction raptor surveys but, unlike the
fall surveys, it appears that eagle observations in the spring are related to raptor
risk level. High risk sites tended to have higher counts of bald and golden eagles
compared to lower raptor risk sites, suggesting that the current PGC pre-
construction risk assessment designations may be appropriate. However, to date
no post-construction eagle mortality has been documented at any Pennsylvania
wind site.
o A short-eared owl (Asio flammeus) presence/absence survey was conducted in
2009 at one site and no short-eared owls were documented during the survey.
While the Cooperator is responsible for conducting all surveys required within the
project area, PGC staff was able to help reduce monitoring costs for this
Cooperator by conducting the winter portion of this survey. The Cooperator
conducted the nesting survey.

5
o Due to issues regarding the collection, recording, and submission of bat acoustic
surveys, the PGC will draft additional guidance prior to the 2011 bat acoustic
survey season to address these inconsistencies.
o Telemetry surveys conducted in 2008 on eastern small-footed (Myotis leibii) and
Indiana bats (Myotis sodalis) yielded new capture locations, roost locations, and
foraging areas for both species. This new information has since been submitted
for inclusion into the Pennsylvania Natural Diversity Inventory (PNDI). See the
Bats: Telemetry section for further information.
o A new hibernaculum containing the federally and state-listed endangered Indiana
bat was located in 2009. Also, telemetry of eastern small-footed bats documented
roost locations and foraging areas that were submitted for inclusion into PNDI.
See the Bats: Telemetry section for further information.
o A Cooperator at a site where fresh and old Allegheny woodrat (Neotoma
magister) sign was documented has committed to conducting additional studies,
including pre-and post-construction trapping of woodrats to determine the impacts
of the wind facility on the active population in the area. At a second site where
only old woodrat sign was documented, the site plan was adjusted to exclude the
area where old woodrat sign was documented.
o The average estimated bats/turbine/year for the five surveys that followed PGC
protocol was 24.6 (range 6.8 – 42.7). Hoary bats (Lasiurus cinereus) comprised
30% of bat mortality documented at cooperating wind facilities. Adult male bats
were documented more often than juvenile or female bats. No threatened or
endangered bat mortalities have been documented. However in 2009, two
Seminole bat (Lasiurus seminolus) fatalities were documented at one site during
post-construction mortality monitoring surveys. Seminole bats are known to
occur in Pennsylvania, but are uncommon. The two carcasses were in excellent
condition and one was submitted to the Carnegie Museum of Natural History,
Pittsburgh and the second to The State Museum of Pennsylvania, Harrisburg to be
preserved as voucher specimens.
o The average estimated birds/turbine/year for seven of the eleven surveys that
followed PGC protocol was 3.9 (range 1.7 – 9.8). Passerines accounted for the
largest portion of bird mortality at wind sites, including three migrants that are
listed as endangered breeding birds in Pennsylvania. All three fatalities occurred
in September 2009 with one being documented at each of three different wind
sites. The three endangered birds documented were two blackpoll warblers
(Dendroica striata) and one yellow-bellied flycatcher (Empidonax flaviventris).
All three were determined to be migrants (i.e. not from the local breeding
population) by the PGC due to the lack of breeding habitat in the vicinity and the
time of year mortalities occurred.
o Cooperators did not document any large kills (greater than 50 animals in a single
day event).

6
Contributions to other wind related studies were made using specimens collected at the
various Pennsylvania wind sites. A total of 1,109 samples (hair and/or tissue) were
submitted to Eric Britzke of United States Army Corps of Engineers, Engineer Research
and Development Center, Vicksburg, MS for use in various ongoing bat genetic studies.
Twenty-four bat heads were submitted to the Center for Disease Control Rabies
Laboratory, Atlanta, GA for a study investigating the prevalence of rabies infection in
bats that are struck by wind turbines. Wing scores from 830 bats were submitted for use
in the study entitled White Nose Syndrome: Multi-state Coordination, Investigation and
Response to an Emerging Wildlife Health Threat. See the Contributions to other wind
related studies section for further information.
The PGC, in cooperation with the Pennsylvania Wind and Wildlife Collaborative and
Cooperators, drafted best management practices. See Appendix G for further
information.
Indiana Bat Conservation Fund (IBCF) has been established to provide a dedicated
source of funding that will 1) ensure that the direct, indirect, and cumulative adverse
effects on the federally and state-listed endangered Indiana bats are adequately offset
within the Pennsylvania and 2) result in tangible conservation and recovery benefits to
the Indiana bat within the Commonwealth of Pennsylvania. It is agreed and understood
that the IBCF will not be used for reviews of wind power projects, unless the wind
developer has signed onto the PGC Cooperative Agreement and is in compliance with
that Agreement. See the Mitigation efforts section for further information.
Research at Cooperator wind sites in PA, on bat deterrents and curtailment has shown
promise to reduce bat mortality at operational wind sites. See the Overall
Success/Challenges section for further information.
The Commonwealth established a new Right-to-Know Law 65 P.S. §§ 67-101-67.3103,
effective January 1, 2009. That law changed the definition of public record and expanded
the categories of documents that are exempt from disclosure. In order to clarify for the
PGC and the public how the new Right-to-Know law will be implemented by the PGC,
the PGC Commissioners unanimously voted on April 20, 2010 to amend 58 Pa. Code to
include §131.9 (Disclosure of certain records). With regard to wind power records, the
amendment stated: In accordance with the Right-to-Know law (65 P.S. §§ 67-101-
67.3103), public access to the following records, wherever located, will and shall only be
made as set forth in paragraphs (1) – (4) below: (1) Wind power records. Commission
annual reports and Pennsylvania Natural Heritage Program clearance correspondence
respecting existing or proposed wind power facilities will be provided upon request, but
redacted as necessary. All other records are pre-deliberative, proprietary or tending to
identify the location of threatened or endangered species and will not be disclosed. This
change was, in part, needed to better protect the species of concern data collected by the
wind energy cooperators‟ voluntary monitoring efforts. See the Overall
Success/Challenges section for further information.

7
The Cooperative Agreement has allowed Pennsylvania to become one of the national leaders in
determining and addressing wildlife impacts from wind energy development. The collaborative
efforts between the wind industry and the PGC will continue to provide all involved parties with
valuable information needed to best manage wildlife at wind energy sites. Cooperators have
proven to be partners in developing conscientious renewable energy with the highest regard to
the Commonwealth‟s wildlife resources and have set an example that others should aspire to
follow.

8
INTRODUCTION/BACKGROUND
Act 213 of 2004, the Alternative Energy Portfolio Standards Act, signed into law by
Governor Edward G. Rendell on November 30, 2004, requires that 18% of the electricity sold to
retail customers in Pennsylvania come from renewable and advanced energy sources within 15
years. One of the technologies that will compete for a substantial share of Pennsylvania‟s
alternative energy market is wind power. Under the direction of William A. Capouillez, Bureau
Director of Wildlife Habitat Management, the Pennsylvania Game Commission (PGC) worked
collaboratively with numerous wind energy developers (Cooperators) to immediately address
potential impacts to the Commonwealth‟s bird and mammal resources.
As a result of this partnership, PGC biologists from the Bureaus of Wildlife Habitat Management
and Wildlife Management, who have expertise in Pennsylvania bats, birds, and threatened and
endangered bird and bat species and their habitats, drafted the PGC Wind Energy Voluntary
Cooperative Agreement (Cooperative Agreement) in 2007. The Cooperative Agreement draft
was then presented to all available wind energy developers as well as the Pennsylvania Wind and
Wildlife Collaborative to further facilitate both natural resource agencies and non-governmental
organizations input. The Cooperative Agreement was finalized and the first Cooperators signed
the agreement on April 18, 2007 after a public news release and formal ceremony was held.
To effectively implement the Cooperative Agreement, the PGC created four limited-term
wildlife biologist positions dedicated to wind energy in 2007; a statewide wind energy project
coordinator based in Harrisburg in the Bureau of Wildlife Habitat Management and three field
support positions that are responsible for two of the six PGC operational regions. The support
positions are based in the Southwest region (NW/SW), Northcentral region (NC/SC), and
Northeast region (NE/SE). The field support positions were strategically placed in regions of the
state to meet the anticipated workload of project reviews and monitoring where the greatest
project development was occurring. Wildlife management supervisors in each of these regions
oversee the support positions and work with the statewide coordinator to manage PGC program
implementation. The wind energy project coordinator position had been vacant since August
2009 and, as of June 30, 2010, two of the three support positions remained vacant. The
Commonwealth‟s hiring freeze severely impacted the Commission‟s ability to fill these
vacancies. However, some progress has been made (wind energy project coordinator position
was filled in August 2010) and the Commission is hopeful that full staffing will exist in 2011.
This report summarizes pre- and post-construction survey data gathered by Cooperators through
June 30, 2010. For an in-depth review of the Cooperative Agreement and its accompanying
protocols, and/or for more background information on the Cooperative Agreement, which can be
found in the first annual report, go to the PGC‟s public website at www.pgc.state.pa.us, click on
“Wildlife”, “Habitat Management”, and then click on “Wind Energy.”
COOPERATORS
On April 18, 2007, 12 Cooperators entered into the Cooperative Agreement: AES
Headwaters Wind; AES Keystone Wind; E.ON Climate & Renewables North America (formerly
Airtricity, Inc.); Competitive Power Venture, Inc.; Energy Unlimited; Freedom Wind Energy;
Gamesa Energy USA; Iberdrola Renewable Energies USA; PPM Atlantic Renewable; ReEnergy;

9
First Wind (formerly UPC Wind Management); and US Wind Force. Between April 18, 2007
and June 30, 2010, an additional 16 Cooperators entered into the Agreement for a total of 28. The additional Cooperators were Acconia Wind Energy USA; Allegheny Ridge Wind Farm;
AMP-Ohio/MESA; BP Alternative Energy; Everpower Renewable; Forward and Lookout
Windpower; Global Winds Harvest, Inc.; Laurel Hill Wind Energy; Penn Wind, Wind Park Bear
Creek; Invenergy Wind Development; Tuthill Corporation Dba Blue Mountain Ski Area; PPL
Renewable Energy; New Tech Wind Inc.; Duke Energy; and Apex Wind Energy Holdings. As
of June 30, 2010, no Agreements had been terminated by either party (Cooperator or PGC).
The Cooperators‟ wind projects represent 73% (63 of the 86) of the wind projects that the PGC
was aware of through June 30, 2010. Of the 63 Cooperator-owned projects, 19 were
grandfathered into the Agreement, meaning the projects were either planned for construction
within one year of entering the Cooperative Agreement or were already built and thus were only
required to perform post-construction surveys. Table 1 summarizes the status of wind energy
projects in Pennsylvania as of June 30, 2010.
Table 1. Status of wind energy projects in Pennsylvania as of June 30, 2010.
Cooperator Non-Cooperator Total
Active 11 5 16
Mega-Watts 619 129 748
Total turbines 333 87 420
Proposed 52 18 70
New 44 18 62
Grandfathered 8 N/A 8
Total projects 63 23 86
NON- COOPERATORS
There are five additional wind energy developers in Pennsylvania with active or proposed
wind sites who have not signed the Cooperative Agreement. These companies include a
subsidiary of Florida Power & Light Energy, NextEra Energy Resources (five active wind sites),
Reading Anthracite (one proposed wind site), STK Renewables (three proposed wind sites),
OwnEnergy (two proposed wind sites), and Laurel Highlands Energy (three proposed wind
sites). There are an additional eight sites in early stages of project proposal for which the
potential developer has not been identified.
The PGC is currently investigating the monitoring efforts and site mortality of bats and birds of
those non-Cooperators, prioritized by project site location and risk assessment from the PGC‟s
internal reviews. These investigative efforts by the PGC will be directed towards assuring that
all projects, including non-Cooperators, are employing feasible measures of protection and
minimization of adverse impacts, which are anticipated to occur to the Commonwealth‟s bat and
bird resources.
Currently, very few wind developers with active wind sites in Pennsylvania have not signed the
PGC Cooperative Agreement and are not conducting post-construction monitoring. The most
significant developer not signed into the Cooperative Agreement, that currently has the largest

10
projects, greatest number, and highest risk projects in Pennsylvania, is Florida Power & Light
Energy‟s subsidiary, NextEra Energy Resources. Developers that have bat mortality continue to
be investigated so the PGC can determine the proper course of action to safeguard and conserve
bat and bird species with regard to mortality from wind energy facility operation. In fact,
NextEra Energy Resources has received written warnings and several letters from the PGC
regarding their post-construction monitoring efforts at their five active wind facilities in
Pennsylvania. Each time the PGC has investigated sites not enrolled in the Cooperative
Agreement, three times over the last two years, the PGC has found evidence of mortality. Some
of the bat carcasses found during these investigations were tested and found to have evidence of
barotrauma, indicating the cause of mortality was the operation of the wind facility. The PGC
will continue to investigate all wind sites, paying careful attention to those not signed into the
Cooperative Agreement, in an effort to further ascertain what avenues, including potential legal
action, may be deemed appropriate to safeguard and conserve bat and bird species within the
project area.
OBJECTIVES & GOALS
For an in depth review of the Cooperative Agreement pre-and post-construction
objectives and goals, please reference the Cooperative Agreement and the 1st Annual Report
which can be found on the PGC‟s public website at www.pgc.state.pa.us, click on “Wildlife”,
“Habitat Management”, and then click on “Wind Energy.”
RISK ASSESSMENTS & PGC REVIEW OF PROJECTS
The risk assessments assigned for bats and raptors dictates what surveys and level of
effort are required. Risks associated with specific bird and mammal species of special concern
are addressed separately through targeted surveys. The PGC, using the criteria listed in the
Cooperative Agreement, determines the risk level for monitoring and survey efforts. The
Cooperative Agreement protocols use the term „priority level‟ rather than „risk level‟. These
terms are related and can be used interchangeably. For example, a high risk raptor site is also a
high priority site for raptor surveys. The risk level may be adjusted based on new, relevant
information. From 2007-2008, bat risk level increased from low to high at three sites based on
pre-construction survey results and no sites had their bat or raptor risk level decreased or raptor
risk increased due to pre-construction survey results (Capouillez and Librandi Mumma 2008). In
2009, risk levels were adjusted at four sites: one site had both its bat risk and raptor risks
increased due to pre-construction survey results; one site had its raptor risk increased due to pre-
construction survey results; one site had its bat and raptor risks decreased due to revisions to the
project area; and one site had its raptor risk decreased due to revisions to the project area. Table
3 shows the raptor and bat risk assessments of the 86 wind projects as of June 30, 2010.

11
Table 3. Raptor and bat risk levels of the 86 Pennsylvania
wind projects as of June 30, 2010.
Risk Level Raptor Bat
Low 45 47
Moderate 26 8
High 15 31
Not assessed yet 0 0
Risk assessments provided by the PGC are used to determine monitoring effort and to help
developers site their wind energy projects. Cooperators are encouraged to submit proposed
project information more than 14 months prior to construction so that the PGC can help in the
early planning stages to avoid and minimize impacts to birds and mammals. Those Cooperators
who submitted information on proposed projects more than 14 months in advance noted the
benefit to their planning and investor processes. For example, they were better equipped to
decide whether or not to proceed with conceptual projects based on the information provided by
the PGC. See the Avoidance, Minimization, and Mitigation section of this report for more
information.
PENNSYLVANIA WIND PROJECT SITE LOCATION
All of the 86 proposed and active wind sites in Pennsylvania are located in one or a
combination of the following physiographic provinces: Appalachian Plateau, Ridge and Valley,
Piedmont, and Central Lowlands (Figure 1). Wind developers initially targeted ridge tops but
they have started to branch out into the north central part of Pennsylvania and onto some of the
less prominent ridges and summits statewide. The northwest and southeast portions of
Pennsylvania are also starting to be targeted for wind development. This may change in the near
future as prime locations are developed and offshore wind development efforts increase in the
Great Lakes.
The PGC classifies turbine configuration as one of the following: linear, linear groupings,
clusters, and undetermined. “Linear” configuration is a single straight line of turbines. “Linear
groupings” are more than one linear string of turbines. “Clusters” are turbines that are
configured in non-linear groups. “Undetermined” configurations were those projects in which
turbine configuration has not yet been established. The 86 sites include 20 linear, 15 linear
groupings, 13 clusters, and 38 undetermined projects. Of these known configurations, there are 8
linear, 12 linear groupings, 13 clusters, and 21 undetermined within the Appalachian Plateau
province and 11 linear, 3 linear groupings, no clusters, and 14 undetermined within the Ridge
and Valley province. There is one site in the Piedmont province (configuration undetermined),
two that contain both the Appalachian Plateau and Ridge and Valley provinces (one
undetermined and one linear configuration), and one site located within both Ridge and Valley
and Central Lowlands provinces (undetermined configuration).
Site locations are described as being ridgetop, escarpment, butte, or unknown. This
determination is made by examining topographical maps. “Ridgetop” is defined as a long,
narrow chain of hills or mountains. “Escarpment” is defined as a transition zone involving a
sharp, steep elevation differential, characterized by a cliff or steep slope. “Butte” is defined as

12
an isolated hill (or hills) with steep, often vertical, sides and a small flat top. Site locations were
designated by categories with the following frequencies: 30 ridgetop, 8 escarpments, 37 butte,
and 11 unknown.
Elevation of wind projects in Pennsylvania ranged from 600 to 3200 feet above sea level (Figure
2); Pennsylvania‟s elevation ranges from sea level to 3, 213 feet above sea level.
The majority of Pennsylvania‟s land cover is deciduous forest (57%; Williams et al. 2005) and
90% of wind energy facilities occur in this land cover type. The remaining 10% of Pennsylvania
wind energy facilities, are built on agricultural (hay, pastures, or row crops) or mining (mines or
quarries) lands. On average, land cover types within Pennsylvania wind project areas include:
71% deciduous forest, 11% pasture/grass, 5% row crops, 5% evergreen forest, 5% mixed
deciduous forest, 2% water/wetland, and 1% residential, industrial, and/or commercial lands.
Further analysis of land cover types in relation to pre- and post-construction survey results is
planned for the future.
Figure 1. Pennsylvania wind projects (includes both active and proposed) by physiographic
province and cooperator status, as of June 30, 2010.
!.
!.
!.
!.
!.
!. !.
!.
!.
!.
!.
!.!.!. !.
!.
!(
!( !(!(
!(
!(
!(
!(
!(
!(
!(
!(
!(
!(
!(
!(!(
!(
!(
!(
!(
!(!(
!(
!(
!(
!(
!(
!(
!(
!(
!(
!(
!(!(
!(
!(
!(
!(
!(
!(
!(
!(
!(
!(
!(
!(!( !(
!(
!(
!(!(
!(
!(
!(!(!(
!(
!(
!(
!(
!(
!(
!(
!(
!(!(
!(
!(
!(
!(
WIND_GPS_07132010 Events
<all other values>
Status
!. ACTIVE COOPERATOR
!. ACTIVE NON-COOPERATOR
!( PROPOSED COOPERATOR
!( PROPOSED NON-COOPERATOR
physreg-p_geo
<all other values>
PROVINCE
Appalachian Plateaus
Atlantic Coastal Plain
Central Lowland
New England
Piedmont
Ridge and Valley
WIND_GPS_07132010 Events
<all other values>
Status
!. ACTIVE COOPERATOR
!. ACTIVE NON-COOPERATOR
!( PROPOSED COOPERATOR
!( PROPOSED NON-COOPERATOR
physreg-p_geo
<all other values>
PROVINCE
Appalachian Plateaus
Atlantic Coastal Plain
Central Lowland
New England
Piedmont
Ridge and Valley
WIND_GPS_07132010 Events
<all other values>
Status
!. ACTIVE COOPERATOR
!. ACTIVE NON-COOPERATOR
!( PROPOSED COOPERATOR
!( PROPOSED NON-COOPERATOR

13
Figure 2. Median elevation (ft) of Pennsylvania‟s 86 active and proposed wind sites.
SURVEY RESULTS SUMMARY
Two hundred pre- and post-construction bird and mammal surveys have been completed
at Pennsylvania wind energy sites since 2004 (Table 4). Inconsistencies in data collection pre-
and post- Cooperative Agreement (2007) have resulted in difficulties interpreting results and
comparing the results between sites. Site names and locations have been replaced with site
identification codes in data summary tables to preserve the confidentiality of this information as
provided in the Cooperative Agreement. Since the Cooperative Agreement has been in place,
Cooperators have funded one or more pre-construction wildlife surveys at 33 wind sites and
post-construction surveys have been initiated at 11 sites, resulting in more than 56,000 hours of
data collection.
For pre-construction surveys, the PGC encourages wind energy developers to have PGC staff
involved in the selection of observation sites, acoustic detector locations, and other details of the
studies. The PGC attempts to visit each site at least once during every survey to answer
questions, make sure the agreed upon monitoring protocols are being followed, and the correct
data sheets are used and properly completed. Open lines of communication between consultant,
wind energy developer, and the PGC are essential for recognizing and correcting problems as
they arise instead of collecting a full season of data that are not standardized and unusable
because they were not collected in accordance with the approved protocols. PGC wind
biologists observed 48 pre-construction surveys between October 1, 2007 and June 30, 2010
(Table 5). From 2007-2009, PGC staff also visited all 11 sites where post-construction
monitoring was conducted. The PGC has had vacancies in two of the three field positions within
the last year, resulting in a decrease in the number of pre-construction surveys observed.
0
5
10
15
20
25
30
unknown 1000-1499 1500-1999 2000-2499 2500+
Nu
mb
er o
f P
enn
sylv
an
ia w
ind
sit
es
Median elevation (ft)
Proposed
Active

14
Table 4. Summary of bird and mammal surveys completed at wind facilities in Pennsylvania,
2004 – 2009.
2004 2005 2006 2007 2008 2009 Total
Pre-construction
Potential hibernacula investigations a 0 2 5 4 3 4 18
Bat acoustics 0 2 2 9 8 6 27
Bat mist netting 1 2 5 7 11 8 34
Bat telemetry 0 0 0 3 4 1 8
Breeding bird surveys 0 0 2 9 4 7 22
Fall raptor migration 1 1 6 9 5 2 24
Spring raptor migration 0 0 5 6 6 0 17
Mammal species of concern surveys b 0 1 3 2 6 2 14
Bird species of concern surveys c 0 1 6 1 1 2 11
Post-construction
Mortality (bird and bat) 1d 0 1
d 1 4 6 13
Bat acoustics 0 0 0 0 3 2 5
Fall raptor migration 0 0 0 0 2 1 3
Spring raptor migration 0 0 0 0 0 0 0
Breeding Bird Surveys 0 0 0 0 0 0 0
Radar 0 0 0 0 2 0 2
Other e 0 0 0 0 0 2 2
Total number of surveys conducted 3 9 35 51 59 43 200 a
Potential bat hibernacula surveys refer only to those conducted on the project area
by the Cooperator. b Mammal species of special concern surveys include the following: state
threatened Allegheny woodrat (Neotoma magister) and state endangered northern
flying squirrel (Glaucomys sabrinus). c Bird species of special concern surveys include the following: state threatened
upland sandpiper (Bartramia longicauda) and bald eagle (Haliaeetus
leucocephalus), and state endangered short-eared owl (Asio flammeus). d Mortality surveys conducted prior to the Cooperative Agreement did not follow
PGC protocols. e Other surveys include those such as bat deterrent, curtailment, etc.
Table 5. Number of bat, bird, and other (woodrat, radar, etc.) pre-construction surveys observed
by PGC between October 1, 2007 and June 30, 2010.
Pre-Construction Surveys
Observed
10/1/07 –
9/30/08
10/1/08 –
9/30/09
10/1/09 –
6/30/10 Total
(10/1/07 – 6/30/10)
Bat Surveys 5 12 0 17
Bird Surveys 12 8 3 23
Other Surveys 5 3 0 8
Total Surveys Observed 22 22 3 48

15
PRE-CONSTRUCTION Birds
Fall raptor migration survey results
Raptor migration varied across the state as expected. A summary of results from pre-
construction fall raptor surveys completed 2004 - present, for which the PGC has received data,
is shown in Appendix A. The total number of each species observed was divided by the total
number of raptors observed at each site to determine percent of flight for each species. Raptors
per hour varied for all sites regardless of the raptor risk level. Two low risk raptor sites (wind
sites 2-1 and 35-1) recorded more raptors per hour than sites which had a higher risk level.
Surveys, such as these, which were conducted for a short period of time during the peak
migration for individual species, may explain these higher than expected daily passage rates. For
example, both of these fall raptor migration surveys were conducted in September - October
when broad-winged hawks (Buteo platypterus) migrate. The effect of the survey date on the
results is demonstrated by the daily passage rate of this species. This effect is also illustrated by
the higher daily passage rate of American kestrels (Falco sparverius), bald eagles (Haliaeetus
leucocephalus), and broad-winged hawks for wind site 35-1 where the raptor survey was
conducted on two days during these species‟ peak migration periods. One benefit to conducting
voluntary raptor migration surveys at raptor sites designated as low risk is that data are being
collected on ridges and summits for which there were little or no raptor migration data
previously.
Nineteen of 24 raptor survey sites (79%) observed at least one bald eagle. Of the five that did not
observe a bald eagle, four were categorized as low raptor risk sites and one was ranked as a
moderate risk site. The highest total number of bald eagles counted during any of the fall raptor
migration surveys occurred in 2009 when 248 were observed at site 6-11 (high raptor risk site).
More than ten bald eagles (range 18 - 248) were observed at seven of the 24 raptor survey sites
(29%); the risk levels of the seven sites were: two low risk, one moderate risk, and four high
risk. Bald eagles made up 3.8% of the total raptors observed during all fall raptor migration
surveys since 2004. Generally, few bald eagles are seen at any site on any given day. However,
the number of bald eagles in the Northeastern states has increased as bald eagle populations have
recovered (Farmer et al. 2008).
Five of 24 sites (21%) did not observe golden eagles (Aquila chrysaetos). Of these five sites,
three also did not observe bald eagles (two low risk sites and one high risk site). The highest
total number of golden eagles counted during fall raptor migration surveys occurred in 2007 with
73 observed at site 3-4 (high raptor risk site). More than ten golden eagles were observed at 6
sites (25%) during fall surveys (range 22 - 73); the risk levels of the six were all high. Golden
eagles comprised 0.7% of the total raptors observed during the fall raptor migration surveys
conducted since 2004. High risk raptor sites had higher percentages of golden eagles observed
than moderate or low risk sites.
Turkey vultures (Cathartes aura) (22.5% of total raptors observed), broad-winged hawks
(20.7%), and red-tailed hawks (Buteo jamaicensis) (18.7%) were the three most common raptors
observed during fall migration surveys. Rough-legged hawks (Buteo lagopus) were the least
observed raptors (<0.1% of total raptors observed), followed by northern goshawks (Accipiter
gentilis) (0.2%) and Merlin (Falco columbarius) (0.3%). Only four raptor species were observed

16
at all 24 fall raptor migration surveys: Cooper‟s hawks (Accipiter cooperii), northern harriers
(Circus cyaneus), red-tailed hawks, and turkey vultures.
Spring raptor migration survey results
A summary of results from pre-construction spring raptor surveys completed 2006 –
2009, for which the PGC has received data, is shown in Appendix B. Spring raptor migration
surveys were not conducted prior to 2006. The total number of each species observed was
divided by the total number of raptors observed at each site to determine percent of flight for
each species. Raptors per hour varied for all sites regardless of the raptor risk level.
Bald eagles were observed at 13 of 17 spring raptor survey sites (76%). The four sites where
bald eagles were not observed were categorized as low risk to raptors. The highest total number
of bald eagles counted during any of the spring raptor migration surveys occurred in 2009 when
37 were observed at site 6-11 (high raptor risk site). Two of the 16 sites (13%) observed more
than ten bald eagles during their spring surveys (23 and 37 respectively); both of these sites are
high risk. Bald eagles comprised 1.7% of the total raptors observed during all spring raptor
migration surveys.
Eight sites (53%) did not observe golden eagles; of these, three also did not observe bald eagles
(two low raptor risk sites and one moderate raptor risk site). Of the eight sites, five were low
risk sites that were not required to conduct a spring raptor survey (but still did), two were
moderate risk sites, and one was a high risk site. The highest total number of golden eagles
counted during any of the spring raptor migration surveys occurred in 2006 when 47 were
observed at site 3-2 (high raptor risk site). Four sites observed more than ten golden eagles
(range 19 - 42) during spring raptor surveys; all four sites had been ranked as high risk to raptors.
Golden eagles comprised 2.3% of the total raptors observed during all spring raptor migration
surveys.
More golden eagles were observed during spring raptor migration surveys at high risk sites than
at moderate or low risk sites. One exception, however, was one low risk site that only conducted
surveys during six days in March, which may have skewed its percentages versus other sites that
conducted surveys throughout March. Turkey vultures (55.2% of total raptors observed), red-
tailed hawks (14.6%), and broad-winged hawks (7.2%) were the three most common raptors
observed during spring migration surveys. Peregrine falcons (Falco peregrinus) were the least
observed raptors (0.1% of total raptors observed), followed by northern goshawks (0.2%), then
merlin and rough-legged hawks, each of which accounted for 0.3% of the total raptors observed.
Only three raptor species were observed during all spring raptor migration surveys: sharp-
shinned hawks (Accipiter striatus), red-tailed hawks, and turkey vultures.
Most sites did observe at least one bald or golden eagle but, unlike the fall raptor surveys, it
appears that eagle observations in the spring are related to raptor risk level. High risk sites
tended to have higher counts of bald and golden eagles compared to lower raptor risk sites,
suggesting that the current PGC pre-construction risk assessment designations may be
appropriate. However, to date no post-construction eagle mortality has been documented at
any Pennsylvania wind site.

17
Spring raptor migration surveys conducted in 2006-2007 were completed when the Cooperative
Agreement and protocols were being finalized, so most surveys completed during this time
period did not follow the current protocol. For example, many of these surveys were conducted
in April instead of March and were not conducted during the times of day outlined in Exhibit A
of the Cooperative Agreement. Surveys conducted in March during these years detected golden
eagles, whereas sites that conducted April – May spring migration surveys did not detect golden
eagles. These data support the premise that spring raptor migration surveys should be conducted
in March, in accordance with the PGC‟s recommended protocols, to capture eagle migration
(Brodeur et al. 1996, Brandes 1998, McWilliams and Brauning 2000, Brandes 2006). The 2008
spring raptor migration surveys were not all conducted in accordance with the PGC
recommended protocols outlined in the Cooperative Agreement. Issues with the 2008 spring
raptor migration surveys included: Cooperators not consulting with the PGC before conducting
the surveys resulting in surveys not meeting the effort requirements for their risk level or
Cooperators not consulting with the PGC prior to the start of the survey season resulting in
delayed starts to their monitoring efforts. In the coming years, flight pathways and height for
both fall and spring raptor migration surveys will be analyzed to determine if there are any
patterns or trends.
Wind sites where the highest percentages of bald and golden eagles were observed were not
always the same between seasons or eagle species. For spring surveys, three (sites 3-2, 2-18, and
24-2) of the top five sites were the same for both bald and golden eagle observations. During fall
surveys, however, only one site (site 3-4) was in the top five for both bald and golden eagles.
Sites with the top five highest percentages of observations for bald eagles were not identical
between spring and fall surveys either. Only one site (6-11) was in the top five for both spring
and fall surveys; this site had the second highest of all spring surveys and highest of all fall
surveys. The sites with the top five highest percentages of bald eagles observed in the spring
were all high raptor risk sites. The sites with the top five highest percentages of bald eagles
observed in the fall were comprised of two high risk, two moderate risk, and one low risk site.
Note that spring raptor surveys are required at high risk sites and moderate risk sites that noted
eagle migration during their fall raptor migration survey effort. Low risk sites are not required to
do raptor migration surveys, but some Cooperators have chosen to conduct at least a few days of
fall and/or spring raptor migration monitoring.
For golden eagles, sites with the top five highest percentages of observations were almost
identical between spring and fall surveys. Four sites, all high risk, placed in the top five for both
raptor migration surveys. The top two sites (3-2 and 3-4, respectively) for spring and fall golden
eagle survey observations were identical. The additional spring site (4-3) was of moderate risk
and the additional fall site (3-6) was of low risk. Site 3-6 conducted only 14 days of fall raptor
migration surveys, which may have resulted in the percent of each species being inflated
compared to those sites that conducted over 50 days of fall raptor surveys. These data suggest
that bald eagle observations may not be as good of an indicator of risk level as golden eagle
observations since the bald eagle population has soared in recent years and thus, observing bald
eagles has become more common. We do not currently have post-construction data to validate
whether sites with the highest percentages of bald and/or golden eagle observations could lead to
eagle mortalities; post-construction surveys are planned at some of the sites in question next
year.

18
Raptor migration surveys showed that bald and golden eagles migrate northward through
northcentral and northeast Pennsylvania but not in the high concentration that have been
observed at the Allegheny Front and Hawk Mountain hawk watch sites. The raptor migration
surveys from these regions concur with research conducted by Todd Katzner (2008) on bald and
golden eagles which shows these eagles using northcentral and northeast Pennsylvania as
migratory routes. These studies are adding to the information already known about golden eagle
migration (see Brodeur et al. 1996, Brandes 1998, Goodrich and Smith 2008) by giving specifics
about golden eagle relative numbers at certain ridge, summits, and bodies of water that had not
been previously documented.
The PGC will map and analyze the results of all raptor migration surveys in the coming year.
This effort is to confirm potential raptor risk levels assigned to those ridges for which we have
data. These maps, documenting migratory pathways of raptors and eagles, will be included in
the next summary report.
Breeding Bird Survey Results
Results of the breeding bird surveys received by the PGC are included in Appendices C-
E. No breeding bird surveys were conducted at proposed wind sites prior to 2006. Nine sites
conducted breeding bird surveys in 2007, four sites conducted breeding bird surveys in 2008, and
seven sites conducted breeding bird surveys in 2009.
Appendices D and E list Wildlife Action Plan (WAP) bird species identified during point counts
and area searches respectively. During the 22 breeding bird surveys conducted at 19 sites
through 2009, 20 point counts and 14 area searches detected at least one WAP priority bird
species; ten surveys observed one or more Pennsylvania endangered bird species and three
surveys documented at least one Pennsylvania threatened bird species and one or more
Pennsylvania endangered bird species (Appendices D & E). Total number of species varied
considerably from 25 to 107 and number of non-listed WAP bird species detected ranged from 4
to 25.
The state-listed endangered birds observed include yellow-bellied flycatchers (Empidonax
flaviventris) and blackpoll warbler (Dendroica striata). All of these observations were deemed
to be migrants based on the date they were observed and lack of appropriate breeding habitat in
the area. The state-listed threatened species included osprey (Pandion haliaetus) and upland
sandpiper (Baratramia longicauda). Both osprey observations were of individuals flying over
and not confirmed breeders. For the site that documented upland sandpiper, the PGC has since
requested an upland sandpiper survey. However, this site has not yet completed the survey due
to the project being on hold for the time being. For confirmed breeding species, the PGC will
work with the Cooperator to best avoid and minimize impacts to such habitat. The PGC does not
have an example of this yet since the state-listed endangered and threatened species that have
been documented via breeding bird surveys have all (with the exception of the upland sandpiper)
been deemed migrants. The PGC will be tracking all of the sites that have documented state-
listed species during pre-construction breeding bird surveys to see if mortality of these species
occurs at these sites post-construction.
Although inconsistencies in methodology and reporting preclude rigorous analysis of the
breeding bird data, the species lists generated from point counts and area searches are indicative

19
of species that are likely to be adversely impacted by changes in land cover. This is best
exemplified by those sites that found species known to be indicators of high quality forests with
structural diversity that are also sensitive to edge effects, created by forest fragmentation, such as
blue-headed vireo (Vireo solitaries), black-throated blue warbler (Dendroica caerulescens),
black-throated green warbler (Dendroica virens), worm-eating warbler (Helmitheros
vermivorum), and scarlet tanager (Piranga olivacea). The PGC will continue to investigate how
changes in habitat type may affect bird communities at wind sites.
According to the protocols found in Exhibit A of the Cooperative Agreement, point counts are to
occur once in May and twice in June, with June visits separated by at least one week. Area
searches are to be conducted once within each of three time periods, mid-March – April 30, May
1 - 31, and June 1 – July 10, at each area search location. Derivations from PGC protocols can
be found in the „comments‟ column in Appendix C. The PGC protocols were designed to target
breeding seasons of threatened, endangered, and species of special concern birds. Failure to
survey during these time periods may lead to false conclusions about the status (absence or
presence, migrant or breeding) of bird species listed in the WAP (Williams et al. 2005) and the
relative abundance of their populations at the site.
Area searches are conducted to supplement (or, in unique situations, replace) point counts, yet
many of the area search data have not been submitted in a way (i.e. separate from the point count
data) that the PGC can determine whether area searches are, in fact, supplementing point counts
by increasing the number of species detected. We do know that several species listed in
Pennsylvania as either endangered, threatened, or species of special concern are more easily
detected with area searches or specialized surveys than with point counts. Therefore, area
searches will continue to be used in breeding bird surveys. Lastly, some survey reports were
submitted to the PGC without the accompanying data and completed data sheets that verify
survey results.
The PGC continues to emphasize the importance of consulting with the PGC early in the
planning process to determine where point counts and area searches should be done prior to
commencing breeding bird surveys. The Cooperator must coordinate prior to the breeding bird
surveys to determine which surveys will best suit the project area, whether they are only point
counts, only area searches, or point counts and area searches. The protocol also states that „the
PGC will be flexible with regard to breeding bird survey sampling intervals.‟ The coordination
between the Cooperator and PGC prior to surveys being conducted is when these issues should
be resolved, not after a survey has been conducted. Each site is different and thus the PGC
attempts to modify survey protocol when possible, to conform to the needs of each individual
project, however, this cannot be done if no coordination with the PGC is initiated prior to
surveys being conducted. Coordination with the PGC prior to breeding bird surveys will help to
ensure the entire area and all habitats are being surveyed adequately and will reduce the chance
that the PGC will have to ask the Cooperator to redo or conduct additional surveys.
The Cooperative Agreement does not require post-construction breeding bird surveys unless the
PGC deems it necessary due to the presence of a threatened or endangered species or species of
special concern. The PGC has started to recommend post-construction breeding bird surveys to
record whether the species observed prior to construction activities remain on-site after
construction has been completed. To date, the sites for which the PGC has requested post-

20
construction breeding bird surveys have not yet gone to construction and thus no post-
construction breeding bird surveys have been conducted.
Bird Species of Special Concern Survey Results
Bird species of concern surveys conducted at proposed wind sites have included bald
eagle nest surveys, short-eared owl (Asio flammeus) presence/absence surveys, and upland
sandpiper (Bartramia longicauda) surveys. Species specific bird surveys such as these are
requested by the PGC at sites that have known or historical occurrences of the species on or in
the vicinity of the proposed project area. Nine bald eagle nest surveys, one short-eared owl
survey, and one upland sandpiper presence/absence survey have been conducted at Pennsylvania
wind sites. Only one of the nine has been conducted since the bald eagle was removed from the
federal Endangered Species list on August 9, 2007. None of the bald eagles nest surveys
documented bald eagle nests within the proposed project area. Only one bald eagle nest survey
documented a bald eagle nest outside the project area, over a mile from the proposed project
area. Bald eagle nest surveys may be requested by either PGC, because they are a state
threatened species, or the U.S. Fish and Wildlife Service, because they are protected under the
Migratory Bird Treaty Act and Golden and Bald Eagle Protection Act.
A short-eared owl presence/absence survey was conducted in 2009 at one site and no short-eared
owls were documented during the survey. While the Cooperator is responsible for conducting
all surveys required within the project area, PGC staff was able to help reduce monitoring
costs for this Cooperator by conducting the winter portion of this survey. The Cooperator
conducted the nesting survey. In 2009, at a different site, an upland sandpiper presence/absence
survey was conducted following PGC protocols. No upland sandpipers were observed during the
survey.
Bats
Potential Hibernacula Investigations
The investigation of potential hibernacula within the project area is the Cooperators‟
responsibility. Since the Cooperative Agreement has been in effect, the PGC has received
reports from 18 sites that have conducted bat hibernacula investigations. Six of the 18 sites
(33%) identified potential bat hibernacula on the project area that needed to be trapped. At these
six proposed wind sites, 32 potential bat hibernacula features have been trapped. One of these 32
features was identified as a hibernaculum of concern as defined in the Cooperative Agreement
(Exhibit C) due to the fact that one of the four bat species captured was an Indiana bat (Myotis
sodalis), a federally endangered and state threatened species. Eleven of the 32 features trapped
(34%) documented northern long-eared bat (Myotis septentrionalis), a species of special concern.
The other features were not labeled as hibernacula of concern due to the total number of bats
captured or number of different species present.
The PGC investigates potential bat hibernacula within five miles of the proposed project area
(Table 6). Two of the mine features investigated in the NE/SE region were known bat
hibernacula records that were 14 years old with no GPS coordinates available. Once located,
these two features were trapped and both were found to contain bats. One hibernaculum
contained the state threatened eastern small-footed bat (Myotis leibii), reconfirming the bat
species presence from the 14 year old record and confirming that the hibernaculum was one of
concern according to the Cooperative Agreement. Another mine feature in the NW/SW region

21
was further investigated by trapping and two species of special concern northern long-eared bat
were caught.
Table 6. Number of mine features investigated by PGC regional wind biologists
within five miles of wind projects and the number of hours spent conducting
those investigations through June 30, 2010.
Acoustic Monitoring
Acoustic monitoring has proven to be the most problematic. Many issues have occurred
during the data collection and reporting process, making data analysis extremely challenging.
One of the most common problems is failure to adjust nightly start and stop times to include the
full survey period of ½ hour before sunset until ½ hour after sunrise throughout the monitoring
period, as required by PGC protocol. This problem was further complicated by varying detector
success rates (percent of the time detectors are properly functioning and collecting data).
Another issue is that bat acoustic surveys are not always conducted by Cooperators during the
specified seasons. For example, a low risk site is to conduct bat acoustics from July 15 - October
15 but several sites have not started on time and then extended the survey beyond October 15,
figuring they can make up for the lost time in July by going into November. Lengthening the
season does not provide data for the targeted peak bat activity period of July 15 – October 15.
Finally, the Cooperative Agreement states that “all MET towers installed on-site should be
equipped with acoustic monitoring devices as close to the rotor zone as possible.” This is not
always occurring because either the MET towers are not all installed or they are relocated or
removed. Because of this, some sites are placing detectors on only a few of the MET towers
and/or using portable towers. Detectors are installed as high as possible on these structures, but
they still do not reach the height of the rotor sweep zone. Overall, the data being collected are
not standardized since Cooperators are not following the protocol guidelines provided in Exhibit
B of the Cooperative Agreement.
We have received data and/or reports from 27 pre-construction bat acoustic surveys conducted at
21 individual sites between 2005 and 2009. Cooperator used the following bat acoustic detectors
to conduct pre-construction bat acoustic surveys (No. surveys): (2) Pettersson D500x, (6)
Anabat 6.2, (10) Anabat II, (3) Anabat SD1, (3) AR 125, and (3) used both Anabat II and Anabat
SD1. There is no relationship between type of detector used and whether PGC protocol was
followed because the deviations from PGC protocol were mostly operator issues, not equipment
malfunctioning issues. Calls per hour varied between 0.1 and 5.6 per site with an average of 1.1
calls/hour and a standard deviation of 1.5. Since all sites did not adhere to PGC protocol these
summary statistics should be interpreted with caution. Eight of the 27 surveys (all conducted
during 2008 or 2009) did follow PGC protocol. The average calls/hour for these eight sites
ranged from 0.1 - 4.7, with an average of 1.2 and a standard deviation of 1.6.
Detector number and height vary between wind sites with most sites having two detectors at
different heights; one at ground or low level and the second at moderate or high level. Height
Investigated by PGC staff NW/SW NC/SC NE/SE Total
No. mines within 5 mi of project area 241 182 6 429
Total hours spent investigating mines 508 195 29 732

22
levels fall into one of the following categories: ground level <5 m, low level 5 - 10 m, moderate
level >10 - 40 m, and high level 40+ m. The percent of surveys conducted that had at least one
detector at each of the following detector levels was as follows: ground = 56%, low = 26%,
moderate = 52% and high = 62%. If the high level requirement is expanded to include those
detectors at 40 m, 78% of surveys had at least one detector at 40 m or higher. Unfortunately, of
the 21 sites that fall into this category, only 43% (9 of the 21) followed PGC protocol.
Some general trends can be derived from the bat acoustic data obtained to date by the PGC. The
big brown/hoary/silver-haired guild appear to have greater activity at high detectors; red bats
(Lasiurus borealis) and tri-colored bats (Perimyotis subflavus) are found to have approximately
the same activity level at all detector heights; and Myotis species are found to have greater
activity at the low level detectors. From a seasonal perspective, bat activity peaks in late
summer/early fall. At one proposed wind site, bat activity at one detector set up near an open
water pond documented ten times more calls then detectors set up in forested areas. The high
level of bat activity concentrated at the open water pond can most likely be attributed to bat
feeding activity. Regional trends in bat activity and patterns of species detection will be
examined in the future since it appears that comparison of call rates between sites may be
influenced by the varying attributes of each site.
To make site specific recommendations based on acoustic data, the PGC determined that the
overall detector success rate should be at least 80% (i.e. 80% of the nights with detectors
operational and able to collect data). This 80% minimum criteria threshold has prompted
Cooperators to target 80% success since spring 2008, which is when the PGC initially received
and reviewed the acoustic reports from 2007 and realized there was a problem. By having a
target success percentage, the Cooperator is encouraged to monitor the detectors more
frequently. This ensures that problems are discovered and remedied as soon as possible,
minimizing the risk of data loss and potential need to redo the survey. Success rates have
improved since 2007, but some sites have success rates of less than 80% because of problems
such as memory card overload, vandalism, and malfunctioning detectors. Nine of the 27 (33%)
pre-construction bat acoustic surveys had less than an 80% success rate. The success rates at
these nine sites ranged from 28 – 78%, with an average success of 61%.
In addition to requiring that acoustic detectors on all MET tower be installed as close to the rotor
zone as possible, PGC protocol (Exhibit B of the Cooperative Agreement) states that “detectors
should record from 30 minutes prior to sunset to 30 minutes following sunrise every day.” For
the 18 sites that did not follow protocol, 61% did not survey from 30 minutes prior to sunset to
30 minutes following sunrise every day, 83% did not survey within the correct dates, and 39%
did not have at least one detector on a MET tower at the highest level (40 m or higher). The
correct date of a survey is dictated by bat risk level, for low risk sites it is July 15 – October 15,
for moderate risk it is April 1 - 30 and July 15 – November 15, and for high risk sites it is April 1
– November 15.
The reporting of bat acoustic data has not been consistent. The PGC staff has been unable to
extract summary information from the acoustic surveys since the survey data were submitted in
various forms, with much of it not following PGC protocol for data collection and presentation.
The Cooperative Agreement includes a data sheet for bat acoustics in Exhibit B, but the PGC has
converted it to an Excel spreadsheet to facilitate data submission. The spreadsheets are not being
23
filled out completely, the hourly data are not starting at 30 minutes before sunset, the breakdown
of calls into various groups/guilds involves species being represented in more than one category,
and/or weather data reporting issues. The PGC has and will continue to volunteer to review a
few nights of data early on in the process to make sure the consultant is filling out the
spreadsheet correctly. The PGC protocol does not specify which groups the bat calls should be
broken into (e.g. low and high frequency, by species, or by groups of species) and therefore
frequency limits for each group are not consistent between surveys and/or consultants. The PGC
will draft additional guidance regarding collection, recording, and submission of bat acoustic
surveys prior to the 2011 bat acoustic survey season to address these inconsistencies.
Mist Net Surveys
Mist net surveys are being conducted based on the Cooperative Agreement criteria on
high potential bat risk projects and also in response to U.S. Fish and Wildlife Service (USFWS)
requests. Cooperators generally complete these surveys early in the planning stage. Mist net
surveys provide valuable data to the PGC because they identify species presence in the project
area and indicate breeding populations if juveniles or reproductive females are captured. In
addition, mist net surveys may provide critical information about threatened and endangered
species because these species will be telemetered and followed if captured. As with the other
surveys, consulting with the PGC, and if applicable, the USFWS prior to conducting mist net
surveys is critical to avoid having to redo or conduct additional surveys due to inappropriately
placed or too few mist net sites. Additionally, early coordination ensures protocols are followed
regarding survey hours, duration, and utilization of qualified surveyors. Some Cooperators have
learned that the mist net surveys they had completed were unacceptable for one of the above
reasons and have had to conduct additional surveys in order to meet the Cooperative
Agreement‟s criteria and obtain clearance from USFWS and/or PGC for their project.
A summary of mist net survey results can be found in Appendix F. One of the highlights of the
mist net surveys conducted at proposed wind sites was the discovery of a silver-haired bat
(Lasionycteris noctivagans) maternity colony in 2007, the first breeding record for the species in
Pennsylvania. No mist netting surveys were completed on proposed wind sites prior to 2004.
Bats per mist net site varied from 4.6 to 59.2 and do not appear to be correlated with bat risk
level. Number of species of bats captured at proposed wind sites also does not appear to be
correlated with risk level because seven species of bats (maximum number of species captured to
date at proposed wind sites) have been documented at low, moderate, and high risk sites.
Captures of threatened, endangered, and species of special concern bats during mist net surveys
has provided us with valuable information about foraging areas, roost locations, and maternity
colonies for these species (see Bat: Telemetry section below).
Telemetry
Eight telemetry surveys have been conducted since the Cooperative Agreement was
established. Telemetry surveys identify foraging areas, roost locations, maternity colonies, and
behaviors that enable the PGC to determine where to best site wind turbines to avoid and
minimize potential adverse impacts to bat species. Three surveys were completed on Indiana
bats (two in 2007 and one in 2008), four on eastern small-footed bats (three in 2008 and one in
2009), and one on a silver-haired bat (2007). The 2007 surveys were summarized in the 1st
annual report (Capouillez and Librandi Mumma 2008), thus will not be included below with the
2008 and 2009 telemetry surveys results. Because the telemetered species are endangered,

24
threatened, or species of special concern and due to the confidentiality clause in the Cooperative
Agreement, survey locations will remain confidential. However, this information has been
submitted for inclusion in the Pennsylvania Natural Diversity Inventory (PNDI) so that it can be
used to better site other development projects.
The 2008 surveys include three small-footed bat telemetry surveys and one Indiana bat telemetry
survey. The surveys were completed at three different proposed wind sites with one of the three
sites conducting both small-footed and Indiana bat telemetry. For all of the 2008 and 2009 bat
telemetry surveys, each of the bats was originally captured during pre-construction mist net
surveys.
The first small-footed telemetry survey in 2008 occurred on one female who was tracked
for 4 nights/days. This bat used ridgelines, streams, and forested roads as travel
corridors. The bat traveled between 4.0 and 8.2 miles each night, travelling from roost
location to foraging area and back to roost; this distance excludes flight distances
accumulated while foraging. The bat was documented foraging in streams, clearings, and
ridge tops. One roost location was documented in talus but no emergence counts were
conducted. This wind site was originally deemed of low potential bat risk, but after the
small-foot bat was captured on site, the potential risk level was increased to high.
The second small-footed telemetry survey in 2008 occurred on one male who was tracked
for 5 nights/days. This bat utilized habitats located at 1400-2400 feet in elevation and
foraged in the same area each night - the east slope of the mountain in a 0.75 mi2
area.
Two roost locations were documented in exposed talus located near the crest of the
mountain. Emergence counts were conducted at one of the roosts and documented one
bat exiting. This wind site was originally deemed of low potential bat risk, but after the
small-foot bat was captured on site, the potential risk level was increased to high.
The third small-footed telemetry survey in 2008 occurred on two females; one was
tracked for 3 days and the second for 2 days. The bats were documented foraging in a
small hilltop area. Two roost locations were documented, both located in exposed talus.
Emergence counts were conducted at both roost locations and one of the roost emergent
counts provided evidence of a maternity colony (emergence count = 5). This wind site
was originally deemed of high potential bat risk, so the capture of small-foot bats did not
change the site’s potential risk level to bats.
One Indiana bat telemetry survey was conducted on two males in 2008; one was tracked
for 3 days and the second for 2 days. Four roost locations were documented and
emergence counts were conducted at all with 1-7 bats observed at each. The bats foraged
approximately 3 miles from their roost locations in woodlots and near a small pond. The
3 mile trip included an elevation change of 1400 feet. This wind site was originally
deemed of high potential bat risk, so the capture of Indiana bats did not change the site’s
potential risk level to bats.
In 2009, one bat telemetry survey was conducted on five small-footed bats (three males
and two females). The bats were each tracked for 6 days. Seven roost locations were
documented in sandstone boulders, shale rock piles, and limestone spoil piles. All

25
emergence counts resulted in no more than one bat exiting therefore no roost locations
showed evidence of being maternity colonies. Home range (minimum convex polygons)
for each bat ranged from 133 to 1405 hectares and the core habitat (50% fixed kernel
utilization distribution) ranged from 4 to 75 hectares. This wind site was originally
deemed of high potential bat risk, so the capture of Indiana bats did not change the site’s
potential risk level to bats.
The telemetry survey results have been used by Cooperators to adjust placement and number of
turbines to avoid potential impacts to the species and their habitats. Examples include protection
of small-footed bat roost locations, relocation of one of three proposed turbine strings to avoid a
hibernaculum of concern, and abandonment of a portion of a project area to avoid impacts to
listed bat species. Due to the discovery of the first reproductive female silver-haired bat, the
PGC now recommends telemetry on other reproductive female silver-haired bats if captured
during bat surveys. Part of the minimization effort of the Cooperator will be to avoid these
identified areas within their project areas and to set up a post-construction survey targeting the
bats in question to determine if any further minimization or mitigation efforts are needed.
Other
Mammals of Special Concern Surveys
Other mammal species of concern surveys have included state threatened Allegheny
woodrat (Neotoma magister) habitat assessments and trapping and state endangered northern
flying squirrel (Glaucomys sabrinus) habitat assessments. Allegheny woodrats inhabit steep
rocky/talus slopes, boulder fields, or caves in a forest interior matrix in the Appalachian
mountain areas where many wind sites are proposed. Northern flying squirrels are found in
habitats characterized by mature mixed deciduous-hemlock stands or around stands of pure
conifer (Mahan et al. 1999) that contain large (mean = 44.9cm dbh) conifers and many snags
(~10 snags/acre) (Mahan et al. 2007).
Woodrat habitat assessment surveys are required if there are known historic, old, or active sites
on the project area, or if there is potential habitat on the project area (determined by the PGC
woodrat GIS model and field reviews). Allegheny woodrat habitat assessment surveys follow
protocols found in the Allegheny Woodrat: the Environmental Review Process for Pennsylvania
(Mixon 2008). The PGC evaluates all wind sites for potential impacts to Allegheny woodrats
and northern flying squirrels because of their state listed status. The operation of wind turbines
is not known to directly, negatively impact woodrats or northern flying squirrels; it is the
footprint of the project, including infrastructure and turbines that may fragment and/or destroy
their habitat and travel corridors. A consultant or PGC staff conducts a field visit if there is a
question about the presence of potential habitat. If potential habitat for either northern flying
squirrel or Allegheny woodrat is evident, the Cooperator must conduct a full habitat assessment
survey to document the habitat and, for woodrat, confirm or deny the actual presence of the
species by documenting woodrat sign (e.g. food caches, toilet areas). At this time the PGC does
not have a presence/absence survey protocol established for northern flying squirrels, but a
habitat assessment survey protocol is commonly used.
Thirteen woodrat habitat assessment surveys have been completed on proposed wind sites
between 2007 and 2009 and one northern flying squirrel habitat assessment was conducted in
2009. Only two proposed wind sites have documented woodrat sign; one site documented both

26
fresh and old signs and a second site documented only old sign. The Cooperator for the site
where fresh and old woodrat sign was documented has committed to conducting additional
studies, including pre-and post-construction trapping of woodrats, to determine the impacts of
the wind facility on the active population in the area. The Cooperator for site that documented
old woodrat sign has adjusted its project area to exclude the area where old woodrat sign was
documented. For sites at which woodrats and/or woodrat signs are found, the PGC will work
with the Cooperator to avoid and minimize impacts to the species, and, where necessary, require
post-construction monitoring to assess the impacts of wind development on woodrats and their
habitats. One area with potential northern flying squirrel habitat was identified at the site where
a habitat assessment was conducted. The Cooperator for the site has adjusted their project area
to minimize the impact to this area. As with woodrats, the PGC will work with the Cooperator to
avoid and minimize impacts to northern flying squirrel habitat.
Post-construction
Post-construction mortality surveys were conducted at one site in 2007, four sites in
2008, and six sites in 2009, for a total of eight different sites between 2007 and 2009. As
required by the PGC, all post-construction monitoring requires a PGC Special Use Permit to
handle and collect carcasses. The PGC requires Special Use Permits in order to conduct surveys
for birds or mammals and/or to collect or handle bird or mammal specimens. The PGC Bureau
of Wildlife Protection issues Special Use Permits. The mortality studies for wind energy projects
require a Special Use Permit that costs $300.00. The Permit is required because birds and bat
specimens will be handled during the mortality studies, potentially including state listed species.
The Bureau of Wildlife Protection issues the permit after the project monitoring plan has been
reviewed and approved by the Bureau of Wildlife Habitat Management, Division of
Environmental Planning and Habitat Protection. The permit lists the effective date, expiration
date, study methods, renewal, reporting requirements, etc. All eight sites were issued Special Use
Permits to conduct post-construction monitoring surveys and no Special Use Permits have been
revoked to date.
Mortality
Mortality searches were conducted daily from April 1 – November 15, with the exception
of one site that conducted surveys in 2007 (mortality searches were conducted daily May 1 –
November 17) and one site in 2009 that conducted surveys from March 1 – December 15 due to
its high raptor risk. Two of the four sites in 2008 had operational issues (repairing cracked
turbine blades, issues with commissioning turbines, and access issues) that prevented them from
adhering to the PGC approved monitoring plan. Two of the six sites in 2009 used a consultant
who failed to adhere to the PGC protocols, resulting in inaccurate mortality estimates. PGC staff
visited both of these sites several times, reviewed the data being collected, and gave oral and
written guidance to the Cooperator and consultant throughout the entire survey season, but the
consultant continued to fail to adhere to the PGC protocols. Failure to start surveys at sunrise,
failure to conduct blind searcher efficiency trials, and failure to test all searchers were a few
examples of the issues at these two sites that persisted throughout the survey. Due to negligence
of the consultant to follow PGC protocols (even after guidance was provided), the data did not
accurately depict what was occurring on the site. As a result, the PGC advised the Cooperator,
who owned both sites, that the PGC would not approve any 2010 Special Use Permits if this
particular consultant was listed as the sub-permittee. The Cooperator obtained a different

27
consultant for both sites for the 2010 monitoring season. The consultant in question was not a
sub-permittee at any other Pennsylvania wind sites in 2009 and they did not apply for any
Special Use Permits related to wind energy in 2010, as of June 30, 2010.
PGC staff validated the identification of all carcasses from all sites. Estimated mortality was
calculated from daily searches conducted at ten turbines, or 20% of turbines, whichever was
greater at each site, and the estimator proposed by Erickson et al. (2004) was used, corrected for
searcher efficiency and scavenger removal (SESR) biases, to obtain mortality estimates for birds
and bats. Other estimators have been used in addition to Erickson‟s method at several of the
Pennsylvania wind sites, all of which have resulted in mortality estimates greater than what is
estimated using the Erickson equation. For example, the Manuela Huso estimator (Arnett et al.
2009) results in 4.69 birds/turbine/year, double the 2.27 birds/turbine/year estimated using the
Erickson estimator; likewise the Huso estimator resulted in 32.3 bats/turbine/year, almost double
the 18.9 bats/turbine/year estimated using the Erickson estimator. There are a few different
estimators used currently, but for comparison purposes, the PGC asks that all sites use the
Erickson estimator to allow for comparisons between sites. However, because the PGC realizes
that using the Erickson estimator likely results in an underestimation of mortality, the mortality
estimates provided in Table 7 should be considered minimum estimates, rather than total
mortality occurring on wind sites.
Bat Mortality
A summary of bat mortality estimates for eight sites that conducted mortality searches
from 2007-09 can be found in Table 7. Gray boxes indicate information that was not included in
the annual report for that site. The PGC was unable to determine what percentage of mortality
was due to direct collision or other indirect causes, such as barotrauma, because carcasses are not
tested for barotrauma and evidence of direct collision (lacerations, broken wing, etc.) is not
required to be noted on data sheets.
The average estimated bats/turbine/year for the five surveys that followed PGC protocol was
24.6 (range 6.8 – 42.7).
A total of 1,179 bat carcasses were found during scheduled searches at the Pennsylvania sites
conducting mortality monitoring during 2007-09. The majority of bat carcasses found during
scheduled searches during 2007-2009 were adult males (Figure 3). Bat mortality by species was
as follows: hoary bat (Lasiurus cinereus) 30%, silver-haired bat 19%, red bat 18%, tri-colored
bat (formerly named eastern pipistrelle) 15%, little brown bat (Myotis lucifugus) 12%, big brown
bat (Eptesicus fuscus) 4%, Seminole bats (Lasiurus seminolus) 1%, northern long-eared bat <1%,
unknown 1%. Percent composition by year and overall can be found in Table 8. The increase in
residential bats in 2009 is likely because one of the six sites had approximately 57% of its bat
mortality composed of residential bats versus migratory tree bats, when the average percentage
of residential bats for all other sites in Pennsylvania was 26% (Table 7).
Distributions of bat mortality by month and by Julian date are shown in Figures 4 and 5,
respectively. Julian date was chosen to standardize the data because 2008 was a leap year.
Eighty-six percent of bat mortality occurred between June and September, whereas 98% of
mortality occurred between May and October (Table 9). Low bat mortality occurred in the
months of April and November. April bat mortality occurred at three of four sites in 2008 and

28
six of eight sites in 2009. The site that conducted mortality monitoring in 2007 did not conduct
April surveys. The following species were found during the April bat mortality surveys: hoary,
silver-haired, red, tri-colored, big brown, and little brown. Because bats are exiting bat
hibernacula in April and entering during late October/early November, it could be inferred that
increases in bat mortality during April and/or late October/early November may indicates the
presence of a nearby hibernaculum. Bat mortality documented during these periods was minimal
in 2007-09, so the data collected at these sites do not indicated the presence of nearby
hibernacula. It is unknown at this time as to what level of mortality during April and/or late
October/early November may be an indicator of the presence of a nearby hibernaculum.
Table 7. Summary of bat mortality estimates for the eight sites that conducted mortality searches
in 2007-2009. MTB = migratory tree bats (silver, red, and hoary bats); RESB = residential bats.
Bat risk, H = high, M = moderate, L = low; CI = confidence interval; SE = searcher efficiency;
SR = scavenger removal.
a operational issues at site; less than 10 turbines searched
b operational issues at site; less than 10 turbines searched
c PGC protocols were not followed
d PGC protocols were not followed
e 90% confidence interval
Bat
Risk Year
PGC
protocol
followed?
Estimated
bats/turbine
/year
95%
CI
low
95%
CI
high
Estimated
bats/MW/
year
%
MTB
%
RESB
SE %
average
(1-day)
SR
average
(days)
H 2007 Yes 42.7 21.4 88 12 25 10.4
H 2008 Yes 34.3 17.1 77 23 31 13.4
H 2008 Yes 18.9 15.3 22.9 21.5 76 24 31.9
H 2009 Yes 12.9 9.6 16.1 21.5 67 33 23.3
L 2008 Noa
7.1 2.3e
13.1e
3.4 60 40 17 5.4
L 2009 Yes 6.8 3.7 10.5 3.2 71 29 24 9.0
L 2008 Nob
16.1 6.6e
29.0e 8.3 71 29 17 4.4
L 2009 Yes 28.5 19.5 37.5 11.8 74 26 47 11.2
M 2009 Noc
13.3 7.0 21.3 6.7 74 26 30 9.1
L 2009 Nod
12.3 1.0 4.7 6.2 80 20 15 4.3
H 2009 Yes 28.2 25.2 31.5 15.2 43 57 46 10.1
2-14
6-1
2-14
2-10
2-4
5-5
24-3
Site
code
6-3
6-3
2-2
2-2

29
Table 8. Percent composition of bat carcasses found during daily searches at Pennsylvania wind
sites during mortality survey conducted in 2007-2009, by year (No. sites conducting mortality
monitoring), and overall.
Percent (%) of Total Bat Mortality
Bat Species 2007 (1) 2008 (4) 2009 (6) 2007-09 (8)
Hoary 31 34 27 30
Silver-haired 12 22 19 19
Eastern Red 33 18 15 18
Tri-colored* 16 14 15 15
Little Brown 5 8 17 12
Big Brown 3 2 6 4
Unknown 1 1 1 1
Northern long-eared 0 0 <1 <1
Seminole 0 0 <1 <1
*formerly eastern pipistrelle
Figure 3. Sex and age composition of all bat mortality documented during standard searches at
eight wind sites, 2007-2009.
November bat mortality consisted entirely of migratory tree bats, with bat mortality documented
in 2007 (at one site conducting mortality monitoring) and in 2009 (at two of the eight sites), but
there was no November mortality in 2008. PGC recommends that the survey period remain
April 1 – November 15 for high risk sites because there is insufficient evidence to show that bats
entering and exiting hibernacula are not at risk to mortality. For low risk bat sites, the PGC may
consider reducing mortality monitoring in the future (e.g. May 1- October 31), since 98% of
mortality occurs during this time period. Note that reduced monitoring would only be
considered if there are no bird concerns.
60%27%
13%
Male
Female
Unknown 81%
13%
7%
Adult
Juvenile
Unknown

30
Figure 4. Distribution of bat mortality by month, year, and overall, 2007-2009.
Table 9. Percent bat and bird mortality by month for mortality data collected during standard
searches at eight Pennsylvania wind sites, 2007-2009.
Month
Percent Bat
Mortality
Percent Bird
Mortality
March 0 1
April 2 8
May 6 14
June 8 8
July 14 6
August 39 7
September 25 37
October 6 15
November 0 4
December 0 0
0
0.1
0.2
0.3
0.4
0.5
Per
cen
tag
e o
f a
nn
ua
l m
ort
ali
ty2007
2008
2009
% of Total
Bat
Carcasses

31
0
5
10
15
20
25
30
35
40
07
5
08
3
09
1
09
9
10
7
11
5
12
3
13
1
13
9
14
7
15
5
16
3
17
2
18
0
18
8
19
5
20
3
21
1
21
9
22
7
23
5
24
3
25
1
25
9
26
7
27
5
28
3
29
2
30
0
30
8
31
6
No
. Ba
t C
arc
ass
es
Figure 5. Patterns of bat mortality, by Julian date, for the bat carcasses found at the eight wind
sites that conducted post-construction mortality searches in Pennsylvania, 2007-2009.
Bird Mortality
A summary of bird mortality estimates for the eight sites that conducted mortality
searches in 2007-2009 can be found in Table 10. Gray boxes indicate information that was not
included in the annual report for that site.
The average estimated birds/turbine/year for seven of the 11 surveys that followed PGC
protocol was 3.9 (range 1.7 – 9.8).
Bird carcasses found during scheduled searches totaled 195 at the Pennsylvania sites conducting
mortality monitoring from 2007-09. Overall bird mortality was composed mostly (69%) of the
order Passeriformes, the remaining 31% included the following: 3% Cuculiformes (black-billed
and yellow-billed cuckoos), 3% Galliformes (all ruffed grouse), 2% Anseriformes (blue-winged
teal and wood duck), 2% Apodiformes (all ruby-throated hummingbirds), 2% Columbiformes
(all mourning doves), 2% Accipitriformes (Chesser 2010) (red-tailed hawk, turkey vulture,
broad-winged hawk), 1% Piciformes (sapsuckers), <1% Charadriiformes (killdeer), <1%
Gruiformes (sora), and 15% unknown birds (Table 11).
Passerine mortality was composed of 35% red-eyed vireo, 8% golden-crowned kinglet, 4%
magnolia warbler and veery, 3% blue-headed vireo and red-crowned kinglet, 2% American
crow, American redstart, red-breasted grosbeak, Swainson‟s thrush, and wood thrush, 1.5%
American robin, black-throated blue warbler, black-throated green warbler, common
yellowthroat, eastern towhee, mourning warbler, northern parula, pine warbler, Tennessee
warbler, unknown passerine (vireo and flycatcher), warbling vireo, white-throated sparrow, and
<1% black-and-white warbler, brown-headed cowbird, blackburnian warbler, brown creeper,
brown thrasher, blue-winged warbler, cedar waxwing, chestnut-sided warbler, eastern bluebird,
great crested flycatcher, gray catbird, indigo bunting, northern waterthrush, palm warbler, red-
breasted nuthatch, Swainson‟s warbler, tree swallow, white-eyed vireo, and yellow-throated
warbler.

32
Table 10. A summary of bird mortality estimates for the eight sites that conducted mortality
searches in 2007-2009. Raptor risk, H = high, M= moderate, L=low; CI = confidence interval;
SE = searcher efficiency; SR = scavenger removal.
a operational issues at site; less than 10 turbines searched
b operational issues at site; less than 10 turbines searched
c PGC protocols were not followed
d PGC protocols were not followed
e 90% confidence interval
Table 11. Percent composition of bird carcasses found during daily searches at Pennsylvania
wind sites during mortality survey conducted in 2007-2009, by year (No. sites conducting
mortality monitoring), and overall.
*sensu Chesser et al. 2010
Raptor
Risk Year
PGC
protocol
followed?
Estimated
birds/turbine/
year
95% CI
low
95% CI
high
Estimated
birds/MW/
year
SE %
average
(1-day)
SR mean
(days)
L 2007 Yes 1.8 0.9 23 10.4
L 2008 Yes 2.4 1.2 64 13.4
L 2008 Yes 2.3 0.9 4.0 1.5 52 12.7
L 2009 Yes 4.3 2.7 6.4 3.0 46 4.7
M 2008 Noa
6.5 3.8e
10.1e
3.1 23 5.4
M 2009 Yes 5.0 3.3e
6.9e
2.4 30 17.4
M 2008 Nob
1.3 0.0e
3.2e
0.7 23 4.1
M 2009 Yes 9.8 2.7 12.4 5.0 53 11.1
M 2009 Noc
1.0 0.3 1.7 1.0 48 13.2
H 2009 Nod
2.7 1.0 4.7 1.4 15 4.3
L 2009 Yes 1.7 0.8 2.9 0.9 45 14.1
Site
Code
2-10
2-4
5-5
24-3
6-1
6-3
6-3
2-2
2-2
2-14
2-14
Percent (%) of Total Bird Mortality
Bird Order 2007 (1) 2008 (4) 2009 (6) 2007-09 (8)
Anseriformes 0 0 2 2
Galliformes 0 2 4 3
Accipitriformes* 0 2 2 2
Gruiformes 0 0 1 1
Charadriiformes 0 0 1 1
Columbiformes 0 2 2 2
Cuculiformes 0 4 3 3
Apodiformes 10 0 2 2
Piciformes 0 2 1 1
Passeriformes 80 70 68 69
Unknown 10 17 15 15

33
Raptor mortality at the various sites conducting post-construction monitoring in 2007-2009 was
similar, regardless of potential raptor risk level, with 0 – 2 raptors documented during standard
searches at any one site. One low potential raptor risk site (6-1), that had zero raptors
documented during standard searches in 2009, documented 3 incidental raptor fatalities (1 broad-
winged hawk and 2 red-tailed hawks). This site did, however, observe a higher than expected
number of raptors during pre-construction raptor migration surveys (see Appendix A and B).
The PGC will further examine the raptor mortality documented during post-construction surveys
from all sites to see if there is a correlation with pre-construction raptor migration survey results.
Fifty-eight percent of bird mortality occurred between June and September and 88% of mortality
occurred between May and October (Table 9). Bird mortality is spread throughout the survey
season. Little bird mortality occurred in the months of March and December, but unlike bat
mortality, bird mortality has been documented in April (8% of total bird mortality) and
November (4% of total bird mortality). Surveys have been requested in March and December at
high risk raptor sites in an attempt to document all bird mortality that may be occurring during
raptor migration, particularly eagles. Because weather conditions at wind sites during these
months are harsh, often resulting in several missed search days, and because only one bird has
been documented in March and/or December, the PGC may recommend that high risk sites
reduce bird mortality monitoring to one time per week in March and December or eliminate
searches in March and December months entirely; however, golden eagle is most likely to occur
in these months and is among the most vulnerable to impaction (Brandes 2006).
Distributions of bird mortality by month and by Julian date are shown in figures 6 and 7,
respectively. Julian date was chosen to standardize the data because 2008 was a leap year.
Figure 6. Distribution of bird mortality by month, by year, and overall, 2007-2009.
0
0.05
0.1
0.15
0.2
0.25
0.3
0.35
0.4
0.45
0.5
Per
cen
tag
e o
f a
nn
ua
l m
ort
ali
ty
2007
2008
2009
% of Total
bird carcasses

34
Figure 7. Patterns of bird mortality, by Julian date, for the bird carcasses found at eight wind
sites that conducted post-construction mortality searches in Pennsylvania, 2007-2009.
Mortality in Relation to Turbine
Ninety-five percent of detected bat carcasses found during standardized searches occurred within
50 m of the closest turbine and 85% of bat fatalities fell within 40 m, whereas 86% percent of the
bird carcasses occurred within 50 m of the closest turbine, and 73% of bird fatalities were found
within 40 m (Figures 8 & 9). Bat and bird carcasses appear to be equally distributed in all
directions surrounding the turbines (Figure 9). The PGC will investigate if there is any relation
between prevailing wind direction and where carcasses are found for the next summary report.
At this time, the PGC does not have all the data necessary to investigate this potential
relationship.
Figure 8. Distribution of the percent of total bird and total bat carcasses documented during
standardized searches at the eight Pennsylvania wind sites that conducted mortality monitoring
from 2007-2009.
0
2
4
6
8
10
12
14
16
07
5
08
3
09
1
09
9
10
7
11
5
12
3
13
1
13
9
14
7
15
5
16
3
17
2
18
0
18
8
19
5
20
3
21
1
21
9
22
7
23
5
24
3
25
1
25
9
26
7
27
5
28
3
29
2
30
0
30
8
31
6
No
. B
ird
Ca
rca
sses
0%
5%
10%
15%
20%
25%
30%
0-9 10-19 20-29 30-39 40-49 50-59 60+
Per
cen
t o
f T
ota
l
Distance from Turbine (m)
Bats
Birds

35
Figure 9. Spatial distribution of all bird (A) and bat (B) carcasses documented during
standard searches in 2007-2009 at the eight Pennsylvania wind sites. Concentric circles
are at 20 meter intervals from turbine center.
Searcher Efficiency
Search efficiency trials were conducted at all eight sites. Carcasses of birds and bats
were placed in random locations throughout the search area in all vegetation classes and were
blind to the searchers. Trials occurred in all visibility classes, at all searched turbines, and for all
searchers with few exceptions. Searcher efficiency for bats at all eight sites averaged 28%
(range 15 - 47%). The average searcher efficiency for bats at sites that followed protocol was
35% (range 24 – 47%). Searcher efficiency for birds at all eight sites averaged 38% (range 15 –
64%). The average searcher efficiency for birds at sites that followed protocol was 45% (range
23 - 64).
The PGC will be analyzing these and future datasets to determine if there are any trends with
regard to bat versus bird trials such as carcass coloration, fresh versus frozen carcasses, and
quality of carcass (fresh, decomposed, intact, broken/wounded) that may be influencing searcher
efficiency trials.
Scavenger Removal
Scavenger removal trials were conducted at all eight sites. Carcasses were placed in
random locations throughout the search area in all vegetation classes, but were not blind to the
searchers. Scavenger removal for bats at all eight sites averaged 12 days (range 4 - 32). Average
time for scavenger removal at those sites that followed protocol was 17 days (range 9 – 32).
Scavenger removal for birds at all eight sites averaged 10 days (range 4 – 17). Average time for
scavenger removal at those sites that followed protocol was 12 days (range 5 – 17).
Through direct observation, scat and tracks found near carcasses, and motion-sensitive trail
cameras, the following potential scavengers have been identified at the various sites conducting
mortality monitoring: black rat snake (Elaphe obsolete), red-tailed hawk, turkey vulture, long-
tailed weasel (Mustela frenata), opossum (Didelphis marsupialis), raccoon (Procyon lotor), American crow (Corvus brachyrhynchos), common raven (Corvus corax), blue jay (Cyanocitta
cristata), fisher (Martes pennanti), mouse (Mus sp.), fox (Vulpus sp.), coyote (Canis latrans), bear (Ursus americanus), and chipmunk (Tamias striatus).
A B

36
The PGC will be analyzing future datasets to determine if there are any trends with regard to bat
versus bird trials such as carcass coloration, fresh versus frozen carcasses, and quality of carcass
(fresh, decomposed, intact, broken/wounded) that may be influencing scavenger removal.
Incidental Mortality
Incidentals are defined as carcasses found outside scheduled search times and/or found
outside the designated search plots during scheduled search times. The species and percentages
of the birds and bats found during scheduled searches versus incidental finds are similar for both
birds and bats (Tables 12 and 13). For bats, there were slightly more tri-colored (formerly
pipistrelle) and little brown bats found as incidentals than during standard searches. This may be
due in part to one site that searched additional turbines to obtain additional carcasses for searcher
efficiency and carcass removal trials in 2009. This happens to be the same site that had the
highest percentage of residential bat mortality. Slightly more birds from the orders
Accipitriformes (i.e. hawks) and Galliformes (i.e. ruffed grouse) were found as incidentals than
during standard searches. Ruffed grouse incidentals were found during the months of March,
April, October, and November. Incidental diurnal raptors (Accipitriformes) were spread
throughout the survey period (in the months of March, April, May, July, September, and
November). Why different species are found during standard mortality searches versus
incidental finds is not well understood. These differences could be attributed to the breeding
ecology of these birds (e.g. ruffed grouse are nesting in May rather than dispersing) or simply
that detection of incidentals is more likely because of their larger size. Ruffed grouse mortality
in particular, has been documented at the base of turbines and appears to be result of grouse
flushing into the base of the turbine and not from turbine operation.
Table 12. Composition (percent of total bats documented) of bat mortality identified through
standard searches versus those found outside standard search times (incidentals).
Bat Species
Standard
Searches
Incidental
Finds
Hoary 30% 24%
Silver-haired 19% 15%
Eastern Red 18% 17%
Tri-colored* 15% 20%
Little Brown 12% 20%
Big Brown 4% 2%
Unknown 1% 1%
Northern long-eared <1% 0%
Seminole <1% 0%
*formerly eastern pipistrelle
37
Table 13. Composition (percent of total birds documented) of bird mortality identified through
standard searches versus those found outside standard search times (incidental finds).
Bird Order
Standard
Searches
Incidental
Finds
Passeriformes 69% 63%
Unknown 15% 8%
Cuculiformes 3% 0%
Galliformes 3% 13%
Apodiformes 2% 2%
Columbiformes 2% 0%
Accipitriformes* 2% 12%
Anseriformes 2% 2%
Piciformes 1% 0%
Gruiformes 1% 0%
Charadriiformes 1% 0%
*sensu Chesser et al. 2010
Large Mortality Events.---Cooperators did not document any large kills (greater than 50
animals in a single day event) between 2007 and 2009.
Eagle Mortality.---Cooperators did not document bald or golden eagle mortality between 2007
and 2009.
Threatened and/or Endangered Species Mortality. ---Cooperators documented three
endangered bird mortalities in 2009 (two blackpoll warblers and one yellow-bellied flycatcher). One endangered bird was killed at each of three different wind sites. One of the three
endangered bird mortalities was documented during scheduled searches and the other two were
documented outside scheduled searches and are considered to be incidental finds. The three
birds were determined to be migrants (i.e. not from the local breeding population) by the PGC
due to the lack of breeding habitat in the vicinity and the time of year mortalities occurred. All
three fatalities occurred in September 2009, with the yellow-bellied flycatcher fatality found on
September 14 and two blackpoll warblers found on September 17 and 24 respectively. Due to
the Cooperative Agreement and particular Cooperator‟s effort to avoid and minimize potential
impacts, the PGC did not file a formal action of liability for these endangered bird mortalities.
PGC met with Cooperators on August 5, 2010 at PGC headquarters to discuss the draft second
wind energy summary report, endangered bird mortality documented in 2009, and acceptable
levels of bat and bird mortality. Twenty of the 29 Cooperators sent representatives and ten PGC
staff were present for a total of 46 attendees. The group discussed different methods for
determining threshold values for bird and bat mortality. Because of the complexity and
implications of this question, the PGC will continue to investigate the most appropriate
mechanism for determining these thresholds. The PGC presented draft guidance regarding the
steps to be taken following the mortality of a state threatened or endangered species. A second
meeting with the Cooperators was held on September 9, 2010 to further discuss the draft
guidance for threatened or endangered species mortality and to edit the draft Best Management
Practices (BMPs). Twenty of the 29 Cooperators sent representatives and nine PGC staff were

38
present for a total of 42 attendees. The draft threatened and endangered species guidance is
currently under internal review by the PGC to ensure it conforms to the regulatory constraints of
the agency. Once finalized, the threatened and endangered species guidance will be made a part
of the Cooperative Agreement and thus a part of each Cooperators‟ overall commitments in order
to remain in compliance with the Cooperative Agreement. The PGC anticipates this guidance
will be finalized in 2011. Cooperators comments have been incorporated into the draft BMPs
found in Appendix D. The PGC plans to officially incorporate these BMPs into the Cooperative
Agreement in 2011.
Mortality - Weather Correlation. ---From September 13-14, 2009, 20% of the bird mortality
occurred, yet only 2% of bat mortality occurred during that same period. This two- day period
included a front moving through the state which resulted in foggy conditions both days and the
preceding nights. Bird mortality increased on both September 13 (14 birds) and 14 (11 birds) but
bat mortality did not increase on either of these days. The PGC will continue to analyze bird
mortality in the future to determine if there is any correlation with migration timing and/or
weather events.
There appears to be a correlation between bat mortality and wind speed (Arnett et al. 2010). Bat
mortality is greater at low wind speeds, when bats are more active, compared to high wind
speeds, when bats are less active.
Can Mortality be Predicted? ---To date, the PGC does not yet have enough pre- and post-
construction data to develop a mortality prediction model. The eight sites that have conducted
post-construction mortality monitoring thus far were grandfathered into the Cooperative
Agreement, meaning they were only obligated to conduct post-construction monitoring. All of
these sites conducted some pre-construction monitoring surveys, but not all of these the surveys
were conducted following standardized PGC protocols, so comparison of data is nearly
impossible. It will be several years before there are data from sites that conducted both pre- and
post-construction surveys following PGC protocols that can be evaluated to determine whether
the conditions under which mortality is likely to occur can be predicted.
Post-construction Raptor Migration Survey
Can raptor migration survey observations be correlated with mortality? No post-
construction raptor migration surveys were completed in 2007. Post-construction fall raptor
surveys were conducted at two moderate risk sites (2-10 and 2-14) in 2008. No raptor mortality
was documented at either facility in 2008. Twelve percent of total raptors observed at site 2-10
and seven percent of total raptors observed raptors at site 2-14, respectively, appeared to alter
their flight path to avoid turbines, circle around them, or pass above or below the turbine rotors.
No raptors were observed flying between blades of rotating turbines; however raptors were
observed flying between the blades of inactive turbines.
The fall 2008 raptor migration surveys at site 2-10 documented 12 species of raptors composed
of 48% turkey vultures, 23% red-tailed hawk, 9% broad-winged hawk, 3% Cooper‟s hawks, 2%
northern harrier, 1% sharp-shinned hawks, and <1% of each of the following American kestrel,
bald eagle, golden eagle, osprey (Pandion haliaetus), peregrine falcon, and red-shouldered hawk
(Buteo lineatus). For special concern species, the following approximate percentages of those
individuals observed were documented flying below 125 meters within the project area: 100%

39
of peregrine falcons, 86% of northern harriers, 60% of osprey, 50% of bald eagles, and 0% of
golden eagles. The PGC determined that spring raptor migration surveys were not warranted at
this site because few raptors species of special concern were documented and no raptor mortality
was documented.
The fall 2008 raptor migration surveys at site 2-14 documented 13 species of raptors composed
of 47% turkey vultures, 20% broad-winged hawk, 10% red-tailed hawk, 8% sharp-shinned
hawks, 2% Cooper‟s hawks, 1.4% black vulture, 1% osprey (Pandion haliaetus), and <1% of
each of the following American kestrel, bald eagle, golden eagle, Merlin, northern harrier, and
red-shouldered hawk. For special concern species, the following approximate percentages of
those individuals observed were documented flying below 125 meters within the project area:
70% of osprey, 50% of northern harriers, 50% of bald eagles, and 0% of golden eagles. The
PGC determined that spring raptor migration surveys were not warranted at this site because few
raptors species of special concern were documented and no raptor mortality was documented.
Two post-construction raptor migration surveys were conducted in 2009, at one site (24-3)
during the spring 2009 and at a second site (5-5) during fall 2009. Both migration surveys were
concurrent with mortality surveys.
The spring 2009 survey was conducted at site 24-3, deemed to be of high potential risk to
raptors. Since this site is a high potential risk site, both spring and fall post-construction raptor
surveys are required. The fall raptor surveys were conducted in 2010. Only one spring raptor
fatality (turkey vulture) was documented during the spring 2009 raptor migration survey, but due
to the limited mortality data, an analysis could not be conducted to determine if any correlation
exists between spring raptor mortality and spring raptor migration observations at this site. The
spring 2009 raptor migration survey documented 10 species of raptors composed of 46% turkey
vultures, 33% red-tailed hawks, 7% sharp-shinned hawks, 4.6% Cooper‟s hawks, 4% golden
eagles, 2% American kestrel, 1.4% bald eagles, and <1% of each of the following northern
harrier, northern goshawk, and red-shouldered hawk. For special concern species, approximately
66% of northern harriers, 60% of bald eagles, 57% of golden eagles, and 0% of northern
goshawks observed were documented within the rotor sweep zone.
The fall 2009 survey was conducted at site 5-5, deemed to be of moderate potential risk to
raptors. Since this site is of moderate risk to raptors, a fall post-construction raptor survey is
required, and if eagle migration is noted in the fall, spring monitoring may be warranted. The
fall raptor surveys were conducted in 2010. No fall raptor fatality was documented during the
fall 2009 raptor migration survey therefore an analysis could not be conducted to determine if
any correlation exists between fall raptor mortality and fall raptor migration observations at this
site. The fall 2009 raptor migration survey documented 16 species of raptors composed of 30%
broad-winged hawk, 22% red-tailed hawk, 13% sharp-shinned hawks, 11% turkey vultures, 5%
bald eagle, 5% osprey, 3% Cooper‟s hawks, 2% American kestrel, 2% northern harrier, and <2%
of each of the following red-shouldered hawk, golden eagle, peregrine falcon, Merlin, northern
goshawk, black vulture, and rough-legged hawk. For special concern species, approximately
54% of northern harriers, 29% of peregrine falcons, 3% of osprey, and 0% of bald eagles, golden
eagles, and northern goshawks observed were documented within the rotor sweep zone. The
PGC has determined that spring raptor migration surveys are not warranted at this site because

40
few bald and golden eagles were documented and, of those that were documented, none were
documented within the rotor sweep zone.
Post-construction Bat Acoustic Surveys
Can bat acoustic data be correlated with mortality? No post-construction bat acoustic
surveys were completed in 2007, but three sites in 2008 and two sites in 2009 conducted post-
construction bat acoustics.
In 2008, two of the four sites (both being low potential bat risk sites, 2-14 and 2-10) that
conducted post-construction bat acoustics were the same two sites that had operational issues
that prevented them from adhering to the PGC protocols. These two sites had several periods of
time during which the turbines were non-operational and thus mortality at both sites was
reduced. Acoustic detectors (both Anabat SD1 and Anabat II at each site) were deployed in the
guy wires of MET towers and documented a peak in activity levels of migratory bats between
mid-August and mid-September at both sites. Although nightly peaks in acoustic activity did not
correspond to mortality events, the documentation of higher levels of acoustic activity of
migratory bat species at both sites during this time period may suggests movement of these
species through the area.
The third site (high potential bat risk site, 2-2) that conducted post-construction bat acoustics
(Anabat II detector) concurrent with mortality monitoring in 2008 documented a slight
correlation between hoary bat mortality and activity. There was little evidence that the number
of bat fatalities occurring on the site on each night was related to total number of calls recorded
each night. There was only a slight relationship between hoary bat fatality and hoary bat
activity, but no relationship was found for all bat species combined. These results indicate that
the potential for predicting future impacts to bats from pre-construction activity data appears
limited based on this one year study. However, the researchers did suggest that measurements of
activity further into the rotor swept zone may be more closely related to observed fatality, and
that detectors placed on turbine nacelles may prove useful for predicting fatality. Overall, the
post-construction acoustic findings were highly variable among turbines and among nights.
In 2009, the same high potential bat risk site (2-2) that found a slight relationship between hoary
bat activity and hoary bat mortality, conducted a second year of bat acoustics (voluntary –
second year was not required by the Cooperative Agreement). The second year of post-
construction bat acoustics (Anabat II detector) did not document a relationship between hoary
bat activity and mortality. The post-construction acoustic findings were highly variable among
turbines and among nights in both years (2008 and 2009) of the study. Direct models relating
fatality to activity at each turbine on each night detected only a weak relationship for all bats in
2008 and no relationship in 2009. Models on the scale of the individual turbine detected no
relationship at any height. Only the site scale model indicated a fairly strong relationship
between hoary bat fatality and hoary bat activity in 2008, but not in 2009, and no relationship
was found for all bat species combined with this model in either year.
The second post-construction bat acoustic survey in 2009 was conducted a moderate potential
bat risk site (5-5) and did not adhere to PGC protocols. Bat acoustic detectors (Anabat SD1)
were supposed to be conducted from the nacelle of a turbine but the PGC later learned that the
acoustics were conducted at a detector that was placed at 10 m near a turbine. Success was less

41
than 80% for this study. Data were not collected during peak bat activity periods because of data
overload, there was a failure to swap cards, there were card reading failures, and/or equipment
malfunctions. Due to the various consultant and survey issues at this site, the survey data from
2009 were deemed unacceptable and the Cooperator is conducting an additional year of
monitoring using a different consultant.
Of the four sites that conducted post-construction bat acoustics, only one of the sites also
conducted pre-construction bat acoustics. This site also conducted two years of post-
construction bat acoustic surveys in 2008 and 2009. This site was grandfathered into the
Cooperative Agreement and thus was not obligated to conduct pre-construction bat acoustic
surveys, but at the time the developer signed the Cooperative Agreement, they had already done
the pre-construction bat acoustic surveys. The researcher who conducted these bat acoustic
surveys is currently looking at both pre- and post-construction bat acoustic data to determine if
there are any correlations.
Post-construction Radar Surveys
Marine surveillance radar surveys were conducted at two sites (2-10 and 2-14) for twelve
days between September 8 and October 10, 2008. Targets ranged from 128-681 targets/km/hr.
Only two carcasses (one bat on September 16 and one bird on October 10) were found during
standard searches on days that followed nocturnal radar surveys. Both carcasses were fresh,
indicating they had collided with a turbine the previous night. The second bird was found the
morning after the second highest passage rate was recorded for the survey (October 9).
However, this survey did not yield sufficient data for determining if there exists a correlation
between radar data and mortality rates.
Correlation between Pre-construction Breeding Bird Surveys and Post-construction Mortality
Only one of the three sites with state endangered bird mortality in 2009 had conducted
pre-construction breeding bird surveys (all three sites were grandfathered into the agreement,
therefore pre-construction breeding bird surveys were not required). The species of endangered
bird that was documented as a fatality in 2009 had not been documented during the pre-
construction breeding bird surveys at the site where they were conducted. Breeding bird surveys
are used to determine risk to residential breeding birds however the endangered bird fatality in
question was deemed to be a migrant by the PGC based on the time of year the mortality
occurred and because there is no breeding habitat for that species in the vicinity of the project.
Post-construction Woodrat Surveys
A woodrat study is being conducted at one Pennsylvania site by a Cooperator to
document whether woodrats are being impacted by that particular wind energy project. This site
conducted pre-construction surveys to obtain baseline data and will be conducting several years
of post-construction surveys once the site is built. The study will include trapping, telemetry,
food availability, and predator presence.
Contributions to Other Wind Related Studies
A total of 1,109 samples (493 tissues and 616 hair) were collected from 630 Pennsylvania
wind site bat carcasses in 2008 and 2009 and submitted to Eric Britzke of United States Army
Corps of Engineers, Engineer Research and Development Center, Vicksburg, MS (who is
working with Susan Loeb, Southern Research Station, United States Forest Service, Clemson

42
University, Clemson, SC and Maarten Vonhof, Department of Biological Sciences, Western
Michigan University, Kalamazoo, MI) for use in various ongoing bat genetic studies.
In 2009, 24 bat heads were submitted to the Center for Disease Control Rabies Laboratory,
Atlanta, GA for a study investigating the prevalence of rabies infection in bats that are struck by
wind turbines. All of the carcasses from which the heads were submitted, were collected no
more than one-two days post-collision and all had visible signs of collision (laceration, broken
wings, etc.). All 24 Pennsylvania bats tested negative for rabies.
In 2009, wing scores from 830 bats collected at Pennsylvania wind sites were submitted for use
in the study entitled White Nose Syndrome: Multi-state Coordination, Investigation and
Response to an Emerging Wildlife Health Threat. Scoring was conducted following the Wing-
Damage Index Used for Characterizing Wing Condition of Bats Affected by White-nose
Syndrome (Reichard, n.d.).
SIGNIFICANT FINDINGS FROM COOPERATORS’ SURVEYS
2007.--During the first year of the Cooperative Agreement, several new wildlife findings
occurred. The first was the discovery of the second largest Indiana bat maternity colony in
Pennsylvania during an Indiana bat telemetry project that was funded by two Cooperators in
2007.
The second discovery was of the first lactating silver-haired bat recorded in Pennsylvania and
subsequent discovery of a silver-haired bat maternity colony in 2007. The bat was captured
during pre-construction mist net surveys, conducted by a Cooperator, and was tracked to a roost
tree that contained 24 individuals, including juveniles.
2008.--Telemetry surveys were conducted on small-footed and Indiana bats that were captured
on proposed wind sites. Capture locations, roost locations, and foraging areas were documented
and submitted for inclusion into the Pennsylvania Natural Diversity Inventory (PNDI). See the
Bats: Telemetry section for further information.
2009.--A new Indiana bat hibernacula was discovered in 2009. Small-footed bat telemetry
documented roost locations and foraging areas that were submitted for inclusion into PNDI. See
the Bats: Telemetry section for further information.
The second significant finding was of two Seminole bat (Lasiurus seminolus) fatalities
documented at one site during post-construction mortality monitoring surveys. Seminole bats
are known to occur in Pennsylvania, but are uncommon. The two carcasses were in excellent
condition and one was submitted to the Carnegie Museum of Natural History, Pittsburgh and the
second to The State Museum of Pennsylvania, Harrisburg to be preserved as voucher specimens.
BEST MANAGEMENT PRACTICES
As part of the Cooperative Agreement, Cooperators agree to utilize, to the greatest extent
possible, all reasonable and feasible generally accepted wind industry and PGC approved best
management practices (BMP) relevant to the conservation of wildlife resources during
construction and subsequent operation of their wind energy facility. The PGC, in cooperation
with the Pennsylvania Wind and Wildlife Collaborative and Cooperators, has drafted best

43
management practices. These BMPs have been endorsed by the PGC and can be found in
Appendix G. We anticipate that the BMP‟s will be incorporated into the Cooperative Agreement
in 2011.
AVOIDANCE, MINIMIZE, AND MITIGATION BY COOPERATORS
Avoidance
In the first 18 months of the PGC Wind Energy Voluntary Cooperative Agreement, three
proposed wind sites were abandoned by four developers due to potential wildlife resource
impacts. Since then the PGC has not been made aware of any additional wind sites that have
been abandoned due to potential wildlife resource impacts.
Minimization efforts from Cooperators have included the following:
1. Reduction of overall project size to minimize wildlife impacts.
2. Additional evaluation and/or elimination of project areas within five miles of known
hibernacula containing the federally protected Indiana bat. At the request of the U.S. Fish
and Wildlife Service, the Indiana bat hibernacula buffer was extended from five miles to ten
miles in the PNDI during the spring of 2010.
3. Avoidance of existing forested landscape and use of disturbed lands to the maximum extent
possible.
4. Placement of turbines on reclaimed strip mine lands to avoid land clearing.
5. Elimination of planned turbines on ridge tops near raptor flyways.
6. Turbines set back 50 – 400 m off escarpments to minimize potential raptor collisions.
7. Movement of turbines 30 – 100 feet away from potential woodrat habitat.
Mitigation efforts:
1. Plans to place bat gates on up to three hibernacula of concern. The gates are designed to
control third party access to critical bat habitat. None of the hibernacula have been gated to
date.
2. Funds were contributed in 2009 to acquire land containing habitat for the state-listed
threatened upland sandpiper (Bartramia longicauda). The land (a portion of State Game
Lands #93) has since been purchased.
3. Plans to create small-footed bat roost habitat at two proposed wind sites where small-footed
bat roost habitat is being lost. Both sites are currently in the permitting stage and thus the
alternative roost structures have yet to be built.
4. The PGC has requested curtailment at two proposed wind sites due to high bat risk. Both
sites are currently in the permitting stage and thus have not yet been built.
5. Voluntary replacement of consultants that were identified by the PGC as failing to provide
the necessary monitoring data. This issue arose due to negligence of the consultant to follow
PGC protocols even after guidance was provided by the PGC.
6. Indiana Bat Conservation Fund (IBCF) has been established to provide a dedicated source
of funding that will 1) ensure that the direct, indirect, and cumulative adverse effects on
the federally and state-listed endangered Indiana bats are adequately offset within the
Pennsylvania and 2) result in tangible conservation and recovery benefits to the Indiana
bat within the Commonwealth of Pennsylvania. The IBCF will be used to fund projects
important to the conservation and recovery of the Indiana bat within Pennsylvania. The
USFWS, during project review will determine if and when use of the IBCF is appropriate,

44
consistent with the most recent Indiana Bat Mitigation Guidance for Pennsylvania. It is
agreed and understood that the IBCF will not be used for reviews of wind power projects,
unless the wind developer has signed onto the PGC Cooperative Agreement and is in
compliance with that Agreement.
RESEARCH
Research done or in progress:
Assessing Conservation Needs of Eastern Golden Eagles in Pennsylvania.-- The goal of this
research project is to collect information on where and how the unique eastern population of
golden eagles migrates through Pennsylvania and to use these data to provide statewide maps
showing the relative risk to eagles from development of wind power. These maps will provide a
crucial tool for managers, policy makers and legislators to guide development of wind power
throughout the state. This project is being funded by the State Wildlife Grant program and is
currently active (Todd Katzner, West Virginia University).
Testing Solutions to Bat Fatalities by Wind Turbines: Proactive Response to Threats.—Two
Pennsylvania wind energy facilities have participated in a program designed to test deterrence
and curtailment options to reduce the threat of wind turbines to bats
(http://www.batsandwind.org). The curtailment study was conducted in 2008-09 and showed 44-
93% reduction in bat mortality with cut-in speeds of five m/s (Arnett et al. 2010). A bat
deterrent study is currently (2009-2010) underway at another Pennsylvania wind site.
Preliminary results suggest turbines with deterrents have 20-53% fewer bat fatalities compared to
those without deterrents. While these findings are encouraging, more experimentation is needed
and we do not yet have an operational deterrent device for broad-scale mitigation (BWEC e-
Newsletter v. 8 July 2010). Portions of the bat deterrent study have been funded by the State
Wildlife Grant program.
Suggested research needs:
There is still much research needed to help us better understand what impacts wind development
has on wildlife and what can be done to help avoid and minimize impacts. Research topics
include:
1. Mitigation experiments (such as curtailment) at multiple sites – testing various treatments
(cut-in speeds, time of year) and determining which are most effective for reducing mortality
and at what economic cost to the industry.
2. Impacts to bat populations – determine population size of bat species (genetic studies) and
how mortality from wind sites is affecting them; cumulative effects of mortality on bat
populations; effects of habitat and landscape alteration on bat populations.
3. Migratory pathways of bats – little is known about migratory tree bats, which are being killed
in the greatest numbers; more information is needed on these species in regards to where and
when they migrate.
4. Improving mortality estimating protocols – find better ways to estimate mortality while
minimizing cost to industry.
5. Improving mortality estimators – develop better estimators and techniques to determine
impacts to bat populations.
6. Determine if there are any correlations between pre-construction surveys and post-
construction mortality.

45
7. Determining why bats appear to be attracted to wind turbines – testing current hypotheses;
identify attraction in order to reduce the appeal, if feasible.
8. Bat deterrents – evaluate current bat deterrents under different operating conditions and
turbine characteristics at multiple sites in regards to reducing bat mortality and cost
effectiveness.
9. Conduct monitoring on high risk, priority non-Cooperator wind facilities currently operating
in Pennsylvania in an effort to correlate existing statewide data derived from Cooperators‟
who have sites located in the general proximity.
10. Techniques to minimize forest fragmentation and manage vegetation at wind development
facilities to best protect Pennsylvania‟s birds of greatest conservation need and their habitats.
OVERALL SUCCESSES/CHALLENGES
Successes
1. Avoidance/abandonment of three sites in areas to avoid high mortality risk to wildlife.
2. Many Cooperators are pro-active in terms of getting PGC input early in the planning stages –
sharing of data between PGC and developers is helping developers make better decisions in
regards to siting wind facilities.
3. Pre-construction survey data continues to be received by the PGC resulting in improved site
locations for wind turbines, thus reducing potential adverse impacts to wildlife resources.
4. Research on bat deterrents and curtailment has shown promise to reduce bat mortality at
operational wind sites.
5. The Cooperative Agreement has been recognized on a national level with at least one
neighboring state following a similar model. Ohio DNR has used the Cooperative
Agreement as a model for its wind energy cooperative agreement which will allow for ease
of data comparison across state boundaries.
6. The Commonwealth established a new Right-to-Know Law 65 P.S. §§ 67-101-67.3103,
effective January 1, 2009. That law changed the definition of public record and expanded
the categories of documents that are exempt from disclosure. In order to clarify for the
PGC and the public how the new Right-to-Know law will be implemented by the PGC, the
PGC Commissioners unanimously voted on April 20, 2010 to amend 58 Pa. Code to
include §131.9 (Disclosure of certain records). With regard to wind power records, the
amendment stated: In accordance with the Right-to-Know law (65 P.S. §§ 67-101-
67.3103), public access to the following records, wherever located, will and shall only be
made as set forth in paragraphs (1) – (4) below: (1) Wind power records. Commission
annual reports and Pennsylvania Natural Heritage Program clearance correspondence
respecting existing or proposed wind power facilities will be provided upon request, but
redacted as necessary. All other records are pre-deliberative, proprietary or tending to
identify the location of threatened or endangered species and will not be disclosed. This
change was, in part, needed to better protect the species of concern data collected by the
wind energy cooperators’ voluntary monitoring efforts.
Challenges
1. Some wind developers with proposed and/or active sites in Pennsylvania have not yet signed
the Cooperative Agreement and are not following suggested PGC monitoring and
avoidance/minimization processes. The PGC will continue to investigate all wind sites,
paying careful attention to those not signed into the Cooperative Agreement, in an effort to

46
further ascertain what avenues, including potential legal action, may be deemed appropriate
to safeguard and conserve bat and bird species within the project area.
2. Cooperators are not always updating the PGC on the status of projects nor are they providing
up-to-date maps; this inhibits the PGC‟s ability to provide a complete review of project areas.
As a proposed solution, the PGC encourages Cooperators to delineate larger potential project
areas rather than smaller ones to ensure that all potential wildlife impacts are identified early
on in the planning stages.
3. Protocols are still not being followed completely. The surveys with the most issues are bat
acoustics followed by breeding bird surveys, as discussed above under pre-construction
surveys. PGC strongly recommends that all Cooperators and their consultants communicate
with the PGC prior to commencing surveys to review survey site locations and protocol
details to ensure that the surveys are being done efficiently and in accordance with the
Cooperative Agreement. The PGC not only attempts to provide guidance prior to the surveys
starting, but also attempts to be on site for at least one day of every survey being conducted
at each site to answer questions, provide guidance, and help to remedy any problems as soon
as possible.
4. Keeping sites that were abandoned by responsible developers due to very high risk of
wildlife impacts from being developed by another developer.
5. Keeping the wind biologist positions filled during to the current state budget crisis. Due to
the hiring freeze and promotions within the agency several of the positions have been vacant
during the past two years.
6. Survey reports and data are not submitted in a timely manner. Pre-construction survey
reports are not always being submitted by the end of the calendar year. The PGC continues
to stress the importance of submitting survey reports and data as soon as possible so that
potential issues can be resolved sooner than later. Likewise, the PGC continues to ask that
Cooperators not submit pre-construction survey reports all at once, at the conclusion of all
surveys. Submitting all the reports and data in this fashion, usually right before the
developer is planning on submitting applications for permits, does not give the PGC or
developer adequate time to resolve potential issues. If there are potential issues, additional
surveys may be warranted, which may result in delays to the project‟s development timeline.
These delays can be best avoided by submitting survey reports and data to the PGC in a
timely fashion, as soon as possible after the conclusion of the survey. Post-construction
surveys must be submitted by December 31 of the survey year as per the Special Use Permit.
FUTURE
Wind energy development in Pennsylvania continues to occur and, with the creation of
the Cooperative Agreement, the PGC has and continues to gain much information regarding the
impacts to birds and mammals. Information collected from these data continues to provide
needed insight into which species are at risk from wind energy development and helps all
involved parties determine the best ways to avoid and minimize impacts to birds and mammals
from wind energy development. As analysis of the information produced from the Cooperative
Agreement continues, both the wind energy industry and the PGC will be more equipped with
the knowledge to make better decisions regarding the protection and conservation of the
Commonwealth‟s wildlife resources.
We now have three years of post-construction mortality monitoring data from eight different
sites. At the conclusion of the 2010 season, we will have four years of mortality monitoring data

47
from a combination of ten different sites (note that each site conducts mortality monitoring for
two years). As our dataset increases, we have been better able to detect trends and determine
which species are at risk from wind energy development. We will continue to further analyze
our increasing dataset for other trends and use the data to better site wind energy projects.
The relationships between the PGC and Cooperators continue to grow and communication is
improving. The PGC will keep working with Cooperators in all stages of wind energy
development to safeguard and conserve birds and mammal wildlife resources.
The PGC is committed to making sure all wind energy projects, including non-Cooperators, are
employing feasible measures to protect and minimize adverse impacts, which are anticipated to
occur to the Commonwealth‟s bat and bird resources. The Best Management Practices that have
been created will aid both the PGC and Cooperators in avoiding and minimizing impacts from
wind energy. The PGC will continue to investigate the monitoring efforts and mortality of birds
and bats at non-Cooperator wind energy sites using the PGC‟s limited resources, prioritized by
project site location and risk assessment from the PGC‟s internal reviews.
With the unprecedented decline in bats due to white nose syndrome in Pennsylvania and other
states, it is anticipated that additional bat species will be added to the state and federal listings of
threatened and endangered species. Cooperators continue to work with the PGC to avoid and
minimize impacts to bats and will therefore be in a better position to deal with new regulations as
new bat species are listed compared to non-Cooperators who have not been working with the
PGC to minimize impacts to bats.
The PGC recognizes that each project is unique and therefore remains committed to all
Cooperators to keep the Cooperative Agreement both flexible and adaptive. As information and
subsequent analysis of data generated through the Cooperative Agreement continues, the PGC
will work collaboratively with all the Cooperators to incorporate proposed revisions. At this
time, the PGC does not have enough evidence to support deletion of any of the current surveys.
However, feedback from the Cooperators has indicated that further clarification to specific
protocol guidelines is needed (e.g. bat acoustics, breeding bird survey). The PGC will work with
Cooperators to provide further written guidance for bat acoustic surveys in early 2011. Further,
there remains a critical need to compare pre- and post-construction results from several sites
before making any major changes to the Cooperative Agreement that would result in eliminating
surveys or changing protocols. Encouragingly though, there has been a wealth of information on
wildlife impacts from wind energy development already collected through the Cooperative
Agreement.
In summary, the PGC‟s Wind Energy Voluntary Cooperative Agreement continues to be
successful and achieve its intended purpose. The Cooperative Agreement has allowed
Pennsylvania to become one of the national leaders in determining and addressing wildlife
impacts from wind energy development. Due to all the collaborative efforts between the wind
industry and PGC, the Cooperative Agreement has and will continue to provide all involved
parties with valuable information needed to best manage wildlife at wind energy sites.
Cooperating wind companies have set an example that others should aspire to follow. These
Cooperators have proven to be partners in developing conscientious renewable energy with the

48
highest regard to the Commonwealth‟s wildlife resources to the mutual benefit of all the citizens
of the Commonwealth of Pennsylvania.
REFERENCES Arnett, E. B., M. M. P. Huso, J. P. Hayes, and M. Schirmacher. 2010. Effectiveness of changing
wind turbine cut-in speed to reduce bat fatalities at wind facilities. A final report submitted to
the Bats and Wind Energy Cooperative. Bat Conservation International. Austin, Texas, USA.
Arnett, E. B., M. R. Schirmacher, M. M. P. Huso, and J. P. Hayes. 2009. Patterns of bat fatality at the
Casselman Wind Project in south-central Pennsylvania. An annual report submitted to the
Bats and Wind Energy Cooperative and the Pennsylvania Game Commission. Bat
Conservation International. Austin, Texas, USA.
Arnett, E.B., technical editor. 2005. Relationships between bats and wind turbines in
Pennsylvania and West Virginia: an assessment of bat fatality search protocols, patterns
of fatality, and behavioral interactions with wind turbines. A final report submitted to the
Bats and Wind Energy Cooperative. Bat Conservation International. Austin, Texas,
USA.
Bats and Wind Energy Cooperative. BWEC e-Newsletter v. 8 July 2010.
www.batsandwind.org.
Brandes, D., 1998. Spring golden eagle passage through the northeast U.S. - evidence for a
geographically concentrated flight? HMANA Hawk Migration Studies 23(2): 38-42.
Brandes, D. 2006. Wind Power Development and Raptor Migration in the Central Appalachians.
Hawk Migration Studies – Spring 2006: 20 – 25.
Brodeur, S., Decarie, R., Bird, D., and M. Fuller. 1996. Complete migration cycle of golden
eagles breeding in northern Quebec. Condor 98:293-299.
Capouillez, W.A., Librandi Mumma, T.M. 2008. Pennsylvania Game Commission Wind Energy
Voluntary Cooperative Agreement First Annual Report. April 18, 2007 – September 30,
2008. Pennsylvania Game Commission. Harrisburg, Pennsylvania, USA.
http://www.pgc.state.pa.us
Capouillez, W.A., Gross, D., Turner, G., et al. 2007. Pennsylvania Game Commission Wind
Energy Voluntary Cooperative Agreement. Pennsylvania Game Commission.
Harrisburg, Pennsylvania, USA. http://www.pgc.state.pa.us
Chesser, R. Terry, Richard C. Banks, F. Keith Barker, Carla Cicero, Jon L. Dunn, Andrew W.
Kratter, Irby J. Lovette, Pamela C. Rasmussen, J. V. Remsen, James D. Rising, Douglas
F. Stotz, Kevin Winker. 2010. Fifty-first supplement to the American Ornithologists'
Union Check-List of North American Birds. Auk 127(3):726-744.

49
Erickson, W.P., Jeffrey, J., Kronner, K., and K. Bay. 2004. Stateline Wind Project Wildlife
Monitoring Final Report, July 2001 – December 2003. Technical report peer-reviewed
by and submitted to FPL Energy, the Oregon Energy Facility Siting Council, and the
Stateline Technical Advisory Committee.
Farmer, C. J., Bell, R. J., Drolet, B., Goodrich, L. J., Greenstone, E., Grove, D., Hussell, D. J. T.,
Mizrahi, D., Nicoletti, F. J., and J. Sodergren. 2008. Trends in autumn counts of
migratory raptors in northeastern North America, 1974-2004. Pages 179-215 in K. L.
Bildstein, J. P. Smith, E. R. Inzunza, and R. R. Veit, editors. State of North America‟s
Birds of Prey. Series in Ornithology, No. 3. Nuttall Ornithological Club and the
American Ornithologists‟ Union. Cadmus Communications, Lancaster, Pennsylvania,
USA.
Goodrich, L. J. and J. P. Smith. 2008. Raptor migration in North America. Pages 37-149 in K. L.
Bildstein, J. P. Smith, E. R. Inzunza, and R. R. Veit, editors. State of North America‟s
Birds of Prey. Series in Ornithology, No. 3. Nuttall Ornithological Club and the
American Ornithologists‟ Union. Cadmus Communications, Lancaster, Pennsylvania,
USA.
Katzner, T., Brandes, D., Lanzone, M., Miller, T., and D. Ombalski. 2008. Raptors and wind
energy development in the central Appalachians: where we stand on the issue. National
Aviary. Version 2.0. Pittsburgh, Pennsylvania, USA.
Mahan, C. G., M. A. Steele, M. J. Patrick, and G. L. Kirkland. 1999. The Status of the Northern
Flying Squirrel (Glaucomys sabrinus) in Pennsylvania. J. Pennsylvania Academy
Science 73(1):15-21.
Mahan, C. G., J. Bishop, M. A. Steele, G. G. Turner, and W. Myers. 2007. Habitat
Characteristics and Revised Gap Landscape Analysis for the Northern Flying Squirrel
(Glaucomys sabrinus), a State Endangered Species in Pennsylvania. Unpublished Report
to the Pennsylvania Game Commission, State Wildlife Grants Program. 28pp. Submitted
August 2008 to Journal of Wildlife Management.
McWilliams, G. M. and D. W. Brauning. 2000. The birds of Pennsylvania. Cornell University
Press, Ithaca, New York, USA.
Mixon, K. 2008. Allegheny woodrat (Neotoma magister): the environmental review process for
Pennsylvania. Pennsylvania Game Commission. Harrisburg, Pennsylvania, USA.
Williams, L., et al., editors. 2005. Pennsylvania Comprehensive Wildlife Conservation Strategy.
Pennsylvania Game Commission and Pennsylvania Fish and Boat Commission. Version
1.0. Harrisburg, Pennsylvania, USA.

50
APPENDIX A: Summary of pre-construction fall raptor migration surveys done at Pennsylvania wind sites, 2004 – present. Raptor species are designated by AMKE=American
kestrel, BAEA=Bald eagle, BLVU=Black vulture, BWHA=Broad-winged hawk, COHA=Cooper‟s hawk, GOEA=Golden eagle, MERL=Merlin, NOGO=Northern Goshawk,
NOHA=Northern harrier, OSPR=Osprey, PEFA=Peregrine falcon, RSHA=Red-shouldered hawk, RTHA=Red-tailed hawk, RLHA=Rough-legged hawk, SSHA=Sharp-shinned
hawk, TUVU=Turkey vulture, and Unidentified raptor.
Percent in Flight
Wind
Site
Raptor
Risk Year Dates
#
days
hrs/
day
total
observation
hours
raptors/
hr
total #
raptor
spp
total #
raptors
observed AM
KE
BA
EA
a
BL
VU
BW
HA
b
CO
HA
GO
EA
c
ME
RL
NO
GO
d
NO
HA
e
2-2 L 2004 10/7-11/15 37 6.8 251 4.0 13 997 1.6 0.4 2.3 0.0 4.3 0.5 0.0 0.3 8.4
3-2 H 2005 10/09-12/14 54 6.4 348 2.3 12 792 0.0 1.1 0.0 0.0 1.3 6.6 0.0 0.1 0.8
2-7 L 2006 9/1-11/15 33 7.4 245 2.3 13 552 0.4 0.4 3.4 9.8 2.4 0.4 0.4 0.0 0.7
2-15 L 2006 10/25-12/1 34 7.4 253 1.3 8 322 0.9 0.0 0.0 0.0 5.3 0.3 0.6 0.3 8.1
2-1 L 2006 9/14-10/13 10 6.0 60 10.4 10 622 1.4 0.5 0.0 56.3 0.5 0.0 0.0 0.0 2.3
6-1 L 2006 9/1-11/15 62 7.2 445 4.6 16 2058 1.4 0.9 5.9 20.4 1.5 0.0 1.4 0.1 2.7
6-3 L 2006 9/1-11/15 62 7.2 445 4.6 16 2058 1.4 0.9 5.9 20.4 1.5 0.0 1.4 0.1 2.7
5-6 M 2006 9/15-11/14 28 7.3 206 3.0 14 616 2.3 3.1 0.0 6.8 3.9 0.3 3.9 0.0 0.6
5-15 L 2007 9/16-12/17 5 8.0 40 3.6 10 144 0.7 0.0 0.0 41.7 4.2 0.0 1.4 2.8 1.4
3-6 L 2007 9/17-12/16 14 7.8 109 1.4 10 147 0.0 0.7 0.0 53.1 2.0 2.0 0.0 0.7 1.4
35-1 L 2007 9/13-9/19 2 8.0 16 6.3 12 101 5.0 4.0 0.0 29.7 5.9 1.0 3.0 0.0 2.0
2-4 M 2007 9/10-12/18 51 6.1 310 1.4 15 419 7.2 1.0 0.0 11.5 1.0 1.0 1.4 1.0 10.0
2-5 M 2007 9/10-12/18 51 6.1 310 1.4 15 419 7.2 1.0 0.0 11.5 1.0 1.0 1.4 1.0 10.0
4-3 M 2007 8/24-12/14 74 7.9 584 0.9 13 514 1.2 0.8 11.7 19.1 1.4 1.0 0.0 0.0 0.6
3-4 H 2007 8/25-12/14 67 7.6 507 1.5 15 2014 0.6 2.1 0.8 23.2 2.3 3.6 0.2 0.0 1.9
24-2 H 2007 8/24-12/14 67 7.1 478 2.8 14 1332 0.4 1.4 0.0 17.9 2.2 3.0 0.2 0.1 1.1
2-18 H 2007 8/26-12/14 76 7.7 586 2.1 16 1207 0.7 0.7 0.2 18.4 4.0 3.5 0.2 0.2 1.2
5-14 L 2008 9/23-12/14 5 8.2 41 3.3 11 137 1.5 0.0 0.0 4.4 16.8 1.5 0.0 1.5 2.2
2-25 L 2008 9/16-12/15 10 8.0 80 2.6 9 209 0.5 0.0 6.2 6.7 5.3 0.0 0.0 0.0 1.0
6-10 M 2008 9/3-11/24 28 5.6 158 1.7 12 276 6.5 1.8 5.1 36.6 7.6 0.0 0.4 0.0 5.8
6-12 H 2008 8/15-12/15 76 7.7 1170 2.8 16 3268 1.4 1.4 6.2 27.0 2.0 0.7 0.3 0.1 0.9
6-11 H 2008 8/15-12/15 76 7.9 598 6.6 16 3940 1.1 6.3 7.3 16.6 1.8 0.9 0.3 0.3 1.5
2-24 L 2009 8/31-10/22 10 8.0 80 2.8 11 220 15.9 1.4 3.2 6.8 2.3 0.5 0.9 0.0 3.6
2-9 M 2009 8/15-12/15 77 8.1 623 0.3 7 167 0 0 0.0 4.8 1.8 0.0 0.0 0.0 2.4
3.1
8080 1.8 3.8 6.5 20.7 2.2 0.7 0.3 0.2 1.4
a Pennsylvania threatened; Pennsylvania Wildlife Action Plan high level concern; b Pennsylvania Wildlife Action Plan maintenance concern; c Pennsylvania Wildlife Action Plan
PA vulnerable; d Pennsylvania Wildlife Action Plan PA vulnerable; e Pennsylvania Wildlife Action Plan high level concern; f Pennsylvania listed threatened; Pennsylvania
Wildlife Action Plan Pennsylvania vulnerable; g Pennsylvania endangered; Pennsylvania Wildlife Action Plan high level concern; h Pennsylvania Wildlife Action Plan
maintenance concern; i Pennsylvania Wildlife Action Plan maintenance concern.
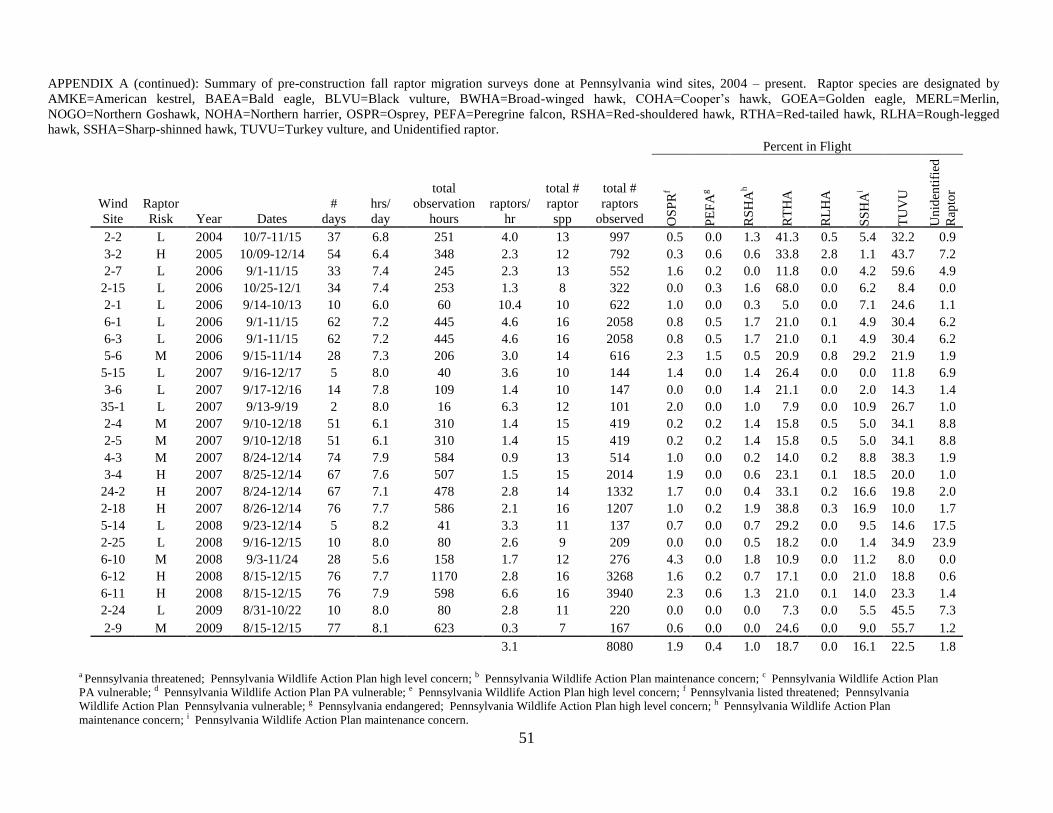
51
APPENDIX A (continued): Summary of pre-construction fall raptor migration surveys done at Pennsylvania wind sites, 2004 – present. Raptor species are designated by
AMKE=American kestrel, BAEA=Bald eagle, BLVU=Black vulture, BWHA=Broad-winged hawk, COHA=Cooper‟s hawk, GOEA=Golden eagle, MERL=Merlin,
NOGO=Northern Goshawk, NOHA=Northern harrier, OSPR=Osprey, PEFA=Peregrine falcon, RSHA=Red-shouldered hawk, RTHA=Red-tailed hawk, RLHA=Rough-legged
hawk, SSHA=Sharp-shinned hawk, TUVU=Turkey vulture, and Unidentified raptor.
Percent in Flight
Wind
Site
Raptor
Risk Year Dates
#
days
hrs/
day
total
observation
hours
raptors/
hr
total #
raptor
spp
total #
raptors
observed OS
PR
f
PE
FA
g
RS
HA
h
RT
HA
RL
HA
SS
HA
i
TU
VU
Un
iden
tifi
ed
Rap
tor
2-2 L 2004 10/7-11/15 37 6.8 251 4.0 13 997 0.5 0.0 1.3 41.3 0.5 5.4 32.2 0.9
3-2 H 2005 10/09-12/14 54 6.4 348 2.3 12 792 0.3 0.6 0.6 33.8 2.8 1.1 43.7 7.2
2-7 L 2006 9/1-11/15 33 7.4 245 2.3 13 552 1.6 0.2 0.0 11.8 0.0 4.2 59.6 4.9
2-15 L 2006 10/25-12/1 34 7.4 253 1.3 8 322 0.0 0.3 1.6 68.0 0.0 6.2 8.4 0.0
2-1 L 2006 9/14-10/13 10 6.0 60 10.4 10 622 1.0 0.0 0.3 5.0 0.0 7.1 24.6 1.1
6-1 L 2006 9/1-11/15 62 7.2 445 4.6 16 2058 0.8 0.5 1.7 21.0 0.1 4.9 30.4 6.2
6-3 L 2006 9/1-11/15 62 7.2 445 4.6 16 2058 0.8 0.5 1.7 21.0 0.1 4.9 30.4 6.2
5-6 M 2006 9/15-11/14 28 7.3 206 3.0 14 616 2.3 1.5 0.5 20.9 0.8 29.2 21.9 1.9
5-15 L 2007 9/16-12/17 5 8.0 40 3.6 10 144 1.4 0.0 1.4 26.4 0.0 0.0 11.8 6.9
3-6 L 2007 9/17-12/16 14 7.8 109 1.4 10 147 0.0 0.0 1.4 21.1 0.0 2.0 14.3 1.4
35-1 L 2007 9/13-9/19 2 8.0 16 6.3 12 101 2.0 0.0 1.0 7.9 0.0 10.9 26.7 1.0
2-4 M 2007 9/10-12/18 51 6.1 310 1.4 15 419 0.2 0.2 1.4 15.8 0.5 5.0 34.1 8.8
2-5 M 2007 9/10-12/18 51 6.1 310 1.4 15 419 0.2 0.2 1.4 15.8 0.5 5.0 34.1 8.8
4-3 M 2007 8/24-12/14 74 7.9 584 0.9 13 514 1.0 0.0 0.2 14.0 0.2 8.8 38.3 1.9
3-4 H 2007 8/25-12/14 67 7.6 507 1.5 15 2014 1.9 0.0 0.6 23.1 0.1 18.5 20.0 1.0
24-2 H 2007 8/24-12/14 67 7.1 478 2.8 14 1332 1.7 0.0 0.4 33.1 0.2 16.6 19.8 2.0
2-18 H 2007 8/26-12/14 76 7.7 586 2.1 16 1207 1.0 0.2 1.9 38.8 0.3 16.9 10.0 1.7
5-14 L 2008 9/23-12/14 5 8.2 41 3.3 11 137 0.7 0.0 0.7 29.2 0.0 9.5 14.6 17.5
2-25 L 2008 9/16-12/15 10 8.0 80 2.6 9 209 0.0 0.0 0.5 18.2 0.0 1.4 34.9 23.9
6-10 M 2008 9/3-11/24 28 5.6 158 1.7 12 276 4.3 0.0 1.8 10.9 0.0 11.2 8.0 0.0
6-12 H 2008 8/15-12/15 76 7.7 1170 2.8 16 3268 1.6 0.2 0.7 17.1 0.0 21.0 18.8 0.6
6-11 H 2008 8/15-12/15 76 7.9 598 6.6 16 3940 2.3 0.6 1.3 21.0 0.1 14.0 23.3 1.4
2-24 L 2009 8/31-10/22 10 8.0 80 2.8 11 220 0.0 0.0 0.0 7.3 0.0 5.5 45.5 7.3
2-9 M 2009 8/15-12/15 77 8.1 623 0.3 7 167 0.6 0.0 0.0 24.6 0.0 9.0 55.7 1.2
3.1
8080 1.9 0.4 1.0 18.7 0.0 16.1 22.5 1.8
a Pennsylvania threatened; Pennsylvania Wildlife Action Plan high level concern; b Pennsylvania Wildlife Action Plan maintenance concern; c Pennsylvania Wildlife Action Plan
PA vulnerable; d Pennsylvania Wildlife Action Plan PA vulnerable; e Pennsylvania Wildlife Action Plan high level concern; f Pennsylvania listed threatened; Pennsylvania
Wildlife Action Plan Pennsylvania vulnerable; g Pennsylvania endangered; Pennsylvania Wildlife Action Plan high level concern; h Pennsylvania Wildlife Action Plan
maintenance concern; i Pennsylvania Wildlife Action Plan maintenance concern.

52
APPENDIX B: Summary of pre-construction spring raptor migration surveys done at Pennsylvania wind sites, 2006 – present. Raptor species are designated by
AMKE=American kestrel, BAEA=Bald eagle, BLVU=Black vulture, BWHA=Broad-winged hawk, COHA=Cooper‟s hawk, GOEA=Golden eagle, MERL=Merlin,
NOGO=Northern Goshawk, NOHA=Northern harrier, OSPR=Osprey, PEFA=Peregrine falcon, RSHA=Red-shouldered hawk, RTHA=Red-tailed hawk, RLHA=Rough-legged
hawk, SSHA=Sharp-shinned hawk, TUVU=Turkey vulture, and Unidentified raptor.
Percent in Flight
Wind
Site Risk Year Dates Days
hrs/
day
total
hrs
raptors/
hr
total
No.
raptor
spp.
Total
No.
raptors AM
KE
BA
EA
a
BL
VU
BW
HA
b
CO
HA
GO
EA
c
ME
RL
NO
GO
d
NO
HA
e
3-2 H 2006 2/25-3-31 34 7.5 254.1 0.9 12 223 1.3 3.6 0.4 0.0 1.3 21.1 0.0 0.0 4.5
2-7 L 2006 4/3-5/29 28 7.0 196.5 2.7 10 523 0.2 0.0 0.2 7.5 8.8 0.0 0.0 0.0 0.6
2-1 L 2006 4/6-5/10 7 5.7 40.0 4.9 10 196 5.6 0.0 0.0 9.2 1.0 0.0 0.0 1.0 7.1
6-1 L 2006 4/20-5/31 37 8.0 295.2 1.0 12 289 0.3 0.7 0.7 7.3 2.1 0.0 0.3 0.3 0.3
6-3 L 2006 4/20-5/31 37 8.0 295.2 1.0 12 289 0.3 0.7 0.7 7.3 2.1 0.0 0.3 0.3 0.3
3-4 H 2007 3/2-4/6 30 7.7 230.0 1.1 10 247 0.4 0.8 0.0 0.0 8.9 7.7 0.0 0.0 4.5
24-2 H 2007 3/1-4/6 32 7.3 232.3 1.6 14 372 1.3 1.6 1.6 0.0 3.2 5.6 0.8 0.5 2.2
2-18 H 2007 4/24-5/3 8 8.6 68.8 2.3 9 161 0.0 1.2 1.9 4.3 0.0 0.0 0.0 0.0 0.6
2-19 H 2007 3/10-4/13 25 7.1 177.3 5.0 13 894 0.6 0.1 1.2 0.0 0.8 0.9 0.8 0.0 0.7
4-3 M 2007 02/27-4/6 34 6.8 230.1 5.6 14 1292 0.9 0.4 2.6 0.1 1.6 2.3 0.2 0.0 0.7
35-1 L 2007 4/3-4/23 2 6.5 13.0 3.3 8 43 0.0 0.0 0.0 7.0 11.6 0.0 0.0 2.3 0.0
2-18 H 2008 3/4-4/25 38 7.8 295.3 1.3 14 388 0.8 2.6 0.0 0.3 0.3 2.1 0.3 0.0 1.0
6-12 H 2008 3/5-4/25 38 10.5 398.0 0.6 15 246 7.3 9.3 6.5 27.6 12.2 0.4 0.4 0.4 2.8
6-11 H 2008 3/1-4/25 42 7.2 301.0 1.8 13 550 3.6 6.7 0.9 44.9 7.3 0.2 0.0 0.4 4.0
2-4 M 2008 3/11-3/31 15 7.6 114.0 0.9 10 101 5.9 1.0 1.0 2.0 0.0 0.0 0.0 0.0 9.9
2-5 M 2008 3/11-3/31 15 7.6 114.0 0.9 10 101 5.9 1.0 1.0 2.0 0.0 0.0 0.0 0.0 9.9
3-6 L 2008 3/10-3/29 6 7.7 46.0 1.6 5 74 1.4 0.0 0.0 0.0 0.0 1.4 0.0 0.0 0.0
5989 1.6 1.7 1.4 7.2 3.4 2.3 0.3 0.2 2.0
a Pennsylvania threatened; Pennsylvania Wildlife Action Plan high level concern; b Pennsylvania Wildlife Action Plan maintenance concern; c Pennsylvania
Wildlife Action Plan Pennsylvania vulnerable; d Pennsylvania Wildlife Action Plan PA vulnerable; e Pennsylvania Wildlife Action Plan high level concern; f Pennsylvania listed threatened; Pennsylvania Wildlife Action Plan Pennsylvania vulnerable; g Pennsylvania listed endangered; Pennsylvania Wildlife Action
Plan high level concern; h Pennsylvania Wildlife Action Plan maintenance concern; i Pennsylvania Wildlife Action Plan maintenance concern.

53
APPENDIX B (continued): Summary of pre-construction spring raptor migration surveys done at Pennsylvania wind sites, 2006 – present. Raptor species are designated by
AMKE=American kestrel, BAEA=Bald eagle, BLVU=Black vulture, BWHA=Broad-winged hawk, COHA=Cooper‟s hawk, GOEA=Golden eagle, MERL=Merlin,
NOGO=Northern Goshawk, NOHA=Northern harrier, OSPR=Osprey, PEFA=Peregrine falcon, RSHA=Red-shouldered hawk, RTHA=Red-tailed hawk, RLHA=Rough-legged
hawk, SSHA=Sharp-shinned hawk, TUVU=Turkey vulture, and Unidentified raptor.
Percent in Flight
Wind
Site Risk Year Dates Days
hrs/
day
total
hrs
raptors/
hr
total
No.
raptor
spp.
Total
No.
raptors OS
PR
f
PE
FA
g
RS
HA
h
RT
HA
RL
HA
SS
HA
i
TU
VU
Un
iden
tifi
ed
Rap
tor
3-2 H 2006 2/25-3-31 34 7.5 254.1 0.9 12 223 0.4 0.0 5.4 25.6 1.8 1.8 28.7 4.0
2-7 L 2006 4/3-5/29 28 7.0 196.5 2.7 10 523 1.7 0.0 0.2 18.0 0.0 2.5 59.8 0.6
2-1 L 2006 4/6-5/10 7 5.7 40.0 4.9 10 196 0.5 0.0 2.0 15.8 0.0 4.1 53.6 0.0
6-1 L 2006 4/20-5/31 37 8.0 295.2 1.0 12 289 4.5 0.0 0.0 5.2 0.0 4.2 72.7 1.4
6-3 L 2006 4/20-5/31 37 8.0 295.2 1.0 12 289 4.5 0.0 0.0 5.2 0.0 4.2 72.7 1.4
3-4 H 2007 3/2-4/6 30 7.7 230.0 1.1 10 247 0.4 0.0 2.0 23.1 0.0 0.8 49.0 2.4
24-2 H 2007 3/1-4/6 32 7.3 232.3 1.6 14 372 0.3 0.0 3.0 18.0 0.5 2.4 55.6 3.2
2-18 H 2007 4/24-5/3 8 8.6 68.8 2.3 9 161 5.0 0.0 0.0 13.0 1.9 6.2 50.3 15.5
2-19 H 2007 3/10-4/13 25 7.1 177.3 5.0 13 894 0.4 0.0 1.0 14.8 0.3 1.9 71.9 4.6
4-3 M 2007 2/27-4/6 34 6.8 230.1 5.6 14 1292 0.3 0.0 2.0 13.8 0.2 2.8 66.5 5.7
35-1 L 2007 4/3-4/23 2 6.5 13.0 3.3 8 43 2.3 0.0 2.3 32.6 0.0 2.3 34.9 4.7
2-18 H 2008 3/4-4/25 38 7.8 295.3 1.3 14 388 0.5 0.5 1.5 11.9 0.3 1.8 76.0 0.3
6-12 H 2008 3/5-4/25 38 10.5 398.0 0.6 15 246 4.9 0.4 2.4 11.8 0.0 3.7 7.7 2.0
6-11 H 2008 3/1-4/25 42 7.2 301.0 1.8 13 550 5.1 0.0 1.5 12.4 0.0 5.5 0.9 6.7
2-4 M 2008 3/11-3/31 15 7.6 114.0 0.9 10 101 0.0 0.0 3.0 17.8 1.0 1.0 54.5 3.0
2-5 M 2008 3/11-3/31 15 7.6 114.0 0.9 10 101 0.0 0.0 3.0 17.8 1.0 1.0 54.5 3.0
3-6 L 2008 3/10-3/29 6 7.7 46.0 1.6 5 74 0.0 0.0 0.0 23.0 0.0 1.4 63.5 9.5
5989 1.6 0.1 1.6 14.6 0.3 2.9 55.2 3.9
a Pennsylvania listed threatened; Pennsylvania Wildlife Action Plan high level concern; b Pennsylvania Wildlife Action Plan maintenance concern; c Pennsylvania
Wildlife Action Plan Pennsylvania vulnerable; d Pennsylvania Wildlife Action Plan Pennsylvania vulnerable; e Pennsylvania Wildlife Action Plan high level
concern; f Pennsylvania listed threatened; Pennsylvania Wildlife Action Plan Pennsylvania vulnerable; g Pennsylvania listed endangered; Pennsylvania Wildlife
Action Plan high level concern; h Pennsylvania Wildlife Action Plan maintenance concern; i Pennsylvania Wildlife Action Plan maintenance concern.

54
APPENDIX C: Summary of breeding bird surveys done pre-construction at proposed wind sites in Pennsylvania, 2006 - present. “Not in report” designation means the
information was not specifically provided in the survey report but does not mean that particular information was not collected.
Wind
Site
Survey
Year
Point
Count
Dates
# Point
Counts
Area Search
Dates
# area
searches Comments
Total #
species
# PA
endangered
species
# PA
threatened
species
# PA
WAP
species
Total #
individual
records Habitat
2-1 2006 June 1-2;
8-9 16 not provided in
report
not
provided in report
Point counts were not conducted in
May and point counts did not adequately cover project area 38 0 0 9 348
forest interior/
grassland/ successional
2-19 2006 N/A N/A May 2 - July 6 2
Point counts and area searches did not adequately cover project area;
survey conducted off project area 73 1 0 16
not in
report
grassland/
forest edge
2-4 &
2-5 2007
May 23-
24; June 6-7; 13-
14 20
May 23-24; June
6-7; 13-14 14
Area searches were not conducted
in mid-March to April period 81 1 0 19 910
grassland/
forest
3-4 2007
May 8-9;
June 5-8 42
not provided in
report
not provided
in report
Second round of point count were
not conducted in June 86 0 0 15 5876
forest-interior/ forest
edge
35-1 2007
May 23-
24; June
5-6; 19-22 34
May 23-24; June 5-6; 19-22 13
Area searches were not conducted in mid-March to April period 97 1 0 20 1346
field/ forest edge/
riparian/
wetland/ mixed forest
24-2 2007
May 10-
11 28
not provided in
report
not
provided
in report
Two rounds of point counts were
not conducted in
June 1 – July 10 106 0 0 23 3567
grassland/
forest-
interior/ forest
edge
2-18 2007
May 31; June 7;
18-19 N/A N/A N/A
Neither point counts nor area searches were conducted; transects
walked 69 1 0 15
not in
report
forest interior/
forest edge
2-7 2007
May 22-23; June
27-30 28 April 23-24
not provided
in report
Area searches not conducted in
May or June nor were second round of point counts in June 1 –
July 10 95 1 0 20 1630
forest-interior/ forest
edge
2-15 2007
May 19;
June 17-
18 18 April 17, 28-28
not
provided
in report
Area searches were not conducted in May or June nor were second
round of point counts in June 1 –
July 10 97 1 1 18 2691
grassland/ forest-
interior/ forest
edge
4-3 2007
May 20-
21; June 19-22 28 April 21-22
not
provided in report
Area searches were not conducted in May or June nor were second
round of point counts in June 1 – July 10 91 1 1 20 3099
forest-
interior/ forest edge
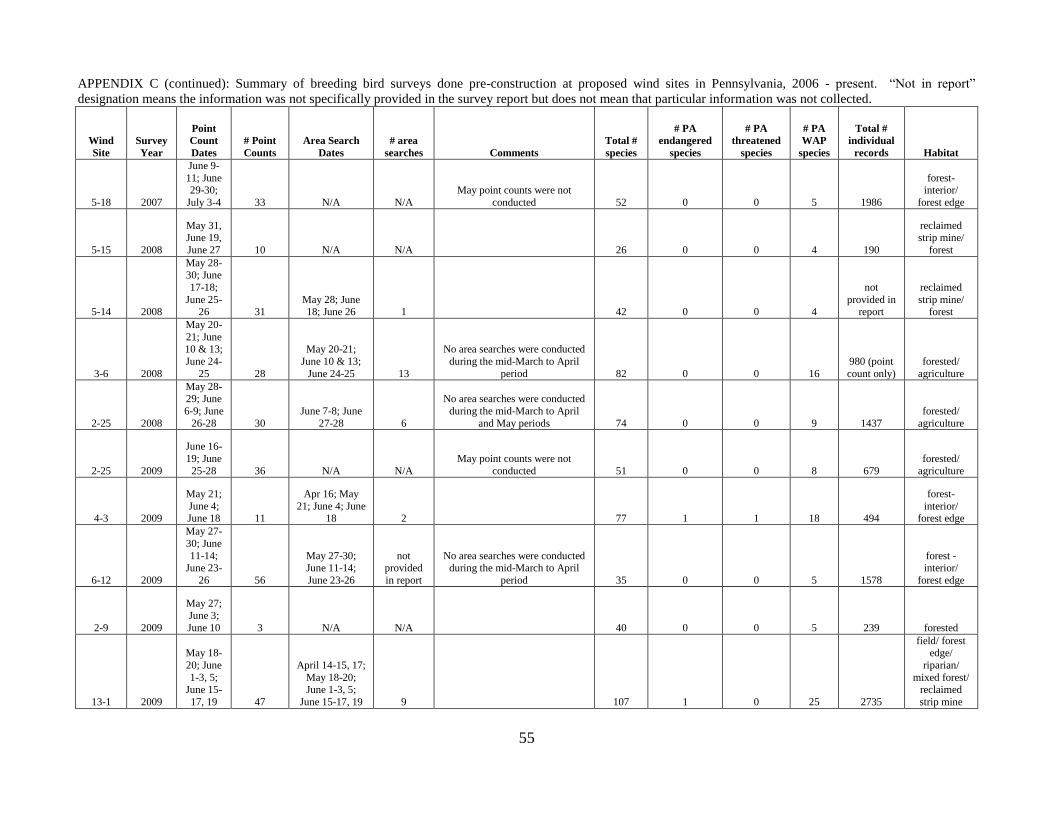
55
APPENDIX C (continued): Summary of breeding bird surveys done pre-construction at proposed wind sites in Pennsylvania, 2006 - present. “Not in report”
designation means the information was not specifically provided in the survey report but does not mean that particular information was not collected.
Wind
Site
Survey
Year
Point
Count
Dates
# Point
Counts
Area Search
Dates
# area
searches Comments
Total #
species
# PA
endangered
species
# PA
threatened
species
# PA
WAP
species
Total #
individual
records Habitat
5-18 2007
June 9-
11; June 29-30;
July 3-4 33 N/A N/A
May point counts were not
conducted 52 0 0 5 1986
forest-interior/
forest edge
5-15 2008
May 31, June 19,
June 27 10 N/A N/A 26 0 0 4 190
reclaimed strip mine/
forest
5-14 2008
May 28-30; June
17-18;
June 25-26 31
May 28; June 18; June 26 1 42 0 0 4
not
provided in report
reclaimed
strip mine/ forest
3-6 2008
May 20-
21; June 10 & 13;
June 24-
25 28
May 20-21;
June 10 & 13;
June 24-25 13
No area searches were conducted
during the mid-March to April
period 82 0 0 16
980 (point
count only)
forested/
agriculture
2-25 2008
May 28-29; June
6-9; June
26-28 30
June 7-8; June
27-28 6
No area searches were conducted
during the mid-March to April
and May periods 74 0 0 9 1437
forested/
agriculture
2-25 2009
June 16-
19; June
25-28 36 N/A N/A
May point counts were not
conducted 51 0 0 8 679
forested/
agriculture
4-3 2009
May 21;
June 4; June 18 11
Apr 16; May
21; June 4; June 18 2 77 1 1 18 494
forest-
interior/ forest edge
6-12 2009
May 27-
30; June
11-14; June 23-
26 56
May 27-30; June 11-14;
June 23-26
not provided
in report
No area searches were conducted during the mid-March to April
period 35 0 0 5 1578
forest - interior/
forest edge
2-9 2009
May 27;
June 3;
June 10 3 N/A N/A 40 0 0 5 239 forested
13-1 2009
May 18-
20; June
1-3, 5; June 15-
17, 19 47
April 14-15, 17;
May 18-20; June 1-3, 5;
June 15-17, 19 9 107 1 0 25 2735
field/ forest edge/
riparian/
mixed forest/ reclaimed
strip mine

56
APPENDIX C (continued): Summary of breeding bird surveys done pre-construction at proposed wind sites in Pennsylvania, 2006 - present. “Not in report”
designation means the information was not specifically provided in the survey report but does not mean that particular information was not collected.
Wind
Site
Survey
Year
Point
Count
Dates
# Point
Counts
Area Search
Dates
# area
searches Comments
Total #
species
# PA
endangered
species
# PA
threatened
species
# PA
WAP
species
Total #
individual
records Habitat
2-5 2009 N/A N/A
April 30; May
28; June 7 3
Area searches were only conducted in one of each of the
three survey periods 24 0 0 4 48 forested
6-10 2009
May 28-31;
June 9-11;
June 23-25 115 N/A N/A 69 2 0 12 2761
reclaimed
strip mine/
forest

57
APPENDIX D: Pennsylvania Wildlife Action Plan priority bird species detected during point counts at Pennsylvania wind sites, 2006 - 2009.
Species habitat*
2-1
2006
2-4 & 2-5
2007
3-4
2007
35-1
2007
24-2
2007
2-18
2007
2-7
2007
2-15
2007
4-3
2007
5-15
2008
5-18
2008
5-14
2008
3-6
2008
2-25
2008
2-25
2009
4-3
2009
6-12
2009
2-9
2009
13-1
2009
6-10
2009
Northern Bobwhite
Human associated farmland types;
scattered shrubs and briars,
interspersed with moderately dense
herbaceous or grassy vegetation in
south central PA X
American Bittern
Wetland, especially extensive
emergent marshes X
Great Blue Heron
Along calm freshwater & usually nest
in trees near water X X X X
Osprey
Rivers, lakes, ponds wetlands. Nests
on large trees, snags, and man-made
platforms X
Sharp-shinned HawkNests in forests usually with conifers
X X X X
Red-shouldered Hawk
Indicator of higher quality and large-
scale forests. Extensive lowland,
deciduous, or mixed forest,
interspersed with small openings and
marshes X X X X X X
Broad-winged Hawk
Indicator of large-scale forests;
Coniferous deciduous forests or
mixed deciduous forests X X X X X X X
American Woodcock
Early successional habitat, moist
fields, thickets, forest clearings and
seeps, brushy swamps X X
Black-billed Cuckoo
Groves of trees, forest edges, &
thickets, frequently near water X X X X X X X X X X X X
Common Nighthawk
Barren grounds, nests on roof of
buildings X
Eastern Whip-poor-will**
Early to mid successional and open,
forested habitats near clearings X X X X X X
Chimney Swift Urban settings & mature forests X X X X X X X X X
Red-headed WoodpeckerSavannah-like forests, parks, swamps
X X X
Yellow-bellied Flycatcher
Boreal conifer forests, swamps, and
streamside wetlands. Restricted to
higher elevations (greater than 1700
feet). Indicator for high quality
forest ecosystems X
*See Appendix C for site habitat descriptions
**sensu Chesser et al. 2010
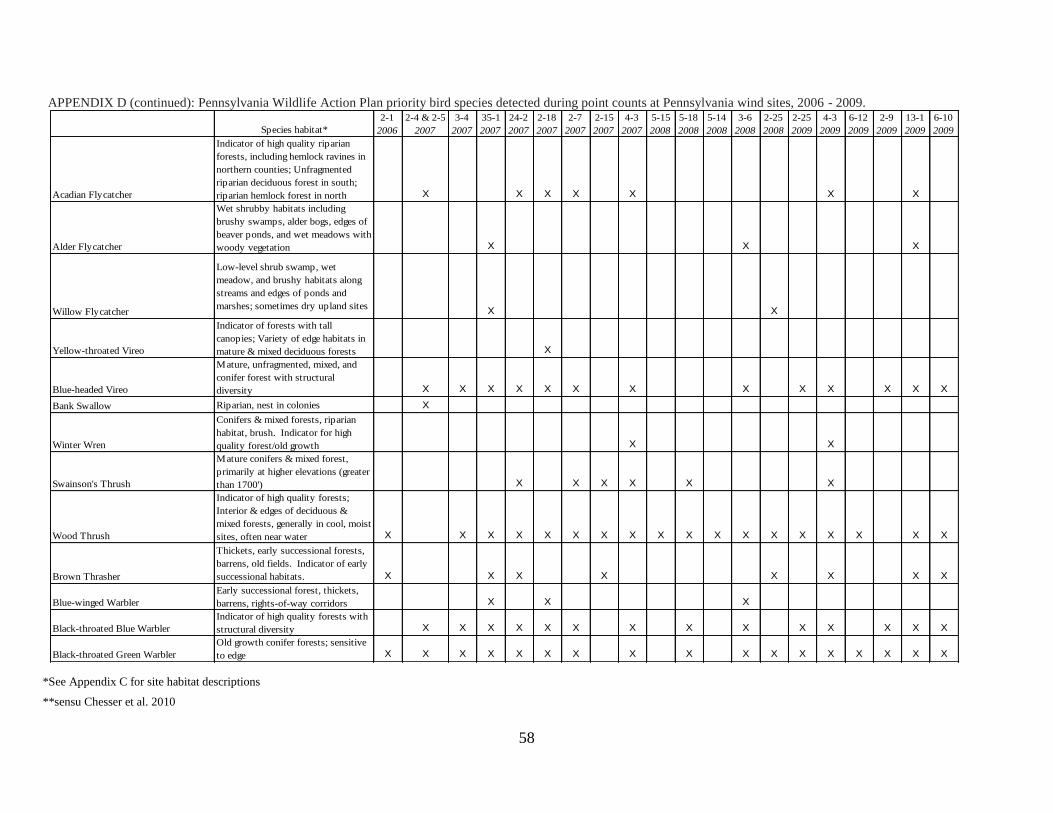
58
APPENDIX D (continued): Pennsylvania Wildlife Action Plan priority bird species detected during point counts at Pennsylvania wind sites, 2006 - 2009.
Species habitat*
2-1
2006
2-4 & 2-5
2007
3-4
2007
35-1
2007
24-2
2007
2-18
2007
2-7
2007
2-15
2007
4-3
2007
5-15
2008
5-18
2008
5-14
2008
3-6
2008
2-25
2008
2-25
2009
4-3
2009
6-12
2009
2-9
2009
13-1
2009
6-10
2009
Acadian Flycatcher
Indicator of high quality riparian
forests, including hemlock ravines in
northern counties; Unfragmented
riparian deciduous forest in south;
riparian hemlock forest in north X X X X X X X
Alder Flycatcher
Wet shrubby habitats including
brushy swamps, alder bogs, edges of
beaver ponds, and wet meadows with
woody vegetation X X X
Willow Flycatcher
Low-level shrub swamp, wet
meadow, and brushy habitats along
streams and edges of ponds and
marshes; sometimes dry upland sitesX X
Yellow-throated Vireo
Indicator of forests with tall
canopies; Variety of edge habitats in
mature & mixed deciduous forests X
Blue-headed Vireo
Mature, unfragmented, mixed, and
conifer forest with structural
diversity X X X X X X X X X X X X X
Bank Swallow Riparian, nest in colonies X
Winter Wren
Conifers & mixed forests, riparian
habitat, brush. Indicator for high
quality forest/old growth X X
Swainson's Thrush
Mature conifers & mixed forest,
primarily at higher elevations (greater
than 1700') X X X X X X
Wood Thrush
Indicator of high quality forests;
Interior & edges of deciduous &
mixed forests, generally in cool, moist
sites, often near water X X X X X X X X X X X X X X X X X X
Brown Thrasher
Thickets, early successional forests,
barrens, old fields. Indicator of early
successional habitats. X X X X X X X X
Blue-winged Warbler
Early successional forest, thickets,
barrens, rights-of-way corridors X X X
Black-throated Blue Warbler
Indicator of high quality forests with
structural diversity X X X X X X X X X X X X X X
Black-throated Green Warbler
Old growth conifer forests; sensitive
to edge X X X X X X X X X X X X X X X X X
*See Appendix C for site habitat descriptions
**sensu Chesser et al. 2010

59
APPENDIX D (continued): Pennsylvania Wildlife Action Plan priority bird species detected during point counts at Pennsylvania wind sites, 2006 - 2009.
Species habitat*
2-1
2006
2-4 & 2-5
2007
3-4
2007
35-1
2007
24-2
2007
2-18
2007
2-7
2007
2-15
2007
4-3
2007
5-15
2008
5-18
2008
5-14
2008
3-6
2008
2-25
2008
2-25
2009
4-3
2009
6-12
2009
2-9
2009
13-1
2009
6-10
2009
Blackburnian Warbler
Mature conifers & mixed forest; Tall
canopy coniferous/mixed forest with
vegetation over 18
meters and densely foliated crowns. X X X X X X
Prairie Warbler
Brushy second growth, dry scrub,
low pine-juniper, mangroves, pine
barrens, burned-over areas, and
sproutlands X X X X X X X X X
Blackpoll Warbler
High elevation, spruce-dominated
wetlands and forests X X X X X X X
Cerulean Warbler
Extensive mature riparian &
mountain forests X X X X X
Worm-eating Warbler
Mature deciduous or mixed
deciduous/coniferous forest w/
patches of dense understory usually
on steep slopes X X X X X X
Louisiana Waterthrush
Indicator of high quality riparian
forests and excellent stream habitat;
Riparian forests; forest interior
species sensitive to edge effect X
Canada Warbler
Forests, especially cool forests w/ a
dense understory, conifer & scrub-
shrub swamps X X X X X X
Yellow-breasted Chat
Thickets, early successional forests,
barrens. Indicator for early
successional forest/thickets X
Scarlet Tanager
Forest interior species sensitive to
edge effect - Deciduous & mixed
deciduous/coniferous woodlands,
especially mature forests X X X X X X X X X X X X X X X X X X X X
Grasshopper Sparrow
Indicator for large-scale grasslands;
grassland obligate species X X X X X X X
Henslow's Sparrow
Grasslands, agricultural fields,
reclaimed strip mines X X
Bobolink
Moist meadows and fields of hay,
clover, alfalfa, and other herbaceous
vegetation X X X X X X X X X X
Eastern Meadowlark
Indicator species for large-scale
grasslands; prairies, pastures,
hayfields, and fallow lands X X X X X X
Upland Sandpiper
Grasslands, agricultural fields,
reclaimed strip mines X
# POINT COUNTS 16 20 42 34 28 n/a 28 18 28 10 33 31 28 30 30 11 56 3 47 115
TOTAL WAP PRIORITY SPECIES 9 18 13 20 18 16 11 12 16 4 5 3 12 9 6 20 5 7 21 13
TOTAL SPECIES RECORDED 43 71 64 90 77 69 52 68 61 26 58 35 65 62 45 90 35 40 90 70
*See BBS table in Appendix C for site habitat descriptions
*sensu Chesser et al. 2010
*See Appendix C for site habitat descriptions
**sensu Chesser et al. 2010
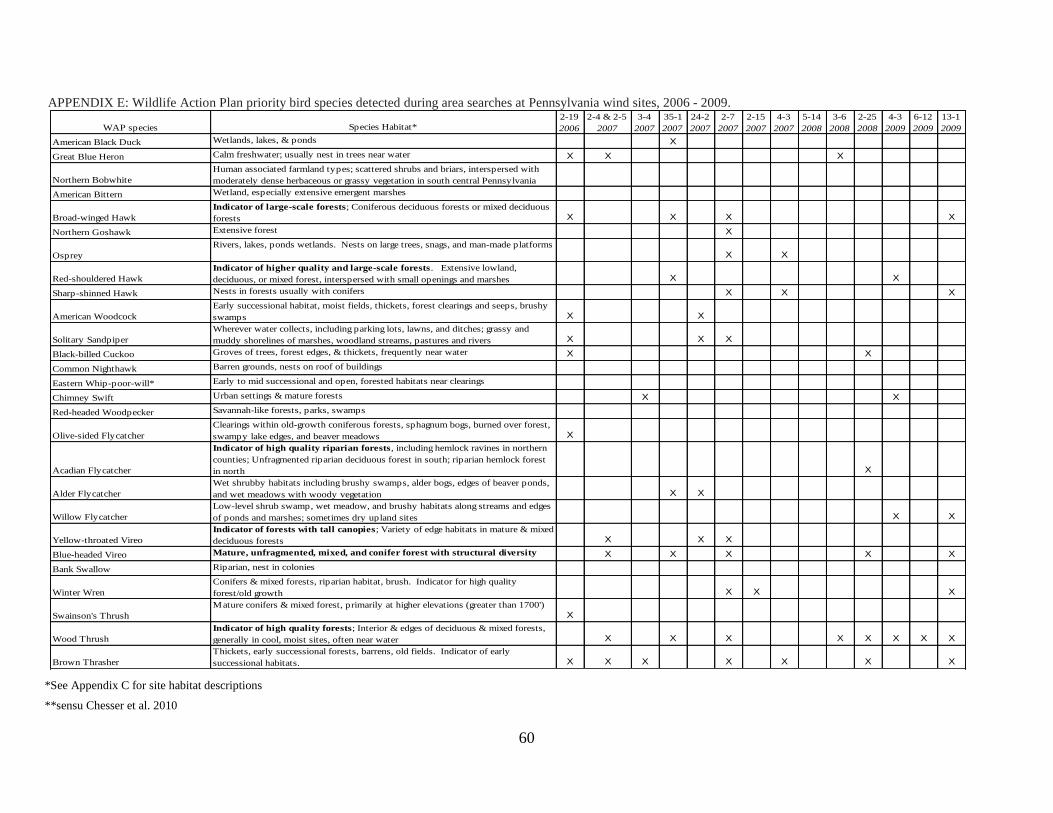
60
APPENDIX E: Wildlife Action Plan priority bird species detected during area searches at Pennsylvania wind sites, 2006 - 2009.
WAP species Species Habitat*
2-19
2006
2-4 & 2-5
2007
3-4
2007
35-1
2007
24-2
2007
2-7
2007
2-15
2007
4-3
2007
5-14
2008
3-6
2008
2-25
2008
4-3
2009
6-12
2009
13-1
2009
American Black Duck Wetlands, lakes, & ponds X
Great Blue Heron Calm freshwater; usually nest in trees near water X X X
Northern Bobwhite
Human associated farmland types; scattered shrubs and briars, interspersed with
moderately dense herbaceous or grassy vegetation in south central Pennsylvania
American Bittern Wetland, especially extensive emergent marshes
Broad-winged Hawk
Indicator of large-scale forests; Coniferous deciduous forests or mixed deciduous
forests X X X X
Northern Goshawk Extensive forest X
Osprey
Rivers, lakes, ponds wetlands. Nests on large trees, snags, and man-made platforms
X X
Red-shouldered Hawk
Indicator of higher quality and large-scale forests. Extensive lowland,
deciduous, or mixed forest, interspersed with small openings and marshes X X
Sharp-shinned Hawk Nests in forests usually with conifers X X X
American Woodcock
Early successional habitat, moist fields, thickets, forest clearings and seeps, brushy
swamps X X
Solitary Sandpiper
Wherever water collects, including parking lots, lawns, and ditches; grassy and
muddy shorelines of marshes, woodland streams, pastures and rivers X X X
Black-billed Cuckoo Groves of trees, forest edges, & thickets, frequently near water X X
Common Nighthawk Barren grounds, nests on roof of buildings
Eastern Whip-poor-will* Early to mid successional and open, forested habitats near clearings
Chimney Swift Urban settings & mature forests X X
Red-headed Woodpecker Savannah-like forests, parks, swamps
Olive-sided Flycatcher
Clearings within old-growth coniferous forests, sphagnum bogs, burned over forest,
swampy lake edges, and beaver meadows X
Acadian Flycatcher
Indicator of high quality riparian forests, including hemlock ravines in northern
counties; Unfragmented riparian deciduous forest in south; riparian hemlock forest
in north X
Alder Flycatcher
Wet shrubby habitats including brushy swamps, alder bogs, edges of beaver ponds,
and wet meadows with woody vegetation X X
Willow Flycatcher
Low-level shrub swamp, wet meadow, and brushy habitats along streams and edges
of ponds and marshes; sometimes dry upland sites X X
Yellow-throated Vireo
Indicator of forests with tall canopies; Variety of edge habitats in mature & mixed
deciduous forests X X X
Blue-headed Vireo Mature, unfragmented, mixed, and conifer forest with structural diversity X X X X X
Bank Swallow Riparian, nest in colonies
Winter Wren
Conifers & mixed forests, riparian habitat, brush. Indicator for high quality
forest/old growth X X X
Swainson's Thrush
Mature conifers & mixed forest, primarily at higher elevations (greater than 1700')
X
Wood Thrush
Indicator of high quality forests; Interior & edges of deciduous & mixed forests,
generally in cool, moist sites, often near water X X X X X X X X
Brown Thrasher
Thickets, early successional forests, barrens, old fields. Indicator of early
successional habitats. X X X X X X X
*See Appendix C for site habitat descriptions
**sensu Chesser et al. 2010

61
APPENDIX E (continued): Wildlife Action Plan priority bird species detected during area searches at Pennsylvania wind sites, 2006 - 2009.
WAP species Species Habitat*
2-19
2006
2-4 & 2-5
2007
3-4
2007
35-1
2007
24-2
2007
2-7
2007
2-15
2007
4-3
2007
5-14
2008
3-6
2008
2-25
2008
4-3
2009
6-12
2009
13-1
2009
Blue-winged Warbler Early successional forest, thickets, barrens, rights-of-way corridors
Black-throated Blue Warbler Indicator of high quality forests with structural diversity X X X
Black-throated Green Warbler Old growth conifer forests; sensitive to edge X X X X X X
Blackburnian Warbler
Mature conifers & mixed forest; Tall canopy coniferous/mixed forest with
vegetation over 18 m and densely foliated crowns. X X
Prairie Warbler
Brushy second growth, dry scrub, low pine-juniper, mangroves, pine barrens,
burned-over areas, and sproutlands X X X
Blackpoll Warbler High elevation, spruce-dominated wetlands and forests X
Cerulean Warbler Extensive mature riparian & mountain forests X X
Worm-eating Warbler
Mature deciduous or mixed deciduous/coniferous forest w/ patches of dense
understory usually on steep slopes X
Louisiana Waterthrush
Indicator of high quality riparian forests and excellent stream habitat;
Riparian forests; forest interior species sensitive to edge effect X X X
Kentucky Warbler
Forests, especially those w/ shrubby understory. Indicator for high quality forest
w/ structural diversity X
Canada Warbler
Forests, especially cool forests w/ a dense understory, conifer & scrub-shrub
swamps X
Yellow-breasted Chat
Thickets, early successional forests, barrens. Indicator for early successional
forest/thickets X
Scarlet Tanager
Forest interior species sensitive to edge effect - Deciduous & mixed
deciduous/coniferous woodlands, especially mature forests X X X X X X X
Grasshopper Sparrow Indicator for large-scale grasslands; grassland obligate species X X X X
Henslow's Sparrow Grasslands, agricultural fields, reclaimed strip mines X
Bobolink Moist meadows and fields of hay, clover, alfalfa, and other herbaceous vegetation X X X X X X
Eastern Meadowlark
Indicator species for large-scale grasslands; prairies, pastures, hayfields, and
fallow lands X X X X X
Pine Siskin
Northern boreal forest, preferring open stands of spruce and pine interspersed with
birch and maple hardwood X
TOTAL WAP PRIORITY SPECIES 15 10 3 12 6 14 1 4 1 7 9 8 1 15
TOTAL SPECIES RECORDED 64 45 22 54 30 63 25 29 9 48 43 44 9 72
*See Appendix C for site habitat descriptions
**sensu Chesser et al. 2010

62
APPENDIX F: Wind energy project mist net survey results, 2004 – present. Bat species are designated by MYLU=Myotis lucifugus, MYSE=Myotis septentrionalis,
EPFU=Eptesicus fuscus, PESU=Perimyotis subflavus, LABO=Lasiurus borealis, LACI=Lasiurus cinereus, LANO=Lasiurus noctivagans, MYLE=Myotis leibii, MYSO=Myotis
sodalis, UNK = unknown (flew away before identified). The last row shows totals with the exceptions of number of species and bats/mist net site which are averages of all sites.
Wind
Site
Bat
risk Year
Dates of
survey
No.
sites
No. bats
captured
No.
species MYLU MYSE a EPFU PESU LABO
b LACI
c LANO
d MYLE
e MYSO
f UNK
Bats/
mist
net site
2-2 High 2004 7/28-8/5 6 170 6 31 12 103 4 16 0 0 3 0 1 28.3
5-6 High 2005 7/11-8/4 9 87 5 41 19 23 1 3 0 0 0 0 0 9.7
24-3 Low 2005 8/10-8/14 4 84 6 34 16 23 3 7 1 0 0 0 0 21.0
2-7 High 2006 7/30-8/4 10 138 4 13 75 41 0 9 0 0 0 0 0 13.8
2-10 Low 2006 8/5-8/6 4 62 5 14 28 15 1 4 0 0 0 0 0 15.5
2-4 Low 2006 7/9-7/12 4 66 5 18 6 24 0 14 4 0 0 0 0 16.5
24-1 Low 2006 8/10-8/12 4 71 4 34 24 11 0 2 0 0 0 0 0 17.8
2-14 Low 2006 8/3-8/5 5 103 5 19 37 38 0 8 1 0 0 0 0 20.6
2-19 High 2007 7/7-7/17 13 107 6 50 39 10 1 5 2 0 0 0 0 8.2
24-2 Low 2007 6/20-6/25 7 71 4 23 32 12 0 1 0 0 0 0 3 10.1
35-1 Low 2007 7/18-8/6 28 429 6 197 174 44 0 10 1 3 0 0 0 15.3
2-18 High 2007 6/2-8/16 21 388 7 167 92 98 1 22 6 0 0 2 0 18.5
2-1 Low 2007 7/31-8/5 8 250 4 73 22 146 0 9 0 0 0 0 0 31.3
3-4 Low 2007 8/7-8/9 5 200 6 60 17 82 2 36 3 0 0 0 0 40.0
4-3 High 2008 6/27-7/2 5 23 5 5 15 1 0 1 0 0 1 0 0 4.6
4-3 High 2007 7/25-7/30 4 201 4 69 13 110 0 9 0 0 0 0 0 50.3
5-18 High 2008 5/29-8/3 50 574 6 146 104 306 0 12 4 0 2 0 0 11.5 a Pennsylvania Wildlife Action Plan responsibility species
b Pennsylvania Wildlife Action Plan maintenance concern
c Pennsylvania Wildlife Action Plan maintenance concern
d Pennsylvania Wildlife Action Plan high level concern
e Pennsylvania state listed threatened; PA Wildlife Action Plan immediate concern
f Pennsylvania state and federally listed endangered; PA Wildlife Action Plan immediate concern
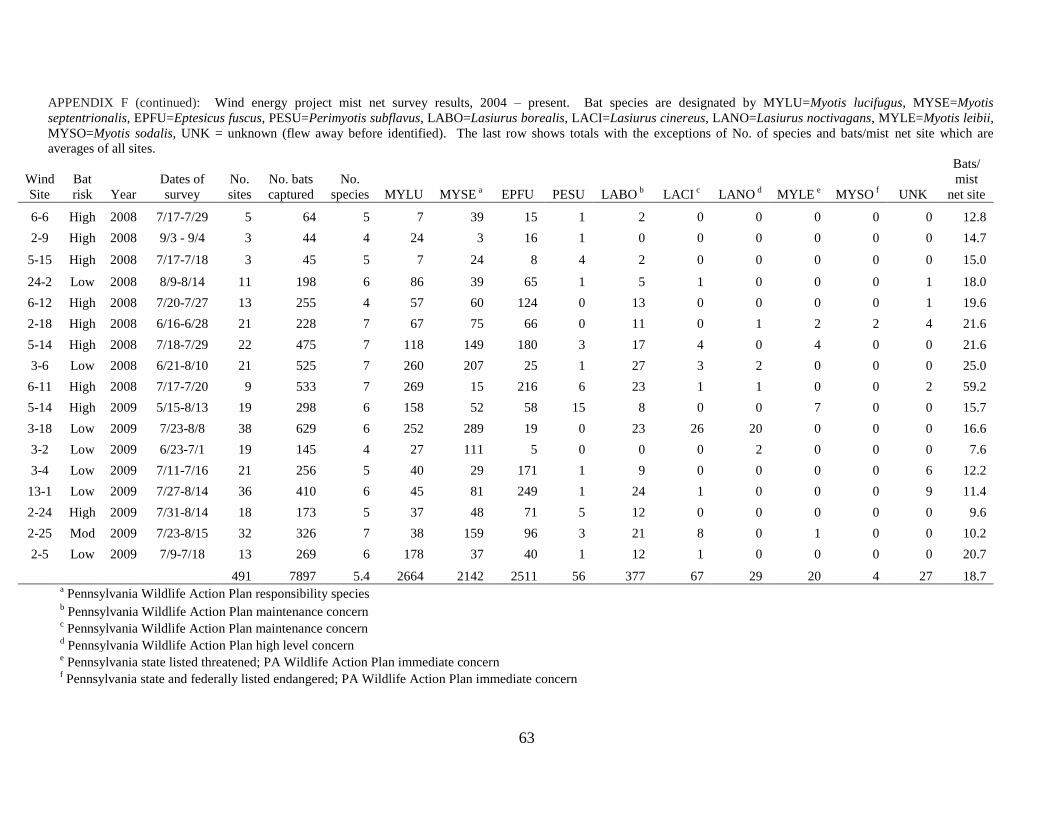
63
APPENDIX F (continued): Wind energy project mist net survey results, 2004 – present. Bat species are designated by MYLU=Myotis lucifugus, MYSE=Myotis
septentrionalis, EPFU=Eptesicus fuscus, PESU=Perimyotis subflavus, LABO=Lasiurus borealis, LACI=Lasiurus cinereus, LANO=Lasiurus noctivagans, MYLE=Myotis leibii,
MYSO=Myotis sodalis, UNK = unknown (flew away before identified). The last row shows totals with the exceptions of No. of species and bats/mist net site which are
averages of all sites.
Wind
Site
Bat
risk Year
Dates of
survey
No.
sites
No. bats
captured
No.
species MYLU MYSE a EPFU PESU LABO
b LACI
c LANO
d MYLE
e MYSO
f UNK
Bats/
mist
net site
6-6 High 2008 7/17-7/29 5 64 5 7 39 15 1 2 0 0 0 0 0 12.8
2-9 High 2008 9/3 - 9/4 3 44 4 24 3 16 1 0 0 0 0 0 0 14.7
5-15 High 2008 7/17-7/18 3 45 5 7 24 8 4 2 0 0 0 0 0 15.0
24-2 Low 2008 8/9-8/14 11 198 6 86 39 65 1 5 1 0 0 0 1 18.0
6-12 High 2008 7/20-7/27 13 255 4 57 60 124 0 13 0 0 0 0 1 19.6
2-18 High 2008 6/16-6/28 21 228 7 67 75 66 0 11 0 1 2 2 4 21.6
5-14 High 2008 7/18-7/29 22 475 7 118 149 180 3 17 4 0 4 0 0 21.6
3-6 Low 2008 6/21-8/10 21 525 7 260 207 25 1 27 3 2 0 0 0 25.0
6-11 High 2008 7/17-7/20 9 533 7 269 15 216 6 23 1 1 0 0 2 59.2
5-14 High 2009 5/15-8/13 19 298 6 158 52 58 15 8 0 0 7 0 0 15.7
3-18 Low 2009 7/23-8/8 38 629 6 252 289 19 0 23 26 20 0 0 0 16.6
3-2 Low 2009 6/23-7/1 19 145 4 27 111 5 0 0 0 2 0 0 0 7.6
3-4 Low 2009 7/11-7/16 21 256 5 40 29 171 1 9 0 0 0 0 6 12.2
13-1 Low 2009 7/27-8/14 36 410 6 45 81 249 1 24 1 0 0 0 9 11.4
2-24 High 2009 7/31-8/14 18 173 5 37 48 71 5 12 0 0 0 0 0 9.6
2-25 Mod 2009 7/23-8/15 32 326 7 38 159 96 3 21 8 0 1 0 0 10.2
2-5 Low 2009 7/9-7/18 13 269 6 178 37 40 1 12 1 0 0 0 0 20.7
491 7897 5.4 2664 2142 2511 56 377 67 29 20 4 27 18.7 a Pennsylvania Wildlife Action Plan responsibility species
b Pennsylvania Wildlife Action Plan maintenance concern
c Pennsylvania Wildlife Action Plan maintenance concern
d Pennsylvania Wildlife Action Plan high level concern
e Pennsylvania state listed threatened; PA Wildlife Action Plan immediate concern
f Pennsylvania state and federally listed endangered; PA Wildlife Action Plan immediate concern

APPENDIX G: BEST MANAGEMENT PRACTICES
Pennsylvania Game Commission (PGC)
Endorsed Best Management Practices for
Pennsylvania Wind Energy Facilities
Overview and Objective
These are Best Management Practices (BMPs) for Wind Energy Facilities in Pennsylvania. They
do not stand alone and are an element of the Pennsylvania Game Commission's (PGC) Wind
Energy Voluntary Cooperative Agreement.
These BMPs are designed for use by developers and operators to establish a goal for best-in-
class wind energy development/operation in Pennsylvania. They offer a set of practices to ensure
the proper construction/operation of wind energy in Pennsylvania.
The BMPs should be applied to each project site. Although they establish best in class goals,
they do not constitute regulatory standards or development obligations. Technical and economic
feasibility, as well as wildlife and environmental resource management, should be considered in
applying these BMPs. In addition, regulations and landowner rights and agreements shall take
precedence where they apply.
The following BMPs are recommended for the construction, operation, and decommissioning of
wind energy facilities. Please note the following:
a. Siting BMPs are not included because siting in regards to birds and mammals is
addressed within the other sections of the PGC Wind Energy Voluntary Cooperative
Agreement.
b. BMPs found within the PGC Wind Energy Voluntary Cooperative Agreement are not
included in the below list (such as conducting one-year pre-construction and two-years
post-construction surveys to assess impacts to birds and mammals).
c. Only BMPs that fall under the PGC jurisdiction in that they relate to the protections of
birds and mammals and their habitats, are included.
d. Wind developers typically lease and do not own the land on which they develop wind
projects; therefore private landowner‟s land use plans have been taken into consideration
in the development of these BMPs.
e. Revisit the BMPs as needed to discuss new information and operational protocols
identified during ongoing mitigation studies.
64

65
A. CONSTRUCTION
1. To the extent practicable, avoid and minimize impacts to important habitats not protected
under the Pennsylvania Natural Diversity Inventory environmental review process, such
as those identified in the Pennsylvania Wildlife Action Plan (WAP), that provide critical
habitats for Species of Greatest Conservation Need (SGCN). SGCN are listed in WAP
Tables 10.6, 10.7 and individual SGCN/habitat associations are defined in WAP Tables
12.5, 14.9, 15.3, 16.3. 17.2, 19.3, 20.3, 21.8, 22.4 (Williams, L., et al., editors. 2005.
Pennsylvania Comprehensive Wildlife Conservation Strategy. Pennsylvania Game
Commission and Pennsylvania Fish and Boat Commission. Version 1.0. Harrisburg,
Pennsylvania, USA).
2. To minimize habitat fragmentation during construction of the project site, locate facilities
(such as tower footprint, collector cable routes, t-line, access road, substation, etc.) in or
adjacent to existing ROW and disturbed areas and minimize the number and length of
access roads, using existing roads to the fullest extent practicable.
3. Each project will have a designated point of contact for environmental and public
inquiries.
4. Each project will designate representatives to ensure compliance with project permits and
approvals by employees and contractors.
5. Use tubular turbine towers or best available technology to reduce ability of birds to perch
and to reduce risk of collision. Turbines should be a non-obtrusive color, such as white,
off-white or gray, monopole design.
6. Avoid guyed towers (i.e. communication and meteorological) at wind energy project
sites. If guy wires are necessary, bird flight diverters or high visibility marking devices
should be used.
7. Wind turbines should not be permanently artificially lighted, except to the extent required
by the FAA or other applicable authority. Employ only red, or dual red and white strobe,
strobe like, or flashing lights, not steady burning lights, to meet FAA requirements for
visibility lighting of wind turbines, permanent met towers, and communication towers
(see Gehring et al. 2009)1. Only a portion of the turbines within the wind project should
be lighted, and all pilot warning lights should fire synchronously.
8. Keep lighting at both operation and maintenance facilities and substations to the
minimum required.
a. Use lights with motion or heat sensors and switches to keep lights off when not
required.
1 Gehring, J., P. Kerlinger, A. M. Manville II. 2009. Communications towers, lights, and birds: successful methods
for reducing the frequency of avian collisions. Ecological Applications 19: 505-514.

66
b. Lights should be hooded downward and directed to minimize horizontal and
skyward illumination.
9. Wind turbines should not display advertising, except for reasonable identification of the
turbine manufacturer, facility owner and operator to minimize impacts to wildlife.
10. Minimize, to the extent practicable, the area disturbed during construction. Each turbine
clearing area should be five acres or less and post-construction turbine cleared area
should be less than two acres per turbine or minimum for operation and/or maintenance.
11. Electrical collection systems between turbines should be buried below plow depth where
feasible, and if possible co-located with roadways where practicable.
12. To reduce avian collisions, place low and medium voltage connecting power lines
associated with the wind energy development underground to the extent possible, unless
the burial of the lines is prohibitively expensive (i.e. where shallow bedrock exists) or
where greater adverse impacts to biological resources would result.
a. Overhead lines may be acceptable if sited away from high bird crossing locations,
such as between roosting and feeding areas or between lakes, river, and nesting
habitats. To the extent practicable, they should be marked in accordance with
Avian Power Line Interaction Committee (APLIC) collision guidelines.
b. Overhead lines may be used when they parallel tree lines, employ bird flight
diverters, or are otherwise screened so that collision risk is reduced.
c. Above‐ground low and medium voltage lines, transformers and conductors should
follow the 2006 or most recent APLIC “Suggested Practices for Avian Protection
on Power Lines.”
13. All infrastructure should be constructed in as small an area as is practical.
14. Segregate topsoil for use in reclaiming temporarily disturbed areas. Upon completion of
construction activity, areas to be reclaimed should be planted within the first growing
season to achieve 70% re-vegetation. Incorporate native plants into the reseeding mix
where consistent with permits and applicable regulations. Soil supplements (lime,
fertilizer, and/or mulch) should be added as needed and are the responsibility of the
operator.
15. To the extent practicable, measures should, be implemented during construction to avoid
the introduction and spread of invasive species by following applicable local policies for
noxious weed control which may include: cleaning vehicles and equipment arriving from
areas with known invasive species issues, using locally sourced topsoil, and monitoring
for and rapidly removing noxious weeds. Project construction areas to be reclaimed
should be re-vegetated with appropriate non-invasive seed mixes, incorporating native
species where consistent with permits and applicable regulations.

67
B. OPERATIONS
1. Reduce project road access to extent practical and consistent with safety needs,
environmental concerns, legal requirements and the requests of the landowner.
2. Reduce vehicle collision risk to wildlife by instructing project personnel to drive at
appropriate speeds, be alert for wildlife, and use additional caution in low visibility
conditions.
3. Instruct employees, contractors, and site visitors to avoid harassing or disturbing wildlife,
particularly during reproductive seasons.
4. Implement a Wildlife Incident Reporting System for the life of the project. A Wildlife
Incident Reporting System is a specific set of processes, procedures and training for
monitoring, responding to, and reporting bird or mammal injuries and fatalities to the
Pennsylvania Game Commission.
5. On project maintained land, limiting mowing to the fullest extent possible between April
1 and July 31.
6. Each site should have a Spill Protection, Control, and Countermeasure plan in place as
required under Pennsylvania Department of Environmental Protection regulations to
avoid and minimize impacts to wildlife.
C. DECOMMISSIONING
1. Except where otherwise required by an applicable regulation or an agreement with the
landowner, the facility owner and operator should, at its expense, complete
decommissioning of the wind energy facility within eighteen (18) months after the end of
the useful life of the facility to reduce the likelihood of additional wildlife collisions with
the non-operational structures.
2. Except where otherwise required by an applicable regulation or an agreement with the
landowner, decommissioning should include removal of all facilities, including turbine
foundations to a depth of 36 inches except that facilities may be left in place at the
request or with the consent of the landowner.
3. During decommissioning of the wind energy facility, additional wildlife habitat loss
should be minimized by utilizing existing ROWs and previously disturbed corridors to
the fullest extent practicable.
4. Prior to decommissioning, and in coordination with the landowner, the facility owner and
operator should develop a re-vegetation plan that favors Pennsylvania native plant
species in order to enhance the wildlife habitat value of the project area.