pennsylvania state mployees’ retirement system
TRANSCRIPT

February 2020
Pennsylvania State Employees’ Retirement System Board Presentation February 2020

2
Disclaimer
This presentation is confidential and is intended to be provided solely for the information of potential clients of Oak Street Real Estate Capital, LLC. Additionally, this presentation is provided in
conjunction with the Partnership’s Confidential Disclosure Document and the information provided herein should be considered in conjunction with the disclosure, discussion, risk factors, and
other information provided therewith. This is neither an offer to sell nor a solicitation for an offer to buy an interest in any fund managed by Oak Street Real Estate Capital, LLC (“Oak Street”). Oak
Street Partners RE Fund I, LP may be referred to as “Fund I”, Oak Street Real Estate Capital Fund II, LP may be referred to as “Fund II”, Oak Street Real Estate Capital Fund III, LP may be referred to
as “Fund III”, Oak Street Real Estate Capital Fund IV, LP may be referred to as “Fund IV” and Oak Street Real Estate Capital Fund V, LP may be referred to as “Fund V”. Oak Street’s Seeding and
Strategic Capital business may be referred to as “SASC”.
An investment in any Oak Street product involves a high degree of risk, and investors should not invest any funds unless they can afford to lose their entire investment. Any and all proceeds
received by an investment partnership will be immediately at-risk and available for the partnership’s use. Accordingly, any investment will be immediately subject to all of the uncertainties and
risks applicable to the partnership’s business, regardless of whether the partnership is able to fully fund its property acquisition strategy. The partnership interests may be subject to transfer
restrictions and investors should be aware that they will be required to bear the financial risks of an investment for an indefinite period of time. In making an investment decision, investors must
rely on their own review of the partnership and the offering, including the risks and potential benefits involved.
There can be no assurance that the investment objectives of any fund managed by Oak Street Real Estate Capital will be achieved or that its historical performance is indicative of the performance it
will achieve in the future. Performance shown is not audited and is subject to change upon audit. Performance data may differ upon a number of factors including actual fees paid. All performance
reflects the reinvestment of dividends (if any) and all other investment income (which should be evaluated when reviewing performance against other indices).
No federal or state securities regulatory authority has recommended any Oak Street investment product or determined the accuracy or adequacy of the information in this presentation or the
Disclosure Document. By accepting delivery of this presentation, each recipient agrees that this presentation is not to be reproduced or used for any purpose other than evaluating a possible
investment in Oak Street’s strategies and that all information contained herein that is not already in the public domain will be kept confidential.
This presentation and any other written or oral statements made by, or on behalf of, Oak Street may include forward-looking statements that reflect the Partnership’s current views with respect to
future events and expected financial performance. The words “believe,” “anticipate,” “plan,” “estimate,” “expect,” “intend,” “will likely result,” or “will continue” and other similar expressions identify
forward-looking statements. Prospective Partnership investors are cautioned not to place undue reliance on these forward-looking statements and be aware that Oak Street undertakes no
obligation to update or revise any forward-looking statements, whether as a result of new information, future events, changes in Oak Street’s expectations, or otherwise.
Any forward-looking statements are subject to uncertainties and other factors that could cause actual results to differ materially from such statements. These uncertainties and other factors
include, but are not limited to: (i) potential changes in the legal environment, or government or regulatory policies; (ii) the occurrence of catastrophic events with a frequency or severity exceeding
the Partnership’s estimates; (iii) loss of the services of key individuals; (iv) changing interest rates and other economic conditions; and (iv) other factors that may affect the commercial real estate
rental market, and commercial real estate property values generally.
Oak Street Real Estate Capital does not warrant the accuracy, adequacy, completeness, timeliness or availability of any information provided from non-Oak Street sources, and none of Oak Street, its
partners, officers, employees or agents or any of their affiliates or their respective partners, officers, employees or agents assume responsibility for such information. This presentation provides
only a partial list of investments within the products shown. A complete list of prior investments is available upon request.
3
Oak Street Overview
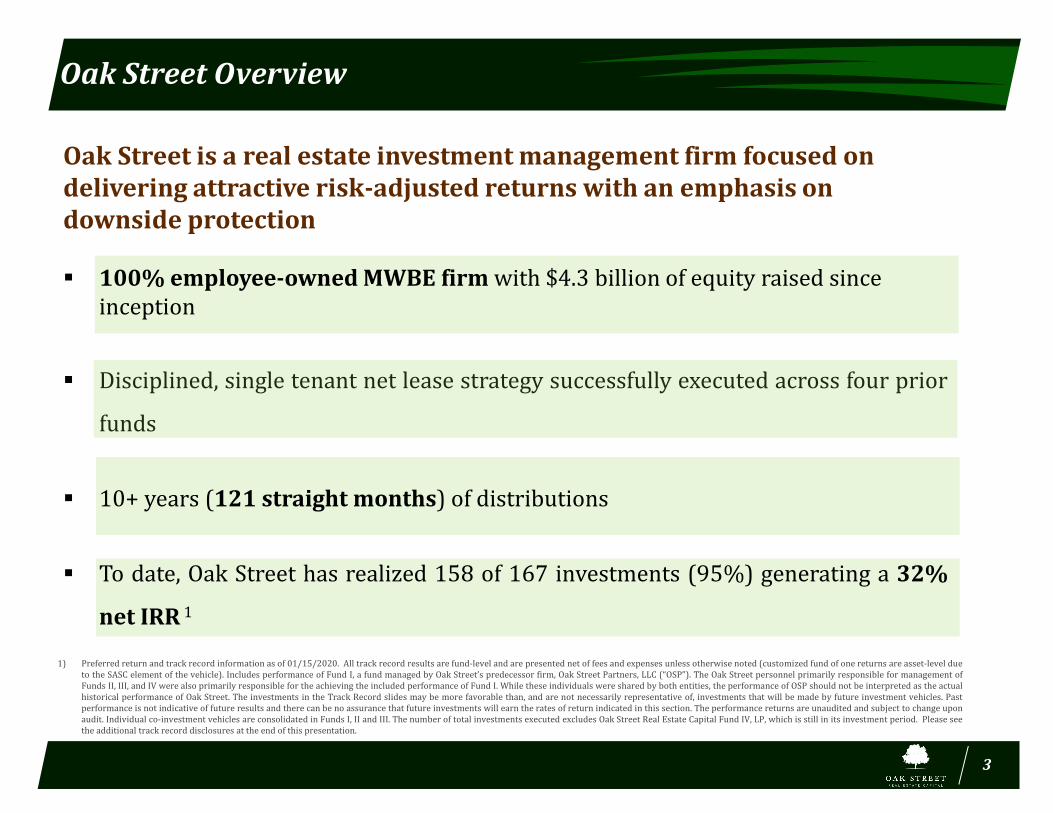
Oak Street is a real estate investment management firm focused on delivering attractive risk-adjusted returns with an emphasis on downside protection
▪ 100% employee-owned MWBE firm with $4.3 billion of equity raised since inception
▪ Disciplined, single tenant net lease strategy successfully executed across four prior
funds
▪ 10+ years (121 straight months) of distributions
▪ To date, Oak Street has realized 158 of 167 investments (95%) generating a 32%
net IRR 1
1) Preferred return and track record information as of 01/15/2020. All track record results are fund-level and are presented net of fees and expenses unless otherwise noted (customized fund of one returns are asset-level dueto the SASC element of the vehicle). Includes performance of Fund I, a fund managed by Oak Street’s predecessor firm, Oak Street Partners, LLC (“OSP”). The Oak Street personnel primarily responsible for management ofFunds II, III, and IV were also primarily responsible for the achieving the included performance of Fund I. While these individuals were shared by both entities, the performance of OSP should not be interpreted as the actualhistorical performance of Oak Street. The investments in the Track Record slides may be more favorable than, and are not necessarily representative of, investments that will be made by future investment vehicles. Pastperformance is not indicative of future results and there can be no assurance that future investments will earn the rates of return indicated in this section. The performance returns are unaudited and subject to change uponaudit. Individual co-investment vehicles are consolidated in Funds I, II and III. The number of total investments executed excludes Oak Street Real Estate Capital Fund IV, LP, which is still in its investment period. Please seethe additional track record disclosures at the end of this presentation.

4
Net Lease Overview
▪ Predictable Cash Flows: Any increases in expenses are 100% borne by the tenant,
contractual lease obligations provide absolute clarity on future rents
▪ No Landlord Responsibility: Under a net lease (“NNN”), the tenant pays all property
operating and capital expenditures; landlord receives rent, net of all expenses
NNN creates predictable cash flow from long term rents, net of expenses
Net Cash Flow / Rent
Tenant:Responsible for expenses such as: • repairs• maintenance • insurance• real estate tax
Landlord:
5
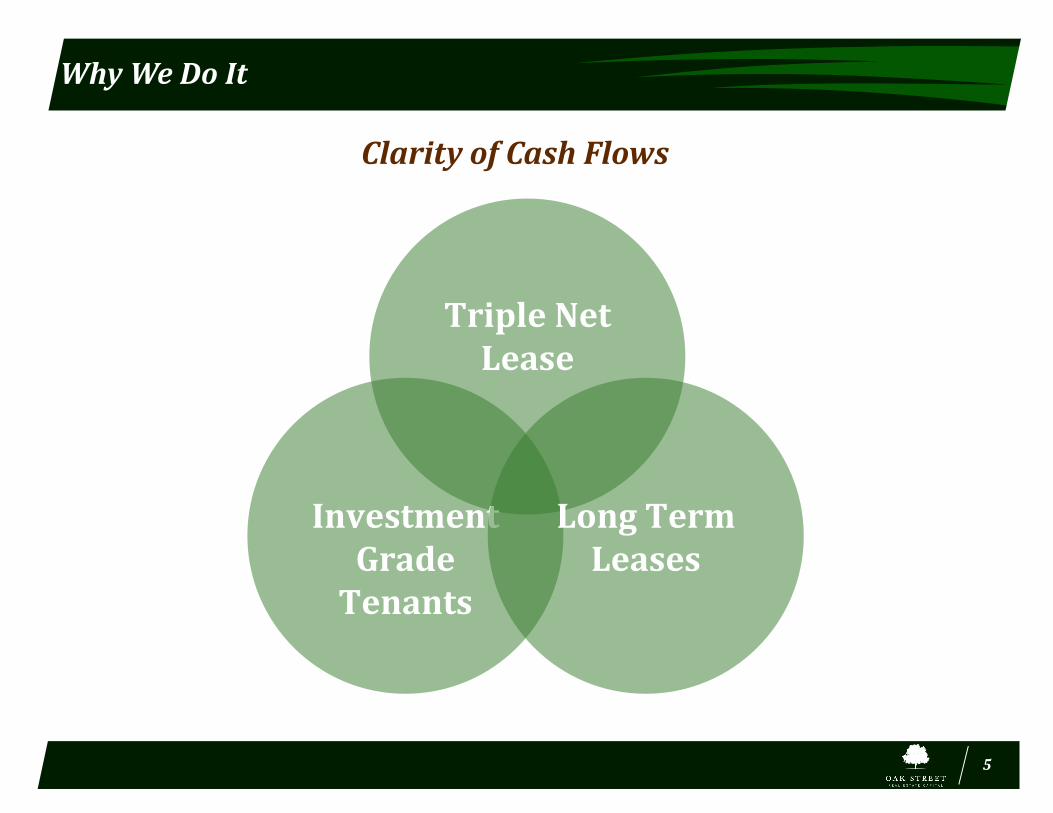
Why We Do It
Clarity of Cash Flows
Triple Net Lease
Investment Grade
Tenants
Long TermLeases

6
Investment Grade Tenants and Mission-Critical Properties
Historically, investments in Oak Street’s funds have had:
In the event of a vacancy, the tenant is contractually obligated to pay rent for life of the lease
Bankruptcy Filings
Tenant Defaults
Missed Rental Payments
Property Vacancies
Zero
Zero
Zero
Zero
For illustrative purposes only. There can be no assurance that the Fund will achieve its objectives or than an investor will achieve a return on its investments. An investor could lose all or a portion of its investment. The statement above reflects Oak Street’s views and opinions as of the date hereof and not as of any future date. There can be no assurances that the views and opinions expressed in this presentation will come to pass or will continue to be true. Past performance is not indicative of future results, and there can be no assurance that the Fund will achieve comparable results or be able to implement its investment strategy or achieve its investment objectives.”

7
Scale of the Net Lease Opportunity
Sale-Leaseback Investment Universe vs. Annual Transaction Volume
* Investable universe based on combined book value of net property, plant and equipment for all publicly traded companies in the United States and Canada. Investment grade investable universe based on combinedbook value of net property, plant and equipment for all publicly traded companies in North America with an investment grade credit rating from Standard & Poor’s. Source: Standard & Poor’s Capital IQ as of October12, 2017
** Average annual single tenant transaction volume from 2015-Annualized YTD 2019. Source: Stan Johnson Company Net Lease Trends.
Size of Investment Grade investable universe*$7.6 Trillion
Average annual net lease transaction volume**$64 Billion

8
Off-Market Sourcing
Oak Street’s off-market sourcing capability has allowed for significant capital appreciation opportunities in a variety of market environments
I – Sale-Leasebacks
• Oak Street proactively develops direct relationships with corporate tenants viewed as attractive credits to structure mutually beneficial transactions with favorable off-market pricing
II – Developer Take-Outs
• By partnering with property developers, Oak Street is able to negotiate pricing and terms that are generally better than a marketed deal while not taking any development risk
III – Lease Restructure
• Oak Street has been successful in de-risking investments prior to closing by structuring value-added lease modifications

9
Oak Street Real Estate Capital – By the Numbers
1) Preferred return and track record information as of 01/15/2020. All track record results are fund-level and are presented net of fees and expenses unless otherwise noted (customized fund of one returns are asset-level dueto the SASC element of the vehicle). Includes performance of Fund I, a fund managed by Oak Street’s predecessor firm, Oak Street Partners, LLC (“OSP”). The Oak Street personnel primarily responsible for management ofFunds II, III, and IV were also primarily responsible for the achieving the included performance of Fund I. While these individuals were shared by both entities, the performance of OSP should not be interpreted as the actualhistorical performance of Oak Street. The investments in the Track Record slides may be more favorable than, and are not necessarily representative of, investments that will be made by future investment vehicles. Pastperformance is not indicative of future results and there can be no assurance that future investments will earn the rates of return indicated in this section. The performance returns are unaudited and subject to change uponaudit. Individual co-investment vehicles are consolidated in Funds I, II and III. The number of total investments executed excludes Oak Street Real Estate Capital Fund IV, LP, which is still in its investment period. Please seethe additional track record disclosures at the end of this presentation.
• Gross value of assets acquired or under contract$3.8 billion
• Fully occupied100%
• Investment grade tenants100%
• Average credit ratingA-
• Cash distributions paid to investors121 consecutive months1
• 167 investments, 158 investments realized (95%)158 realized investments1
• Net IRR on realized assets32%1

Appendix

0.00% 0.02% 0.05% 0.20% 0.81%
5.63%
24.07%
0.00%
5.00%
10.00%
15.00%
20.00%
25.00%
30.00%
AAA AA A BBB BB B CCC/C
11
Emphasis on Investment Grade Credit Tenants
Source: Standard & Poor’s 2018 Annual Global Corporate Default Study And Rating Transitions dated April 7, 2019. The chart above is not intended to depict the performance of any Oak Street fund, nor is it intended to imply thatOak Street or any of its funds have been rated by S&P or any other ratings agency.
For illustrative purposes only. The opinions expressed herein reflect the current opinions of Oak Street as of the date appearing in this material only. There can be no assurance potential returns will be achieved. As with anyinvestment, there is risk, including the loss of principal. There can be no guarantee that the Fund will be able acquire or dispose of investments within targeted terms.
Oak Street believes an exclusive focus on investment grade tenants meaningfully reducesrisk in its investment strategy
A- Rating 0.07%
Time to
Defau
lt (Years)
Cu
m. D
efau
lts
▪ Focus on investment grade tenants with low historical default rates
▪ Protection is further supplemented through a focus on tenants operating
defensive, recession resistant businesses
Weighted Avg. Annual Default Rates (‘81-’18) Historical # of Defaults and Timeline
Investment Grade
8 3098
208
613
1,523
274
0
2
4
6
8
10
12
14
16
18
20
0
200
400
600
800
1,000
1,200
1,400
1,600
AAA AA A BBB BB B CCC/C
Cumulative Defaults by Initial Rating Time To Default (Years)
For illustrative purposes only:

Oak Street Team

13
Oak Street Team
Oak Street Executive Management
Marc Zahr1
Chief Executive Officer and Managing PartnerJim Hennessey1
Chief Financial Officer and Managing Partner
Compliance and Investor Relations
Gary RozierManaging Director
Joe BarrettManaging Director
Devin LanghamCompliance Director
Mary Kate CliffordAssociate
Investments
Michael Reiter1
Managing Director
Sean SullivanSenior Vice President
Krista KerrVice President
Matt PeroneVice President
Moises NumaVice President
Grant GaughrinVice President
Jared SheikerVice President
Andrew SchrederAssociate
Alex SolomonSenior Analyst
Beth BrzozowskiSenior Analyst
Accounting and Asset Management
Marc HennyDirector of Financial Operations and
Portfolio Management
Annie MartinezController
Edward EdingtonSASC Controller
Kris GogolaFund Accounting Manager
Amy TangVice President
Heather BearSenior Analyst
Tony JobbeFund Finance Associate
Jason UlmanAnalyst
Larissa Herczeg1
Managing Partner
13
Female professional.Minority professional.1 Denotes Investment Committee member.

14
Commitment to Diversity & Civic Engagement
Diversity of
Team
External Diversity Initiatives
▪ MWBE firm dedicated to a diverse, inclusive culture
▪ Diversity reflected in both Oak Street’s senior management as well as the broader team
▪ Actively promote MWBE businesses through vendor and supplier relationships, as well as adviseand support MWBE investment funds.
▪ Oak Street’s professionals lendtheir time and expertise to thefollowing educational initiativesdesigned to assist and promoteminorities:
• EMBARC Chicago Mentor• City Colleges of Chicago • Robert Toigo Foundation• Black Male Leadership
Academy • Women in Real Estate (“WIRE”)• The Tripp Healy Foundation

15
Management Team
Marc Zahr Chief Executive Officer and Managing Partner
Mr. Marc Zahr is the Co-Founder, Managing Partner and Chief Executive Officer of Oak Street Real Estate Capital, LLC.
In this role, Mr. Zahr is responsible for the overall direction and leadership of Oak Street. He manages and oversees the
firm's investment activities which include sourcing, underwriting and negotiating all of Oak Street's acquisitions. Mr.
Zahr also leads the firm's Investment Committee and new product development. He founded Oak Street with the
intention of creating investment strategies that are closely aligned with the interests of investors. Mr. Zahr's work in
providing creative solutions that enhance the balance sheets of companies has generated the firm's investment
opportunities primarily through sale-leasebacks, developer partnerships, and lease restructurings.
Mr. Zahr has focused on sourcing and structuring the acquisitions that were executed in Oak Street’s funds, co-
investment vehicles and customized funds of one. Select tenants include Walgreen Co., CVS Health Corp., MetLife, Inc.,
Advance Auto Parts Inc., Motorola Solutions, Inc., Ericsson, The Sherwin-Williams Company, U.S. Bancorp, Anthem
Blue Cross Blue Shield, Dollar General Corp., and Capital One Financial Corp. Mr. Zahr also spearheaded the integration
of Oak Street’s Seeding & Strategic Capital platform ("SASC").
Prior to Oak Street, Mr. Zahr served as Vice President at American Realty Capital where he was responsible for the
analytics and acquisition activities within the company’s real estate portfolios. Mr. Zahr also served as a Fixed Income
Trader at TM Associates and an Associate at Merrill Lynch. Mr. Zahr received a B.A. in Communications from the
University of Dayton.

16
Management Team
James Hennessey Chief Financial Officer and Managing Partner, CPA
Mr. James Hennessey is Co-Founder, Managing Partner, Chief Financial Officer and a member of Oak Street’s
Investment Committee. Mr. Hennessey is responsible for all financial and fiscal management aspects of Oak Street’s
operations including: financial and real estate analysis of all potential acquisitions, closing purchases and sales
inclusive of debt financings, portfolio accounting, and financial & tax reporting.
Mr. Hennessey is heavily involved in Oak Street’s Net Lease investment due diligence efforts. In addition to these
responsibilities, he has been integral to the asset management of Oak Street’s Net Lease funds, associated co-
investment vehicles and customized funds of one. Mr. Hennessey led Oak Street’s initial registration with the
Securities and Exchange Commission (“SEC”) and has overseen all compliance efforts at the firm.
Mr. Hennessey was previously the Corporate Controller at American Realty Capital where he was responsible for asset
management and SEC reporting for the firms’ real estate portfolios. Before his time at American Realty Capital, he was
a manager in the Assurance Advisory practice at Plante Moran (formerly Blackman Kallick Bartelstein). Mr.
Hennessey received a B.S. in Accounting and Finance from Indiana University.

17
Management Team
Gary Rozier Managing Director
Mr. Gary Rozier is a Managing Director at Oak Street Real Estate Capital, LLC. Mr. Rozier is responsible for investor relations for institutional investors and investment consultants.
Prior to joining Oak Street Real Estate Capital, Mr. Rozier served as Senior Vice President at Ariel Investments for almost 14 years where he was responsible for institutional business development and client services. Prior to joining Ariel, Mr. Rozier spent more than five years with Rydex Investments. At Rydex, he held multiple positions in shareholder services and financial advisor sales before being promoted to regional vice president where he oversaw product development and distribution across nine states in the Midwest Region.
Mr. Rozier is on the board of directors for City Colleges of Chicago Foundation, American Red Cross Chicago, a trustee for the Francis Xavier Warde School, and serves on the Investment Committee of Cristo Rey Jesuit High School. Additionally, he is a 2011 Leadership Greater Chicago fellow. Mr. Rozier earned a BA in Economics from the University of Maryland, where he serves on the Board of Visitors, the Economics Leadership Council and was a captain of the rugby team.

18
Important Disclosures
Cap Rate: Represents the ratio between the contractual next twelve months of net operating income produced by the asset and the purchase price of the asset only.
All-in Cost: Represents the total amount of equity invested plus the total amount of debt funded at closing, which equals the total acquisition costs for the real estate property and includes any
additional capital used to fund transaction costs, expenses, escrows or reserves.
Invested Equity: Represents the total amount of equity invested in the property, calculated as all-in cost minus debt funding, inclusive of any additional capital used to fund transaction costs,
expenses, escrows or reserves.
Lease Term: Represents remaining lease term at property acquisition date.
Loan-to-Value (“LTV”): Represents the ratio of total debt divided by the acquisition price, not including transaction costs, expenses, escrows and reserves.
Net Cash Flow: Represents the net cash flow to investors. Cash flow is calculated by subtracting debt service and all other expenses, including management fees and carried interest from contractual
net operating income.
Net Operating Income (“NOI”): Represents net property-level income prior to debt service. NOI is calculated by subtracting all operating and maintenance expenses from contractual rent. NOI
excludes depreciation expense and capital expenditures. For a NNN lease, NOI is equivalent to contractual rent.
Preqin Net IRR: The Preqin Net IRR holds individual, net-to-investor fund internal returns, i.e., after management fees and carried interest. The Preqin Net IRR is based upon the realized cash flows
and the valuation of the remaining interest in the partnership. The Preqin Net IRR is an estimated figure that relies upon both cash flows and the valuation of unrealized assets. The Preqin Net IRR
estimates shown are both as reported by LP/GP and those that Preqin has calculated internally, based upon cash flows and valuations, provided for individual partnerships.
Projected Net Equity Multiple: Represents the cumulative net cash flow to investors over the entire holding period divided by the invested equity amount. Cash flow is calculated by subtracting
debt service and all other expenses, including management fees and carried interest from contractual net operating income. Projected Net Equity Multiple is calculated based on contractual and
expected cash flows, including internal estimates and calculations regarding expected exit date and exit cap rate. Projected Net Equity Multiple is net of all fees and expenses, including Oak Street pro
forma management fees and carried interest.
Projected Net IRR: Represents the net projected internal rate of return on an investment, the annualized, compounded rate of return that makes the net present value of all net cash flows equal to
zero. Projected Net IRR is calculated based on contractual and expected cash flows, including internal estimates and calculations regarding expected exit date and exit cap rate. Projected Net IRR is net
of all fees and expenses, including Oak Street pro forma management fees and carried interest.
Purchase Price: Represents the total amount invested in the property including the debt funded at closing, which equals the nominal acquisition cost for the property excluding any additional capital
used to fund transaction costs, expenses, escrows or reserves.
Realized Net IRR: Represents the net realized internal rate of return on an investment, the annualized, compounded rate of return that makes the net present value of all cash flows equal to zero.
Realized Net IRR is based on actual cash flows to investors net of all fees and expenses, including Oak Street pro forma management fees and carried interest.
Triple-Net Lease (“NNN Lease”): Represents a lease in which the tenant is responsible for all maintenance and capital expenditures and all other obligations of every kind during the lease term.
Double-Net Lease (“NN Roof & Structure Lease”): Represents a lease in which the tenant is responsible for all maintenance and capital expenditures and all other obligations of every kind during
the lease term with the exception of the roof and building structure.

19
Additional Track Record Disclosure
PAST PERFORMANCE OF ANY KIND IS NOT NECESSARILY INDICATIVE OF FUTURE RESULTS AND FUTURE ACCURACY AND PROFITABLE RESULTS CANNOT BE GUARANTEED. NO REPRESENTATION IS BEING MADE THAT THE
FUND OR ANY INVESTMENT WILL OR IS LIKELY TO ACHIEVE PROFITS OR LOSSES SIMILAR TO THOSE SHOWN OR DESCRIBED HEREIN. PERFORMANCE FIGURES ARE PRESENTED NET OF FEES AND EXPENSES AND ARE PRESENTED PRE-
TAX. INVESTOR FEE STRUCTURES MAY VARY. ANY PERFORMANCE IN THIS PRESENTATION IS NOT AUDITED. FUNDS I, II AND III TARGETED NET IRRS OF 12%, THOUGH TARGETED IRRS FOR THESE FUNDS AND THE FUND ARE NOT
PREDICTIONS OR PROJECTIONS OF ACTUAL RESULTS AND THERE IS NO ASSURANCE THAT TARGETS WILL BE ACHIEVED.
NET EQUITY MULTIPLE REPRESENTS THE CUMULATIVE NET CASH FLOW TO INVESTORS OVER THE ENTIRE HOLDING PERIOD DIVIDED BY THE INVESTED EQUITY AMOUNT. CASH FLOW IS CALCULATED BY SUBTRACTING
DEBT SERVICE AND ALL OTHER EXPENSES, INCLUDING MANAGEMENT FEES AND CARRIED INTEREST FROM CONTRACTUAL NET OPERATING INCOME. FOR UNREALIZED INVESTMENTS PROJECTED NET EQUITY MULTIPLE IS
CALCULATED BASED ON CONTRACTUAL AND EXPECTED CASH FLOWS, INCLUDING INTERNAL ESTIMATES REGARDING EXPECTED EXIT DATE AND EXIT CAP RATE AS WELL AS CONTRACTUAL RENT AND DEBT SERVICE. PROJECTED NET
EQUITY MULTIPLE IS NET OF ALL FEES AND EXPENSES, INCLUDING OAK STREET PRO FORMA MANAGEMENT FEES AND CARRIED INTEREST. PRO FORMA FEES AND CARRIED INTEREST REPRESENTS THE RELEVANT INVESTMENT
VEHICLE FEE STRUCTURE APPLIED AT THE INDIVIDUAL DEAL LEVEL.
NET IRR FOR REALIZED INVESTMENTS REPRESENTS THE NET REALIZED INTERNAL RATE OF RETURN ON AN INVESTMENT – THE ANNUALIZED, COMPOUNDED RATE OF RETURN THAT MAKES THE NET PRESENT VALUE OF
ALL CASH FLOWS EQUAL TO ZERO. REALIZED NET IRR IS BASED ON ACTUAL CASH FLOWS TO INVESTORS NET OF ALL FEES AND EXPENSES, INCLUDING OAK STREET PRO FORMA MANAGEMENT FEES AND CARRIED INTEREST.
NET IRR FOR UNREALIZED INVESTMENTS REPRESENTS THE NET PROJECTED INTERNAL RATE OF RETURN ON AN INVESTMENT - THE ANNUALIZED, COMPOUNDED RATE OF RETURN THAT MAKES THE NET PRESENT VALUE
OF ALL NET CASH FLOWS EQUAL TO ZERO. PROJECTED NET IRR IS CALCULATED BASED ON CONTRACTUAL AND EXPECTED CASH FLOWS, INCLUDING INTERNAL ESTIMATES REGARDING EXPECTED EXIT DATE AND EXIT CAP RATE AS
WELL AS CONTRACTUAL RENT AND DEBT SERVICE. PROJECTED NET IRR IS NET OF ALL FEES AND EXPENSES, INCLUDING OAK STREET PRO FORMA MANAGEMENT FEES AND CARRIED INTEREST.
PROJECTED PERFORMANCE HAS CERTAIN INHERENT AND MATERIAL LIMITATIONS AND IS NOT A GUARANTEE OF FUTURE RESULTS. PROJECTED RESULTS ARE ONLY ESTIMATES THAT ARE BASED UPON ASSUMPTIONS
MADE AT THE TIME THE PROJECTIONS ARE DEVELOPED. THERE CAN BE NO ASSURANCE THAT THE RESULTS SET FORTH IN THE PROJECTIONS WILL BE ATTAINED, AND ACTUAL RESULTS MAY BE SIGNIFICANTLY DIFFERENT FROM THE
PROJECTIONS. ALSO, GENERAL ECONOMIC FACTORS, WHICH ARE NOT PREDICTABLE, CAN HAVE A MATERIAL EFFECT ON THE RELIABILITY OF PROJECTIONS. ACTUAL RESULTS CONSISTENT WITH ANY PROJECTED PERFORMANCE
DEPEND SIGNIFICANTLY ON A NUMBER OF FACTORS IN ADDITION TO THE ACCURACY OF ASSUMPTIONS, INCLUDING THE FUND’S OVERALL ABILITY TO EXECUTE ITS INVESTMENT STRATEGY SUCCESSFULLY.
THE AMOUNTS MANAGED FOR THE FUND MAY DIVERGE FROM THE AMOUNTS UNDER MANAGEMENT THAT FORMED THE BASIS FOR ANY HISTORICAL PERFORMANCE. ACTUAL PERFORMANCE WILL VARY BASED ON MANY
FACTORS, INCLUDING, BUT NOT LIMITED TO, MARKET CONDITIONS AND DIFFERING FEE ARRANGEMENTS. ANY PERFORMANCE IN THIS PRESENTATION IS NOT AUDITED AND IS NOT INTENDED TO COMPLY WITH AIMR-PPS OR GIPS
GUIDELINES.
“PURCHASE PRICE” REPRESENTS THE NOMINAL ACQUISITION COST FOR THE PROPERTY EXCLUDING ANY TRANSACTION COSTS OR EXPENSES. IN THE EVENT THAT AN OAK STREET FUND AND OAK STREET CUSTOMIZED
FUNDS OF ONE INVEST TOGETHER IN AN ASSET, THE PURCHASE PRICE SHOWN IN SECTION IV WILL BE IDENTICAL (I.E. THE AGGREGATE NOMINAL ACQUISITION COST OF THE PROPERTY) EVEN THOUGH EACH OAK STREET ENTITY’S
INVESTED EQUITY MAY DIFFER.
TRACK RECORDS ARE PRESENTED FOR THOSE FUNDS AND CUSTOMIZED FUNDS OF ONE INVESTED IN ACCORDANCE WITH THE INVESTMENT STRATEGY (INCLUDING MAI FUND WHICH INVESTED IN ACCORDANCE WITH THE
INVESTMENT STRATEGY EVEN THOUGH IT POSSESSED THE FLEXIBILITY TO DEVIATE). THE TRACK RECORD FOR FUND II AND THE CUSTOMIZED FUND OF ONE IS NOT COMPLETE AND INVESTMENTS REALIZED TO THIS POINT ONLY
REPRESENT A PART OF THE OVERALL TOTAL RETURN OF AN INVESTMENT IN THESE VEHICLES – UNREALIZED INVESTMENTS MAY CAUSE THE OVERALL TOTAL RETURN TO BE LOWER OR HIGHER. PERFORMANCE FOR MAI FUND IS
INCLUDED UNDER CUSTOMIZED FUNDS OF ONE.
NOTHING HEREIN IS INTENDED TO IMPLY THAT THE FUND’S BUSINESS OR INVESTMENT METHODOLOGY MAY BE CONSIDERED “CONSERVATIVE,” “SAFE”, “RISK FREE” OR “RISK AVERSE”. YOU SHOULD BE AWARE THAT YOU
COULD LOSE ALL, OR A SUBSTANTIAL AMOUNT OF, YOUR INVESTMENT IN THE FUND. RISKS INCLUDE, BUT ARE NOT LIMITED TO, THE FACT THAT THE FUND MAY HAVE: LIMITED OR NO OPERATING HISTORY; VOLATILE
PERFORMANCE; LEVERAGE USE; LIMITED LIQUIDITY WITH NO SECONDARY MARKET EXPECTED AND RESTRICTIONS ON TRANSFERRING INTERESTS; AND HIGH FEES AND EXPENSES.
ANY INFORMATION, DATA, STATEMENTS, OPINIONS, OR PROJECTIONS MADE IN THIS SECTION MAY CONTAIN CERTAIN FORWARD LOOKING STATEMENTS, PROJECTIONS AND INFORMATION THAT ARE BASED ON THE
BELIEFS OF THE FUND OR OAK STREET AS WELL AS ASSUMPTIONS MADE BY, AND INFORMATION CURRENTLY AVAILABLE TO, OAK STREET. SUCH STATEMENTS REFLECT THE VIEW OF OAK STREET WITH RESPECT TO FUTURE EVENTS
AND ARE SUBJECT TO CERTAIN RISKS, UNCERTAINTIES AND ASSUMPTIONS, INCLUDING THOSE DESCRIBED UNDER “RISK FACTORS”. SHOULD ONE OR MORE OF THESE RISKS OR UNCERTAINTIES MATERIALIZE, OR SHOULD UNDERLYING
ASSUMPTIONS PROVE INCORRECT, ACTUAL RESULTS MAY VARY MATERIALLY FROM THOSE DESCRIBED. THE STATEMENTS, OPINIONS, AND/OR DATA EXPRESSED ARE SUBJECT TO CHANGE WITHOUT NOTICE BASED ON MARKET AND
OTHER CONDITIONS.