pension reforms and the allocation of retirement saving renata bottazzi university of bologna, ifs...
TRANSCRIPT

Pension Reforms and the Allocation of Retirement
Saving
Renata BottazziUniversity of Bologna, IFS and CHILD
Tullio JappelliUniversity of Naples “Federico II”, CSEF and CEPR
Mario PadulaUniversity “Ca’ Foscari” of Venice and CSEF
Prepared for the Annual Conference on Financial Security in Retirement18-19 September 2008

Motivation
Assess people awareness of retirement outcome innovations.
What do people know about their pensions? Provide the anatomy of the offset between
social security and private wealth. If social security wealth falls, do people increase more
financial or real wealth?
Study the demand for targeted retirement products.
Why are Italian pension funds still small?

The framework
We exploit a decade of pension reforms,
use data on subjective probabilities on
retirement outcomes,
and look at several components of private wealth, including financial (risky and safe) and real (business and housing) wealth.

Main results
Large revision of pension expectations, but many individuals have not completely updated their expectations yet.
Financial and real wealth have increased following the reforms, but the increase is more pronounced for real assets and housing in particular.
No effect on the propensity to hold targeted saving plans.

Offset and portfolio choice
Standard life-cycle framework: if social security wealth falls, private wealth should increase accordingly.
In a complete market world, the reduction of social security wealth should not affect portfolio rules.
With uninsurable income risk, borrowing (and short sale) constraints, portfolio rules become a function of age and wealth.

Background literature
Estimate social security by using current and projected legislation on pension eligibility:
Gale (1998), Gruber and Wise (1999), Attanasio and Brugiavini (2003), Attanasio and Rohwedder (2003)
using subjective expectations of retirement age and benefits: Bernheim (1990), Gustman and Steinmeier (2001), Bottazzi, Jappelli and Padula (2006)
The effect of the 1992-95 reform
Miniaci and Weber (1999): 1993 consumption drop partly due to the 1992 pension reform
Attanasio and Brugiavini (2002): offset between private saving and pension wealth (coefficient of -0.3)

The Italian pension reforms Three main reforms (1992, 1995, 1997)Features: retirement age and minimum years of contributions for
pension eligibility abolishment of seniority pensions (if started working after
1995) indexation of pension benefits to prices instead of wages less generous pension award formulas
Pension award formula:
Earnings model: 0.02 n w
Three groups:
Old ( 18n in 1995): Earnings model
Young ( 0n in 1995): Contribution model
Middle-aged (0 18n in 1995): Pro-rata model
1992 1995 1997
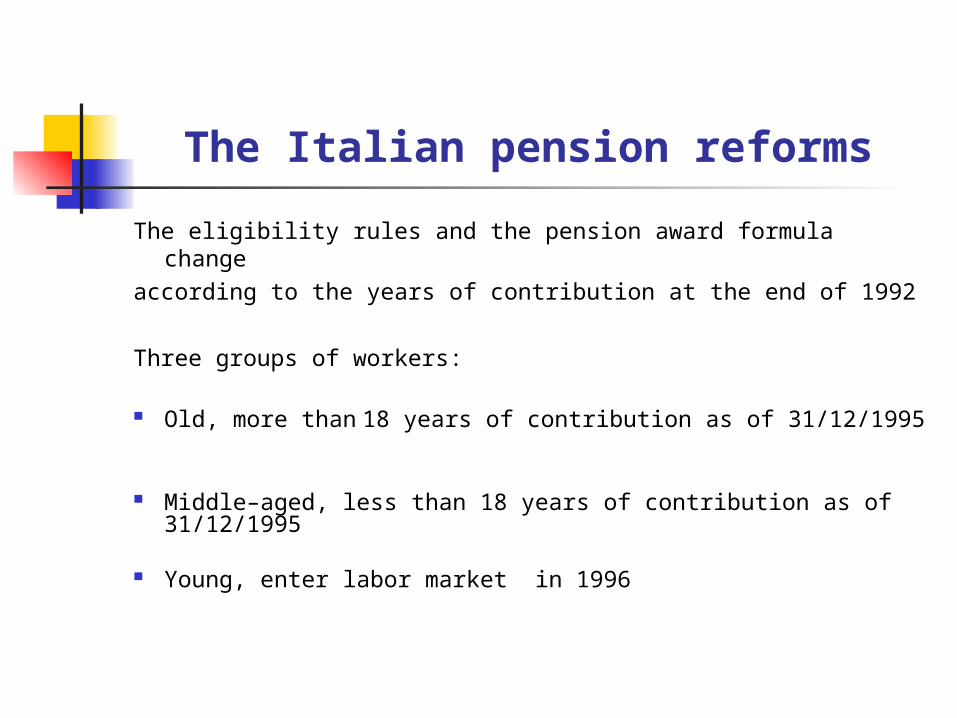
The Italian pension reforms
The eligibility rules and the pension award formula changeaccording to the years of contribution at the end of 1992
Three groups of workers:
Old, more than 18 years of contribution as of 31/12/1995
Middle–aged, less than 18 years of contribution as of 31/12/1995
Young, enter labor market in 1996
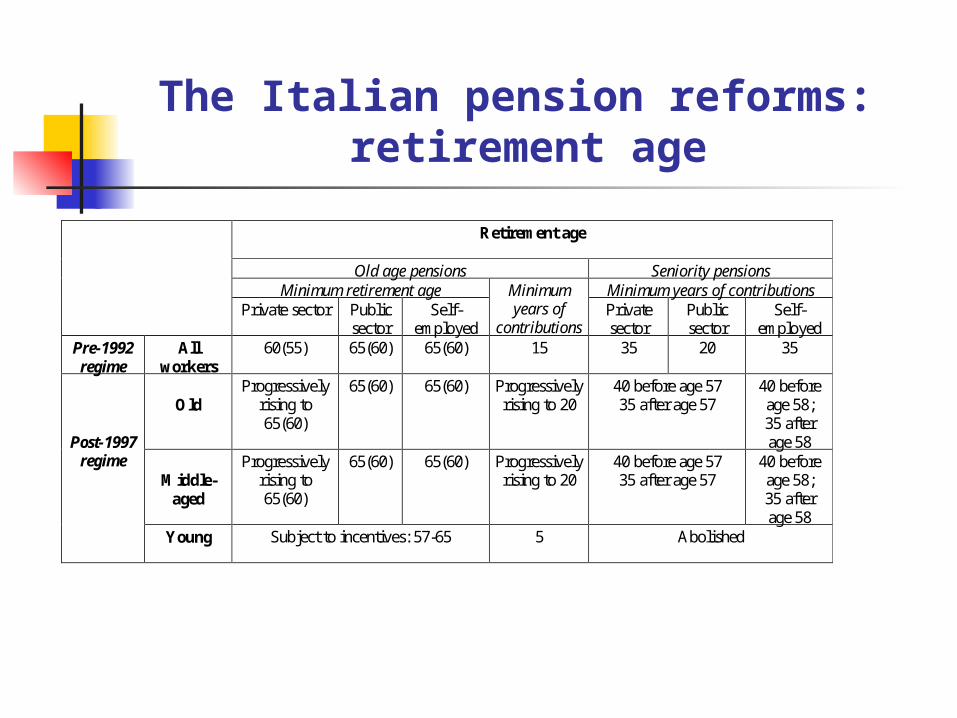
The Italian pension reforms: retirement age
Retirement age
Old age pensions Seniority pensions Minimum retirement age Minimum years of contributions
Private sector Public sector
Self-employed
Minimum years of
contributions Private sector
Public sector
Self-employed
Pre-1992 regime
All workers
60(55) 65(60) 65(60) 15 35 20 35
Old
Progressively rising to 65(60)
65(60) 65(60) Progressively rising to 20
40 before age 57 35 after age 57
40 before age 58; 35 after age 58
Middle-
aged
Progressively rising to 65(60)
65(60) 65(60) Progressively rising to 20
40 before age 57 35 after age 57
40 before age 58; 35 after age 58
Post-1997 regime
Young Subject to incentives: 57-65
5 Abolished

The Italian pension reforms: the pension award formula
Pension award formula
Private sector Public sector Self-employed
Pre-1992 regime
All workers Earnings model
2% years of contributions average of the last 5 years of earnings
2.33% years of contribution last year of earnings
2% years of contributions times average of the last 10 years of earnings
Old Earnings model
Gradually to 2% years of contribution average of last 10 years of earnings
Gradually to 2% years of contribution average of last 10 years of earnings
Gradually to 2% years of contribution average of last 15 years of earnings
Middle-aged Pro rata model
Earnings model before 1995, contribution model after 1995.
Post-1997 regime
Young Contribution model
Contributions (33% of gross wage for employees and 20% for self-employed) are capitalized on the basis of 5-years moving average of GDP growth. The capitalized sum is then multiplied by a coefficient that varies by retirement age, taking into account life expectancy.

Data
Survey of Household Income and Wealth (SHIW) – representative of Italian population
Subjective expectations on retirement age and replacement rate:
Retirement age: - all survey years - “When do you expect to retire? ” Replacement rate: - years 1989, 1991, 2004, 2006
“Consider the moment when you will retire. Setting your final monthly income before retirement equal to 100, what do you expect your first monthly pension to be? ”
1989 1991 2004 2006
Pre-reform transitional period
Post-reform

Expected pension wealth at retirement
Use subjective expectations on retirement age and replacement rate to construct the ratio of expected pension wealth at retirement to earnings (evaluated at each survey yeart):
( ) 11( | ) ( | )1 1
ttNN t
TNu N
t t t tNt
ggSSWSSWY P N t P Ny r r
expectedretirement
age
expectedreplacement
rate
P(•)=survival probability (by age and gender, before and after the reform)
g=growth rate r=interest rate
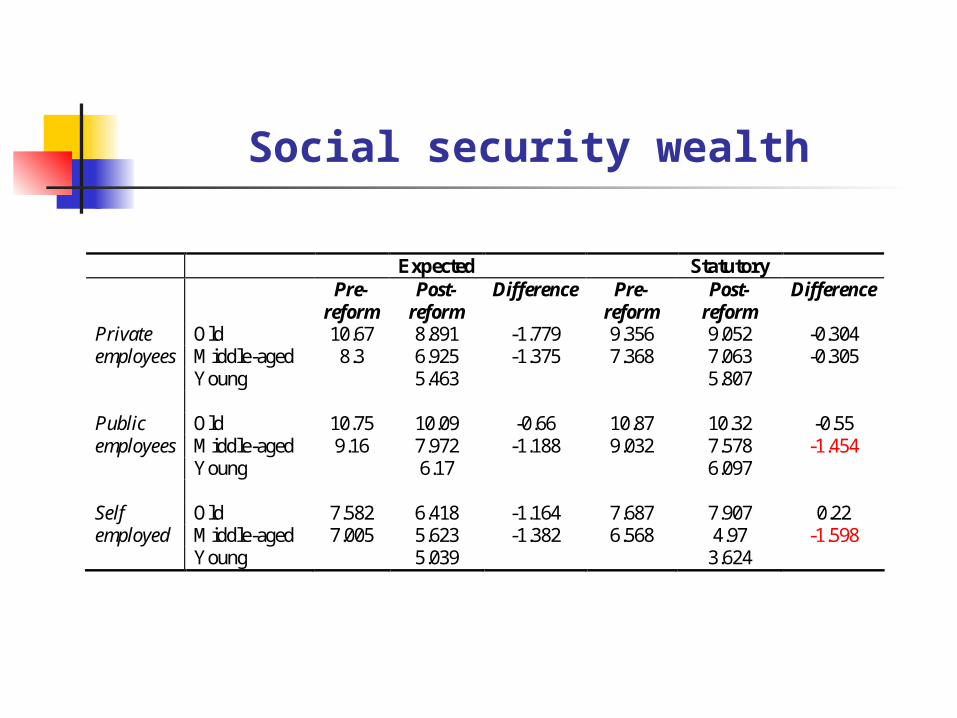
Social security wealth Expected Statutory
Pre-reform
Post- reform
Difference Pre-reform
Post-reform
Difference
Private Old 10.67 8.891 -1.779 9.356 9.052 -0.304 employees Middle-aged 8.3 6.925 -1.375 7.368 7.063 -0.305 Young 5.463 5.807 Public Old 10.75 10.09 -0.66 10.87 10.32 -0.55 employees Middle-aged 9.16 7.972 -1.188 9.032 7.578 -1.454 Young 6.17 6.097 Self Old 7.582 6.418 -1.164 7.687 7.907 0.22 employed Middle-aged 7.005 5.623 -1.382 6.568 4.97 -1.598 Young 5.039 3.624

Expectation error distribution of social security wealth before and after the reform
0.1
.2.3
-5 0 5 10
pre-reform post-reform

Trends in financial and real wealth
Financial
wealth Real
wealth
Pre-reform
Post- reform
Difference Pre-reform
Post-reform
Difference
Private Old 0.4978 0.6151 0.1173 2.697 4.705 2.008 employees Middle-aged 0.4247 0.4581 0.0334 1.796 4.325 2.529 Young 0.3922 2.951 Public Old 0.492 0.545 0.492 3.15 5.497 2.347 employees Middle-aged 0.4114 0.5405 0.4114 2.302 5.356 3.054 Young 0.3989 4.02 Self Old 0.6098 0.7034 0.6098 5.032 9.362 4.33 employed Middle-aged 0.4901 0.7414 0.4901 3.641 9.22 5.579 Young 0.5521 6.507
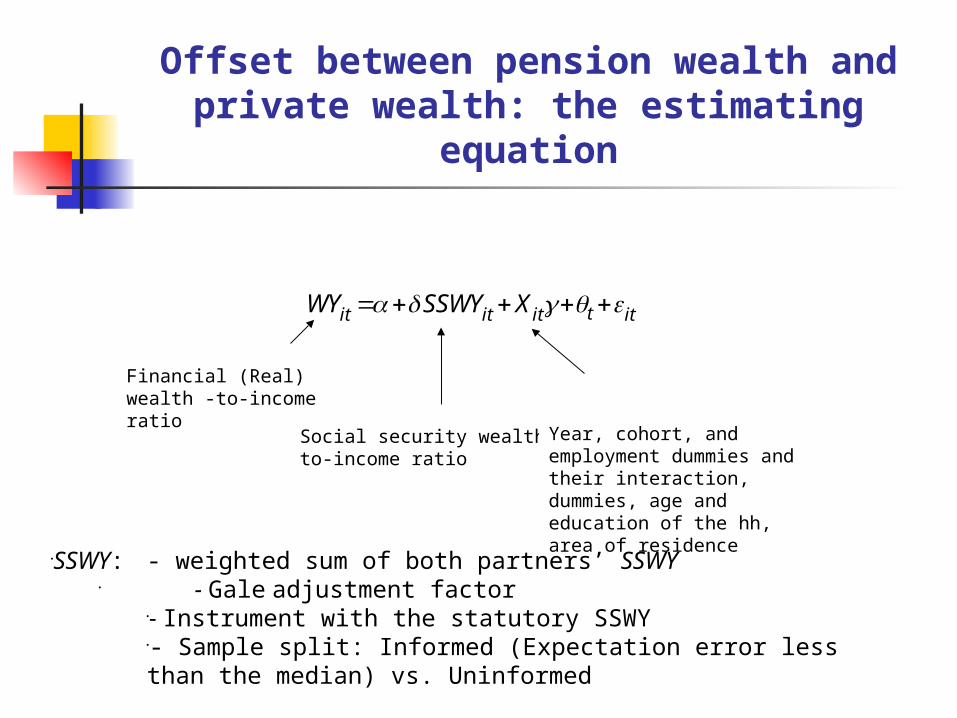
Offset between pension wealth and private wealth: the estimating
equation
tit it it itWY SSWY X
Financial (Real) wealth -to-income ratio
Social security wealth-to-income ratio
SSWY: - weighted sum of both partners’ SSWY - Gale adjustment factor
- Instrument with the statutory SSWY- Sample split: Informed (Expectation error less than the median) vs. Uninformed
Year, cohort, and employment dummies and their interaction, dummies, age and education of the hh, area of residence

Offset between pension wealth and private wealth: the results
Financial wealth
All Informed Uninformed -0.082 -0.128 -0.055
(0.011)*** (0.019)*** (0.013)***
Real wealth
All Informed Uninformed -0.478 -0.761 -0.318
(0.070)*** (0.080)*** (0.131)*
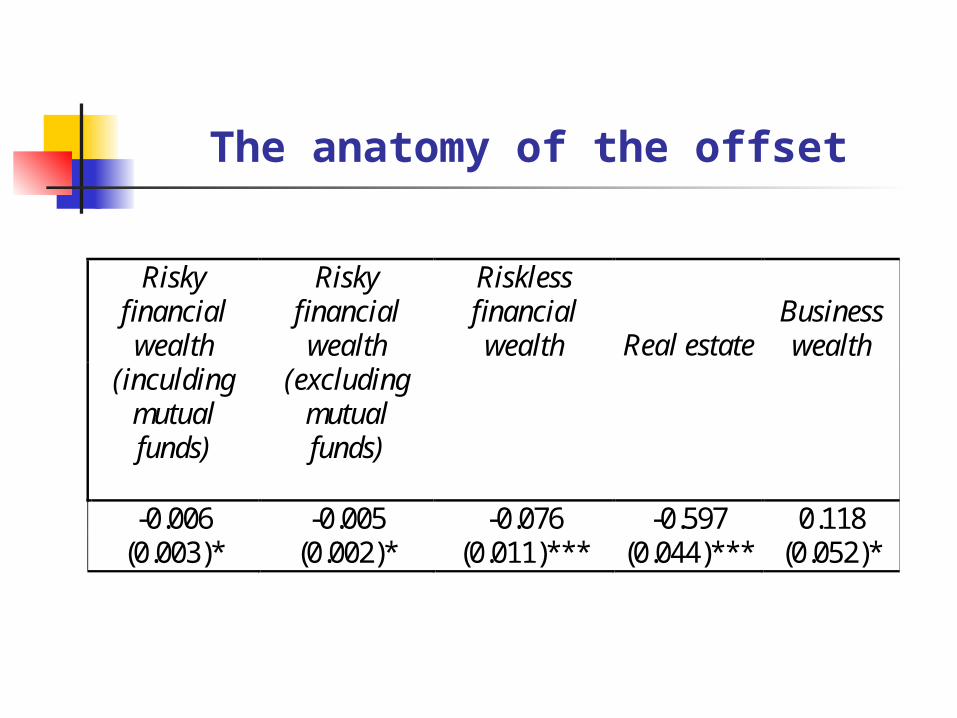
The anatomy of the offset
Risky financial wealth
Risky financial wealth
Riskless financial wealth Real estate
Business wealth
(inculding mutual funds)
(excluding mutual funds)
-0.006 -0.005 -0.076 -0.597 0.118 (0.003)* (0.002)* (0.011)*** (0.044)*** (0.052)*
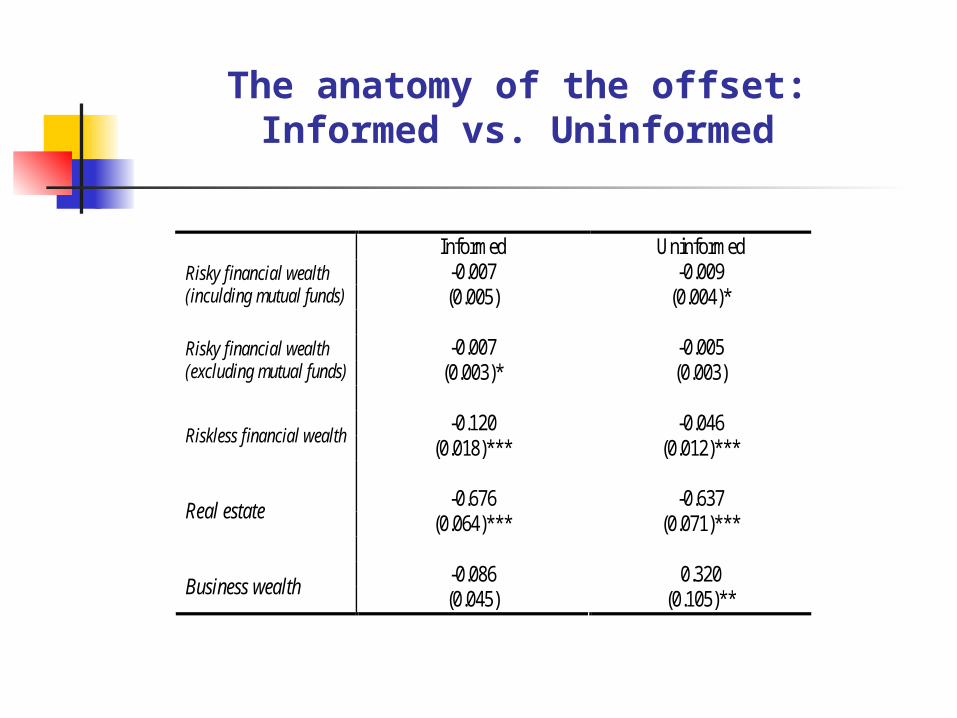
The anatomy of the offset:Informed vs. Uninformed
Informed Uninformed -0.007 -0.009 Risky financial wealth
(inculding mutual funds) (0.005) (0.004)*
-0.007 -0.005 Risky financial wealth (excluding mutual funds) (0.003)* (0.003)
-0.120 -0.046 Riskless financial wealth
(0.018)*** (0.012)***
-0.676 -0.637 Real estate
(0.064)*** (0.071)***
-0.086 0.320 Business wealth
(0.045) (0.105)**

Summary
A reduction in social security wealth equivalent to 1 year’s income brings about an increase in financial wealth of just below 1 month’s income,
and an increase in real assets of about 6 times monthly income.
The effect is larger for the “Informed” and for housing wealth.
Other possible channels through which retirement saving increases

Targeted retirement saving products
Pension plans
Life-insurance policies
All Informed Uninformed All Informed Uninformed -0.007 -0.012 0.001 -0.017 -0.020 -0.022 (0.018) (0.026) (0.027) (0.015) (0.021) (0.025)
Conclusions
Large revision of expected social security wealth.
Larger effects of reform for real, smaller for financial wealth.
Information on pension outcomes is still important,
But the effect of pension reforms on the demand of targeted retirement saving products is small

Implications
Improving the dissemination of information about pension rights,
but increasing awareness of pension reforms might not be sufficient to prompt households to increase private wealth.
Pension reforms don’t seem to have diminished the propensity to invest in real estate.
Annuity markets are still at an infant stage.