pensions vs. higher education - illinois policy · retirement costs now consume more than 50...
TRANSCRIPT

Pensions vs. higher education Skyrocketing pensions, bloated administrations are pricing students out of college degrees
By Ted Dabrowski, Vice President of Policy, and John Klingner, Policy Analyst
Additional resources: illinoispolicy.org190 S. LaSalle St., Suite 1500, Chicago, IL 60603 | 312.346.5700 | 802 S. 2nd St., Springfield, IL 62704 | 217.528.8800 POLICY
ILLINOIS
ILLINOIS POLICY INSTITUTE FEBRUARY 2016
SPECIAL REPORT PENSIONS

TABLE OF CONTENTS
Introduction
Skyrocketing tuition costs
Higher education’s administrative costs
The growing university pension crisis
Retirement costs consume 50% of the state’s spending on higher education
Conclusion
Appendix A
Appendix B
Endnotes
Guarantee of quality scholarship
01
02
04
06
10
13
15
16
18
20

INTRODUCTION
01
Many Illinois state politicians and university administrators are blaming the state’s budget gridlock for higher-education funding shortfalls.
“We’re seeing this incremental dismantling of our universities piece by piece, as people get laid off and things get shut down,” said Randy Dunn, president of the Southern Illinois University System. “Over time you turn around and you wonder what happened to your university. Piece by piece it just disappeared on you. I worry that we started down that path.”1
But budget gridlock isn’t why Illinois’ higher-education system is facing financial troubles. The truth is that more than 50 percent of Illinois’ $4.1 billion budget for state universities is spent on retirement costs – making it easy to understand why there’s not money out there for much else.
Rather than keep tuition low, Illinois colleges and universities have taken the flood of federal and state monies available to higher education over the past two decades and spent it on a massive increase in administrative positions and exorbitant executive compensation. That growth and those higher salaries have dramatically increased the cost of university pensions, causing the state to redirect a majority of its higher-education funds toward retirement costs.
The state is now spending more money on retirement costs than on university operations. A decade ago, retirement costs made up only 20 percent of the state’s total higher-education spending. Today, that percentage has ballooned to 53 percent. As spending on retirements rose from 2006 to 2015, state spending on higher-education operations fell by over $150 million. Higher-education costs are out of control in every state, but Illinois adds an untenable pension crisis to the mix of too many administrators and budget bloat.
Retirement costs now consume more than 50 percent of all state spending on higher educationState spending on higher-education retirement costs vs. spending on operations (in billions)
$0.0
$0.5
$1.0
$1.5
$2.0
$2.5
2006 20152009
Percent of total state spending devoted to retirement costs
Percent of total statespending devoted to operations
Fiscal year
83%
81%
78%
75%
69%
65%
58%
50%
49%
47%
17%
19%
22%
25%
31%
35%
42%
50%
51%
53%
2006
2007
2008
2009
2010
2011
2012
2013
2014
2015
State spending on higher- education operations
State spending on higher- education retirement costs
2012
Retirement costs now consume more than 50 percent of all state spending on higher educationState spending on higher-education retirement costs vs. spending on operations (in billions)
Note: State spending on retirement costs includes pensions, health care and pension obligation bonds. See appendix for more information.Source: Illinois Board of Higher Education, Commission on Government Forecasting and Accountability @illinoispolicy
Note: State spending on retirement costs includes pensions, health care and pension obligation bonds. See appendix for more information.Source: Illinois Board of Higher Education, Commission on Government Forecasting and Accountability @illinoispolicy

02
Universities want to use Illinois’ 2015 budget crisis to blame the state for the mess the leaders of these schools have made, claiming the state’s lack of appropriations has made college less accessible to lower-income students.
But the fact is the universities’ own out-of-touch policies have led to a spike in student tuitions of nearly 100 percent in the past decade.2 Skyrocketing tuition, driven by ever-increasing administrative costs and the higher-education pension crisis, has put college out of reach for many Illinoisans.
1. Skyrocketing tuition costs
Even a cursory look at student tuition rates shows that Illinois’ public universities’ bloated spending and growing administrative staffs have bumped up tuition at an alarming rate.
According to the Illinois Board of Higher Education, tuition has been increasing dramatically at Illinois’ public universities for more than a decade. Combined student tuition and fees grew anywhere from 74 to 112 percent between 2006 and 2016, depending on the university.3
Retirement costs now consume more than 50 percent of all state spending on higher educationState spending on higher-education retirement costs vs. spending on operations (in billions)
$0.0
$0.5
$1.0
$1.5
$2.0
$2.5
2006 20152009
Percent of total state spending devoted to retirement costs
Percent of total statespending devoted to operations
Fiscal year
83%
81%
78%
75%
69%
65%
58%
50%
49%
47%
17%
19%
22%
25%
31%
35%
42%
50%
51%
53%
2006
2007
2008
2009
2010
2011
2012
2013
2014
2015
State spending on higher- education operations
State spending on higher- education retirement costs
2012
Retirement costs now consume more than 50 percent of all state spending on higher educationState spending on higher-education retirement costs vs. spending on operations (in billions)
Note: State spending on retirement costs includes pensions, health care and pension obligation bonds. See appendix for more information.Source: Illinois Board of Higher Education, Commission on Government Forecasting and Accountability @illinoispolicy
Note: State spending on retirement costs includes pensions, health care and pension obligation bonds. See appendix for more information.Source: Illinois Board of Higher Education, Commission on Government Forecasting and Accountability @illinoispolicy

03
At Northeastern Illinois University, the average annual cost of tuition and fees has gone up by 112 percent, to $13,374 in 2016 from $6,306 in 2006.
And at the University of Illinois at Urbana-Champaign, the campus with the highest tuition and fee costs in the state, average tuition now costs $15,626 annually, up 80 percent since 2006.
By comparison, the national average of in-state tuition and fees at four-year public institutions was $8,893 for the 2013-2014 school year.4
Over the past decade, Illinois colleges and universities have extracted hundreds of millions of dollars in extra tuition and fees from students, using the excuse that state appropriations to higher-education operations have declined.
But a recent report from the Illinois state Senate Democratic Caucus debunked this myth, saying:
“While state operating support for public universities has declined by 7% over the last decade, the corresponding increase in tuition and fee revenue has not only offset state budget cuts, but sustained annual public university revenue growth rate in excess of 5%. Much of this revenue growth has been used to support an increasingly larger bureaucracy and excessive administrative salaries.”5
Escalating costs having nothing to do with education and instruction have
Student tuition and fees have grown by as much as 100 percent since 2006Annual full-time resident undergraduate tuition and fees: entry level
University 2006 averagetuition and fees
2016 average tuition and fees
Average annual growth rate
Total growth 2006 - 2016
$6,626
$6,339
$5,050
$7,091
$6,306
$7,229
$6,899
$6,831
$5,209
$8,498
$5,965
$8,688
$11,758
$11,305
$10,246
$13,666
$13,374
$14,318
$12,889
$13,137
$10,247
$14,816
$12,411
$15,626
5.90%
5.96%
7.33%
6.78%
7.81%
7.07%
6.45%
6.76%
7.00%
5.72%
7.60%
6.05%
77%
78%
103%
93%
112%
98%
87%
92%
97%
74%
108%
80%
Source: Illinois Board of Higher Education @illinoispolicy
Chicago State
Eastern Illinois
Governors State
Illinois State
Northeastern Illinois
Northern Illinois
Western Illinois
Southern Illinois
Carbondale
Edwardsville
University of Illinois
Chicago
Springfield
Urbana-Champaign
04
made college all but unaffordable for lower-income students. It used to be that students could work to pay for their education while attending college, but with such steep increases in tuition costs, that is no longer an option.
2. Higher education’s administrative costs
Increasing number of administratorsPublic colleges and universities are responsible for the biggest driver behind the higher-education funding crisis: Namely, the incredible size and cost of college and university administrations.
Over the past several decades, Illinois’ public colleges and universities have gone on an administrative hiring spree. They’ve grown the size of the higher-education bureaucracy in Illinois while hiking tuition and spending state money to offset the cost.
According to the Illinois state Senate Democratic Caucus’ report, the rate at which colleges and universities across the nation are hiring administrators far outpaces the hiring of professors: “The disproportionate increase in the number of employees hired by colleges and universities to manage or administer people, programs and regulations has continued unabated in recent years, increasing 50% faster than the number of instructors between 2001 and 2011.”6
Illinois has followed that pattern. The number of administrators in Illinois’ universities grew by nearly a third (31.1 percent) between 2004 and 2010. At the same time, faculty only increased 1.8 percent, and the number of students only grew 2.3 percent.7
At community colleges in Illinois, the number of administrators grew 13.5 percent while the number of faculty and students grew 6.8 percent and 3.9 percent, respectively.8
Thus, Illinois has contributed to the decadeslong, national trend of dramatically declining administrator-to-student ratios.
In 1975, the administrator-to-student ratio for higher-education institutions nationally was 1 administrator for every 84 students. By 2005, the nationwide ratio had declined to 1-to-68.9
In Illinois, the ratio has fallen even further. In 2011, the average administrator-to-student ratio for Illinois’ public universities was approximately 1-to-45.10
Chicago State University had the lowest ratio of all, with 18 students for every one administrator – very close to the university’s faculty-to-student ratio of 1-to-16.11
Exorbitant administrative salariesNot only have colleges and universities massively expanded their number

05
of administrators, but they have also been paying administrators exorbitant salaries.
According to the Illinois Board of Higher Education, over half of Illinois’ 2,465 university administrators received a base salary of $100,000 or more in 2015. Ninety-five percent of the University of Illinois system’s top 126 administrators made $100,000 or more as a base salary.12
Those high salaries themselves impose a heavy cost on universities – and they are only a part of administrators’ overall compensation.
Many top administrators also receive other perks such as housing allowances, cars, club memberships and generous bonuses that can cost universities hundreds of thousands of additional dollars per administrator.
The College of DuPage’s compensation practices are a perfect example of the administrative extravagances paid by Illinois colleges and universities. The college’s special compensations and large termination payments granted to then-President Robert Breuder resulted in a scandal that prompted Illinois lawmakers to review the entire practice of administrative compensation in higher education.
According to the resulting Illinois Senate report: “By the end of the eight contract renewals, Dr. Breuder was making $292,738 a year in base pay, a $20,978 a year housing allowance, almost $10,000 a year vehicle allowance, and over $100,000 a year in additional compensation, including deferred compensation.”13
Even the top-compensated administrator in 2014, the University of Illinois’ Chancellor Paula Allen-Meares, received much of her total compensation in the form of a bonus. The chancellor received a base salary of $437,244 and a bonus retention incentive of $450,000, bringing her annual compensation to $887,244.14

06
3. The growing university pension crisis
While Illinois politicians are responsible for decades of pension underfunding and the granting of overgenerous pension benefits, Illinois’ university and college officials must also share the blame for the higher-education pension crisis. The problem has never been revenue, but bloat and overspending.
The enormous salaries university administrators and other employees receive not only increase expenses for colleges and universities, but
@illinoispolicy
Top higher-education administrators in Illinois receive excessive salaries, bonuses and other benefitsChief-executive compensation at Illinois public colleges and universities, fiscal year 2014
Chief-executive compensation at Illinois public universities, fiscal year 2014
Paula Allen-Meares
Timothy J. Flanagan
Phyllis Wise
Robert Easter
Rita Cheng
John Peters
Elaine Maimon
Sharon Hahs
William Perry
Julie Furst-Bowe
Jack Thomas
Susan Koch
Wayne D. Watson
$437,244
$350,004
$249,000
$462,375
$354,963
$388,656
$298,595
$293,600
$290,000
$260,100
$265,224
$148,953
$199,570
$450,000
$344,158
$311,500
$90,000
$27,500
$298
$35,000
$36,531
$32,289
$27,322
$2,748
$111,920
$20,400
$34,800
$19,999
$26,522
$887,244
$694,162
$560,500
$552,375
$402,863
$388,954
$368,395
$330,131
$322,289
$307,421
$294,494
$260,873
$199,570
University Name Base payBonuses/additionalcompensation
Annuities/retirementenhancement
Totalcompensation
University of Illinois, Chicago
Illinois State University
University of Illinois, Urbana-Champaign
University of Illinois
Southern Illinois University, Carbondale
Northern Illinois University
Governors State University
Northeastern Illinois University
Eastern Illinois University
Southern Illinois University, Edwardsville
Western Illinois University
University of Illinois, Springfield
Chicago State University
Chief-executive compensation at Illinois community colleges, fiscal year 2014
Community college Name Base payBenefits/extra dutypay
Annuities/retirementenhancement
Totalcompensation
Lewis & Clark Community College.
College of DuPage
Illinois Central College
Harper College
Elgin Community College
Lincoln Land Community College
Oakton Community College
College of Lake County
Richland Community College
Dale T. Chapman
Robert Breuder
John S. Erwin
Kenneth Ender
David Sam
Charlotte J. Warren
Margaret B. Lee
Girard W. Weber
Gayle M. Saunders
$279,661
$292,739
$241,143
$260,969
$260,000
$231,420
$259,066
$241,118
$214,724
$214,742
$127,772
$127,366
$115,983
$91,283
$78,684
$89,314
$60,765
$80,759
$46,000
$74,581
$23,000
$10,000
$49,992
$21,150
$540,403
$495,092
$391,509
$376,952
$361,283
$360,096
$348,380
$323,033
$295,483
Note: See Senate report for a full description of each compensation categorySource: Illinois Senate Democratic Caucus Investigative Report on Executive Compensation at Illinois Higher Education Institutions, 2015

07
directly contribute to the growing costs of university pension benefits for which state taxpayers are responsible.
The generous pension benefits of university workersBecause university retirees’ annual pension benefits are determined in part by their final average salaries, large salary increases, coupled with generous pension rules, have boosted the retirement benefits of university employees far beyond what state taxpayers can afford.
Of the over 52,000 current State Universities Retirement System, or SURS, retirees:
• 50 percent retired in their 50s, many with full pension benefits.• Almost half will see their annual pension benefits double over the course of their retirement, based on approximate life expectancies.• Over 40 percent will receive more than $1 million in total retirement benefits, and over 7,400 (14 percent) will receive more than $2 million in benefits.
The top beneficiary in SURS is Leslie Heffez, an oral surgeon who retired from the University of Illinois at Chicago in 2012. Heffez currently draws a $547,000 annual pension and, assuming a current life expectancy of 81 years, he’ll receive nearly $18 million in pension benefits over the course of his retirement.15
And while Heffez is by far the top pensioner in SURS, he’s not the only university retiree who will receive millions in total pension benefits. The average SURS career worker (30 years or more of service) who has recently retired will receive a starting pension of $71,600 and also earn more than $2 million in retirement benefits over the course of his or her retirement.
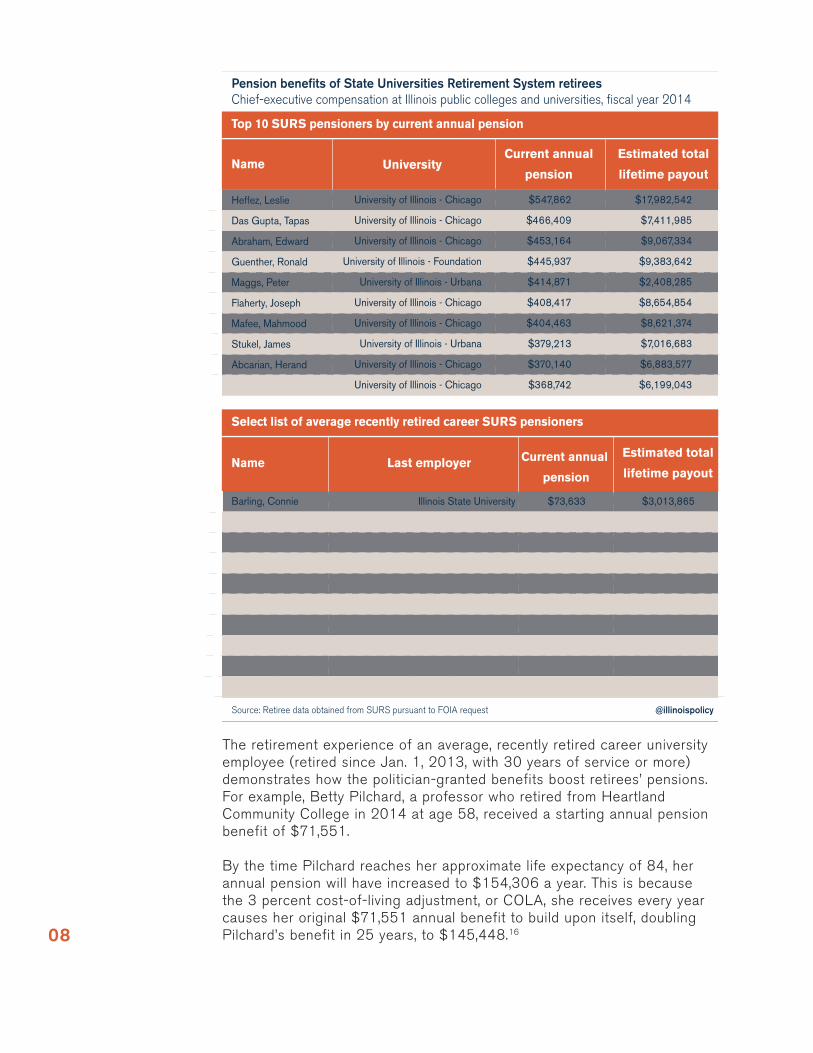
08
The retirement experience of an average, recently retired career university employee (retired since Jan. 1, 2013, with 30 years of service or more) demonstrates how the politician-granted benefits boost retirees’ pensions. For example, Betty Pilchard, a professor who retired from Heartland Community College in 2014 at age 58, received a starting annual pension benefit of $71,551.
By the time Pilchard reaches her approximate life expectancy of 84, her annual pension will have increased to $154,306 a year. This is because the 3 percent cost-of-living adjustment, or COLA, she receives every year causes her original $71,551 annual benefit to build upon itself, doubling Pilchard’s benefit in 25 years, to $145,448.16
Pension benefits of State Universities Retirement System retireesChief-executive compensation at Illinois public colleges and universities, fiscal year 2014
Name UniversityCurrent annual
pension
Estimated total
lifetime payout
Heffez, Leslie
Das Gupta, Tapas
Abraham, Edward
Guenther, Ronald
Maggs, Peter
Flaherty, Joseph
Mafee, Mahmood
Stukel, James
Abcarian, Herand
Albrecht, Ronald
University of Illinois - Chicago
University of Illinois - Chicago
University of Illinois - Chicago
University of Illinois - Foundation
University of Illinois - Urbana
University of Illinois - Chicago
University of Illinois - Chicago
University of Illinois - Urbana
University of Illinois - Chicago
University of Illinois - Chicago
$547,862
$466,409
$453,164
$445,937
$414,871
$408,417
$404,463
$379,213
$370,140
$368,742
$17,982,542
$7,411,985
$9,067,334
$9,383,642
$2,408,285
$8,654,854
$8,621,374
$7,016,683
$6,883,577
$6,199,043
Top 10 SURS pensioners by current annual pension
Last employer Current annual
pension
Estimated total
lifetime payout
Select list of average recently retired career SURS pensioners
Name
Barling, Connie
Pilchard, Betty
Berbert, Kirk
Lifonti, Eugene
Minor, Cindy
Simmons, Rosemary
Patton, Brent
Finucane, William
Simpson, Aquanette
Harris, Frances
Illinois State University
Heartland Community College
University of Illinois - Chicago
University of Illinois - Chicago
John A. Logan College
Southern Illinois University - Carbondale
Southern Illinois University - Carbondale
Northern Illinois University
Northern Illinois University
University of Illinois - Urbana
$73,633
$72,803
$72,766
$72,708
$71,609
$71,546
$71,448
$70,799
$70,529
$70,010
$3,013,865
$2,680,684
$2,234,646
$2,682,477
$2,763,489
$3,163,247
$2,411,582
$1,848,978
$2,202,885
$2,222,647
Source: Retiree data obtained from SURS pursuant to FOIA request @illinoispolicy

09
Annual pension benefits of average career State Universities Retirement System workers double over the course of their retirementsProjected growth of career university employee Betty Pilchard’s annual pension benefit
$20,000
$40,000
$60,000
$80,000
$100,000
$120,000
$140,000
$160,000
$180,000
58 60 62 64 66 68 70 72 74 76 78 80 82 84
Age
$154,306
$71,551
Note: Estimated total lifetime payout is based on approximate Social Security life expectancy.Source: Retiree data obtained from SURS pursuant to a FOIA request @illinoispolicy
To be clear, university workers who earn these generous pension benefits have done nothing wrong. They’re benefiting from labor negotiations that have led to lucrative compensation packages.
However, it’s also clear that these benefits are no longer fair or affordable for Illinois taxpayers.
The growing cost of pension benefits for university workersThe generous five- and six-figure annual benefits and million-dollar payouts the average SURS pensioner receives due to overgenerous salary levels, retiring in their 50s, longer life expectancies and 3 percent COLAs have put tremendous strain on the university pension system and the state.
According to the Illinois Department of Insurance, the total annual pension benefits for SURS members (the benefits accrued by all pensioners) have grown at the incredible pace of 8.4 percent annually since 1987, to $37 billion in 2014 from just $4.2 billion in 1987. That growth rate far surpasses the growth rates of state revenues, inflation, gross domestic product and taxpayer incomes during the same period.17

10
Source: Illinois Department of Insurance @illinoispolicy
Accrued SURS pension benefits have grown 8.4 percent annually between 1987 and 2015SURS actuarially accrued liabilities, actual (in billions)
$0
$5
$10
$15
$20
$25
$30
$35
$40
1987 20151994 2001 2008
Thus, the benefits promised to university pensioners are growing at such a rapid rate that state appropriations cannot possibly keep up with them in the absence of pension reform.
This growing cost of pensions is one of the reasons the state is pouring billions of higher-education appropriations into retirement costs rather than university operations.
4. Retirement costs consume 50 percent of the state’s spending on higher education
University officials have complained for years about the state’s lack of commitment to higher education, perpetuating the myth that the state’s appropriations have been in steady decline.
But state funding has increased by more than 60 percent over the last decade, growing to over $4.1 billion in 2015 from $2.5 billion in 2006.18
Unfortunately, a majority of that money has gone toward retirement costs, not classroom instruction.
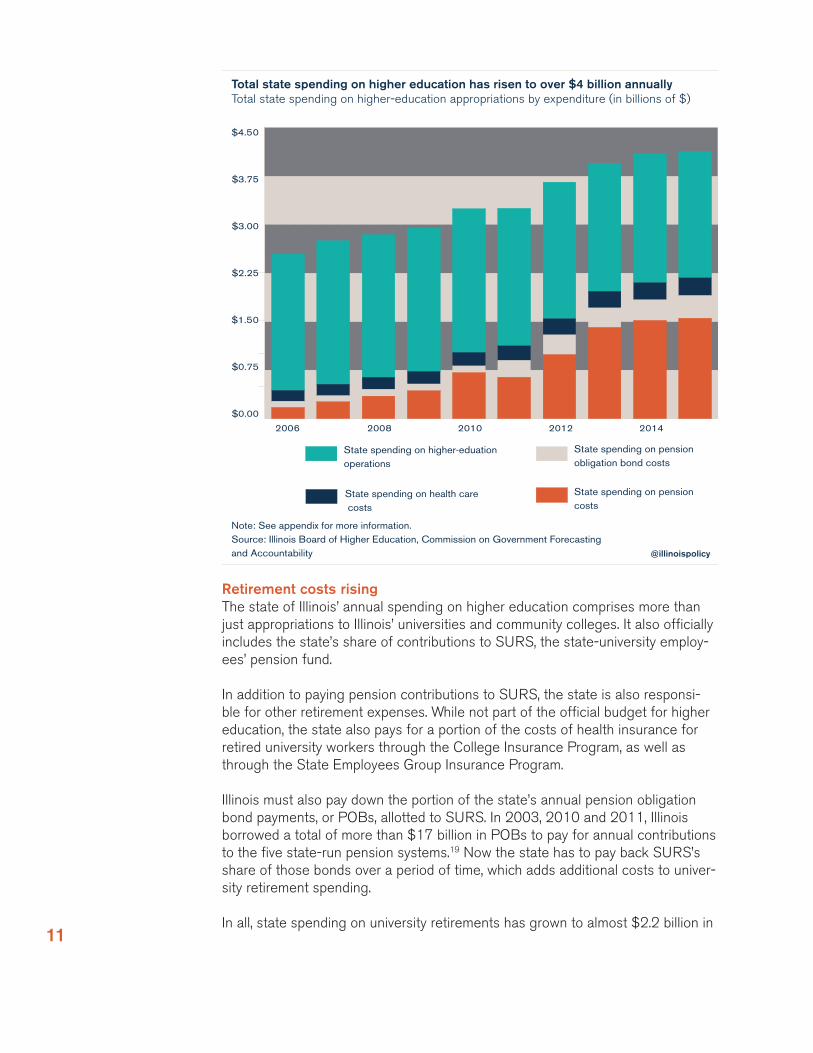
11
Total state spending on higher education has risen to over $4 billion annuallyTotal state spending on higher-education appropriations by expenditure (in billions of $)
State spending on pension costs
State spending on pension obligation bond costs
State spending on health care costs
State spending on higher-eduation operations
2006 2008 2010 2012 2014
@illinoispolicy
Note: See appendix for more information.Source: Illinois Board of Higher Education, Commission on Government Forecastingand Accountability
$0.00
$0.75
$1.50
$2.25
$3.00
$3.75
$4.50
Retirement costs risingThe state of Illinois’ annual spending on higher education comprises more than just appropriations to Illinois’ universities and community colleges. It also officially includes the state’s share of contributions to SURS, the state-university employ-ees’ pension fund.
In addition to paying pension contributions to SURS, the state is also responsi-ble for other retirement expenses. While not part of the official budget for higher education, the state also pays for a portion of the costs of health insurance for retired university workers through the College Insurance Program, as well as through the State Employees Group Insurance Program.
Illinois must also pay down the portion of the state’s annual pension obligation bond payments, or POBs, allotted to SURS. In 2003, 2010 and 2011, Illinois borrowed a total of more than $17 billion in POBs to pay for annual contributions to the five state-run pension systems.19 Now the state has to pay back SURS’s share of those bonds over a period of time, which adds additional costs to univer-sity retirement spending.
In all, state spending on university retirements has grown to almost $2.2 billion in

12
2015 from just $434 million in 2006. That’s an increase of over 400 percent, or a growth rate of 20 percent a year.20
The state’s increased contributions to university pensions have been the primary driver of the growth in higher-education retirement spending.
State contributions to SURS alone (excluding health care and POB costs) have increased by over 800 percent since 2006, to over $1.5 billion in 2015 from just $170 million a decade before.
Higher-education retirement costs have grown 400% since 2006Total state spending on higher-education retirement costs (in billions)
@illinoispolicy
@illinoispolicy
$0.0
$0.5
$1.0
$1.5
$2.0
$2.5
2006 2015
State spending on health care costs
State spending on pension obligation bond costs
State spending on pension costs
Note: See appendix for more information.Source: Illinois Board of Higher Education, Commission on Government Forecastingand Accountability
2009 2012
As spending on retirements rose from 2006 to 2015, state spending on higher-education operations fell by over $150 million.
In fact, if you look at total higher-education spending from 2006 to 2015, the state added $8 billion in new dollars over and above the base amount of the $2.5 billion it spent in 2006. Of those new dollars spent, every single one went to pay for retirement costs. As a result, state spending on higher education has flipped. The state now spends more money on retirement costs than on university operations. Retire-ment costs make up 53 percent of Illinois’ total higher-education spending.
And with the state’s required pension contributions to SURS projected to rise even higher over the next decade, retirement costs can be expected to further crowd out operational funding.

13
Retirement costs now consume more than 50 percent of all state spending on higher educationState spending on higher-education retirement costs vs. spending on operations (in billions)
$0.0
$0.5
$1.0
$1.5
$2.0
$2.5
2006 20152009
Percent of total state spending devoted to retirement costs
Percent of total statespending devoted to operations
Fiscal year
83%
81%
78%
75%
69%
65%
58%
50%
49%
47%
17%
19%
22%
25%
31%
35%
42%
50%
51%
53%
2006
2007
2008
2009
2010
2011
2012
2013
2014
2015
State spending on higher- education operations
State spending on higher- education retirement costs
2012
Retirement costs now consume more than 50 percent of all state spending on higher educationState spending on higher-education retirement costs vs. spending on operations (in billions)
Note: State spending on retirement costs includes pensions, health care and pension obligation bonds. See appendix for more information.Source: Illinois Board of Higher Education, Commission on Government Forecasting and Accountability @illinoispolicy
Note: State spending on retirement costs includes pensions, health care and pension obligation bonds. See appendix for more information.Source: Illinois Board of Higher Education, Commission on Government Forecasting and Accountability @illinoispolicy
The higher-education crisis has not resulted from Illinois’ budget gridlock. Rather, skyrocketing pensions, bloated administrative costs and soaring tuition and fees for students have caused it. These are all self-inflicted wounds.
To fix these problems, universities and the state will have to undertake important reforms, with the primary goal of increasing the accessibility of college for all students.
To that end, Illinois’ colleges and universities must first freeze and begin to reduce the cost of tuition. They must reform their operational spending, reduce the cost of salaries and eliminate administrative bloat – then pass the resulting savings on to students.
Until colleges and universities enact such reforms, the destructive circle of hiking
CONCLUSION
Retirement costs now consume more than 50 percent of all state spending on higher educationState spending on higher-education retirement costs vs. spending on operations (in billions)
$0.0
$0.5
$1.0
$1.5
$2.0
$2.5
2006 20152009
Percent of total state spending devoted to retirement costs
Percent of total statespending devoted to operations
Fiscal year
83%
81%
78%
75%
69%
65%
58%
50%
49%
47%
17%
19%
22%
25%
31%
35%
42%
50%
51%
53%
2006
2007
2008
2009
2010
2011
2012
2013
2014
2015
State spending on higher- education operations
State spending on higher- education retirement costs
2012
Retirement costs now consume more than 50 percent of all state spending on higher educationState spending on higher-education retirement costs vs. spending on operations (in billions)
Note: State spending on retirement costs includes pensions, health care and pension obligation bonds. See appendix for more information.Source: Illinois Board of Higher Education, Commission on Government Forecasting and Accountability @illinoispolicy
Note: State spending on retirement costs includes pensions, health care and pension obligation bonds. See appendix for more information.Source: Illinois Board of Higher Education, Commission on Government Forecasting and Accountability @illinoispolicy

14
tuition while relying increasingly on state subsidies will continue, which will make higher education less and less affordable.
The state must also do its part to fix the problems with higher education.
The excessive administrative salaries and generous pension benefits that have been granted to university workers have resulted in a retirement system that is unfair and unaffordable for the taxpayers who fund it.
To remedy that problem, Illinois needs to move away from its broken pension sys-tems – starting by moving new university workers onto 401(k)-style plans. That will be easy for university employees, as such a program already exists for them today. Almost 20,000 active and inactive members of SURS already participate in a 401(k)-style plan. These state-university workers control their own retirement accounts, which aren’t part of the increasingly insolvent pension system.21
In addition, enacting a constitutional amendment allowing Illinois to reform pen-sion benefits for existing workers going forward will go a long way toward fixing the self-inflicted crisis in higher education.

15
Methodology
This report uses the total of higher-education state general funds as reported by the Illinois Board of Higher Education as a base for higher-education funding. Then the State Universities Retirement System’s, or SURS’s, portion of the state’s annual pension obligation bond, or POB, payments – composed of both principal and interest – and the SURS portion of the State Employees Group Insurance Program, or SEGIP, are added in to determine the state’s “overall state higher-ed-ucation spending.”
Total higher-education state funds + SURS portion of POBs + SURS portion of SEGIP =
Overall state higher-education spending
To calculate the amount of “other higher-education support” to higher-education institutions, “retirement expenditures,” which are the sum of the state’s SURS contribution, the SURS portion of POBs, and the SURS portion of SEGIP and the College Insurance Program, are subtracted from the “overall state higher-ed-ucation spending” figure. The resulting number is what this report estimates as the state’s spending on “higher-education operations.”
Overall state higher-education spending – Higher-education retirement spending =
State spending on higher-education operations
Sources for historical information for the following data categories are as follows:
• Total higher-education general funds from the Illinois Board of Higher Education22
• SURS’s portion of POB payments from the Commission on Government Forecasting and Accountability, or COGFA23
• SURS’s portion of SEGIP from COGFA24
• College Insurance Program data from Illinois Board of Higher Education25
APPENDIX A

16
APPENDIX B
Southern Illinois University School of MedicineMichael W. NeumeisterJ. Ricardo Loret de MolaAziz KhanDouglas W. CarlsonJohn Kevin DorseyJerry E. KruseK. Thomas RobbinsJames M. GilchristJanet Regine AlbersStephen M. Soltys
University of Illinois at ChicagoDimitri T. AzarJeffrey Mark RooneyAvijit GhoshRobert A. WinnMichael B. ZennDale Edward BeattyDavid H. LoffingJeff H. NearhoofMichael B. MikhailEric A. Gislason
University of Illinois at Urbana-ChampaignMichael J. ThomasIlesanmi AdesidaArthur F. KramerDan C. PetersonGene E. RobinsonLawrence M. DeBrockJeffrey Louis BinderTanya Montaleone GallagherBarbara Jan WilsonAndreas C. Cangellaris
University of Illinois - university administrationRobert A. EasterJerry KrishnanJodi S. JoyceWalter KnorrChristophe PierreThomas R. BearrowsLawrence B. SchookMichael Hubert HitesMichael B. BassJerry L. Bauman
Northern Illinois UniversityDouglas D. BakerStephen B. CoryellSean T. FrazierJennifer L. Rosato PereaJonathan E. FurrMichael P. MaloneHarlan R. TellerPromod VohraJerry D. BlakemoreRaymond W. Alden
Senior OfficerSenior OfficerSenior OfficerSenior OfficerVice ChancellorSenior OfficerSenior OfficerSenior OfficerSenior OfficerSenior OfficerAverage
Senior OfficerUnit DirectorUnit DirectorUnit DirectorUnit DirectorUnit DirectorUnit DirectorSenior OfficerSenior OfficerVice ChancellorAverage
Unit DirectorVice ChancellorSenior OfficerVice ChancellorSenior OfficerSenior OfficerUnit DirectorSenior OfficerSenior OfficerSenior OfficerAverage
PresidentVice PresidentVice PresidentVice PresidentVice PresidentSenior OfficerVice PresidentVice PresidentVice PresidentVice PresidentAverage
PresidentVice PresidentSenior OfficerSenior OfficerUnit DirectorVice PresidentVice PresidentSenior OfficerVice PresidentVice PresidentAverage
$750,000$533,000$467,718$425,000$404,139$395,575$373,950$362,000$344,330$333,066$438,878
$503,453$482,000$379,560$342,500$336,000$320,000$320,000$319,300$317,946$300,000$362,076
$568,178$407,212$382,840$348,140$333,548$318,626$278,100$276,476$275,000$272,234$346,035
$478,558$392,177$367,710$334,925$319,465$317,589$299,332$298,484$276,061$266,500$335,080
$450,000$290,000$280,000$272,846$260,000$250,555$250,000$241,191$235,000$225,000$275,459
Southern Illinois University CarbondaleRita ChengPaul D. SarvelaJason Thomas GreeneRoyce DeAngelo BurnettJohn J. WarwickJohn William NicklowCheryl Burke JarvisCynthia L. FountainePeter Paul MykytynSusan M. Ford
Illinois State UniversityLarry H. DietzJanet Wessel KrejciGregory Allen AltGregory B. SimpsonJay Strand RichJay Robert GrovesPerry Lee SchoonLisa M. HusonDonald Patrick VickermanBrent Gordon Paterson
Southern Illinois University EdwardsvilleJulie Anne Furst-BoweBruce E. RotterParviz H. AnsariEric M. LangenwalterHasan SevimJohn C. NavinGireesh V. GupchupDwight E. McLeodRobert Duane DouglasJanice R. W. Joplin
Governors State UniversityElaine MaimonGebeyehu EjiguDeborah E. BordelonElizabeth A. CadaEllen Foster CurtisReinhold HillYun-Yau ShihKaren KisselSajid Saeed MianJohn G. Buenger
Northeastern Illinois UniversitySharon HahsRichard HelldoblerFrank RossMichael PierickMelba RodriguezVictoria Roman-LagunasMelissa Reardon HenryMichael BedellWamucii NjoguMaureen Gillette
ChancellorChancellorSenior OfficerUnit DirectorSenior OfficerVice ChancellorUnit DirectorSenior OfficerUnit DirectorVice ChancellorAverage
PresidentVice PresidentVice PresidentSenior OfficerUnit DirectorSenior OfficerSenior OfficerUnit DirectorVice PresidentVice PresidentAverage
ChancellorSenior OfficerVice ChancellorOther AdministratorSenior OfficerSenior OfficerSenior OfficerOther AdministratorOther AdministratorOther AdministratorAverage
PresidentVice PresidentVice PresidentUnit DirectorUnit DirectorUnit DirectorUnit DirectorVice PresidentSenior OfficerOther AdministratorAverage
PresidentVice PresidentVice PresidentVice PresidentVice PresidentVice PresidentOther AdministratorSenior OfficerSenior OfficerSenior OfficerAverage
$354,936$267,000$266,640$244,356$241,068$234,132$231,024$228,960$225,072$206,784$249,997
$350,004$261,732$240,732$233,484$228,276$224,724$218,592$218,520$216,780$214,200$240,704
$302,500$273,636$220,000$213,804$206,043$193,836$193,836$193,447$179,739$176,359$215,320
$298,603$212,418$205,394$198,719$197,860$181,528$181,442$172,079$160,528$160,002$196,857
$294,800$200,893$177,840$177,480$177,138$176,271$174,000$165,000$161,812$160,066$186,530
Name Postion Base salary Name Postion Base salary
Top-paid administrators by university institutionBase salaries, 2015

17
Note: The Institute defined administrative positions to include: president, chancellor, vice president, vice chancellor, senior officer, unit director and other administrator. Source: Public University Administrator and Faculty Salary and Benefits Database, Illinois Board of Higher Education
Name Postion Base salary Name Postion Base salaryWestern Illinois UniversityJackie ThomasGary M. BillerKathleen NeumannJulie Kay DeweesKenneth S. HawkinsonJoseph RivesSusan MartinelliWilliam T. ClowStephen L. FrazierBradley Lee Bainter
Southern Illinois University – system officeRandy J. DunnDuane StuckyLucas Dale CraterVirginia L. CooperMark KolazDeanna S. MoolJohn Anthony CharlesDeborah Jean NelsonKimberly A. LabonteTina Jo Galik
Eastern Illinois UniversityWilliam L. PerryBlair M. LordRobert K. MartinSheila D. BakerDaniel P. NadlerMahyar IzadiW Harold OrnesMary C. Herrington-PerryMelody L. WollanTodd E. Garner
Chicago State UniversityMiriam A. Mobley SmithWayne D. WatsonAngela M. HendersonDerrick K. CollinsPatrick B. CageElmer J. GentryCarmita A. ColemanLeslie K. RoundtreeRenee D. MitchellRonnie Watson
University of Illinois at SpringfieldRonald D. McNeilJeffrey D. LorberSusan J. KochDavid P. RacineVickie S. CookClarice Renee FordGerard L. JosephJohnathon Mark WrightonFarokh EslahiDavid T. Barrows
PresidentVice PresidentVice PresidentSenior OfficerUnit DirectorSenior OfficerSenior OfficerUnit DirectorVice PresidentVice PresidentAverage
ChancellorSenior OfficerVice ChancellorOther AdministratorSenior OfficerSenior OfficerSenior OfficerOther AdministratorOther AdministratorOther AdministratorAverage
PresidentVice PresidentVice PresidentUnit DirectorUnit DirectorUnit DirectorUnit DirectorVice PresidentSenior OfficerOther AdministratorAverage
Senior OfficerPresidentVice PresidentSenior OfficerVice PresidentOther AdministratorOther AdministratorSenior OfficerSenior OfficerSenior OfficerAverage
Senior OfficerSenior OfficerVice PresidentSenior OfficerUnit DirectorVice ChancellorOther AdministratorSenior OfficerOther AdministratorUnit DirectorAverage
$270,528$183,960$179,173$177,360$176,828$175,620$163,944$158,364$158,364$157,380$180,152
$430,000$244,269$175,000$143,480$139,997$131,000$125,000$122,070$118,476$118,452$174,774
$254,326$189,099$182,817$161,778$160,031$159,136$156,554$153,525$153,056$153,000$172,332
$207,096$199,500$192,688$159,132$155,004$153,828$150,000$148,454$144,996$139,413$165,011
$193,900$170,122$154,166$143,500$143,500$140,000$138,375$135,300$133,250$127,243$147,936

18
1Kellie Woodhouse, “Burdened by a Budget Impasse,” Inside Higher Ed (January 7, 2016), https://www.insidehighered.com/news/2016/01/07/universi-ties-left-footing-bill-budget-crisis-looms-illinois.2Illinois Board of Higher Education, Fiscal Year 2017 Higher Education Budget Recommendations, http://www.ibhe.org/Fiscal%20Affairs/PDF/FY17Budget-Book.pdf. 3Ibid.4Illinois State Senate, 99th General Assembly, Illinois Senate Democratic Caucus Investigative Report on Executive Compensation at Illinois HigherEducation Institutions, http://www.illinoissenatedemocrats.com/images/PDFS/2015/Illinois_Higher_Ed_Comp_Report_Final.pdf. 5Ibid.6Senate Democratic Caucus Report. http://www.illinoissenatedemocrats.com/images/PDFS/2015/Illinois_Higher_Ed_Comp_Report_Final.pdf.7Ibid.8Ibid.9Ibid.10Ibid.11Ibid.12Illinois Board of Higher Education, Public University Administrator and Faculty Salary and Benefits Database, http://salarysearch.ibhe.org/. The Institute de-fined administrative positions to include: president, chancellor, vice president, vice chancellor, senior officer, unit director and other administrator. Top administrative positions are defined as president, chancellor, vice president, vice chancellor and senior officer.13Illinois Senate Democratic Caucus Report, http://www.illinoissenatedemo-crats.com/images/PDFS/2015/Illinois_Higher_Ed_Comp_Report_Final.pdf.14Ibid.15Approximate expected life expectancy based on Social Security Administration 2011 actuarial life table, https://www.ssa.gov/oact/STATS/table4c6.html.16Ibid.17Illinois Department of Insurance, Biennial Pension Reports (2015, 2005), http://insurance2.illinois.gov/Reports/Pension/pension_biennial_report_2015.pdf, http://insurance2.illinois.gov/Reports/Pension/pension_biennial_re-port_2005.pdf.18See Appendix A. State spending on higher education includes state appropria-tions to university pensions, pension obligation bonds and health care costs, and other general-fund appropriations. 19Commission on Government Forecasting and Accountability, Report on the Financial Condition of the State Retirement Systems FY 2014 (February 2015).20See Appendix A.21Ben VanMetre, “Record Number of Illinois Government Workers Opt Out of Pensions , into 401k-Style Plans,” Illinois Policy Institute, September 3, 2014, https://www.illinoispolicy.org/record-number-of-illinois-government-workers-opt-out-of-pensions-into-401k-style-plans/.22Illinois Board of Higher Education, http://www.ibhe.org/Fiscal%20Affairs/PDF/FY17BudgetBook.pdf.23Commission on Government Forecasting and Accountability, Report on the Financial Condition of the State Retirement Systems FY 2014 (February 2015), http://cgfa.ilga.gov/Upload/.
ENDNOTES
19
FinConditionILStateRetirementSysFeb2015.pdf.24Commission on Government Forecasting and Accountability, FY 2013 IL State Employees Group Insurance Program GASB No. 43 Actuarial Valuation, http://cgfa.ilga.gov/Upload/SEGIP_GASB45_2013_Final.pdf.25FOIA data directly from ISBE, Commission on Government Forecasting and Accountability, FY 2013 IL College Insurance Program GASB No. 43 Actuarial Valuation, http://cgfa.ilga.gov/Upload/CIP_GASB45_2013_Final.pdf.

20
GUARANTEE OF QUALITY SCHOLARSHIP
The Illinois Policy Institute is committed to delivering the highest quality and most reliable research on matters of public policy.
The Institute guarantees that all original factual data (including studies, viewpoints, reports, brochures and videos) are true and correct, and that information attributed to other sources is accurately represented.
The Institute encourages rigorous critique of its research. If the accuracy of any material fact or reference to an independent source is questioned and brought to the Institute’s attention in writing with supporting evidence, the Institute will respond. If an error exists, it will be corrected in subsequent distributions. This constitutes the complete and final remedy under this guarantee.