people mover on board survey crg research31006 · crg research, a division of ... 520 43.9% | ......
TRANSCRIPT

P e o p l e M o v e r
O n B o a r d S u r v e y
A R e s e a r c h R e p o r t
P r e p a r e d B y
D e c e m b e r 3 0 , 2 0 0 5
Contacts Jean Craciun
President/CEO CRG Research
Email { HYPERLINK "mailto:[email protected]" }
Anchorage, Alaska Offices CRG Research
880 H Street, Suite 208 Anchorage, Alaska 99501
(907) 279-3982
Seattle, WA Washington, DC
People Mover On Board Survey CRG Research December 2005 {PAGE }
Introduction..................................................................................................... 3
Methodology................................................................................................... 5
Research Findings........................................................................................... 7
I. Ratings of the People Mover.............................................................. 7
II. Details of Bus Trips ....................................................................... 10
III. Characteristics of Riders................................................................. 16
IV. Employment of Riders ................................................................... 26
Appendices.................................................................................................... 33
Appendix A: Survey Instrument.......................................................... 33
Appendix B: Crosstabulations by Demographic Questions ................ 36
Appendix C: Crosstabulations by Route Number ............................... 47
Copyright © 2005, Craciun Research Group, Inc. All rights reserved.
People Mover On Board Survey CRG Research December 2005 {PAGE }
BACKGROUND & PURPOSE CRG Research, a Division of Craciun Research Group, Inc. (CRG) was hired to assist People Mover to conduct research with Anchorage People Mover riders to explore and determine:
Opinions and attitudes of riders regarding the People Mover system and related services
Current rider satisfaction levels in key areas of performance
Unfulfilled needs and areas for improvement
The management of People Mover plan to use the research information to help improve customer service including personnel performance and customer service materials (schedules, signage, web site, and handout materials.)
Overall goals were to:
Measure People Mover service levels
Understand current riders to attract new riders to the service
CRG was contracted by People Mover twice in 2003 to conduct research. The study from September 2003 was similar to the current research request with one exception; focus groups were conducted for the 2003 study and were not included in this contract.
CRG is a full-service market research firm with offices in Anchorage, Alaska (June 1989), Washington, DC (April 2003); and we opened the newest facility in Seattle, Washington (September 2005). Our researchers have conducted successful projects in Alaska, nationally, and internationally for more than 25 years. CRG has conducted quantitative and qualitative research and public opinion studies in Alaska since 1979. With its sociological focus, the firm has endeavored to work on the most important issues facing our state including: transportation, economic development, fiscal gap/financial, legal studies, shareholder relations for Native corporations, environmental/rural sanitation, and healthcare. CRG possesses a familiarity and knowledge of our industries, development, politics and public opinion gained from conducting numerous studies in every community throughout the Great State of Alaska.
CRG has the capacity to work efficiently and quickly to meet the needs of People Mover. As Alaska's premier, full-service market research company, CRG has been committed to excellence in research design and analysis.
Project Management
The CRG team, which is both experienced and committed, provided ethical and reliable research in order to meet the on board survey needs of People Mover. Jean Craciun, a Sociologist and CEO/President of CRG, served as Project Director. The CRG Project Manager was Jenny Bell and she provided People Mover with a single point of contact for all scheduling, reporting, submittals, approvals, and issue resolution on this project.

People Mover On Board Survey CRG Research December 2005 {PAGE }
CRG has brought together a team of experts with a variety of backgrounds to provide superior research services. Each of our team members contributed their particular expertise to this study; members of the CRG team have worked together under Ms. Craciun’s leadership for more than 10 years.

People Mover On Board Survey CRG Research December 2005 {PAGE }
RESEARCH METHODOLOGY On Board Survey An on-board survey was conducted by CRG staff from November 1st through November 27, 2005. Trained representatives wearing identifying badges, surveyed the bus routes in a pattern worked out by People Mover personnel to ensure coverage of all routes at representative hours of the day. They provided adult riders1 with a written survey, designed with the help of People Mover personnel. Riders completed as much of the survey as they had time for, and returned it as they finished or left the bus. The interviewer spoke several languages to assist the riders.
Twelve hundred and twenty-one (n=1,221) People Mover riders handed in surveys; although some of those surveys were incomplete. Because there was more time for a respondent to complete surveys on some routes than on others, the results were then weighted to be proportional to the traffic carried by each route. (Table A, below).2
TABLE A: ROUTES SURVEYED +----------+-----------------+-----------------+ | | Unweighted: | Weighted: | +----------+-----------------+-----------------+ |Route: | | | | 1........| 78 6.4% | 54 4.4% | | 2........| 122 10.0% | 89 7.3% | | 3........| 83 6.8% | 131 10.7% | | 7........| 121 9.9% | 147 12.0% | | 8........| 93 7.6% | 64 5.2% | | 9........| 96 7.9% | 74 6.1% | | 13.......| 76 6.2% | 81 6.6% | | 14.......| 16 1.3% | 12 1.0% | | 15.......| 57 4.7% | 56 4.6% | | 36.......| 76 6.2% | 58 4.7% | | 45.......| 133 10.9% | 234 19.2% | | 60.......| 105 8.6% | 79 6.5% | | 75.......| 101 8.3% | 94 7.7% | | 77.......| 27 2.2% | 25 2.0% | | 102......| 37 3.0% | 25 2.0% | | | | | |Total.....| 1221 100.0% | 1221 100.0% | +----------+-----------------+-----------------+
Many riders skipped questions completely, or gave answers clearly indicating they had not understood the question or had not followed directions.
When questionnaires were incomplete the answers were eliminated from the results, yielding a different total on each table, in the range from 1000 to 1220.
1 Researchers are not allowed to survey minors under eighteen. Although an effort was made to give surveys only to adults, inevitably, some younger riders (6%) filled in the forms. 2 Statistical weighting counts the answer of each interviewee as more or less than one depending on whether fewer surveys than needed were turned in on a given route (each survey counts for more than one) or more than needed were turned in on another route (each survey counts for less than one).

People Mover On Board Survey CRG Research December 2005 {PAGE }
The probability is 19 out of 20, for the overall sample sizes of 1000 to 1220 that, if researchers had sought to interview every rider using the same questionnaire, the findings would differ from these overall survey results by no more than 3 percentage points in either direction. Thus, the margin of error is +/- 3%. For the smaller group of riders who work outside their homes, about 600, the margin of error is about +/- 4%.
The sampling error is not the only way in which survey findings may vary from the findings that would result from talking to every rider. This survey research is susceptible to human and mechanical errors such as misreading of the questions by riders and recording and data handling errors. However, the standardized procedures used by CRG eliminate such errors associated with paper and pencil methods; thus keeping the human error potential to a minimum.
The Analysis Members of the CRG Research team, employing SPSS3, analyzed the sample. The primary analysis procedures reported are frequencies and crosstabulations.
Notes to Readers Included in the presentation of each question is a summary or example of any significant findings, followed by relevant tables. All percentages in the narrative are rounded to the nearest whole percentage point.
Crosstabulations describe data that may be related in some way. In many crosstabulations, categories are combined or omitted because the numbers are too small to be statistically significant. This manipulation may change the totals on which percentages are based, but does not affect the relationships between percentages.
Crosstabulations may be used to indicate differences (or lack of differences) between subgroups of people. When a lack of difference is being shown, a footnote is appended to the table indicating that the differences are not “statistically significant”.4
As explained above, the survey results are statistically weighted. Weighting causes small inconsistencies in numbers. In other words, columns of numbers or percentages may appear not to “add up.”
3 Trademark registered. 4 Statistical significance is determined by using a chi-square test with a significance factor of less than .05. The chi- square test is used by researchers to determine whether a result may be due to random variation, and is sensitive to sample size, since large random variation may occur in small samples.

People Mover On Board Survey CRG Research December 2005 {PAGE }
I. RATINGS OF THE PEOPLE MOVER
Question: How do you think the People Mover is doing in the following areas – very
good, good, okay, poor or very poor? Keeping the bus clean Providing good drivers who are friendly and helpful Providing dependable, service, on time to no more than 5 minutes late Providing information on how to use the People Mover Providing customer service agents who know the answers and are polite Keeping the bus stops and transit centers clean Three quarters or more of the respondents rated the People Mover “good” or “very good” on all but one of the categories offered -- the exception is providing dependable, service, on time to no more than 5 minutes late (57%.)
Table A1.2 provides the answers in detail and Chart A1 compares the answers to the 2003 survey.
TABLE A1.1 RATINGS OF THE PEOPLE MOVER +----------------------------------------------+--------+--------+--------+--------+ | | Very | Okay | Poor, | Number | | | good, | | very | | | | good | | poor | | +----------------------------------------------+--------+--------+--------+--------+ | Buses clean..................................| 82.8% | 15.7% | 1.5% | 1210 | | | | | | | | Information on how to use service............| 79.1% | 15.9% | 5.0% | 1186 | | | | | | | | Good drivers, friendly & helpful.............| 77.8% | 17.0% | 5.2% | 1210 | | | | | | | | Customer Service agents knowledge & courtesy.| 77.5% | 17.9% | 4.7% | 1129 | | | | | | | | Bus stops & transit centers clean:...........| 76.8% | 18.3% | 5.0% | 1203 | | | | | | | | Dependable service, on time within 5 min.....| 57.0% | 30.5% | 12.5% | 1209 | +----------------------------------------------+--------+--------+--------+--------+ Percentages are of each row.

People Mover On Board Survey CRG Research December 2005 {PAGE }
TABLE A1.2 DETAILED TABLE OF THE RATINGS OF THE PEOPLE MOVER
+----------------------------------------+-----------------+ | | | +----------------------------------------+-----------------+ |Good drivers, friendly & helpful | | | Very good..............................| 535 44.3% | | Good...................................| 406 33.6% | | Okay...................................| 206 17.0% | | Poor...................................| 42 3.5% | | Very poor..............................| 21 1.7% | | | | |Total...................................| 1210 100.0% | +----------------------------------------+-----------------+ |Customer Service agents knowledge & | | | courtesy | | | Very good..............................| 497 44.1% | | Good...................................| 377 33.4% | | Okay...................................| 201 17.9% | | Poor...................................| 31 2.7% | | Very poor..............................| 22 2.0% | | | | |Total...................................| 1129 100.0% | +----------------------------------------+-----------------+ |Buses clean | | | Very good..............................| 531 43.9% | | Good...................................| 471 39.0% | | Okay...................................| 190 15.7% | | Poor...................................| 13 1.1% | | Very poor..............................| 4 .4% | | | | |Total...................................| 1210 100.0% | +----------------------------------------+-----------------+ |Information on how to use service | | | Very good..............................| 520 43.9% | | Good...................................| 418 35.2% | | Okay...................................| 189 15.9% | | Poor...................................| 41 3.4% | | Very poor..............................| 18 1.6% | | | | |Total...................................| 1186 100.0% | +----------------------------------------+-----------------+ |Bus stops & transit centers clean: | | | Very good..............................| 441 36.6% | | Good...................................| 483 40.1% | | Okay...................................| 220 18.3% | | Poor...................................| 39 3.2% | | Very poor..............................| 21 1.8% | | | | |Total...................................| 1203 100.0% | +----------------------------------------+-----------------+ |Dependable service, on time within 5 | | | minutes | | | Very good..............................| 296 24.5% | | Good...................................| 394 32.6% | | Okay...................................| 368 30.5% | | Poor...................................| 106 8.8% | | Very poor..............................| 45 3.7% | | | | |Total...................................| 1209 100.0% | +----------------------------------------+-----------------+

People Mover On Board Survey CRG Research December 2005 {PAGE }
Comparison to the 2003 study is questionable because of the different methodologies. In 2003, four hundred riders were interviewed, while this, larger, survey was self administered. However, it is interesting to note the increase in “very good” responses in 2005. The question of dependability is given here, although the wording differed significantly. In 2003 it was asked only as “providing consistent, dependable service” while in 2005 it was asked as “providing dependable service on time to no more than five minutes late.” CHART A1: RATINGS OF THE PEOPLE MOVER, 2003 & 2005
25%
34%
37%
27%
44%
39%
44%
34%
44%
45%
44%
34%
33%
46%
40%
48%
35%
43%
33%
48%
34%
35%
39%
50%
31%
16%
18%
20%
16%
14%
18%
13%
17%
17%
16%
13%
0% 10% 20% 30% 40% 50% 60% 70% 80% 90% 100%
2005
On-time Service
2003
Dependable Service
2005
2003
Clean Stops & Center
2005
2003
Information on Use
2005
2003
Customer Service
2005
2003
Good, Friendly Drivers
2005
2003
Clean Buses
Very good Good Okay

People Mover On Board Survey CRG Research December 2005 {PAGE }
II DETAILS OF BUS TRIPS
Question: Where are you coming from on this bus trip? Work A doctor’s office or hospital Home A mall or other shopping School, college Visiting a friend or relative A social service agency Some entertainment Other Question: Where are you going to? (same categories) Forty-eight percent of the riders surveyed were traveling from home and 32% were traveling to home. Eighteen percent were coming from work and 20% were going to work. Some volunteered that they were going or coming from places like the bank, the library or to find a job. Some said they were both coming from and going to the same place. (Please see Table B1.1 on the next page.) Table B1.2 on the next page combines the people coming from each set of points with the people going to those points. Combining the tables eliminates the duplication that occurs when a respondent reported going to and coming from the same location, as happened occasionally. It shows that 74% of the riders were either coming from home or going there, or both. Thirty three percent were coming from or going to work or both, as when riders hold more than one job.5 The measures in this second table combine errands like banking, job searching, or going to the library, with shopping to form a single category. Similarly, entertainment, dining, church and visiting were combined into one category.
5 Because some people were both coming and going from the same type of destination, the tables do not necessarily “add up.” For example 214 people were coming from work and 206 were going to work, a total of 420, but because 22 riders were doing both, Table A1.2 shows 398 whose destination and/or origin was work.

People Mover On Board Survey CRG Research December 2005 {PAGE }
TABLE B1.1 ORIGIN AND DESTINATION OF THE TRIPS6 +----------------------------------------+-----------------+ | | | +----------------------------------------+-----------------+ |Trip origin: | | | Home...................................| 565 48.4% | | Work...................................| 214 18.3% | | Mall, shopping.........................| 95 8.1% | | Visiting...............................| 78 6.7% | | School, college........................| 55 4.7% | | Medical appointment....................| 55 4.7% | | A social service agency................| 43 3.7% | | Entertainment, dining..................| 26 2.2% | | Job search.............................| 9 .8% | | Transit, Downtown......................| 9 .8% | | Gym, vet, library, personal services...| 7 .6% | | A hotel................................| 5 .5% | | Church.................................| 4 .3% | | Bank, court, private business..........| 2 .2% | | Volunteering...........................| 1 .1% | | | | |Total...................................| 1168 100.0% | +----------------------------------------+-----------------+ |Trip destination: | | | Home...................................| 340 32.2% | | Work...................................| 206 19.6% | | Mall, shopping.........................| 157 14.8% | | Visiting...............................| 103 9.7% | | Medical appointment....................| 65 6.2% | | Entertainment, dining..................| 52 4.9% | | School, college........................| 47 4.5% | | A social service agency................| 39 3.7% | | Gym, vet, library, personal services...| 14 1.4% | | Bank, court, private business..........| 14 1.3% | | Job search.............................| 8 .8% | | Church.................................| 4 .3% | | Transit, Downtown......................| 3 .3% | | Volunteering...........................| 2 .2% | | A hotel................................| 1 .1% | | | | |Total...................................| 1055 100.0% | +----------------------------------------+-----------------+
TABLE B1.2 ORIGIN AND DESTINATION OF THE TRIPS, COMBINED +------------------------------------+-------------+ | |Each location| | | was the | | |origin and/or| | | destination | | | of: | +------------------------------------+-------------+ | Home...............................| 884 73.8% | | | | | Work...............................| 398 33.3% | | | | | Shopping, errands..................| 294 24.5% | | | | | Visiting, church, entertainment....| 248 20.7% | | | | | Doctor, hospital...................| 119 10.0% | | | | | School, college....................| 102 8.5% | +------------------------------------+-------------+ Percentages are based on 1197 answers; with one or the other or both questions.
6 Many riders skipped questions completely, or gave answers clearly indicating they had not understood the question or had not followed directions. These answers were eliminated from the results, yielding a different total on each table, in the range from 1000 to 1220.

People Mover On Board Survey CRG Research December 2005 {PAGE }
Question: How many times, if any, do you have to change buses on this trip? Question: If you have to change, how many minutes do you wait between buses? Most people (60%) said they had to transfer on the trip, 15% had to change more than twice.7 Nineteen percent had to wait five minutes or less; seventy-two percent no more than twenty minutes.8 TABLE B2.1 TRANSFERRING ON THE CURRENT TRIP +------------------------------+-----------------+ | | | +------------------------------+-----------------+ |Changed buses: | | | Not at all...................| 436 39.7% | | Once.........................| 200 18.2% | | Twice........................| 298 27.1% | | Three times..................| 87 7.9% | | Four or more times...........| 79 7.2% | | | | |Total.........................| 1100 100.0% | +------------------------------+-----------------+ |Wait between buses: | | | 5 min. or less...............| 104 18.9% | | 6 to 10 min..................| 115 20.9% | | 11 to 15 min.................| 94 17.1% | | 16 to 20 min.................| 82 14.8% | | 21 to 30 min.................| 102 18.4% | | 31 min. to 1 hr..............| 51 9.3% | | More than 1 hr...............| 3 .5% | | | | |Total.........................| 551 100.0% | +------------------------------+-----------------+
7 Some people may have not confined their answers to the current trip. 8 It should be noted that, if the transfer had not yet happened, the respondent had to estimate waiting time.

People Mover On Board Survey CRG Research December 2005 {PAGE }
Although there is a correlation between the waiting time and the number of transfers involved, with the total waiting time increasing with the number of transfers, it is by no means a perfect correlation. TABLE B2.2 WAITING TIME AND THE NUMBER OF TRANSFERS +----------------------+-----------------------------------+--------+ | | Changed buses: | Total | | +--------+--------+--------+--------+ | | | Once | Twice | Three | Four or| | | | | | times | more | | +----------------------+--------+--------+--------+--------+--------+ |Wait between buses: | | | | | | | 5 min. or less.......| 28.4% | 13.9% | 20.0% | 13.9% | 18.9% | | 6 to 10 min..........| 24.0% | 21.0% | 13.8% | 21.6% | 20.9% | | 11 to 15 min.........| 16.2% | 18.3% | 17.6% | 13.2% | 17.1% | | 16 to 20 min.........| 11.4% | 17.1% | 15.9% | 12.8% | 14.8% | | 21 to 30 min.........| 12.8% | 20.8% | 18.9% | 22.6% | 18.4% | | 31 min. to 1 hr......| 6.5% | 8.2% | 13.8% | 15.9% | 9.3% | | More than 1 hr.......| .8% | .7% | | | .5% | | | | | | | | |Number................| 159 | 256 | 77 | 59 | 551 | +----------------------+--------+--------+--------+--------+--------+ Column percentages

People Mover On Board Survey CRG Research December 2005 {PAGE }
Question: From door to door, including time to get to the bus stop, waiting, time on the bus, and time to walk to where you are going, how long does the trip take? Question: How long would it take by car, including parking and walking, to where you are going? The average time that was estimated by the riders for the current bus trip, including walking and waiting time, was 41.9 minutes, and the median is 30 minutes. The average time estimated to make the same trip using a private vehicle, including parking time, is 21.7 minutes, with a median of 20 minutes.9 TABLE B3.1 TIME REQUIRED FOR THE CURRENT TRIP BY BUS AND BY CAR +------------------------------+-----------------+ | | | +------------------------------+-----------------+ |Bus trip will take: | | | 10 or fewer..................| 122 11.2% | | 11 thru 15...................| 99 9.1% | | 16 thru 20...................| 128 11.7% | | 21 thru 25...................| 40 3.7% | | 26 thru 30...................| 157 14.4% | | 31 thru 40...................| 89 8.2% | | 41 thru 50...................| 175 16.0% | | 51 thru 60...................| 135 12.4% | | 61 thru 100..................| 88 8.0% | | 101 thru 120.................| 39 3.5% | | Longer.......................| 20 1.9% | | | | |Total.........................| 1092 100.0% | +------------------------------+-----------------+ |Same trip by car would take: | | | 10 or fewer..................| 231 21.6% | | 11 thru 15...................| 219 20.5% | | 16 thru 20...................| 245 23.0% | | 21 thru 25...................| 63 5.9% | | 26 thru 30...................| 172 16.1% | | 31 thru 40...................| 58 5.4% | | 41 thru 50...................| 43 4.0% | | 51 thru 60...................| 33 3.1% | | 61 thru 100..................| 3 .3% | | | | |Total.........................| 1067 100.0% | +------------------------------+-----------------+
9 A caution regarding this question: as will be shown in a later table, many of the respondents owned no vehicles and/or didn’t drive, so some of these estimates may be fanciful.
People Mover On Board Survey CRG Research December 2005 {PAGE }
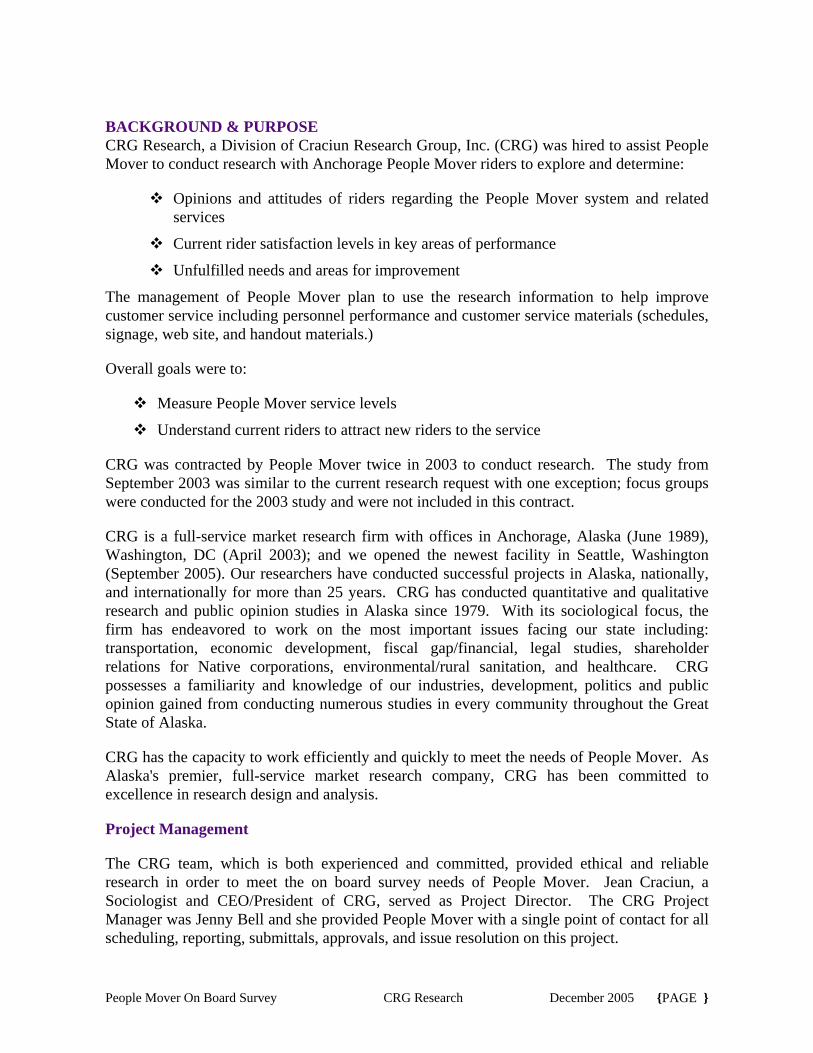
Most (76%) of the respondents believed that the trip would be shorter if they used a private vehicle, while 15% believed the opposite – that the bus is quicker. TABLE B3.2 COMPARATIVE TIMES +----------------------------------------+-----------------+ | | | +----------------------------------------+-----------------+ |Comparative times: | | | Bus trip takes less time than driving..| 154 15.3% | | They take the same time................| 92 9.1% | | Bus trip takes more time...............| 758 75.5% | | | | |Total...................................| 1004 100.0% | +----------------------------------------+-----------------+

People Mover On Board Survey CRG Research December 2005 {PAGE }
III. CHARACTERISTICS OF RIDERS
Question: How many days per week do you usually ride the People Mover? Question: What year did you start using People Mover buses as often as you do now?
Seven in ten (70%) of the people polled are regular customers, riding at least five days per week, including a third (36%) who ride the people mover seven days a week and another third (34%) who ride five or six days a week. An effort to persuade the 11% who ride once or twice a month to ride more often would increase ridership.10 TABLE C1.1 FREQUENCY OF RIDERSHIP +------------------------------------+-----------------+ | | | +------------------------------------+-----------------+ |Usually rides the bus: | | | Seven days a week..................| 428 35.5% | | | | | Five or six days | | | Six days.........................| 170 14.1% | | Five days........................| 244 20.3% | | | ___ _____ | | Subtotal, Five or six days.......| 414 34.3% | | | | | Three or four days | | | Four days........................| 110 9.2% | | Three days.......................| 104 8.6% | | | ___ _____ | | | | | Subtotal, Three or four days.....| 214 17.8% | | | | | Once, twice or monthly | | | Twice a week.....................| 72 6.0% | | Once a week......................| 26 2.2% | | 1 to 3 days a month..............| 31 2.6% | | | ___ _____ | | Subtotal, Once, twice, monthly...| 129 10.7% | | | | | Rarely, first time | | | Less than once a month...........| 11 .9% | | The first time...................| 10 .8% | | | ___ _____ | | Subtotal, Other rural Alaska.....| 21 1.7% | | | | |Total Respondents...................| 1206 100.0% | +------------------------------------+-----------------+
10 A similar question, asked in 2003, could not be compared because of a difference in the wording.

People Mover On Board Survey CRG Research December 2005 {PAGE }
Sixty-one percent of the riders began riding the People Mover as frequently as they do now in the last six years, since 2000. Note that a few respondents have been riding buses, if not the People Mover, for a very long time. TABLE C1.2 LENGTH OF RIDERSHIP +------------------------------------+-----------------+ | | | +------------------------------------+-----------------+ |Year: | | | Before 1990 | | | 1920..............................| 1 .1% | | 1924..............................| 1 .1% | | 1950..............................| 2 .2% | | 1960..............................| 4 .3% | | 1964..............................| 2 .2% | | 1968..............................| 1 .1% | | 1969..............................| 1 .1% | | 1970..............................| 5 .4% | | 1971..............................| 2 .2% | | 1972..............................| 1 .1% | | 1973..............................| 1 .1% | | 1974..............................| 1 .1% | | 1975..............................| 5 .5% | | 1976..............................| 9 .8% | | 1977..............................| 5 .5% | | 1978..............................| 4 .3% | | 1979..............................| 6 .6% | | 1980..............................| 38 3.4% | | 1981..............................| 3 .2% | | 1982..............................| 5 .5% | | 1983..............................| 6 .5% | | 1984..............................| 8 .7% | | 1985..............................| 24 2.1% | | 1986..............................| 7 .6% | | 1987..............................| 7 .7% | | 1988..............................| 12 1.1% | | 1989..............................| 23 2.0% | | | ___ _____ | | Subtotal, Before 1990............| 184 16.4% | | | | | 1990 thru 1999 | | | 1990..............................| 27 2.4% | | 1991..............................| 11 1.0% | | 1992..............................| 26 2.3% | | 1993..............................| 21 1.9% | | 1994..............................| 17 1.5% | | 1995..............................| 32 2.9% | | 1996..............................| 22 2.0% | | 1997..............................| 18 1.6% | | 1998..............................| 36 3.3% | | 1999..............................| 40 3.6% | | | ___ _____ | | Subtotal, 1990 thru 1999.........| 250 22.5% | | | | | 2000 thru 2005 | | | 2000..............................| 101 9.2% | | 2001..............................| 76 6.9% | | 2002..............................| 68 6.1% | | 2003..............................| 112 10.1% | | 2004..............................| 105 9.5% | | 2005..............................| 214 19.3% | | | ___ _____ | | Subtotal, 2000 thru 2005.........| 676 61.1% | | | | |Total Respondents...................| 1110 100.0% | +------------------------------------+-----------------+
People Mover On Board Survey CRG Research December 2005 {PAGE }
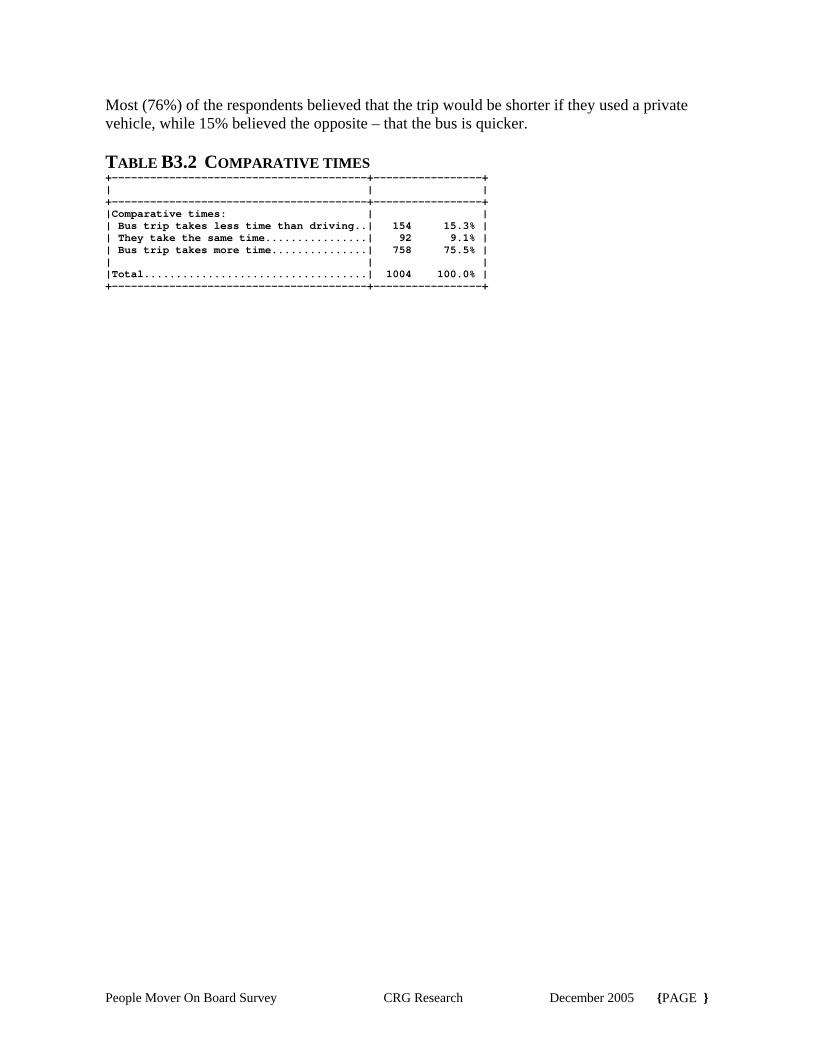
Asking current riders when they started riding, doesn’t take into account any who started and then dropped out. Nevertheless, there appears to have been a precipitous jump in new riders in 2005. CHART C1. NUMBER OF RIDERS STARTING EACH YEAR SINCE 1998
36 40
10176 68
112 105
214
0
50
100
150
200
250
1998 1999 2000 2001 2002 2003 2004 2005
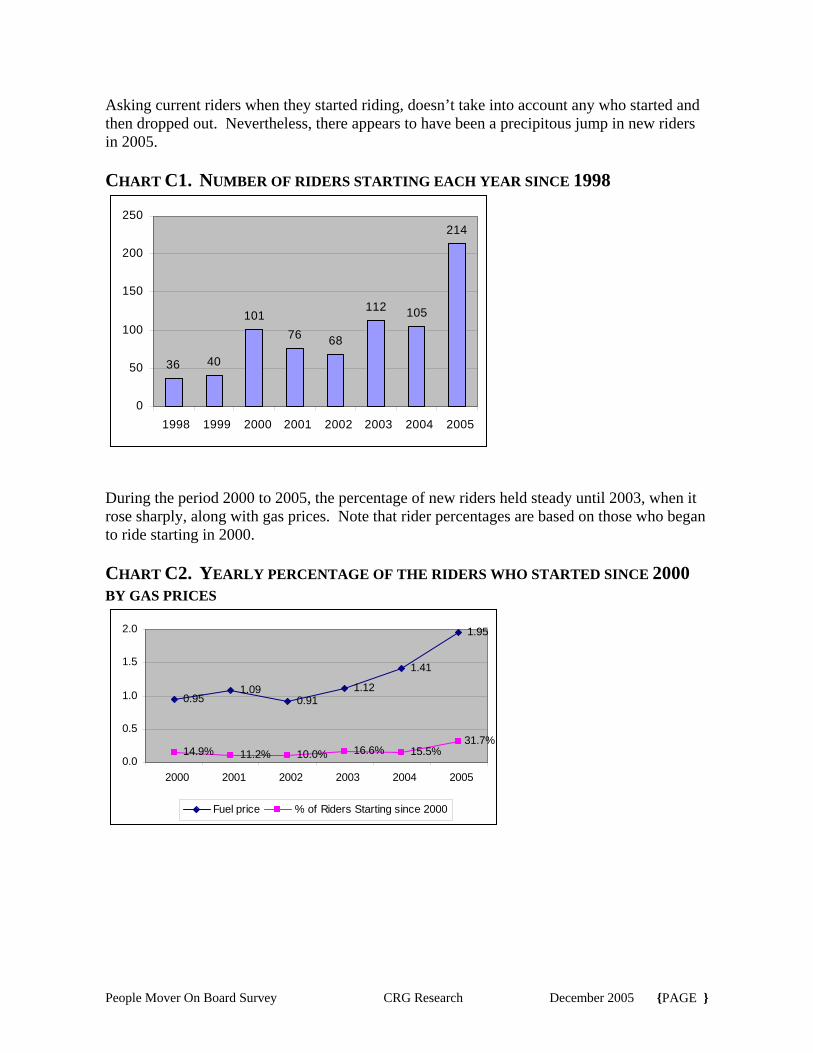
During the period 2000 to 2005, the percentage of new riders held steady until 2003, when it rose sharply, along with gas prices. Note that rider percentages are based on those who began to ride starting in 2000. CHART C2. YEARLY PERCENTAGE OF THE RIDERS WHO STARTED SINCE 2000 BY GAS PRICES
0.951.09
0.911.12
1.41
1.95
14.9% 11.2% 10.0% 16.6% 15.5%31.7%
0.0
0.5
1.0
1.5
2.0
2000 2001 2002 2003 2004 2005
Fuel price % of Riders Starting since 2000

People Mover On Board Survey CRG Research December 2005 {PAGE }
Question: Are fuel costs one of the reasons you decided to ride the bus more often? Thirty-eight percent of the respondents said fuel costs were one of the reasons they decided to ride the bus. TABLE C2.1 FUEL COSTS AS A REASON FOR RIDING THE BUS +--------------------------------------+-----------------+ | | | +--------------------------------------+-----------------+ |Fuel costs are: | | | One reason for riding the bus........| 441 38.4% | | Are not..............................| 709 61.6% | | | | |Total.................................| 1150 100.0% | +--------------------------------------+-----------------+
Rising fuel costs were one reason to begin riding for 56% of those who started in 2003.
TABLE C2.2 FUEL COSTS AS A REASON FOR RIDING THE BUS BY THE YEAR RESPONDENT STARTED RIDING +-----------------------+-----------------------------------------------+-------+ | | Started riding in: | Total | | +-------+-------+-------+-------+-------+-------+ | | | 2000 | 2001 | 2002 | 2003 | 2004 | 2005 | | +-----------------------+-------+-------+-------+-------+-------+-------+-------+ |Fuel costs are: | | | | | | | | | One reason for riding | | | | | | | | | the bus.............| 37.6% | 34.0% | 35.0% | 56.1% | 33.4% | 35.4% | 38.8% | | Are not...............| 62.4% | 66.0% | 65.0% | 43.9% | 66.6% | 64.6% | 61.2% | | | | | | | | | | |Number.................| 93 | 73 | 66 | 111 | 101 | 209 | 653 | +-----------------------+-------+-------+-------+-------+-------+-------+-------+ Column percentages

People Mover On Board Survey CRG Research December 2005 {PAGE }
Question: Where do you get most of your bus related information? Ride Guide Ride Line Transit center & Bus Stops Driver Website Friends or relatives Other More than half (55%) of the riders get most bus-related information from the Ride Guide, and a third (33%) get most from the Transit Center and bus stops. Other sources are less important.11 The percentages may overlap, since many riders gave more than one answer. TABLE C3.1 SOURCES OF BUS-RELATED INFORMATION +-------------------------------+-----------------+ | | | +-------------------------------+-----------------+ | | | | Ride Guide....................| 657 55.0% | | Transit Center & Bus Stops....| 395 33.1% | | Driver........................| 193 16.2% | | Website.......................| 136 11.4% | | Ride line.....................| 131 11.0% | | Friends or Family.............| 120 10.1% | | Figured out for myself........| 6 .5% | | The media.....................| 5 .4% | | Customer service, telephone...| 3 .3% | | The phone book................| 3 .2% | | Travel trainer................| 1 .1% | | Covenant house................| 1 .1% | | Strangers.....................| 1 .1% | | | | |Total Respondents..............| 1194 | +-------------------------------+-----------------+ Percentages add to more than 100% because many respondents gave more than one response.
11 Although the question asked where the respondents got “most” of their information, about a quarter of the respondents gave more than one answer.

People Mover On Board Survey CRG Research December 2005 {PAGE }
The percentage of riders getting their information from the Ride Guide or from drivers has dropped slightly since 2003, while the percentage getting information from the website or Ride Line has risen proportionately. CHART C3 SOURCES OF BUS-RELATED INFORMATION COMPARED TO 2003
33%
10%
5%
11%
3%
11%
3%
16%
20%
55%
59%
0% 20% 40% 60% 80% 100%
2005
Transit Center & Bus Stops
2003
Bus Stops
2003
Transit Center
2005
2003
Ride Line
2005
2003
Website
2005
2003
Driver
2005
2003
Ride Guide

People Mover On Board Survey CRG Research December 2005 {PAGE }
Question: How many cars or other vehicles are available for you to use? Question: How many licensed drivers are in your household? Sixty-one percent of these riders do not have a car or other vehicle available to them, but 66% of their households do have at least one licensed drivers. TABLE C4.1 HOUSEHOLD VEHICLES AND LICENSED DRIVERS +----------------------------------+-----------------+ | | | +----------------------------------+-----------------+ |Vehicles available: | | | None.............................| 722 61.1% | | One..............................| 304 25.7% | | Two..............................| 112 9.5% | | Three............................| 24 2.0% | | Four or more.....................| 19 1.7% | | | | |Total.............................| 1181 100.0% | +----------------------------------+-----------------+ |Licensed drivers in household: | | | None.............................| 407 34.3% | | One..............................| 430 36.3% | | Two..............................| 238 20.1% | | Three............................| 71 6.0% | | Four or more.....................| 40 3.4% | | | | |Total.............................| 1186 100.0% | +----------------------------------+-----------------+

People Mover On Board Survey CRG Research December 2005 {PAGE }
Question: Are you male or female? Question: What is your age? Questions: Do you consider yourself Hispanic or Latin? Which [ethnicity] do you consider yourself? Question: Roughly, what is your household income each year? Fifty-seven percent of the riders are male, and 63% report ethnic backgrounds, at least partly, to one minority group in the city or another. The average age is 38.7 years; the youngest respondent was eleven and the oldest eighty-four; median income is $13,670. Researchers are not allowed to administer surveys to people under eighteen. Our interviewers did not distribute surveys to obvious minors, but inevitably some surveys were completed by young people. Please see the table on the next page.

People Mover On Board Survey CRG Research December 2005 {PAGE }
TABLE C5.1 DEMOGRAPHICS OF THE SAMPLE +--------------------------+-----------------+ | | | +--------------------------+-----------------+ |Gender: | | | Male.....................| 682 57.4% | | Female...................| 506 42.6% | | | | |Total.....................| 1188 100.0% | +--------------------------+-----------------+ |Age: | | | Under 18.................| 72 6.4% | | 18 to 24.................| 177 15.6% | | 25 to 34.................| 168 14.8% | | 35 to 44.................| 286 25.1% | | 45 to 54.................| 260 22.9% | | 55 to 64.................| 122 10.8% | | 65 to 84.................| 51 4.5% | | | | |Total.....................| 1136 100.0% | +--------------------------+-----------------+ |Ethnicity: | | | African American.........| 125 11.0% | | Alaskan Native...........| 380 33.4% | | Native American, Indian..| 63 5.5% | | Asian/Pacific Islander...| 33 2.9% | | Hispanic, Latin..........| 53 4.7% | | Mixed Minorities *.......| 19 1.7% | | Minority & White *.......| 49 4.3% | | White....................| 417 36.6% | | | | |Total.....................| 1139 100.0% | +--------------------------+-----------------+ |Income: | | | Less than $10,000........| 406 37.3% | | $10,000 to $14,999.......| 189 17.3% | | $15,000 to $19,999.......| 138 12.6% | | $20,000 to $24,999.......| 92 8.4% | | $25,000 to $34,999.......| 108 9.9% | | $35,000 to $49,000.......| 68 6.2% | | $50,000 to $74,999.......| 50 4.6% | | $75,000 to $99,000.......| 24 2.2% | | More.....................| 17 1.5% | | | | |Total.....................| 1092 100.0% | +--------------------------+-----------------+ * Includes some Hispanic.

People Mover On Board Survey CRG Research December 2005 {PAGE }
Question: What is your zip code at home? Most (56%) riders live in the North and East parts of the city. Some (4%) gave a post office box number as their zip code. Three percent were visitors to Anchorage who gave out-of-town zip codes. TABLE C6.1 HOME ZIP CODES +------------------------------------+-----------------+ | | | +------------------------------------+-----------------+ |Riders' home zip codes: | | | 99501 Downtown/North...............| 256 23.2% | | 99508 Mt. View/Russian Jack........| 237 21.4% | | 99504 Muldoon......................| 130 11.8% | | | | | 99503 Spenard......................| 106 9.6% | | 99507 Lake Otis....................| 103 9.3% | | 99517 Turnagain....................| 50 4.5% | | 99502 Sand Lake....................| 40 3.6% | | 99518 South Midtown................| 25 2.2% | | 99515 Southwest....................| 22 2.0% | | 99516 Hillside.....................| 6 .6% | | | | | 99505 Ft. Richardson...............| 5 .5% | | 99506 Elmendorf....................| 3 .3% | | 99577 Eagle River..................| 32 2.9% | | 99567 Chugiak......................| 14 1.3% | | | | | Post offices | | | 99510 Downtown Stn...............| 24 2.2% | | 99509 Turnagain Stn..............| 5 .5% | | 99520 Eastchester Stn............| 5 .4% | | 99514 Mountain View Stn..........| 4 .3% | | 99513 West Downtown Stn..........| 3 .3% | | 99523 Lake Otis Stn..............| 2 .1% | | 99511 Huffman Stn................| 2 .1% | | 99512 Russian Jack Stn...........| 1 .1% | | 99521 Muldoon Stn................| 1 .1% | | | ___ ____ | | Subtotal, Post offices...........| 47 4.1% | | | | | 99654 Wasilla......................| 2 .2% | | 99645 Palmer.......................| 1 .1% | | | | | 99587 Girdwood.....................| 1 .1% | | | | | Gave a village zip code............| 28 2.6% | | | | |Total Respondents...................| 1108 100.0% | +------------------------------------+-----------------+

People Mover On Board Survey CRG Research December 2005 {PAGE }
IV. EMPLOYMENT OF RIDERS Question: Are you employed outside your home? Question: How many days a week do you work outside your home? Question: How many hours a week do you work outside your home?
Just over half (56%) of the riders are employed outside the home, most of them full time.12 TABLE D1.1 EMPLOYMENT OUTSIDE THE HOME +------------------------------+-----------------+ | | | +------------------------------+-----------------+ |Employed: | | | 1 to 3 days..................| 82 6.9% | | 5-7 days.....................| 586 49.0% | | Not employed.................| 526 44.1% | | | | |Total.........................| 1194 100.0% | +------------------------------+-----------------+
Riders who work full time (five to seven days a week) ride buses somewhat more often (median 3.8 days per week) than those who are employed part time (median 2.9 days) or those who are not employed outside the home (median 3.4 days). TABLE D1.2 EMPLOYMENT OUTSIDE THE HOME BY
FREQUENCY OF RIDING THE BUS. +--------------------------+-----------------------------+---------+ | | Employed: | Total | | +---------+---------+---------+ | | | 1 to 3 | 5-7 days| Not | | | | days | |employed | | +--------------------------+---------+---------+---------+---------+ |Usually ride bus: | | | | | | Seven times a week.......| 16.3% | 41.9% | 31.6% | 35.6% | | Five or six times........| 30.0% | 38.2% | 30.6% | 34.3% | | Three or four times......| 43.0% | 10.8% | 21.7% | 17.8% | | Once, twice or monthly...| 6.6% | 8.1% | 13.9% | 10.6% | | Rarely, first time... ...| 4.1% | 1.1% | 2.1% | 1.7% | | | | | | | |Number....................| 81 | 583 | 521 | 1185 | +--------------------------+---------+---------+---------+---------+ Column percentages
12 Part time was computed by answers from the questions regarding hours and days worked per week.

People Mover On Board Survey CRG Research December 2005 {PAGE }
The average and the median number of hours worked per week is forty; however 21% work more than forty hours on a regular basis. TABLE D1.3 DAYS AND HOURS WORKED PER WEEK +----------------------------------+-----------------+ | | | +----------------------------------+-----------------+ |Work outside home: | | | One..............................| 23 3.6% | | Two..............................| 21 3.3% | | Three............................| 38 6.1% | | Five.............................| 381 60.2% | | Six..............................| 115 18.2% | | Seven............................| 54 8.6% | | | | |Total.............................| 632 100.0% | +----------------------------------+-----------------+ |Hours worked per week: | | | Fewer than 10....................| 54 8.7% | | 11 thru 19.......................| 26 4.2% | | 20 thru 29.......................| 58 9.3% | | 30 thru 39.......................| 66 10.7% | | 40...............................| 287 46.3% | | 41 thru 49.......................| 44 7.0% | | 50 thru 59.......................| 32 5.2% | | 60 thru 90.......................| 53 8.6% | | | | |Total.............................| 620 100.0% | +----------------------------------+-----------------+

People Mover On Board Survey CRG Research December 2005 {PAGE }
Question: Do you work on Saturday, Sunday and/or weekdays? Question: Most days, what time does your job start? Question: Most days, what time does your job end? Nearly all riders (97%) who are employed outside the home work on at least some weekdays. Fifty percent work on Saturdays and 40% on Sundays. A few of these weekend workers are employed only on weekends.13 Most work weekends in addition to some or all weekdays. In considering this data, it is important to bear in mind that sales and service industry employees often rotate or change days off and/or working hours.
TABLE D2.1: WORK ON WEEKENDS +--------------------------+-----------------+ | | | +--------------------------+-----------------+ | | | | Monday to Friday.........| 624 96.7% | | Saturday.................| 321 49.7% | | Sunday...................| 255 39.5% | | | | |Total Respondents.........| 646 100.0% | +--------------------------+-----------------+ Percentages add to more than 100% because many respondents gave more than one response.
13 Eleven work only on Saturday, three work only on Sunday, and seven work only on Saturday and Sunday.

People Mover On Board Survey CRG Research December 2005 {PAGE }
Starting times for People Mover riders may be almost any time of day, but more than half, 57%, start during the rush hours from 6AM to 9:59 AM. TABLE D2.2: STARTING TIMES +------------------------------------+-----------------+ | | | +------------------------------------+-----------------+ |Starting times: | | | 9:00 PM to 5:59 AM | | | 9:00 PM to 9:59 PM...............| 6 1.0% | | 10:00 PM to 10:59 PM.............| 6 .9% | | 11:00 PM to 11:59 PM.............| 2 .3% | | Midnight to 12:59 AM.............| 5 .7% | | 1:00 AM to 1:59 AM...............| 7 1.1% | | 2:00 AM to 2:59 AM...............| 2 .3% | | 4:00 AM to 4:59 AM...............| 2 .4% | | 5:00 AM to 5:59 AM...............| 17 2.9% | | | ___ _____ | | Subtotal, 9:00 PM to 5:59 AM.....| 47 7.6% | | | | | 6:00 AM to 7:59 AM | | | 6:00 AM to 6:59 AM...............| 36 5.9% | | 7:00 AM to 7:59 AM...............| 101 16.9% | | | ___ _____ | | Subtotal, 6:00 AM to 7:59 AM.....| 137 22.8% | | | | | 8:00 AM to 9:59 AM | | | 8:00 AM to 8:59 AM...............| 134 22.3% | | 9:00 AM to 9:59 AM...............| 72 12.1% | | | ___ _____ | | Subtotal, 8:00 AM to 9:59 AM.....| 206 34.3% | | | | | 10:00 AM to 12:59 PM | | | 10:00 AM to 10:59 AM.............| 57 9.5% | | 11:00 AM to 11:59 AM.............| 27 4.5% | | 12:00 N to 12:59 PM.............| 28 4.7% | | | ___ _____ | | Subtotal, 10:00 AM to 12:59 PM...| 112 18.7% | | | | | 1:00 PM to 8:59 PM | | | 1:00 PM to 1:59 PM...............| 16 2.6% | | 2:00 PM to 2:59 PM...............| 12 2.0% | | 3:00 PM to 3:59 PM...............| 22 3.7% | | 4:00 PM to 4:59 PM...............| 18 2.9% | | 5:00 PM to 5:59 PM...............| 15 2.5% | | 6:00 PM to 6:59 PM...............| 12 2.0% | | 7:00 PM to 7:59 PM...............| 2 .3% | | 8:00 PM to 8:59 PM...............| 3 .6% | | | ___ _____ | | Subtotal, 1:00 PM to 8:59 PM.....| 100 16.6% | | | | |Total Respondents...................| 601 100.0% | +------------------------------------+-----------------+

People Mover On Board Survey CRG Research December 2005 {PAGE }
Most (65%) of the working riders end their workday between 4 PM and 8:59 PM. TABLE D2.3 ENDING TIMES +------------------------------------+-----------------+ | | | +------------------------------------+-----------------+ |Ending times: | | | 1:00 AM to 11:59 AM | | | 1:00 AM to 1:59 AM...............| 7 1.3% | | 2:00 AM to 2:59 AM...............| 7 1.2% | | 3:00 AM to 3:59 AM...............| 4 .7% | | 4:00 AM to 4:59 AM...............| 3 .6% | | 5:00 AM to 5:59 AM...............| 3 .5% | | 6:00 AM to 6:59 AM...............| 8 1.3% | | 7:00 AM to 7:59 AM...............| 3 .4% | | 8:00 AM to 8:59 AM...............| 3 .6% | | 9:00 AM to 9:59 AM...............| 1 .1% | | 10:00 AM to 10:59 AM.............| 1 .1% | | 11:00 AM to 11:59 AM.............| 0 | | | ___ _____ | | Subtotal, 1:00 AM to 11:59 AM....| 40 6.8% | | | | | 12:00 N to 3:59 PM | | | 12:00 N to 12:59 PM..............| 12 2.1% | | 1:00 PM to 1:59 PM...............| 8 1.4% | | 2:00 PM to 2:59 PM...............| 19 3.2% | | 3:00 PM to 3:59 PM...............| 28 4.8% | | | ___ _____ | | Subtotal, 12:00 N to 3:59 AM.....| 67 11.5% | | | | | 4:00 PM to 5:59 PM | | | 4:00 PM to 4:59 PM...............| 94 15.9% | | 5:00 PM to 5:59 PM...............| 146 24.7% | | | ___ _____ | | Subtotal, 4:00 PM to 5:59 AM.....| 240 40.7% | | | | | 6:00 PM to 8:59 PM | | | 6:00 PM to 6:59 PM...............| 83 14.1% | | 7:00 PM to 7:59 PM...............| 34 5.8% | | 8:00 PM to 8:59 PM...............| 25 4.2% | | | ___ _____ | | Subtotal, 6:00 PM to 8:59 PM.....| 142 24.1% | | | | | 9:00 PM to 12:59 AM | | | 9:00 PM to 9:59 PM...............| 36 6.1% | | 10:00 PM to 10:59 PM.............| 24 4.0% | | 11:00 PM to 11:59 PM.............| 24 4.1% | | Midnight to 12:59 AM.............| 15 2.6% | | | ___ _____ | | Subtotal, 9:00 PM to 12:59 AM....| 99 16.9% | | | | |Total Respondents...................| 588 100.0% | +------------------------------------+-----------------+

People Mover On Board Survey CRG Research December 2005 {PAGE }
Question: How many days a week do you take the People Mover to work? Forty-seven percent of respondents say they take the bus to work five days a week. TABLE D3.1 USE OF THE BUS TO GET TO WORK +-------------------------+-----------------+ | | | +-------------------------+-----------------+ |Bus to work: | | | One.....................| 29 5.3% | | Two.....................| 34 6.2% | | Three...................| 53 9.6% | | Five....................| 261 47.3% | | Six.....................| 73 13.3% | | Seven...................| 84 15.2% | | | | | None....................| 17 3.1% | | | | |Total....................| 551 100.0% | +-------------------------+-----------------+
This measure is more meaningful when compared to the number of days a week the riders work. Eighty-three percent of riders, who work five days a week, ride the bus to get there five to seven days a week. The extra days can be explained by the fact that many people work ever-changing shifts and days off. TABLE D3.2 DAYS THE BUS IS USED TO GET TO WORK BY
NUMBER OF DAYS WORKED +-------------+-----------------------------------------------+-------+ | | Work outside home: | Total | | +-------+-------+-------+-------+-------+-------+ | | | One | Two | Three | Five | Six | Seven | | +-------------+-------+-------+-------+-------+-------+-------+-------+ |Bus to work: | | | | | | | | | None........| 5.7% | | | 2.2% | 4.7% | | 2.4% | | One.........| 72.2% | 5.8% | 9.0% | 2.7% | 4.5% | 3.7% | 5.1% | | Two.........| 15.8% | 77.9% | 9.6% | 4.6% | 2.9% | | 6.2% | | Three.......| | 16.3% | 69.5% | 7.3% | 2.9% | 8.0% | 9.8% | | Five........| | | 3.5% | 70.1% | 13.8% | 17.1% | 47.8% | | Six.........| 6.3% | | 2.6% | 3.1% | 55.9% | 4.6% | 13.3% | | Seven.......| | | 6.0% | 10.0% | 15.3% | 66.6% | 15.4% | | | | | | | | | | |Number.......| 12 | 13 | 28 | 334 | 104 | 48 | 539 | +-------------+-------+-------+-------+-------+-------+-------+-------+ Column percentages

People Mover On Board Survey CRG Research December 2005 {PAGE }
Question: Roughly, how much do you earn an hour at this job? The median hourly wage for the riders who are employed outside their homes is $12.26; 86% of them make less than $20 an hour. TABLE D4.1 HOURLY WAGES +-------------------------+-----------------+ | | | +-------------------------+-----------------+ |Hourly wages: | | | Less than $10...........| 241 39.4% | | $10 to $20..............| 288 46.9% | | $21 to $30..............| 54 8.8% | | More....................| 30 4.9% | | | | |Total....................| 613 100.0% | +-------------------------+-----------------+

People Mover On Board Survey CRG Research December 2005 {PAGE }
APPENDIX: A
People Mover Survey This survey will help us plan how to serve you better. Please complete as much of it as you have time for. Be specific as possible. Return it to the CRG representative as you leave the bus. Only fill out this survey one time. Please check all answers that apply and fill in blanks as needed. Thank you for your time and input. 1. Where are you coming from on this trip? 2. Where are you going?
{ FORMCHECKBOX } From work { FORMCHECKBOX } To work { FORMCHECKBOX } From home { FORMCHECKBOX } To home { FORMCHECKBOX } From school, college {
FORMCHECKBOX } To school, college { FORMCHECKBOX } From a social service agency {
FORMCHECKBOX } To a social service agency { FORMCHECKBOX } From doctor’s office, or hospital {
FORMCHECKBOX } To a doctor’s office or hospital { FORMCHECKBOX } From a mall or other shopping {
FORMCHECKBOX } To a mall or other shopping { FORMCHECKBOX } From visiting a friend or relative {
FORMCHECKBOX } To visit a friend or relative { FORMCHECKBOX } From some entertainment {
FORMCHECKBOX } To some entertainment { FORMCHECKBOX } Other _______________________ {
FORMCHECKBOX } Other _____________________
3. How many times, if any, do you have to change buses to complete this trip?
{ FORMCHECKBOX } 0 { FORMCHECKBOX } 1 { FORMCHECKBOX } 2 { FORMCHECKBOX } 3 { FORMCHECKBOX } 4 or more 4. If you have to transfer, how many minutes do you wait between buses? _________ 5. From door to door, including time to get to the bus stop, waiting, time on the bus,
and time to walk to where you are going, how long does the trip take in minutes?

People Mover On Board Survey CRG Research December 2005 {PAGE }
6. How long would it take by car, including parking and walking, to where you are going, in minutes? How do you think People Mover is doing in the following areas? Check one.
Very
Good Good Okay Poor Very Poor
Don’t Know
7.
Keeping the bus stops and transit centers clean
{ FORMCHECKBOX
}
{ FORMCHECKBOX
}
{ FORMCHECKBOX
}
{ FORMCHECKBOX
}
{ FORMCHECKBOX }
{ FORMCHECKBOX
}
8.
Keeping the bus clean
{ FORMCHECKBOX
}
{ FORMCHECKBOX
}
{ FORMCHECKBOX
}
{ FORMCHECKBOX
}
{ FORMCHECKBOX }
{ FORMCHECKBOX
}
9.
Providing good drivers who are friendly and helpful.
{ FORMCHECKBOX
}
{ FORMCHECKBOX
}
{ FORMCHECKBOX
}
{ FORMCHECKBOX
}
{ FORMCHECKBOX }
{ FORMCHECKBOX
}
10.
Providing dependable, on time service. (No more than five minutes late.)
{ FORMCHECKBOX
}
{ FORMCHECKBOX
}
{ FORMCHECKBOX
}
{ FORMCHECKBOX
}
{ FORMCHECKBOX }
{ FORMCHECKBOX
}
11. Providing information on how to use People Mover
{ FORMCHECKBOX
{ FORMCHECKBOX
{ FORMCHECKBOX
{ FORMCHECKB
{ FORMCHECKBO
{ FORMCHECKBOX

People Mover On Board Survey CRG Research December 2005 {PAGE }
} } } OX }
X } }
12.
Providing customer service agents who know the answers and are polite
{ FORMCHECKBOX
}
{ FORMCHECKBOX
}
{ FORMCHECKBOX
}
{ FORMCHECKBOX
}
{ FORMCHECKBOX }
{ FORMCHECKBOX
}
13. Where do you get most of your bus related information?
{ FORMCHECKBOX } Ride Guide
{ FORMCHECKBOX } Ride Line { FORMCHECKBOX } Transit Center & Bus Stops { FORMCHECKBOX } Driver
{ FORMCHECKBOX } Website { FORMCHECKBOX } Friends or relatives { FORMCHECKBOX } Other: ____________________
CONTINUE ON BACK [two sided document]
14. How often do you usually ride the People Mover? (Check only one.) { FORMCHECKBOX } Once a week { FORMCHECKBOX } Twice a week { FORMCHECKBOX } Three times a week { FORMCHECKBOX } Four times a week { FORMCHECKBOX } Five times a week
{ FORMCHECKBOX } Six times a
week { FORMCHECKBOX } Seven times a week { FORMCHECKBOX } 1-3 days a month { FORMCHECKBOX } Less than one day a month { FORMCHECKBOX } This is the first time
15. What year did you start using People Mover buses as often as you do now? 16. How many cars or other vehicles are available for you to use?

People Mover On Board Survey CRG Research December 2005 {PAGE }
{ FORMCHECKBOX }0 { FORMCHECKBOX }1 { FORMCHECKBOX }2 { FORMCHECKBOX }3 { FORMCHECKBOX }4 or more
17. How many licensed drivers are in your household?
{ FORMCHECKBOX }0 { FORMCHECKBOX }1 { FORMCHECKBOX }2 { FORMCHECKBOX }3 { FORMCHECKBOX }4 or more
18. Are fuel costs one of the reasons you decided to ride the bus? { FORMCHECKBOX }Yes { FORMCHECKBOX } No 19. Are you employed outside your home?
{ FORMCHECKBOX } Yes PLEASE ANSWER QUESTIONS 20-26 IN THE BOXED AREA
{ FORMCHECKBOX } No PLEASE SKIP TO QUESTION 27 ANSWER THESE QUESTIONS IF YOU WORK OUTSIDE YOUR HOME
20. How many days a week do you work outside your home? _________
21. How many hours a week do you work outside your home? ________
22. Do you work on { FORMCHECKBOX }Monday – Friday { FORMCHECKBOX }Saturday { FORMCHECKBOX }Sunday { FORMCHECKBOX }All
23. Most days, what time does your job START? __________ AM or PM
24. Most days, what time does your job END? __________ AM or PM
25. How many days a week do you take the People Mover to work? _________
26. Roughly, how much do you earn an hour at this job? { FORMCHECKBOX } Less than $10 { FORMCHECKBOX } $10 to
$20 { FORMCHECKBOX } $21 to $30 { FORMCHECKBOX }More
The following questions are for statistical purposes only. 27. What is your age? ________ 28. Are you male or female? { FORMCHECKBOX }Male { FORMCHECKBOX }Female 29. What is your zip code at home _________ 30. Do you consider yourself Hispanic or Latin? { FORMCHECKBOX } Yes

People Mover On Board Survey CRG Research December 2005 {PAGE }
{ FORMCHECKBOX } No 31. Which do you consider yourself?
{ FORMCHECKBOX } African American, Black { FORMCHECKBOX } Alaskan Native { FORMCHECKBOX } Native American Indian
{ FORMCHECKBOX } Asian/Pacific Islander { FORMCHECKBOX } White
32. Roughly, what is your household income each year?
{ FORMCHECKBOX } less than $10,000 { FORMCHECKBOX } $10,000 to $14,000 { FORMCHECKBOX } $15,000 to 19,999 { FORMCHECKBOX } $20,000 to $24,000 { FORMCHECKBOX } $25,000 to 34,999
{ FORMCHECKBOX } $35,000 to $49,000 { FORMCHECKBOX } $50,000 to 74,999 { FORMCHECKBOX } $75,000 to $99,000 { FORMCHECKBOX } More than $99,000
Thank you for taking the time to complete this survey.
People Mover On Board Survey CRG Research December 2005 {PAGE }
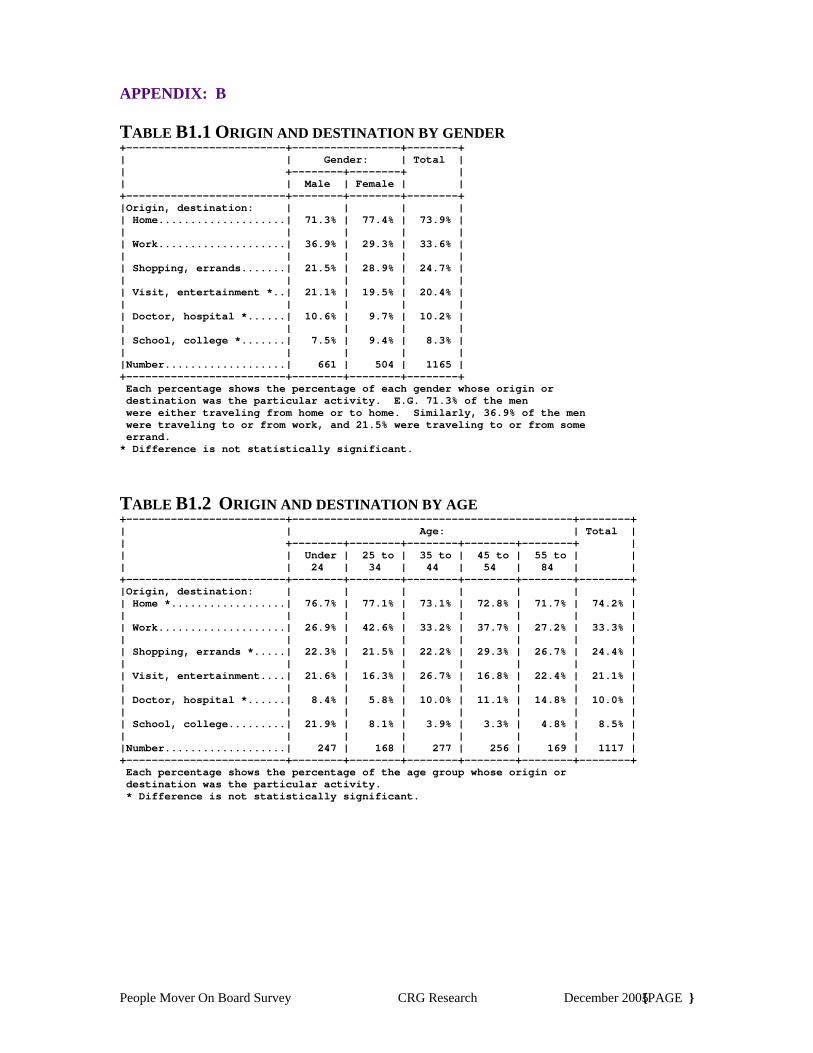
APPENDIX: B TABLE B1.1 ORIGIN AND DESTINATION BY GENDER +-------------------------+-----------------+--------+ | | Gender: | Total | | +--------+--------+ | | | Male | Female | | +-------------------------+--------+--------+--------+ |Origin, destination: | | | | | Home....................| 71.3% | 77.4% | 73.9% | | | | | | | Work....................| 36.9% | 29.3% | 33.6% | | | | | | | Shopping, errands.......| 21.5% | 28.9% | 24.7% | | | | | | | Visit, entertainment *..| 21.1% | 19.5% | 20.4% | | | | | | | Doctor, hospital *......| 10.6% | 9.7% | 10.2% | | | | | | | School, college *.......| 7.5% | 9.4% | 8.3% | | | | | | |Number...................| 661 | 504 | 1165 | +-------------------------+--------+--------+--------+ Each percentage shows the percentage of each gender whose origin or destination was the particular activity. E.G. 71.3% of the men were either traveling from home or to home. Similarly, 36.9% of the men were traveling to or from work, and 21.5% were traveling to or from some errand. * Difference is not statistically significant.
TABLE B1.2 ORIGIN AND DESTINATION BY AGE +-------------------------+--------------------------------------------+--------+ | | Age: | Total | | +--------+--------+--------+--------+--------+ | | | Under | 25 to | 35 to | 45 to | 55 to | | | | 24 | 34 | 44 | 54 | 84 | | +-------------------------+--------+--------+--------+--------+--------+--------+ |Origin, destination: | | | | | | | | Home *..................| 76.7% | 77.1% | 73.1% | 72.8% | 71.7% | 74.2% | | | | | | | | | | Work....................| 26.9% | 42.6% | 33.2% | 37.7% | 27.2% | 33.3% | | | | | | | | | | Shopping, errands *.....| 22.3% | 21.5% | 22.2% | 29.3% | 26.7% | 24.4% | | | | | | | | | | Visit, entertainment....| 21.6% | 16.3% | 26.7% | 16.8% | 22.4% | 21.1% | | | | | | | | | | Doctor, hospital *......| 8.4% | 5.8% | 10.0% | 11.1% | 14.8% | 10.0% | | | | | | | | | | School, college.........| 21.9% | 8.1% | 3.9% | 3.3% | 4.8% | 8.5% | | | | | | | | | |Number...................| 247 | 168 | 277 | 256 | 169 | 1117 | +-------------------------+--------+--------+--------+--------+--------+--------+ Each percentage shows the percentage of the age group whose origin or destination was the particular activity. * Difference is not statistically significant.

People Mover On Board Survey CRG Research December 2005 { PAGE }
TABLE B1.3 ORIGIN AND DESTINATION BY ETHNICITY +-------------------------+-----------------------------------+--------+ | | Ethnicity: | Total | | +--------+--------+--------+--------+ | | | White | Alaskan| African| Other &| | | | | Native |American| mixed | | +-------------------------+--------+--------+--------+--------+--------+ |Origin, destination: | | | | | | | Home *..................| 77.0% | 71.4% | 71.4% | 74.5% | 74.0% | | | | | | | | | Work....................| 39.2% | 22.0% | 47.7% | 31.4% | 32.9% | | | | | | | | | Shopping, errands *.....| 23.4% | 27.7% | 17.5% | 29.0% | 25.3% | | | | | | | | | Visit, entertainment....| 16.0% | 27.4% | 12.0% | 21.1% | 20.3% | | | | | | | | | Doctor, hospital........| 7.5% | 16.7% | 8.5% | 7.4% | 10.7% | | | | | | | | | School, college.........| 10.7% | 3.7% | 7.4% | 12.1% | 8.2% | | | | | | | | |Number...................| 411 | 374 | 123 | 208 | 1116 | +-------------------------+--------+--------+--------+--------+--------+ Each percentage shows the percentage of the ethnic group whose origin or destination was the particular activity. * Difference is not statistically significant.
TABLE B1.4 ORIGIN AND DESTINATION BY INCOME +-------------------------+-----------------------------------+--------+ | | Income: | Total | | +--------+--------+--------+--------+ | | | Less | $10,000| $20,000| More | | | | than | to | to | | | | |$10,000 |$19,999 |$34,999 | | | +-------------------------+--------+--------+--------+--------+--------+ |Origin, destination: | | | | | | | Home....................| 69.8% | 71.4% | 85.3% | 73.7% | 73.7% | | | | | | | | | Work....................| 25.0% | 36.3% | 38.4% | 46.9% | 34.0% | | | | | | | | | Shopping, errands *.....| 25.5% | 24.4% | 19.8% | 24.4% | 24.0% | | | | | | | | | Visit, entertainment....| 26.5% | 18.6% | 14.1% | 20.5% | 21.0% | | | | | | | | | Doctor, hospital *......| 13.6% | 10.0% | 10.0% | 5.8% | 10.7% | | | | | | | | | School, college *.......| 6.8% | 6.2% | 8.1% | 10.9% | 7.5% | | | | | | | | |Number...................| 400 | 317 | 198 | 157 | 1072 | +-------------------------+--------+--------+--------+--------+--------+ Each percentage shows the percentage of the income group whose origin or destination was the particular activity. * Difference is not statistically significant.
People Mover On Board Survey CRG Research December 2005 { PAGE }
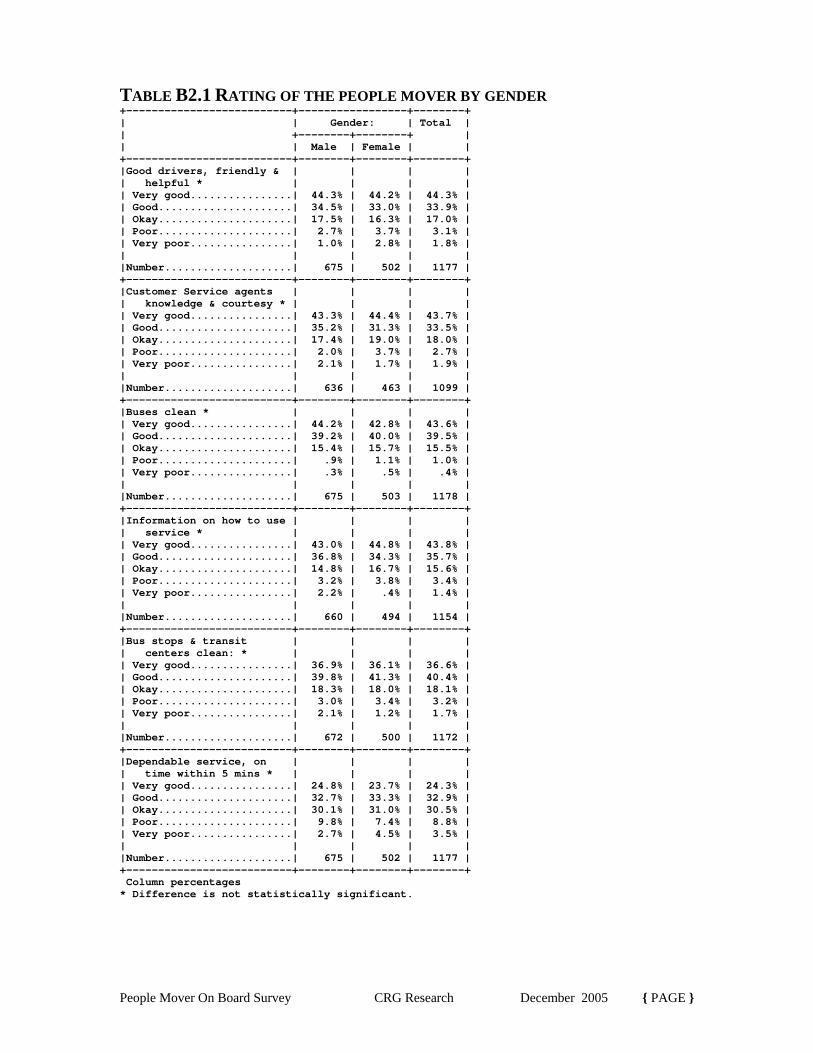
TABLE B2.1 RATING OF THE PEOPLE MOVER BY GENDER +--------------------------+-----------------+--------+ | | Gender: | Total | | +--------+--------+ | | | Male | Female | | +--------------------------+--------+--------+--------+ |Good drivers, friendly & | | | | | helpful * | | | | | Very good................| 44.3% | 44.2% | 44.3% | | Good.....................| 34.5% | 33.0% | 33.9% | | Okay.....................| 17.5% | 16.3% | 17.0% | | Poor.....................| 2.7% | 3.7% | 3.1% | | Very poor................| 1.0% | 2.8% | 1.8% | | | | | | |Number....................| 675 | 502 | 1177 | +--------------------------+--------+--------+--------+ |Customer Service agents | | | | | knowledge & courtesy * | | | | | Very good................| 43.3% | 44.4% | 43.7% | | Good.....................| 35.2% | 31.3% | 33.5% | | Okay.....................| 17.4% | 19.0% | 18.0% | | Poor.....................| 2.0% | 3.7% | 2.7% | | Very poor................| 2.1% | 1.7% | 1.9% | | | | | | |Number....................| 636 | 463 | 1099 | +--------------------------+--------+--------+--------+ |Buses clean * | | | | | Very good................| 44.2% | 42.8% | 43.6% | | Good.....................| 39.2% | 40.0% | 39.5% | | Okay.....................| 15.4% | 15.7% | 15.5% | | Poor.....................| .9% | 1.1% | 1.0% | | Very poor................| .3% | .5% | .4% | | | | | | |Number....................| 675 | 503 | 1178 | +--------------------------+--------+--------+--------+ |Information on how to use | | | | | service * | | | | | Very good................| 43.0% | 44.8% | 43.8% | | Good.....................| 36.8% | 34.3% | 35.7% | | Okay.....................| 14.8% | 16.7% | 15.6% | | Poor.....................| 3.2% | 3.8% | 3.4% | | Very poor................| 2.2% | .4% | 1.4% | | | | | | |Number....................| 660 | 494 | 1154 | +--------------------------+--------+--------+--------+ |Bus stops & transit | | | | | centers clean: * | | | | | Very good................| 36.9% | 36.1% | 36.6% | | Good.....................| 39.8% | 41.3% | 40.4% | | Okay.....................| 18.3% | 18.0% | 18.1% | | Poor.....................| 3.0% | 3.4% | 3.2% | | Very poor................| 2.1% | 1.2% | 1.7% | | | | | | |Number....................| 672 | 500 | 1172 | +--------------------------+--------+--------+--------+ |Dependable service, on | | | | | time within 5 mins * | | | | | Very good................| 24.8% | 23.7% | 24.3% | | Good.....................| 32.7% | 33.3% | 32.9% | | Okay.....................| 30.1% | 31.0% | 30.5% | | Poor.....................| 9.8% | 7.4% | 8.8% | | Very poor................| 2.7% | 4.5% | 3.5% | | | | | | |Number....................| 675 | 502 | 1177 | +--------------------------+--------+--------+--------+ Column percentages * Difference is not statistically significant.

People Mover On Board Survey CRG Research December 2005 { PAGE }
TABLE B2.2 RATING OF THE PEOPLE MOVER BY AGE +--------------------------+--------------------------------------------+--------+ | | Age: | Total | | +--------+--------+--------+--------+--------+ | | | Under | 18 to | 25 to | 35 to | 55 to | | | | 18 | 24 | 34 | 54 | 84 | | +--------------------------+--------+--------+--------+--------+--------+--------+ |Good drivers, friendly & | | | | | | | | helpful | | | | | | | | Very good................| 33.3% | 42.5% | 40.5% | 42.8% | 56.6% | 43.9% | | Good.....................| 37.6% | 29.2% | 38.5% | 34.8% | 31.3% | 34.1% | | Okay.....................| 22.4% | 20.9% | 13.0% | 18.1% | 11.1% | 17.0% | | Poor.....................| 2.5% | 5.5% | 5.4% | 2.8% | .6% | 3.2% | | Very poor................| 4.2% | 1.8% | 2.5% | 1.6% | .4% | 1.7% | | | | | | | | | |Number....................| 72 | 176 | 168 | 538 | 172 | 1126 | +--------------------------+--------+--------+--------+--------+--------+--------+ |Customer Service agents | | | | | | | | knowledge & courtesy | | | | | | | | Very good................| 38.3% | 36.8% | 37.5% | 43.7% | 60.0% | 44.0% | | Good.....................| 35.7% | 35.0% | 33.5% | 35.8% | 22.0% | 33.2% | | Okay.....................| 23.4% | 24.0% | 19.9% | 16.5% | 14.7% | 18.2% | | Poor.....................| 2.5% | 2.4% | 5.1% | 1.9% | 2.4% | 2.6% | | Very poor................| | 1.8% | 4.0% | 2.1% | 1.0% | 2.0% | | | | | | | | | |Number....................| 64 | 151 | 151 | 517 | 164 | 1047 | +--------------------------+--------+--------+--------+--------+--------+--------+ |Buses clean * | | | | | | | | Very good................| 43.3% | 38.4% | 38.3% | 43.6% | 52.8% | 43.4% | | Good.....................| 33.9% | 41.4% | 40.8% | 40.2% | 35.6% | 39.4% | | Okay.....................| 21.0% | 18.5% | 19.3% | 14.6% | 11.1% | 15.8% | | Poor.....................| 1.7% | 1.2% | 1.6% | 1.0% | | 1.0% | | Very poor................| | .4% | | .5% | .4% | .4% | | | | | | | | | |Number....................| 72 | 176 | 168 | 540 | 171 | 1127 | +--------------------------+--------+--------+--------+--------+--------+--------+ |Information on how to use | | | | | | | | service | | | | | | | | Very good................| 34.8% | 43.7% | 41.7% | 42.4% | 55.6% | 44.0% | | Good.....................| 41.3% | 32.6% | 34.6% | 37.4% | 30.8% | 35.4% | | Okay.....................| 19.8% | 20.7% | 15.0% | 15.5% | 10.6% | 15.7% | | Poor.....................| 4.1% | 2.5% | 7.7% | 3.0% | 2.0% | 3.5% | | Very poor................| | .6% | .9% | 1.8% | 1.2% | 1.3% | | | | | | | | | |Number....................| 71 | 173 | 166 | 526 | 171 | 1107 | +--------------------------+--------+--------+--------+--------+--------+--------+ |Bus stops & transit | | | | | | | | centers clean: | | | | | | | | Very good................| 24.0% | 31.9% | 31.1% | 36.7% | 42.8% | 35.3% | | Good.....................| 52.2% | 45.4% | 41.0% | 41.7% | 31.8% | 41.3% | | Okay.....................| 22.0% | 18.6% | 24.6% | 16.1% | 18.5% | 18.5% | | Poor.....................| 1.7% | 3.7% | 1.9% | 3.0% | 4.9% | 3.2% | | Very poor................| | .4% | 1.5% | 2.5% | 2.0% | 1.8% | | | | | | | | | |Number....................| 71 | 175 | 167 | 535 | 172 | 1120 | +--------------------------+--------+--------+--------+--------+--------+--------+ |Dependable service, on | | | | | | | | time within 5 mins | | | | | | | | Very good................| 20.1% | 17.3% | 22.7% | 22.5% | 37.1% | 23.8% | | Good.....................| 23.9% | 25.7% | 31.9% | 37.7% | 31.3% | 33.1% | | Okay.....................| 43.0% | 42.7% | 35.2% | 28.0% | 18.8% | 30.9% | | Poor.....................| 9.5% | 9.4% | 8.7% | 8.5% | 8.2% | 8.7% | | Very poor................| 3.5% | 4.9% | 1.5% | 3.4% | 4.6% | 3.5% | | | | | | | | | |Number....................| 71 | 176 | 167 | 540 | 173 | 1127 | +--------------------------+--------+--------+--------+--------+--------+--------+ Column percentages * Difference is not statistically significant.

People Mover On Board Survey CRG Research December 2005 { PAGE }
TABLE B2.3 RATING OF THE PEOPLE MOVER BY ETHNICITY +--------------------------+-----------------------------------+--------+ | | Ethnicity: | Total | | +--------+--------+--------+--------+ | | | White | Alaskan| African| Other &| | | | | Native |American| mixed | | +--------------------------+--------+--------+--------+--------+--------+ |Good drivers, friendly & | | | | | | | helpful | | | | | | | Very good................| 44.5% | 41.7% | 48.2% | 44.3% | 43.9% | | Good.....................| 40.0% | 33.2% | 22.8% | 32.6% | 34.4% | | Okay.....................| 14.2% | 17.4% | 21.8% | 18.6% | 16.9% | | Poor.....................| .9% | 4.8% | 4.5% | 2.9% | 3.0% | | Very poor................| .3% | 2.9% | 2.7% | 1.6% | 1.7% | | | | | | | | |Number....................| 414 | 376 | 125 | 214 | 1129 | +--------------------------+--------+--------+--------+--------+--------+ |Customer Service agents | | | | | | | knowledge & courtesy | | | | | | | Very good................| 44.5% | 43.5% | 48.8% | 41.0% | 44.0% | | Good.....................| 39.4% | 31.0% | 26.0% | 31.8% | 33.6% | | Okay.....................| 13.7% | 20.5% | 17.9% | 21.4% | 17.9% | | Poor.....................| 1.6% | 2.3% | 6.6% | 2.8% | 2.6% | | Very poor................| .9% | 2.7% | .8% | 3.1% | 1.9% | | | | | | | | |Number....................| 378 | 357 | 123 | 197 | 1055 | +--------------------------+--------+--------+--------+--------+--------+ |Buses clean | | | | | | | Very good................| 47.8% | 40.2% | 48.7% | 37.8% | 43.5% | | Good.....................| 41.1% | 38.4% | 34.3% | 42.7% | 39.8% | | Okay.....................| 10.6% | 18.8% | 16.5% | 17.9% | 15.4% | | Poor.....................| .4% | 1.9% | | .9% | 1.0% | | Very poor................| | .6% | .6% | .7% | .4% | | | | | | | | |Number....................| 413 | 375 | 125 | 217 | 1130 | +--------------------------+--------+--------+--------+--------+--------+ |Information on how to use | | | | | | | service | | | | | | | Very good................| 42.8% | 42.3% | 54.6% | 43.5% | 44.1% | | Good.....................| 39.5% | 37.4% | 21.0% | 32.4% | 35.4% | | Okay.....................| 14.9% | 14.2% | 18.9% | 18.4% | 15.8% | | Poor.....................| 2.8% | 3.7% | 2.8% | 4.1% | 3.4% | | Very poor................| | 2.3% | 2.7% | 1.5% | 1.4% | | | | | | | | |Number....................| 407 | 369 | 123 | 209 | 1108 | +--------------------------+--------+--------+--------+--------+--------+ |Bus stops & transit | | | | | | | centers clean: | | | | | | | Very good................| 36.2% | 34.6% | 48.1% | 34.7% | 36.7% | | Good.....................| 43.2% | 39.6% | 36.2% | 40.6% | 40.7% | | Okay.....................| 14.0% | 21.4% | 12.5% | 22.3% | 17.9% | | Poor.....................| 4.0% | 2.8% | 1.8% | 2.4% | 3.1% | | Very poor................| 2.5% | 1.5% | 1.5% | | 1.6% | | | | | | | | |Number....................| 408 | 374 | 125 | 215 | 1122 | +--------------------------+--------+--------+--------+--------+--------+ |Dependable service, on | | | | | | | time within 5 mins | | | | | | | Very good................| 25.8% | 19.8% | 37.6% | 23.4% | 24.7% | | Good.....................| 34.4% | 34.2% | 21.7% | 33.8% | 32.8% | | Okay.....................| 28.4% | 33.2% | 28.5% | 30.7% | 30.4% | | Poor.....................| 9.1% | 8.9% | 6.6% | 9.4% | 8.8% | | Very poor................| 2.3% | 3.9% | 5.7% | 2.7% | 3.3% | | | | | | | | |Number....................| 413 | 376 | 124 | 216 | 1129 | +--------------------------+--------+--------+--------+--------+--------+ Column percentages * Difference is not statistically significant.

People Mover On Board Survey CRG Research December 2005 { PAGE }
TABLE B2.4 RATING OF THE PEOPLE MOVER BY INCOME +--------------------------+-----------------------------------+--------+ | | Income: | Total | | +--------+--------+--------+--------+ | | | Less | $10,000| $20,000| More | | | | than | to | to | | | | |$10,000 |$19,999 |$34,999 | | | +--------------------------+--------+--------+--------+--------+--------+ |Good drivers, friendly & | | | | | | | helpful * | | | | | | | Very good................| 48.7% | 39.4% | 40.9% | 47.2% | 44.3% | | Good.....................| 29.8% | 34.7% | 36.4% | 35.1% | 33.3% | | Okay.....................| 15.7% | 20.6% | 16.6% | 16.2% | 17.4% | | Poor.....................| 3.0% | 3.8% | 4.5% | 1.1% | 3.2% | | Very poor................| 2.7% | 1.6% | 1.7% | .4% | 1.9% | | | | | | | | |Number....................| 401 | 324 | 198 | 158 | 1081 | +--------------------------+--------+--------+--------+--------+--------+ |Customer Service agents | | | | | | | knowledge & courtesy * | | | | | | | Very good................| 48.6% | 39.1% | 43.5% | 45.5% | 44.4% | | Good.....................| 31.3% | 36.3% | 34.9% | 31.2% | 33.5% | | Okay.....................| 15.1% | 18.8% | 18.9% | 18.8% | 17.4% | | Poor.....................| 3.0% | 3.0% | 2.3% | .8% | 2.6% | | Very poor................| 1.9% | 2.7% | .5% | 3.6% | 2.1% | | | | | | | | |Number....................| 383 | 310 | 183 | 133 | 1009 | +--------------------------+--------+--------+--------+--------+--------+ |Buses clean * | | | | | | | Very good................| 47.2% | 42.9% | 37.8% | 45.7% | 43.9% | | Good.....................| 36.2% | 41.2% | 45.4% | 39.5% | 39.9% | | Okay.....................| 14.1% | 15.0% | 16.0% | 14.4% | 14.8% | | Poor.....................| 1.9% | .7% | .8% | | 1.1% | | Very poor................| .6% | .2% | | .4% | .3% | | | | | | | | |Number....................| 402 | 325 | 197 | 158 | 1082 | +--------------------------+--------+--------+--------+--------+--------+ |Information on how to use | | | | | | | service * | | | | | | | Very good................| 49.1% | 39.6% | 43.6% | 44.8% | 44.6% | | Good.....................| 33.5% | 35.1% | 36.1% | 34.8% | 34.7% | | Okay.....................| 13.1% | 16.7% | 18.8% | 17.6% | 15.9% | | Poor.....................| 2.1% | 6.8% | 1.5% | 2.4% | 3.4% | | Very poor................| 2.2% | 1.8% | | .4% | 1.4% | | | | | | | | |Number....................| 397 | 320 | 189 | 155 | 1061 | +--------------------------+--------+--------+--------+--------+--------+ |Bus stops & transit | | | | | | | centers clean: | | | | | | | Very good................| 44.4% | 36.4% | 27.3% | 31.5% | 37.0% | | Good.....................| 37.0% | 39.7% | 47.7% | 42.0% | 40.5% | | Okay.....................| 15.4% | 18.4% | 22.4% | 16.9% | 17.8% | | Poor.....................| 2.0% | 3.6% | 1.8% | 6.1% | 3.0% | | Very poor................| 1.3% | 1.9% | .7% | 3.5% | 1.7% | | | | | | | | |Number....................| 398 | 323 | 198 | 155 | 1074 | +--------------------------+--------+--------+--------+--------+--------+ |Dependable service, on | | | | | | | time within 5 mins | | | | | | | Very good................| 26.5% | 20.7% | 23.4% | 27.2% | 24.3% | | Good.....................| 28.3% | 36.3% | 34.0% | 38.1% | 33.2% | | Okay.....................| 34.1% | 26.7% | 30.6% | 27.1% | 30.2% | | Poor.....................| 8.9% | 13.1% | 5.6% | 3.6% | 8.8% | | Very poor................| 2.2% | 3.2% | 6.4% | 3.9% | 3.5% | | | | | | | | |Number....................| 402 | 324 | 198 | 158 | 1082 | +--------------------------+--------+--------+--------+--------+--------+ Column percentages * Difference is not statistically significant.

People Mover On Board Survey CRG Research December 2005 { PAGE }
TABLE B3.1 FREQUENCY OF USE AND AVAILABILITY
OF PRIVATE VEHICLES BY GENDER +--------------------------+-----------------+--------+ | | Gender: | Total | | +--------+--------+ | | | Male | Female | | +--------------------------+--------+--------+--------+ |Usually ride bus: | | | | | Seven days a week........| 38.8% | 33.3% | 36.5% | | Five or six days.........| 35.6% | 33.8% | 34.8% | | Three or four days.......| 17.0% | 19.6% | 18.1% | | Once, twice or monthly...| 8.6% | 13.3% | 10.6% | | | | | | |Number....................| 668 | 491 | 1159 | +--------------------------+--------+--------+--------+ |Vehicles available: * | | | | | None.....................| 61.7% | 60.5% | 61.2% | | One......................| 23.4% | 28.4% | 25.6% | | Two......................| 10.7% | 8.1% | 9.6% | | Three....................| 2.3% | 1.7% | 2.1% | | Four or more.............| 1.9% | 1.2% | 1.6% | | | | | | |Number....................| 664 | 493 | 1157 | +--------------------------+--------+--------+--------+ |Licensed drivers in | | | | | household:* | | | | | None.....................| 33.9% | 35.2% | 34.4% | | One......................| 35.6% | 37.2% | 36.3% | | Two......................| 19.6% | 20.5% | 20.0% | | Three....................| 7.0% | 4.7% | 6.0% | | Four or more.............| 4.0% | 2.4% | 3.3% | | | | | | |Number....................| 665 | 498 | 1163 | +--------------------------+--------+--------+--------+ Column percentages * Difference is not statistically significant.

People Mover On Board Survey CRG Research December 2005 { PAGE }
TABLE B3.2 FREQUENCY OF USE AND AVAILABILITY OF PRIVATE VEHICLES BY AGE +--------------------------+--------------------------------------------+--------+ | | Age: | Total | | +--------+--------+--------+--------+--------+ | | | Under | 18 to | 25 to | 35 to | 55 to | | | | 18 | 24 | 34 | 54 | 84 | | +--------------------------+--------+--------+--------+--------+--------+--------+ |Usually ride bus: | | | | | | | | Seven times a week.......| 27.7% | 28.2% | 38.6% | 42.4% | 26.0% | 36.2% | | Five or six times........| 28.0% | 39.4% | 39.5% | 31.3% | 34.7% | 34.1% | | Three or four times......| 14.0% | 18.7% | 11.6% | 17.9% | 24.9% | 17.9% | | Once, twice or monthly...| 25.6% | 11.5% | 9.3% | 6.9% | 12.9% | 10.1% | | RarelyL, first time......| 4.7% | 2.2% | 1.0% | 1.5% | 1.5% | 1.8% | | | | | | | | | |Number....................| 72 | 175 | 167 | 544 | 172 | 1130 | +--------------------------+--------+--------+--------+--------+--------+--------+ |Vehicles available: * | | | | | | | | None.....................| 41.9% | 60.7% | 58.8% | 63.9% | 65.1% | 61.4% | | One......................| 35.8% | 27.4% | 28.0% | 24.3% | 22.0% | 25.8% | | Two......................| 18.0% | 9.9% | 9.5% | 8.7% | 9.7% | 9.8% | | Three....................| 2.1% | 1.6% | 1.3% | 2.1% | 2.3% | 1.9% | | Four or more.............| 2.2% | .4% | 2.4% | 1.0% | .9% | 1.2% | | | | | | | | | |Number....................| 72 | 174 | 166 | 531 | 165 | 1108 | +--------------------------+--------+--------+--------+--------+--------+--------+ |Licensed drivers in | | | | | | | | household: | | | | | | | | None.....................| 15.7% | 24.1% | 35.5% | 40.3% | 35.0% | 34.6% | | One......................| 38.6% | 31.0% | 30.9% | 35.6% | 46.2% | 36.0% | | Two......................| 36.5% | 29.1% | 22.7% | 16.5% | 13.7% | 20.3% | | Three....................| 3.5% | 10.3% | 7.7% | 5.0% | 4.3% | 6.0% | | Four or more.............| 5.7% | 5.5% | 3.2% | 2.5% | .9% | 3.1% | | | | | | | | | |Number....................| 72 | 176 | 164 | 535 | 166 | 1113 | +--------------------------+--------+--------+--------+--------+--------+--------+ Column percentages * Difference is not statistically significant.

People Mover On Board Survey CRG Research December 2005 { PAGE }
TABLE B3.3 FREQUENCY OF USE AND AVAILABILITY OF PRIVATE VEHICLES BY ETHNICITY +--------------------------+-----------------------------------+--------+ | | Ethnicity: | Total | | +--------+--------+--------+--------+ | | | White | Alaskan| African| Other &| | | | | Native |American| mixed | | +--------------------------+--------+--------+--------+--------+--------+ |Usually ride bus: * | | | | | | | Seven days a week........| 34.7% | 40.7% | 29.7% | 37.0% | 36.6% | | Five or six days.........| 37.9% | 27.9% | 40.9% | 36.7% | 34.7% | | Three or four days.......| 17.6% | 21.4% | 20.0% | 13.8% | 18.4% | | Once, twice or monthly...| 9.8% | 10.0% | 9.4% | 12.6% | 10.3% | | | | | | | | |Number....................| 406 | 370 | 122 | 213 | 1111 | +--------------------------+--------+--------+--------+--------+--------+ |Vehicles available:* | | | | | | | None.....................| 65.3% | 60.2% | 57.7% | 57.9% | 61.4% | | One......................| 21.7% | 27.7% | 30.0% | 25.4% | 25.3% | | Two......................| 9.3% | 10.0% | 6.6% | 11.5% | 9.7% | | Three....................| 2.0% | 1.3% | 4.0% | 2.7% | 2.1% | | Four or more.............| 1.7% | .8% | 1.7% | 2.5% | 1.6% | | | | | | | | |Number....................| 410 | 367 | 123 | 209 | 1109 | +--------------------------+--------+--------+--------+--------+--------+ |Licensed drivers in | | | | | | | household: | | | | | | | None.....................| 33.7% | 44.7% | 19.3% | 28.4% | 34.8% | | One......................| 39.4% | 31.4% | 51.0% | 31.3% | 36.4% | | Two......................| 17.7% | 17.5% | 20.2% | 27.7% | 19.8% | | Three....................| 7.3% | 3.3% | 6.0% | 7.0% | 5.8% | | Four or more.............| 2.0% | 3.1% | 3.6% | 5.6% | 3.2% | | | | | | | | |Number....................| 412 | 374 | 120 | 209 | 1115 | +--------------------------+--------+--------+--------+--------+--------+ Column percentages * Difference is not statistically significant.

People Mover On Board Survey CRG Research December 2005 { PAGE }
TABLE B3.4 FREQUENCY OF USE AND AVAILABILITY OF PRIVATE VEHICLES BY INCOME +--------------------------+-----------------------------------+--------+ | | Income: | Total | | +--------+--------+--------+--------+ | | | Less | $10,000| $20,000| More | | | | than | to | to | | | | |$10,000 |$19,999 |$34,999 | | | +--------------------------+--------+--------+--------+--------+--------+ |Usually ride bus: * | | | | | | | Seven days a week........| 40.4% | 37.5% | 33.8% | 35.8% | 37.7% | | Five or six days.........| 31.3% | 37.2% | 41.6% | 30.8% | 34.9% | | Three or four days.......| 17.3% | 17.4% | 15.7% | 20.2% | 17.4% | | Once, twice or monthly...| 11.1% | 7.9% | 8.9% | 13.2% | 10.0% | | | | | | | | |Number....................| 397 | 324 | 192 | 152 | 1065 | +--------------------------+--------+--------+--------+--------+--------+ |Vehicles available: | | | | | | | None.....................| 76.4% | 66.7% | 47.0% | 37.5% | 62.3% | | One......................| 14.6% | 25.3% | 36.3% | 36.6% | 25.1% | | Two......................| 7.5% | 4.9% | 13.4% | 18.2% | 9.4% | | Three....................| .5% | 2.3% | 1.2% | 4.5% | 1.8% | | Four or more.............| 1.1% | .8% | 2.1% | 3.1% | 1.5% | | | | | | | | |Number....................| 389 | 320 | 196 | 157 | 1062 | +--------------------------+--------+--------+--------+--------+--------+ |Licensed drivers in | | | | | | | household: | | | | | | | None.....................| 51.7% | 34.2% | 25.0% | 12.4% | 35.8% | | One......................| 31.5% | 39.9% | 41.2% | 31.8% | 35.9% | | Two......................| 12.2% | 16.0% | 24.7% | 35.1% | 18.9% | | Three....................| 2.5% | 7.1% | 5.4% | 13.8% | 6.1% | | Four or more.............| 2.1% | 2.8% | 3.7% | 6.9% | 3.3% | | | | | | | | |Number....................| 395 | 324 | 196 | 156 | 1071 | +--------------------------+--------+--------+--------+--------+--------+ Column percentages * Difference is not statistically significant.

People Mover On Board Survey CRG Research December 2005 { PAGE }
TABLE B4.1 EMPLOYMENT STATUS BY GENDER +--------------------------+-----------------+--------+ | | Gender: | Total | | +--------+--------+ | | | Male | Female | | +--------------------------+--------+--------+--------+ |Employed: * | | | | | 1 to 3 days..............| 6.9% | 6.9% | 6.9% | | 5-7 days.................| 52.0% | 44.9% | 49.0% | | Not employed.............| 41.2% | 48.1% | 44.1% | | | | | | |Number....................| 671 | 500 | 1171 | +--------------------------+--------+--------+--------+ Column percentages * Difference is not statistically significant.
TABLE B4.2 EMPLOYMENT STATUS BY AGE +--------------------------+--------------------------------------------+--------+ | | Age: | Total | | +--------+--------+--------+--------+--------+ | | | Under | 18 to | 25 to | 35 to | 55 to | | | | 18 | 24 | 34 | 54 | 84 | | +--------------------------+--------+--------+--------+--------+--------+--------+ |Employed: | | | | | | | | 1 to 3 days..............| 8.8% | 11.6% | 4.5% | 5.8% | 5.0% | 6.6% | | 5-7 days.................| 19.9% | 49.4% | 63.1% | 50.6% | 40.3% | 48.8% | | Not employed.............| 71.2% | 39.0% | 32.4% | 43.6% | 54.6% | 44.6% | | | | | | | | | |Number....................| 72 | 176 | 167 | 541 | 167 | 1123 | +--------------------------+--------+--------+--------+--------+--------+--------+ Column percentages
TABLE B4.3 EMPLOYMENT STATUS BY ETHNICITY +--------------------------+-----------------------------------+--------+ | | Ethnicity: | Total | | +--------+--------+--------+--------+ | | | White | Alaskan| African| Other &| | | | | Native |American| mixed | | +--------------------------+--------+--------+--------+--------+--------+ |Employed: | | | | | | | 1 to 3 days..............| 6.2% | 6.5% | 8.2% | 7.5% | 6.8% | | 5-7 days.................| 59.1% | 33.3% | 59.7% | 46.2% | 48.1% | | Not employed.............| 34.7% | 60.2% | 32.1% | 46.3% | 45.1% | | | | | | | | |Number....................| 411 | 375 | 125 | 212 | 1123 | +--------------------------+--------+--------+--------+--------+--------+ Column percentages
TABLE B4.4 EMPLOYMENT STATUS BY INCOME +--------------------------+-----------------------------------+--------+ | | Income: | Total | | +--------+--------+--------+--------+ | | | Less | $10,000| $20,000| More | | | | than | to | to | | | | |$10,000 |$19,999 |$34,999 | | | +--------------------------+--------+--------+--------+--------+--------+ |Employed: | | | | | | | 1 to 3 days..............| 8.2% | 4.6% | 8.0% | 5.0% | 6.6% | | 5-7 days.................| 29.2% | 56.7% | 61.9% | 72.1% | 49.7% | | Not employed.............| 62.6% | 38.6% | 30.1% | 22.9% | 43.7% | | | | | | | | |Number....................| 401 | 321 | 200 | 157 | 1079 | +--------------------------+--------+--------+--------+--------+--------+ Column percentages

People Mover On Board Survey CRG Research December 2005 {PAGE }
APPENDIX: C TABLE C1.1 ORIGIN AND DESTINATION BY ROUTE +---------------+--------------------------------------------------------------------------------------------------------+------+ | | Route: |Total | | +------+------+------+------+------+------+------+------+------+------+------+------+------+------+------+ | | | 1 | 2 | 3 | 7 | 8 | 9 | 13 | 14 | 15 | 36 | 45 | 60 | 75 | 77 | 102 | | +---------------+------+------+------+------+------+------+------+------+------+------+------+------+------+------+------+------+ |Origin, | | | | | | | | | | | | | | | | | | destination:| | | | | | | | | | | | | | | | | | Home..........|81.6% |80.0% |70.4% |80.8% |77.4% |69.8% |80.3% |86.7% |80.7% |71.6% |69.3% |63.5% |65.3% |70.4% |86.5% |73.8% | | | | | | | | | | | | | | | | | | | | Work..........|28.9% |42.5% |17.3% |30.0% |22.6% |59.4% |28.9% |26.7% |35.1% |36.5% |30.7% |33.7% |41.8% |25.9% |64.9% |33.3% | | | | | | | | | | | | | | | | | | | | Shopping, | | | | | | | | | | | | | | | | | | errands.....|22.4% |26.7% |38.3% |20.8% |32.3% |21.9% |14.5% |40.0% |22.8% |23.0% |16.5% |47.1% |20.4% |25.9% | 8.1% |24.5% | | | | | | | | | | | | | | | | | | | | Visit, | | | | | | | | | | | | | | | | | | entertainment|19.7% |13.3% |23.5% |22.5% |14.0% |16.7% |10.5% |20.0% |35.1% |18.9% |25.2% |19.2% |26.5% |18.5% | 5.4% |20.7% | | | | | | | | | | | | | | | | | | | | Doctor, | | | | | | | | | | | | | | | | | | hospital....| 6.6% | 5.0% | 8.6% | 5.8% | 8.6% | 3.1% |19.7% | | 1.8% |13.5% |21.3% | 2.9% | 6.1% | 3.7% |13.5% |10.0% | | | | | | | | | | | | | | | | | | | | School, | | | | | | | | | | | | | | | | | | college.....|26.3% | 8.3% |11.1% | 5.0% |21.5% | 3.1% |15.8% | | 3.5% |14.9% | 2.4% | 5.8% | 2.0% |29.6% | 5.4% | 8.5% | | | | | | | | | | | | | | | | | | | |Number.........| 52 | 88 | 127 | 145 | 64 | 74 | 81 | 12 | 56 | 56 | 224 | 79 | 91 | 25 | 25 | 1199 | +---------------+------+------+------+------+------+------+------+------+------+------+------+------+------+------+------+------+ Each percentage shows the percentage of riders on the route whose origin or destination was the particular activity. E.G. 81.6% of the riders on Route 1 were either traveling from home or to home. Similarly, 28.9% of riders on Route 1 were going or coming from work.

People Mover On Board Survey CRG Research December 2005 { PAGE }
TABLE C1.2 TRANSFERRING BY ROUTE +-------------------+--------------------------------------------------------------------------------------------------------+------+ | | Route: |Total | | +------+------+------+------+------+------+------+------+------+------+------+------+------+------+------+ | | | 1 | 2 | 3 | 7 | 8 | 9 | 13 | 14 | 15 | 36 | 45 | 60 | 75 | 77 | 102 | | +-------------------+------+------+------+------+------+------+------+------+------+------+------+------+------+------+------+------+ |Changed buses: | | | | | | | | | | | | | | | | | | None..............|38.0% |47.3% |37.7% |38.0% |42.2% |46.1% |37.7% | 6.7% |39.6% |53.6% |32.7% |47.4% |47.4% | 3.8% |44.1% |39.7% | | Once..............|26.8% |14.3% | 9.1% |22.2% |10.8% |18.0% |17.4% |20.0% |13.2% |11.6% |21.8% |14.4% |18.9% |53.8% |26.5% |18.2% | | Twice.............|31.0% |22.3% |36.4% |21.3% |32.5% |27.0% |29.0% |60.0% |17.0% |26.1% |30.9% |20.6% |23.2% |23.1% |17.6% |27.1% | | Three times.......| 1.4% | 8.9% |11.7% |11.1% | 4.8% | 5.6% | 7.2% | 6.7% |11.3% | 1.4% | 9.1% |13.4% | 2.1% | | 5.9% | 7.9% | | Four or more......| 2.8% | 7.1% | 5.2% | 7.4% | 9.6% | 3.4% | 8.7% | 6.7% |18.9% | 7.2% | 5.5% | 4.1% | 8.4% |19.2% | 5.9% | 7.2% | | | | | | | | | | | | | | | | | | | |Number.............| 49 | 82 | 121 | 131 | 57 | 69 | 73 | 12 | 52 | 52 | 194 | 73 | 88 | 24 | 23 | 1100 | +-------------------+------+------+------+------+------+------+------+------+------+------+------+------+------+------+------+------+ |Wait between buses:* | | | | | | | | | | | | | | | | | 5 min. or less....|20.5% |12.5% |11.1% |11.1% |12.5% |29.5% |13.9% | | 7.7% |24.1% |25.9% |17.8% |15.8% |50.0% |52.9% |18.9% | | 6 to 10 min.......|10.3% |22.9% |24.4% |25.9% |15.0% |15.9% |27.8% |18.2% |26.9% |17.2% |16.7% |11.1% |26.3% |29.2% |23.5% |20.9% | | 11 to 15 min......|23.1% |18.8% |22.2% |18.5% |17.5% |13.6% |16.7% |27.3% |11.5% | 6.9% |18.5% |15.6% |15.8% | 8.3% | 5.9% |17.1% | | 16 to 20 min......|20.5% |22.9% |15.6% |16.7% |10.0% |18.2% |11.1% |18.2% | 7.7% |24.1% |16.7% |17.8% | 2.6% | |11.8% |14.8% | | 21 to 30 min......| 5.1% |12.5% |20.0% |18.5% |37.5% |18.2% |19.4% |18.2% |30.8% |17.2% |14.8% |22.2% |23.7% | 8.3% | 5.9% |18.4% | | 31 min. to 1 hr...|20.5% |10.4% | 6.7% | 7.4% | 7.5% | 4.5% |11.1% |18.2% |15.4% |10.3% | 5.6% |15.6% |15.8% | 4.2% | | 9.3% | | More than 1 hr....| | | | 1.9% | | | | | | | 1.9% | | | | | .5% | | | | | | | | | | | | | | | | | | | |Number.............| 27 | 35 | 71 | 65 | 27 | 34 | 38 | 8 | 25 | 22 | 95 | 34 | 35 | 22 | 11 | 549 | +-------------------+------+------+------+------+------+------+------+------+------+------+------+------+------+------+------+------+ Column percentages * Difference is not statistically significant.

People Mover On Board Survey CRG Research December 2005 { PAGE }
TABLE C1.3 TRIP TIME BY ROUTE +-------------------+--------------------------------------------------------------------------------------------------------+------+ | | Route: |Total | | +------+------+------+------+------+------+------+------+------+------+------+------+------+------+------+ | | | 1 | 2 | 3 | 7 | 8 | 9 | 13 | 14 | 15 | 36 | 45 | 60 | 75 | 77 | 102 | | +-------------------+------+------+------+------+------+------+------+------+------+------+------+------+------+------+------+------+ |Bus trip will take:| | | | | | | | | | | | | | | | | | 10 or fewer.......| 9.7% | 6.0% | 9.9% |12.6% |11.1% |10.8% |18.6% | | 9.8% | 6.9% |16.5% | 5.2% |10.0% | 4.0% |11.4% |11.2% | | 11 thru 15........| 5.6% |13.7% | 5.6% | 7.8% |13.6% |10.8% | 1.7% |33.3% | 2.0% |15.3% |11.6% | 2.1% |14.4% | 4.0% | 2.9% | 9.1% | | 16 thru 20........| 6.9% |13.7% |12.7% |10.7% |12.3% | 9.7% |13.6% | | 9.8% |16.7% |12.4% |16.5% | 8.9% | 8.0% | 5.7% |11.7% | | 21 thru 25........| 2.8% | 5.1% | 1.4% | 1.9% | 6.2% | 8.6% | 1.7% | | 5.9% | 2.8% | 2.5% | 7.2% | 2.2% | 8.0% | 5.7% | 3.7% | | 26 thru 30........|13.9% |17.9% |11.3% |11.7% | 9.9% |14.0% |16.9% | |21.6% |11.1% |17.4% |10.3% |17.8% |16.0% | 5.7% |14.4% | | 31 thru 40........|12.5% | 4.3% | 7.0% | 8.7% |11.1% | 8.6% | 8.5% | | 3.9% |11.1% | 6.6% |15.5% | 7.8% | 4.0% | 8.6% | 8.2% | | 41 thru 50........|18.1% |18.8% |25.4% |16.5% |16.0% |16.1% |11.9% | 8.3% |11.8% |11.1% |15.7% |10.3% |17.8% | 4.0% |14.3% |16.0% | | 51 thru 60........| 8.3% | 6.0% |15.5% |15.5% |13.6% |10.8% |13.6% |16.7% | 7.8% |13.9% | 9.9% |16.5% | 8.9% |28.0% |22.9% |12.4% | | 61 thru 100.......|16.7% | 6.0% | 2.8% | 9.7% | 1.2% | 7.5% | 8.5% |33.3% |17.6% | 8.3% | 4.1% | 9.3% | 6.7% |20.0% |22.9% | 8.0% | | 101 thru 120......| 5.6% | 6.0% | 7.0% | 2.9% | 2.5% | 1.1% | 1.7% | 8.3% | 7.8% | 2.8% | 2.5% | 1.0% | 3.3% | 4.0% | | 3.5% | | Longer............| | 2.6% | 1.4% | 1.9% | 2.5% | 2.2% | 3.4% | | 2.0% | | .8% | 6.2% | 2.2% | | | 1.9% | | | | | | | | | | | | | | | | | | | |Number.............| 50 | 85 | 112 | 125 | 55 | 72 | 63 | 9 | 50 | 55 | 213 | 73 | 83 | 23 | 23 | 1091 | +-------------------+------+------+------+------+------+------+------+------+------+------+------+------+------+------+------+------+ |Same trip by car | | | | | | | | | | | | | | | | | | would take: | | | | | | | | | | | | | | | | | | 10 or fewer.......|14.7% |20.8% |25.0% |23.3% |15.4% |13.4% |27.9% |23.1% |23.5% |27.1% |26.7% |17.7% |15.8% |19.2% | 6.2% |21.6% | | 11 thru 15........|16.2% |25.5% |22.1% |25.2% |25.6% |43.9% |18.0% |15.4% |19.6% |14.3% |15.0% |15.6% |22.1% | 3.8% | 6.2% |20.5% | | 16 thru 20........|35.3% |19.8% |14.7% |26.2% |20.5% |20.7% |19.7% |38.5% |13.7% |30.0% |24.2% |32.3% |23.2% |23.1% | 6.2% |23.0% | | 21 thru 25........|11.8% | 9.4% | 2.9% | 3.9% | 9.0% | 6.1% | 9.8% | | 3.9% | 8.6% | 2.5% | 7.3% | 5.3% | 7.7% |18.7% | 5.9% | | 26 thru 30........|17.6% |15.1% |22.1% |10.7% |20.5% | 7.3% |16.4% |15.4% |25.5% |10.0% |15.8% |14.6% |18.9% |11.5% |28.1% |16.1% | | 31 thru 40........| | 5.7% | 2.9% | 3.9% | 1.3% | 7.3% | 3.3% | | 5.9% | 2.9% | 5.8% | 5.2% | 9.5% |19.2% |21.9% | 5.4% | | 41 thru 50........| | 1.9% | 5.9% | 4.9% | 5.1% | 1.2% | 4.9% | | 2.0% | 4.3% | 5.0% | 5.2% | 2.1% | 3.8% | 9.4% | 4.0% | | 51 thru 60........| 4.4% | 1.9% | 4.4% | 1.9% | 2.6% | | | 7.7% | 2.0% | 2.9% | 5.0% | 2.1% | 2.1% |11.5% | 3.1% | 3.1% | | 61 thru 100.......| | | | | | | | | 3.9% | | | | 1.1% | | | .3% | | | | | | | | | | | | | | | | | | | |Number.............| 47 | 77 | 107 | 125 | 53 | 63 | 65 | 10 | 50 | 53 | 211 | 73 | 88 | 24 | 21 | 1067 | +-------------------+------+------+------+------+------+------+------+------+------+------+------+------+------+------+------+------+ Column percentages * Difference is not statistically significant.

People Mover On Board Survey CRG Research December 2005 { PAGE }
TABLE C1.4 SOURCE OF INFORMATION BY ROUTE +-------------------+--------------------------------------------------------------------------------------------------------+------+ | | Route: |Total | | +------+------+------+------+------+------+------+------+------+------+------+------+------+------+------+ | | | 1 | 2 | 3 | 7 | 8 | 9 | 13 | 14 | 15 | 36 | 45 | 60 | 75 | 77 | 102 | | +-------------------+------+------+------+------+------+------+------+------+------+------+------+------+------+------+------+------+ | | | | | | | | | | | | | | | | | | | Ride Guide........|58.4% |51.2% |48.8% |58.3% |54.9% |56.5% |45.3% |56.3% |76.4% |59.5% |54.3% |58.4% |48.5% |59.3% |48.6% |54.8% | | Ride line.........|14.3% | 6.6% | 7.3% |10.0% |13.2% |10.9% |14.7% | |12.7% | 8.1% |14.0% |11.9% |11.1% |11.1% | 5.7% |11.0% | | Transit Center & | | | | | | | | | | | | | | | | | | Bus Stops.......|28.6% |40.5% |30.5% |32.5% |37.4% |38.0% |30.7% |31.3% |21.8% |31.1% |36.4% |34.7% |37.4% |11.1% |14.3% |33.1% | | Driver............|10.4% |18.2% |20.7% |19.2% |14.3% |19.6% |18.7% |12.5% |12.7% |14.9% |12.4% |12.9% |24.2% | 7.4% | 2.9% |16.2% | | Website...........|15.6% | 9.9% |18.3% | 8.3% |13.2% | 8.7% |16.0% | | 1.8% |14.9% | 7.8% | 8.9% | 8.1% |29.6% |34.3% |11.4% | | Friends or Family.| 9.1% |11.6% |14.6% | 9.2% |11.0% | 8.7% |14.7% | 6.3% | 3.6% | 4.1% |12.4% | 7.9% | 8.1% | 7.4% | |10.1% | | The schedule......| | | | | | 1.1% | | 6.3% | 1.8% | 1.4% | | | | | | .3% | | Customer service, | | | | | | | | | | | | | | | | | | telephone.......| | 1.7% | | | | | | | | | | | 1.0% | | 2.9% | .3% | | Strangers.........| | .8% | | | | | | | | | | | | | | .1% | | Covenant house....| | | | | | 1.1% | | | | | | | | | | .1% | | The phone book....| | | | | | | | | | | | | 3.0% | | | .2% | | The media.........| | | 2.4% | | | | | | | | .8% | | | | | .4% | | Travel trainer....| | | | | | | 1.3% | | | | | | | | | .1% | | Figured out for | | | | | | | | | | | | | | | | | | myself..........| 1.3% | | 2.4% | | 1.1% | | 1.3% | | | | | | | | | .5% | | | | | | | | | | | | | | | | | | | |Number.............| 53 | 88 | 129 | 145 | 62 | 71 | 80 | 12 | 54 | 56 | 227 | 76 | 92 | 25 | 23 | 1193 | +-------------------+------+------+------+------+------+------+------+------+------+------+------+------+------+------+------+------+ Column percentages Statistical significance cannot be computed for multiple response questions.
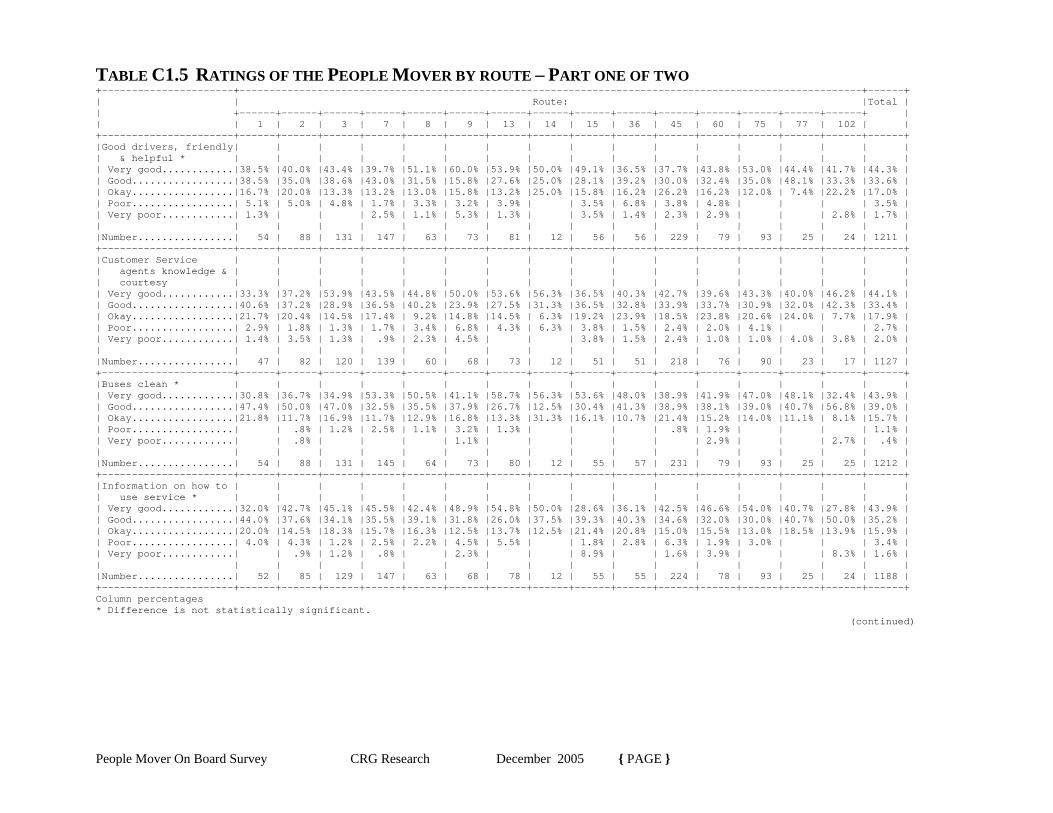
People Mover On Board Survey CRG Research December 2005 { PAGE }
TABLE C1.5 RATINGS OF THE PEOPLE MOVER BY ROUTE – PART ONE OF TWO +----------------------+--------------------------------------------------------------------------------------------------------+------+ | | Route: |Total | | +------+------+------+------+------+------+------+------+------+------+------+------+------+------+------+ | | | 1 | 2 | 3 | 7 | 8 | 9 | 13 | 14 | 15 | 36 | 45 | 60 | 75 | 77 | 102 | | +----------------------+------+------+------+------+------+------+------+------+------+------+------+------+------+------+------+------+ |Good drivers, friendly| | | | | | | | | | | | | | | | | | & helpful * | | | | | | | | | | | | | | | | | | Very good............|38.5% |40.0% |43.4% |39.7% |51.1% |60.0% |53.9% |50.0% |49.1% |36.5% |37.7% |43.8% |53.0% |44.4% |41.7% |44.3% | | Good.................|38.5% |35.0% |38.6% |43.0% |31.5% |15.8% |27.6% |25.0% |28.1% |39.2% |30.0% |32.4% |35.0% |48.1% |33.3% |33.6% | | Okay.................|16.7% |20.0% |13.3% |13.2% |13.0% |15.8% |13.2% |25.0% |15.8% |16.2% |26.2% |16.2% |12.0% | 7.4% |22.2% |17.0% | | Poor.................| 5.1% | 5.0% | 4.8% | 1.7% | 3.3% | 3.2% | 3.9% | | 3.5% | 6.8% | 3.8% | 4.8% | | | | 3.5% | | Very poor............| 1.3% | | | 2.5% | 1.1% | 5.3% | 1.3% | | 3.5% | 1.4% | 2.3% | 2.9% | | | 2.8% | 1.7% | | | | | | | | | | | | | | | | | | | |Number................| 54 | 88 | 131 | 147 | 63 | 73 | 81 | 12 | 56 | 56 | 229 | 79 | 93 | 25 | 24 | 1211 | +----------------------+------+------+------+------+------+------+------+------+------+------+------+------+------+------+------+------+ |Customer Service | | | | | | | | | | | | | | | | | | agents knowledge & | | | | | | | | | | | | | | | | | | courtesy | | | | | | | | | | | | | | | | | | Very good............|33.3% |37.2% |53.9% |43.5% |44.8% |50.0% |53.6% |56.3% |36.5% |40.3% |42.7% |39.6% |43.3% |40.0% |46.2% |44.1% | | Good.................|40.6% |37.2% |28.9% |36.5% |40.2% |23.9% |27.5% |31.3% |36.5% |32.8% |33.9% |33.7% |30.9% |32.0% |42.3% |33.4% | | Okay.................|21.7% |20.4% |14.5% |17.4% | 9.2% |14.8% |14.5% | 6.3% |19.2% |23.9% |18.5% |23.8% |20.6% |24.0% | 7.7% |17.9% | | Poor.................| 2.9% | 1.8% | 1.3% | 1.7% | 3.4% | 6.8% | 4.3% | 6.3% | 3.8% | 1.5% | 2.4% | 2.0% | 4.1% | | | 2.7% | | Very poor............| 1.4% | 3.5% | 1.3% | .9% | 2.3% | 4.5% | | | 3.8% | 1.5% | 2.4% | 1.0% | 1.0% | 4.0% | 3.8% | 2.0% | | | | | | | | | | | | | | | | | | | |Number................| 47 | 82 | 120 | 139 | 60 | 68 | 73 | 12 | 51 | 51 | 218 | 76 | 90 | 23 | 17 | 1127 | +----------------------+------+------+------+------+------+------+------+------+------+------+------+------+------+------+------+------+ |Buses clean * | | | | | | | | | | | | | | | | | | Very good............|30.8% |36.7% |34.9% |53.3% |50.5% |41.1% |58.7% |56.3% |53.6% |48.0% |38.9% |41.9% |47.0% |48.1% |32.4% |43.9% | | Good.................|47.4% |50.0% |47.0% |32.5% |35.5% |37.9% |26.7% |12.5% |30.4% |41.3% |38.9% |38.1% |39.0% |40.7% |56.8% |39.0% | | Okay.................|21.8% |11.7% |16.9% |11.7% |12.9% |16.8% |13.3% |31.3% |16.1% |10.7% |21.4% |15.2% |14.0% |11.1% | 8.1% |15.7% | | Poor.................| | .8% | 1.2% | 2.5% | 1.1% | 3.2% | 1.3% | | | | .8% | 1.9% | | | | 1.1% | | Very poor............| | .8% | | | | 1.1% | | | | | | 2.9% | | | 2.7% | .4% | | | | | | | | | | | | | | | | | | | |Number................| 54 | 88 | 131 | 145 | 64 | 73 | 80 | 12 | 55 | 57 | 231 | 79 | 93 | 25 | 25 | 1212 | +----------------------+------+------+------+------+------+------+------+------+------+------+------+------+------+------+------+------+ |Information on how to | | | | | | | | | | | | | | | | | | use service * | | | | | | | | | | | | | | | | | | Very good............|32.0% |42.7% |45.1% |45.5% |42.4% |48.9% |54.8% |50.0% |28.6% |36.1% |42.5% |46.6% |54.0% |40.7% |27.8% |43.9% | | Good.................|44.0% |37.6% |34.1% |35.5% |39.1% |31.8% |26.0% |37.5% |39.3% |40.3% |34.6% |32.0% |30.0% |40.7% |50.0% |35.2% | | Okay.................|20.0% |14.5% |18.3% |15.7% |16.3% |12.5% |13.7% |12.5% |21.4% |20.8% |15.0% |15.5% |13.0% |18.5% |13.9% |15.9% | | Poor.................| 4.0% | 4.3% | 1.2% | 2.5% | 2.2% | 4.5% | 5.5% | | 1.8% | 2.8% | 6.3% | 1.9% | 3.0% | | | 3.4% | | Very poor............| | .9% | 1.2% | .8% | | 2.3% | | | 8.9% | | 1.6% | 3.9% | | | 8.3% | 1.6% | | | | | | | | | | | | | | | | | | | |Number................| 52 | 85 | 129 | 147 | 63 | 68 | 78 | 12 | 55 | 55 | 224 | 78 | 93 | 25 | 24 | 1188 | +----------------------+------+------+------+------+------+------+------+------+------+------+------+------+------+------+------+------+ Column percentages * Difference is not statistically significant. (continued)

People Mover On Board Survey CRG Research December 2005 { PAGE }
TABLE C1.5 RATINGS OF THE PEOPLE MOVER BY ROUTE – PART TWO OF TWO +----------------------+--------------------------------------------------------------------------------------------------------+------+ | | Route: |Total | | +------+------+------+------+------+------+------+------+------+------+------+------+------+------+------+ | | | 1 | 2 | 3 | 7 | 8 | 9 | 13 | 14 | 15 | 36 | 45 | 60 | 75 | 77 | 102 | | +----------------------+------+------+------+------+------+------+------+------+------+------+------+------+------+------+------+------+ |Bus stops & transit | | | | | | | | | | | | | | | | | | centers clean: * | | | | | | | | | | | | | | | | | | Very good............|23.4% |29.4% |25.3% |47.9% |31.5% |40.6% |48.7% |56.3% |35.1% |33.8% |39.5% |32.0% |38.4% |38.5% |22.9% |36.6% | | Good.................|57.1% |42.9% |47.0% |35.5% |51.1% |41.7% |28.9% | 6.3% |35.1% |41.9% |38.8% |35.0% |44.4% |34.6% |31.4% |40.1% | | Okay.................|14.3% |19.3% |22.9% |14.0% |15.2% |13.5% |14.5% |31.3% |22.8% |20.3% |17.8% |24.3% |15.2% |26.9% |25.7% |18.3% | | Poor.................| 2.6% | 5.9% | 3.6% | 1.7% | 2.2% | 1.0% | 6.6% | 6.3% | 3.5% | 4.1% | 2.3% | 5.8% | 1.0% | | 8.6% | 3.2% | | Very poor............| 2.6% | 2.5% | 1.2% | .8% | | 3.1% | 1.3% | | 3.5% | | 1.6% | 2.9% | 1.0% | |11.4% | 1.8% | | | | | | | | | | | | | | | | | | | |Number................| 53 | 87 | 131 | 147 | 63 | 74 | 81 | 12 | 56 | 56 | 227 | 78 | 92 | 24 | 23 | 1204 | +----------------------+------+------+------+------+------+------+------+------+------+------+------+------+------+------+------+------+ |Dependable service, on| | | | | | | | | | | | | | | | | | time within 5 mins * | | | | | | | | | | | | | | | | | Very good............|19.2% |22.3% |24.1% |28.1% |24.2% |26.3% |34.7% |43.8% |26.3% |25.3% |19.1% |17.5% |30.3% |29.6% |16.2% |24.5% | | Good.................|35.9% |37.2% |28.9% |34.7% |40.7% |31.6% |28.0% |12.5% |36.8% |22.7% |32.1% |31.1% |32.3% |29.6% |48.6% |32.6% | | Okay.................|30.8% |28.9% |34.9% |26.4% |30.8% |29.5% |21.3% |18.8% |28.1% |41.3% |32.1% |34.0% |30.3% |37.0% |21.6% |30.5% | | Poor.................|11.5% | 8.3% | 7.2% | 9.1% | 3.3% | 5.3% |12.0% |25.0% | 3.5% | 6.7% |12.2% |13.6% | 5.1% | 3.7% | 5.4% | 8.8% | | Very poor............| 2.6% | 3.3% | 4.8% | 1.7% | 1.1% | 7.4% | 4.0% | | 5.3% | 4.0% | 4.6% | 3.9% | 2.0% | | 8.1% | 3.7% | | | | | | | | | | | | | | | | | | | |Number................| 54 | 88 | 131 | 147 | 62 | 73 | 80 | 12 | 56 | 57 | 231 | 78 | 92 | 25 | 25 | 1211 | +----------------------+------+------+------+------+------+------+------+------+------+------+------+------+------+------+------+------+ Column percentages * Difference is not statistically significant.

People Mover On Board Survey CRG Research December 2005 { PAGE }
TABLE C1.6 FREQUENCY OF USE AND AVAILABILITY OF PRIVATE VEHICLES BY ROUTE +-------------------+--------------------------------------------------------------------------------------------------------+------+ | | Route: |Total | | +------+------+------+------+------+------+------+------+------+------+------+------+------+------+------+ | | | 1 | 2 | 3 | 7 | 8 | 9 | 13 | 14 | 15 | 36 | 45 | 60 | 75 | 77 | 102 | | +-------------------+------+------+------+------+------+------+------+------+------+------+------+------+------+------+------+------+ |Usually ride bus:* | | | | | | | | | | | | | | | | | | Seven days a week.|35.1% |42.0% |31.3% |33.6% |29.3% |37.4% |37.3% |46.7% |32.7% |27.8% |42.6% |37.9% |40.0% |18.5% |24.3% |36.1% | | Five or six days..|41.6% |36.1% |33.8% |40.3% |39.1% |42.9% |38.7% |20.0% |27.3% |40.3% |30.2% |27.2% |31.6% |37.0% |35.1% |34.9% | | Three or four | | | | | | | | | | | | | | | | | | days............|13.0% |12.6% |23.8% |15.1% |17.4% |13.2% |20.0% | 6.7% |18.2% |19.4% |17.1% |20.4% |18.9% |29.6% |35.1% |18.1% | | Once, twice or | | | | | | | | | | | | | | | | | | monthly.........|10.4% | 9.2% |11.3% |10.9% |14.1% | 6.6% | 4.0% |26.7% |21.8% |12.5% |10.1% |14.6% | 9.5% |14.8% | 5.4% |10.9% | | | | | | | | | | | | | | | | | | | |Number.............| 53 | 87 | 126 | 144 | 63 | 70 | 80 | 12 | 54 | 55 | 227 | 78 | 88 | 25 | 25 | 1187 | +-------------------+------+------+------+------+------+------+------+------+------+------+------+------+------+------+------+------+ |Vehicles available:| | | | | | | | | | | | | | | | | | None..............|69.9% |65.5% |65.4% |68.9% |51.1% |64.2% |58.7% |66.7% |60.0% |61.3% |61.8% |63.1% |49.0% |44.4% |32.4% |61.1% | | One...............|20.5% |22.7% |25.9% |18.5% |30.0% |20.0% |33.3% |20.0% |29.1% |30.7% |26.8% |28.2% |28.6% |11.1% |40.5% |25.7% | | Two...............| 5.5% | 7.6% | 7.4% | 9.2% |14.4% |11.6% | 6.7% | 6.7% |10.9% | 4.0% | 8.1% | 4.9% |16.3% |29.6% |18.9% | 9.5% | | Three.............| 2.7% | 1.7% | 1.2% | 2.5% | 1.1% | 2.1% | | | | 4.0% | 1.6% | 3.9% | 2.0% | 3.7% | 8.1% | 2.0% | | Four or more......| 1.4% | 2.5% | | .8% | 3.3% | 2.1% | 1.3% | 6.7% | | | 1.6% | | 4.1% |11.1% | | 1.7% | | | | | | | | | | | | | | | | | | | |Number.............| 50 | 87 | 127 | 144 | 62 | 73 | 80 | 12 | 54 | 57 | 217 | 78 | 91 | 25 | 25 | 1182 | +-------------------+------+------+------+------+------+------+------+------+------+------+------+------+------+------+------+------+ |Licensed drivers in| | | | | | | | | | | | | | | | | | household: | | | | | | | | | | | | | | | | | | None..............|31.2% |27.1% |34.1% |30.3% |32.6% |40.0% |39.2% |33.3% |40.0% |21.6% |44.4% |28.2% |30.5% |29.6% |24.3% |34.3% | | One...............|31.2% |46.6% |35.4% |39.5% |30.4% |24.2% |43.2% |40.0% |23.6% |41.9% |34.9% |38.8% |43.2% |29.6% |24.3% |36.3% | | Two...............|28.6% |15.3% |24.4% |18.5% |27.2% |23.2% |12.2% |13.3% |32.7% |24.3% |13.5% |20.4% |18.9% |11.1% |40.5% |20.1% | | Three.............| 7.8% | 8.5% | 6.1% | 5.9% | 8.7% | 8.4% | 1.4% | 6.7% | | 8.1% | 3.2% | 6.8% | 5.3% |25.9% | 8.1% | 6.0% | | Four or more......| 1.3% | 2.5% | | 5.9% | 1.1% | 4.2% | 4.1% | 6.7% | 3.6% | 4.1% | 4.0% | 5.8% | 2.1% | 3.7% | 2.7% | 3.4% | | | | | | | | | | | | | | | | | | | |Number.............| 53 | 86 | 129 | 144 | 63 | 73 | 79 | 12 | 54 | 56 | 222 | 78 | 88 | 25 | 25 | 1187 | +-------------------+------+------+------+------+------+------+------+------+------+------+------+------+------+------+------+------+ Column percentages * Difference is not statistically significant.

People Mover On Board Survey CRG Research December 2005 { PAGE }
TABLE C1.7 EMPLOYMENT DETAILS BY ROUTE +-------------------+--------------------------------------------------------------------------------------------------------+------+ | | Route: |Total | | +------+------+------+------+------+------+------+------+------+------+------+------+------+------+------+ | | | 1 | 2 | 3 | 7 | 8 | 9 | 13 | 14 | 15 | 36 | 45 | 60 | 75 | 77 | 102 | | +-------------------+------+------+------+------+------+------+------+------+------+------+------+------+------+------+------+------+ |Employed: | | | | | | | | | | | | | | | | | | 1 to 3 days.......|14.3% | 5.0% | 4.9% | 6.8% | 8.0% | 7.5% | 5.5% | | 7.4% | 8.0% | 8.3% | 1.9% | 8.0% | 7.4% | 5.4% | 6.9% | | 5-7 days..........|50.6% |55.4% |51.9% |61.5% |36.8% |55.9% |39.7% |53.3% |46.3% |54.7% |37.1% |60.6% |45.0% |44.4% |62.2% |49.0% | | Not employed......|35.1% |39.7% |43.2% |31.6% |55.2% |36.6% |54.8% |46.7% |46.3% |37.3% |54.5% |37.5% |47.0% |48.1% |32.4% |44.1% | | | | | | | | | | | | | | | | | | | |Number.............| 53 | 88 | 127 | 142 | 60 | 72 | 78 | 12 | 53 | 57 | 233 | 79 | 93 | 25 | 25 | 1197 | +-------------------+------+------+------+------+------+------+------+------+------+------+------+------+------+------+------+------+ |Hourly wages: | | | | | | | | | | | | | | | | | | Less than $10.....|38.3% |37.3% |38.1% |43.8% |50.0% |49.1% |43.8% |62.5% |48.3% |34.1% |31.5% |38.2% |37.5% |41.7% |16.7% |39.4% | | $10 to $20........|48.9% |52.2% |40.5% |45.2% |44.4% |36.4% |46.9% |37.5% |41.4% |56.8% |51.9% |52.7% |52.1% |41.7% |33.3% |46.9% | | $21 to $30........| 2.1% | 6.0% | 7.1% | 8.2% | 5.6% | 7.3% | 9.4% | | | 9.1% |16.7% | 5.5% | 8.3% |16.7% |25.0% | 8.8% | | More..............|10.6% | 4.5% |14.3% | 2.7% | | 7.3% | | |10.3% | | | 3.6% | 2.1% | |25.0% | 4.9% | | | | | | | | | | | | | | | | | | | |Number.............| 32 | 49 | 66 | 88 | 25 | 42 | 34 | 6 | 28 | 33 | 95 | 42 | 45 | 11 | 16 | 612 | +-------------------+------+------+------+------+------+------+------+------+------+------+------+------+------+------+------+------+ |Bus to work: | | | | | | | | | | | | | | | | | | None..............| | | 2.8% | 1.5% |10.7% | 5.9% | 3.7% | | 4.0% | | 6.2% | 4.0% | 2.2% | | | 3.1% | | One...............| 5.1% | 4.7% | 2.8% | | 3.6% | 7.8% | 3.7% | |16.0% | 5.1% |10.4% | 6.0% | 6.5% | | | 5.3% | | Two...............| 7.7% | 7.8% |13.9% | 7.4% |14.3% | 2.0% | | | |12.8% | 6.2% | | |20.0% | | 6.2% | | Three.............| 7.7% | 6.3% | 8.3% | 7.4% |14.3% | 7.8% | 7.4% | |12.0% | 5.1% |12.5% |10.0% |15.2% | |24.0% | 9.6% | | Five..............|46.2% |48.4% |50.0% |58.8% |46.4% |43.1% |55.6% |50.0% |40.0% |59.0% |27.1% |42.0% |47.8% |60.0% |72.0% |47.3% | | Six...............|15.4% |17.2% |11.1% |13.2% | 3.6% |15.7% |14.8% |37.5% |20.0% | 5.1% | 8.3% |24.0% |15.2% |10.0% | 4.0% |13.3% | | Seven.............|17.9% |15.6% |11.1% |11.8% | 7.1% |17.6% |14.8% |12.5% | 8.0% |12.8% |29.2% |14.0% |13.0% |10.0% | |15.2% | | | | | | | | | | | | | | | | | | | |Number.............| 27 | 47 | 57 | 82 | 19 | 39 | 29 | 6 | 24 | 30 | 85 | 38 | 43 | 9 | 17 | 552 | +-------------------+------+------+------+------+------+------+------+------+------+------+------+------+------+------+------+------+ Column percentages * Difference is not statistically significant.
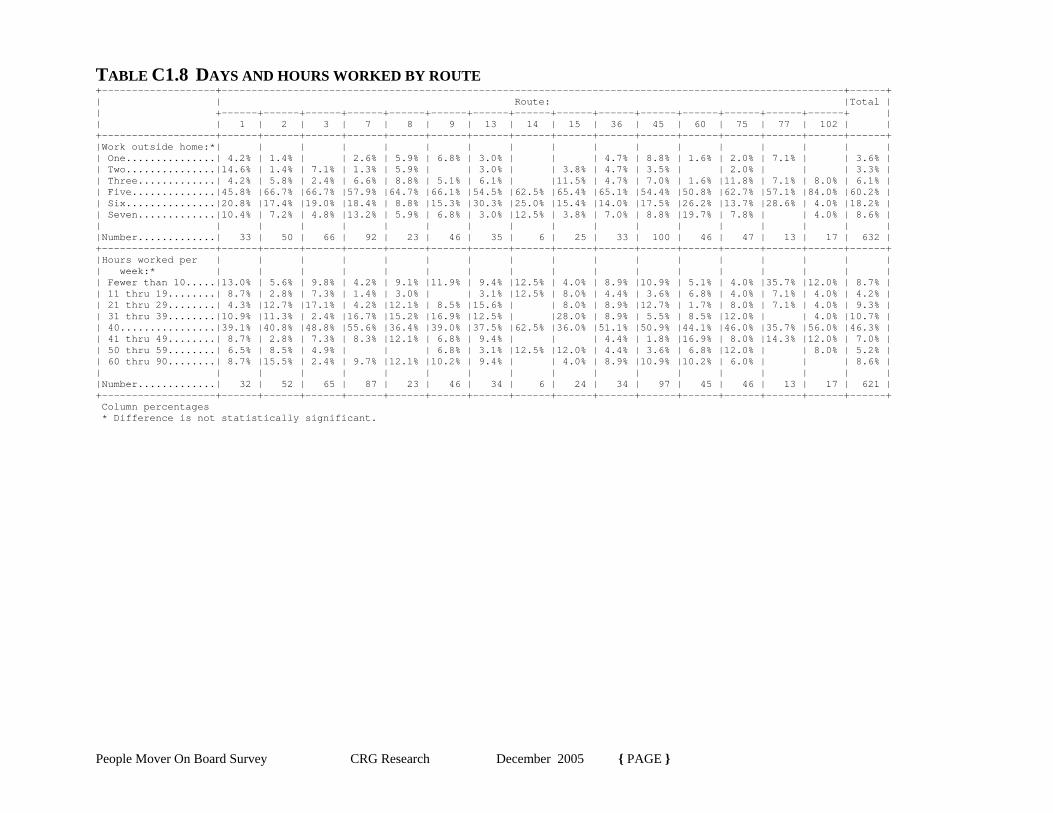
People Mover On Board Survey CRG Research December 2005 { PAGE }
TABLE C1.8 DAYS AND HOURS WORKED BY ROUTE +-------------------+--------------------------------------------------------------------------------------------------------+------+ | | Route: |Total | | +------+------+------+------+------+------+------+------+------+------+------+------+------+------+------+ | | | 1 | 2 | 3 | 7 | 8 | 9 | 13 | 14 | 15 | 36 | 45 | 60 | 75 | 77 | 102 | | +-------------------+------+------+------+------+------+------+------+------+------+------+------+------+------+------+------+------+ |Work outside home:*| | | | | | | | | | | | | | | | | | One...............| 4.2% | 1.4% | | 2.6% | 5.9% | 6.8% | 3.0% | | | 4.7% | 8.8% | 1.6% | 2.0% | 7.1% | | 3.6% | | Two...............|14.6% | 1.4% | 7.1% | 1.3% | 5.9% | | 3.0% | | 3.8% | 4.7% | 3.5% | | 2.0% | | | 3.3% | | Three.............| 4.2% | 5.8% | 2.4% | 6.6% | 8.8% | 5.1% | 6.1% | |11.5% | 4.7% | 7.0% | 1.6% |11.8% | 7.1% | 8.0% | 6.1% | | Five..............|45.8% |66.7% |66.7% |57.9% |64.7% |66.1% |54.5% |62.5% |65.4% |65.1% |54.4% |50.8% |62.7% |57.1% |84.0% |60.2% | | Six...............|20.8% |17.4% |19.0% |18.4% | 8.8% |15.3% |30.3% |25.0% |15.4% |14.0% |17.5% |26.2% |13.7% |28.6% | 4.0% |18.2% | | Seven.............|10.4% | 7.2% | 4.8% |13.2% | 5.9% | 6.8% | 3.0% |12.5% | 3.8% | 7.0% | 8.8% |19.7% | 7.8% | | 4.0% | 8.6% | | | | | | | | | | | | | | | | | | | |Number.............| 33 | 50 | 66 | 92 | 23 | 46 | 35 | 6 | 25 | 33 | 100 | 46 | 47 | 13 | 17 | 632 | +-------------------+------+------+------+------+------+------+------+------+------+------+------+------+------+------+------+------+ |Hours worked per | | | | | | | | | | | | | | | | | | week:* | | | | | | | | | | | | | | | | | | Fewer than 10.....|13.0% | 5.6% | 9.8% | 4.2% | 9.1% |11.9% | 9.4% |12.5% | 4.0% | 8.9% |10.9% | 5.1% | 4.0% |35.7% |12.0% | 8.7% | | 11 thru 19........| 8.7% | 2.8% | 7.3% | 1.4% | 3.0% | | 3.1% |12.5% | 8.0% | 4.4% | 3.6% | 6.8% | 4.0% | 7.1% | 4.0% | 4.2% | | 21 thru 29........| 4.3% |12.7% |17.1% | 4.2% |12.1% | 8.5% |15.6% | | 8.0% | 8.9% |12.7% | 1.7% | 8.0% | 7.1% | 4.0% | 9.3% | | 31 thru 39........|10.9% |11.3% | 2.4% |16.7% |15.2% |16.9% |12.5% | |28.0% | 8.9% | 5.5% | 8.5% |12.0% | | 4.0% |10.7% | | 40................|39.1% |40.8% |48.8% |55.6% |36.4% |39.0% |37.5% |62.5% |36.0% |51.1% |50.9% |44.1% |46.0% |35.7% |56.0% |46.3% | | 41 thru 49........| 8.7% | 2.8% | 7.3% | 8.3% |12.1% | 6.8% | 9.4% | | | 4.4% | 1.8% |16.9% | 8.0% |14.3% |12.0% | 7.0% | | 50 thru 59........| 6.5% | 8.5% | 4.9% | | | 6.8% | 3.1% |12.5% |12.0% | 4.4% | 3.6% | 6.8% |12.0% | | 8.0% | 5.2% | | 60 thru 90........| 8.7% |15.5% | 2.4% | 9.7% |12.1% |10.2% | 9.4% | | 4.0% | 8.9% |10.9% |10.2% | 6.0% | | | 8.6% | | | | | | | | | | | | | | | | | | | |Number.............| 32 | 52 | 65 | 87 | 23 | 46 | 34 | 6 | 24 | 34 | 97 | 45 | 46 | 13 | 17 | 621 | +-------------------+------+------+------+------+------+------+------+------+------+------+------+------+------+------+------+------+ Column percentages * Difference is not statistically significant.

People Mover On Board Survey CRG Research December 2005 { PAGE }
TABLE C1.9 STARTING AND ENDING TIMES BY ROUTE +-------------------+--------------------------------------------------------------------------------------------------------+------+ | | Route: |Total | | +------+------+------+------+------+------+------+------+------+------+------+------+------+------+------+ | | | 1 | 2 | 3 | 7 | 8 | 9 | 13 | 14 | 15 | 36 | 45 | 60 | 75 | 77 | 102 | | +-------------------+------+------+------+------+------+------+------+------+------+------+------+------+------+------+------+------+ |Starting times: | | | | | | | | | | | | | | | | | | 7:00 PM to 6:59 AM|15.9% | 7.6% | 4.8% |12.9% |15.2% |21.4% | 6.3% | |25.9% | 6.8% |25.0% |26.8% |10.6% | | 8.3% |14.4% | | 7:00 AM to 8:59 AM|22.7% |45.5% |38.1% |24.3% |30.3% |33.9% |34.4% |37.5% |40.7% |52.3% |40.4% |39.3% |55.3% |57.1% |75.0% |39.1% | | 9:00 AM to 11:59 | | | | | | | | | | | | | | | | | | AM..............|27.3% |27.3% |38.1% |40.0% |24.2% |28.6% |31.3% |25.0% |18.5% |31.8% |13.5% |17.9% |19.1% | 7.1% | 8.3% |26.0% | | 12:00 N to 6:59 | | | | | | | | | | | | | | | | | | PM..............|34.1% |19.7% |19.0% |22.9% |30.3% |16.1% |28.1% |37.5% |14.8% | 9.1% |21.2% |16.1% |14.9% |35.7% | 8.3% |20.4% | | | | | | | | | | | | | | | | | | | |Number.............| 30 | 48 | 66 | 85 | 23 | 43 | 34 | 6 | 26 | 33 | 92 | 42 | 44 | 13 | 16 | 601 | +-------------------+------+------+------+------+------+------+------+------+------+------+------+------+------+------+------+------+ |Ending times: * | | | | | | | | | | | | | | | | | | 1:00 AM to 3:59 PM|18.2% |21.5% |17.9% |17.1% |24.2% |20.4% |22.6% |37.5% |14.8% |11.6% |19.6% |25.0% | 4.3% |21.4% |16.0% |18.3% | | 4:00 PM to 5:59 PM|25.0% |32.3% |38.5% |30.0% |30.3% |44.4% |38.7% |25.0% |48.1% |44.2% |45.1% |41.1% |67.4% |42.9% |56.0% |40.7% | | 6:00 PM to 8:59 PM|31.8% |24.6% |30.8% |34.3% |24.2% |22.2% |19.4% |12.5% |25.9% |25.6% |19.6% |17.9% |15.2% |14.3% |16.0% |24.1% | | 9:00 PM to 12:59 | | | | | | | | | | | | | | | | | | AM..............|25.0% |21.5% |12.8% |18.6% |21.2% |13.0% |19.4% |25.0% |11.1% |18.6% |15.7% |16.1% |13.0% |21.4% |12.0% |16.9% | | | | | | | | | | | | | | | | | | | |Number.............| 30 | 47 | 61 | 85 | 23 | 42 | 33 | 6 | 26 | 33 | 90 | 42 | 43 | 13 | 17 | 591 | +-------------------+------+------+------+------+------+------+------+------+------+------+------+------+------+------+------+------+ |Working days: # | | | | | | | | | | | | | | | | | | Monday to Friday..|93.6% |98.6% |97.8% |96.1% |94.4% | 100% | 100% | 100% |93.1% |95.5% |93.1% |98.4% | 100% |92.9% | 100% |96.7% | | Saturday..........|53.2% |57.1% |53.3% |55.8% |36.1% |39.0% |45.5% |75.0% |51.7% |43.2% |48.3% |65.6% |49.0% |21.4% |16.0% |49.7% | | Sunday............|51.1% |40.0% |40.0% |44.2% |30.6% |30.5% |24.2% |37.5% |44.8% |40.9% |39.7% |50.8% |47.1% | 7.1% |16.0% |39.5% | | | | | | | | | | | | | | | | | | | |Number.............| 32 | 51 | 71 | 93 | 25 | 46 | 35 | 6 | 28 | 33 | 102 | 46 | 47 | 13 | 17 | 645 | +-------------------+------+------+------+------+------+------+------+------+------+------+------+------+------+------+------+------+ Column percentages * Difference is not statistically significant. # Statistical significance cannot be computed for multiple response questions.

People Mover On Board Survey CRG Research December 2005 { PAGE }
TABLE C1.10 DEMOGRAPHICS BY ROUTE +-------------------+--------------------------------------------------------------------------------------------------------+------+ | | Route: |Total | | +------+------+------+------+------+------+------+------+------+------+------+------+------+------+------+ | | | 1 | 2 | 3 | 7 | 8 | 9 | 13 | 14 | 15 | 36 | 45 | 60 | 75 | 77 | 102 | | +-------------------+------+------+------+------+------+------+------+------+------+------+------+------+------+------+------+------+ |Gender: | | | | | | | | | | | | | | | | | | Male..............|57.1% |60.5% |53.7% |56.8% |37.4% |57.4% |50.0% |43.8% |77.4% |57.5% |62.0% |61.2% |57.4% |69.2% |43.2% |57.4% | | Female............|42.9% |39.5% |46.3% |43.2% |62.6% |42.6% |50.0% |56.3% |22.6% |42.5% |38.0% |38.8% |42.6% |30.8% |56.8% |42.6% | | | | | | | | | | | | | | | | | | | |Number.............| 53 | 87 | 129 | 143 | 62 | 73 | 79 | 12 | 52 | 55 | 227 | 74 | 94 | 24 | 25 | 1189 | +-------------------+------+------+------+------+------+------+------+------+------+------+------+------+------+------+------+------+ |Age: | | | | | | | | | | | | | | | | | | Under 24..........|40.5% |25.4% |25.9% |18.9% |41.1% |16.9% |17.1% |20.0% |20.0% |22.2% |17.9% |18.5% |16.7% |32.0% | 5.9% |21.9% | | 25 to 34..........|17.6% |12.3% | 9.9% |18.0% |18.9% |23.6% | 7.1% |26.7% |10.0% |25.0% |12.2% |10.9% |18.8% |24.0% | 5.9% |14.8% | | 35 to 44..........|18.9% |28.1% |21.0% |22.5% |18.9% |23.6% |27.1% |20.0% |36.0% |29.2% |30.1% |21.7% |25.0% | 8.0% |32.4% |25.1% | | 45 to 54..........|17.6% |22.8% |25.9% |25.2% | 8.9% |20.2% |21.4% |26.7% |22.0% |18.1% |25.2% |28.3% |22.9% |20.0% |32.4% |22.9% | | 55 to 84..........| 5.4% |11.4% |17.3% |15.3% |12.2% |15.7% |27.1% | 6.7% |12.0% | 5.6% |14.6% |20.7% |16.7% |16.0% |23.5% |15.2% | | | | | | | | | | | | | | | | | | | |Number.............| 51 | 83 | 127 | 135 | 62 | 69 | 75 | 12 | 49 | 55 | 217 | 70 | 89 | 23 | 23 | 1140 | +-------------------+------+------+------+------+------+------+------+------+------+------+------+------+------+------+------+------+ |Ethnicity: | | | | | | | | | | | | | | | | | | White.............|44.4% |41.4% |34.6% |43.0% |34.8% |34.5% |38.0% |57.1% |35.8% |45.6% |22.8% |37.6% |38.5% |58.3% |54.3% |36.6% | | Alaskan Native....|20.8% |21.6% |35.9% |27.2% |41.6% |42.9% |28.2% |28.6% |35.8% |22.1% |48.0% |22.6% |33.3% |20.8% |20.0% |33.4% | | African American..|12.5% |12.9% |12.8% |13.2% | 5.6% | 4.8% |14.1% | 7.1% | 7.5% |14.7% | 9.4% |11.8% |14.6% | | 8.6% |11.0% | | Other & mixed.....|22.2% |24.1% |16.7% |16.7% |18.0% |17.9% |19.7% | 7.1% |20.8% |17.6% |19.7% |28.0% |13.5% |20.8% |17.1% |19.1% | | | | | | | | | | | | | | | | | | | |Number.............| 50 | 85 | 123 | 138 | 61 | 65 | 76 | 11 | 52 | 52 | 224 | 70 | 89 | 22 | 23 | 1141 | +-------------------+------+------+------+------+------+------+------+------+------+------+------+------+------+------+------+------+ |Income: | | | | | | | | | | | | | | | | | | Less than $10,000.|24.3% |31.2% |29.9% |37.7% |31.6% |29.4% |35.8% |42.9% |36.2% |30.3% |54.4% |34.4% |38.5% |22.7% |28.6% |37.3% | | $10,000 to $19,999|40.0% |34.9% |37.7% |32.1% |22.8% |32.9% |29.9% |35.7% |36.2% |27.3% |24.0% |31.1% |28.6% |18.2% | 5.7% |29.9% | | $20,000 to $34,999|21.4% |15.6% |23.4% |17.0% |22.8% |20.0% |19.4% | 7.1% |14.9% |27.3% |15.2% |21.1% |12.1% |27.3% |14.3% |18.4% | | More..............|14.3% |18.3% | 9.1% |13.2% |22.8% |17.6% |14.9% |14.3% |12.8% |15.2% | 6.4% |13.3% |20.9% |31.8% |51.4% |14.5% | | | | | | | | | | | | | | | | | | | |Number.............| 48 | 80 | 121 | 128 | 54 | 66 | 71 | 11 | 46 | 50 | 220 | 68 | 84 | 20 | 23 | 1090 | +-------------------+------+------+------+------+------+------+------+------+------+------+------+------+------+------+------+------+ Column percentages