pepfar hepatitis b co-infection and response to antiretroviral therapy among hiv-infected patients...
TRANSCRIPT

PEPFAR
Hepatitis B co-infection and Response to Antiretroviral Therapy
among HIV-infected Patients in Tanzania
Oral abstract # MOAB0101 C. Hawkins, B. Christian, J. Ye, T. Nagu, E. Aris, G.
Chalamilla, D. Spiegelman, F, Mugusi, S. Mehta, W. Fawzi
AIDS 2012 - Turning the Tide TogetherPresented in part as an Oral presentation at the 17th Conference on Retroviruses and Opportunistic Infections, San Francisco, Feb 16-19th, 2010
Introduction
• Approximately 6-20% of HIV-infected individuals co-infected with chronic Hepatitis B (HBV) in Sub-Saharan Africa (SSA)
• HIV/HBV co-infection associated with– Decreased spontaneous clearance of HBsAg and
HBeAg– Faster progression to cirrhosis and hepatocellular
carcinoma– Higher liver-related mortality

Introduction
• The effect of HIV/HBV co-infection on antiretroviral treatment responses is unclear:– Impaired virologic, clinical and immunologic
outcomes (Sheng et al. 2004, Hoffman et al. 2009)– Minimal or no impact of HBV co-infection on ART
responses (Hoffman et al. 2008, Konopnicki D et al. 2005, Lincoln et al. 2003)
• Very few studies of HIV/HBV co-infection in SSA where both HIV and HBV highly endemic

Objectives
• Assess the prevalence of HBV in cohort of HIV-infected adults in urban Tanzania
• Compare immunologic and clinical outcomes after ART initiation between HIV mono-infected (HIV) and HIV/HBV co-infected (HIV/HBV) individuals
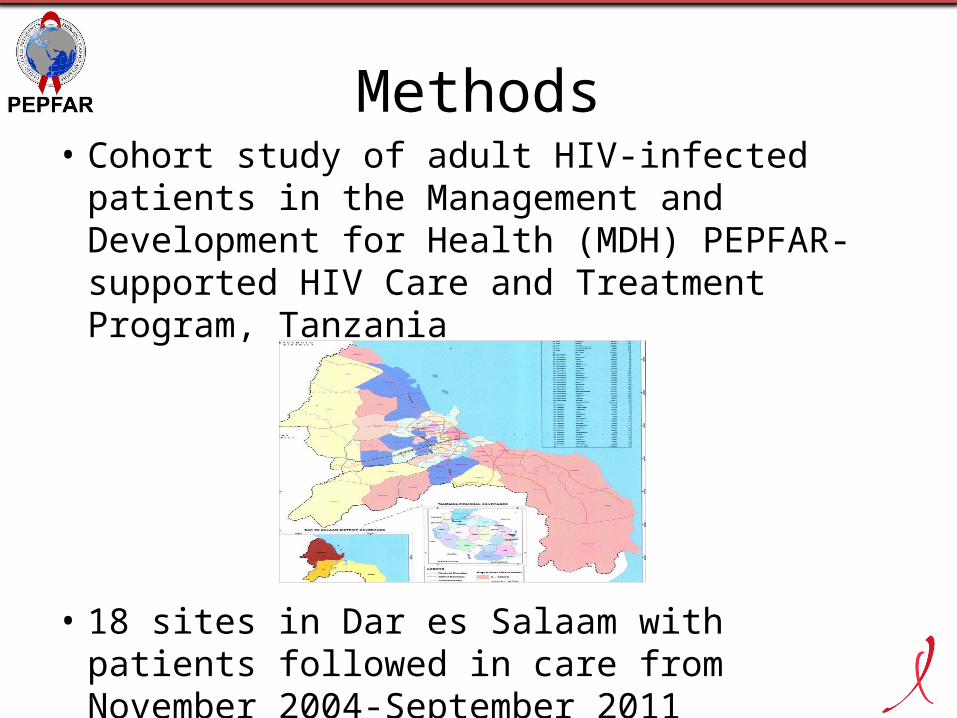
Methods• Cohort study of adult HIV-infected patients in
the Management and Development for Health (MDH) PEPFAR- supported HIV Care and Treatment Program, Tanzania
• 18 sites in Dar es Salaam with patients followed in care from November 2004-September 2011

Methods
• All patients receive HIV Care and Treatment per National Tanzanian and WHO guidelines
• Standard first-line ART– d4T or AZT + 3TC + EFV or NVP– TDF +3TC or FTC+ EFV or NVP preferred for HIV/HBV (2008)
• Comprehensive electronic database captures detailed information on clinical diagnoses, antiretroviral therapy, CD4+ cell counts, alanine aminotransferase (ALT), hemoglobin (Hgb), HBsAg, HCV antibody.

Methods
• Inclusions:– HBsAg +– Age>15– ART naïve– Not pregnant at ART initiation
• Exclusions:– Co-infection with HBV and chronic HCV* (HCV Ab +)– HBV status unknown
* HCV antibody testing was not performed in 53% of study participants

Methods: analysis
• Changes in CD4+ cell count over time• generalized estimating equations and robust
regression• Incidence of mortality and liver enzyme elevation
(hepatotoxicity)*• events/100 person-years• Cox proportional hazards models to examine HBV
co-infection in HIV-infected patients in relationship to mortality and hepatotoxicity outcomes
*Hepatotoxicity defined as ALT >40 U/l, >3X ULN (120 U/l) and >5X ULN (>200 U/l)

Results: study population
HIV HIV/HBV p-valueOverall 16460 1079
Age (years) 37 (31-44) 36 (31-41) 0.008
Male sex, % 34 50 <0.0001
*CD4 (cells/μL) 116 (47-190) 101 (41-179) 0.003
*Hemoglobin (g/dl)
10.2 (8.8-11.5) 10.4 (8.8-12.0) 0.006
BMI 20.1 (17.9-22.9) 19.8 (17.9-22.2) 0.007
ALT ( IU/L) 21 (14.6-32) 26.5 (17.2-42) <0.0001
ALT ( IU/L) > 40, % 16 29 <0.0001
Values are median (interquartile) or percentages* variables for which >5% of data missing

Results: study populationHIV HIV/HBV p-value
Overall 16460 1079WHO Stage
I, % II, % III, % IV, %
6165820
5165326
<0.0001
Current TB treatment, %
17.3 10 0.04
*Current alcohol intake, %
3.25 6.60 0.09
*ART contains tenofovir,%
3.1 17.0 0.27
ART duration, mon 18.6 (4.9-29.5) 18.2 (4.2-27.2) 0.08
Values are median (interquartile) or percentages*variables for which >5% of data missing

Results: Risk of mortalityHIV HIV/HBV p-value
Number of deaths/PY
1572/25,494 130/1635
Incidence rate
(event/100 PY)
6.16 (95% CI 5.79, 6.53)
7.74(95% CI 6.16, 9,33)
Unadjusted HR (95% CI)
1.00 1.28 (1.07, 1.53) 0.007
Adjusted* HR (95% CI)
1.00 1.18 (0.98, 1.42) 0.07
*covariates -gender, age, WHO HIV Disease Stage, hemoglobin level (g/dL), CD4+ cell count (cells/μL), ALT greater than 200 IU/L, BMI (kg/m2) , current TB, all at year of initiation as well as year of ARV initiation

Results: cumulative incidence of all cause mortality

Results: cumulative incidence of all cause mortality

Results: mean changes in CD4+ cell count from baseline
Month Group Mean (SEM) of change
p-value (adjusted)*
6HIV 77 (1.5)
0.46HIV/HBV 71 (5.9)
12HIV 158 (2.1)
0.05HIV/HBV 143 (7.6)*adjusted for gender, age, WHO HIV Disease Stage, hemoglobin level (g/dL), BMI (kg/m2)
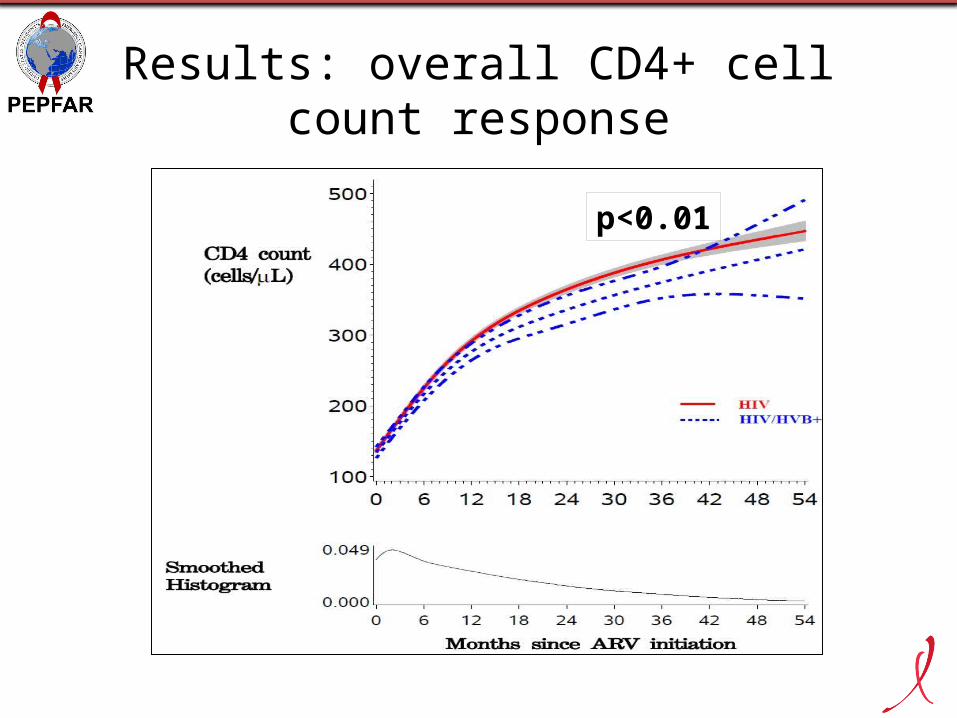
Results: overall CD4+ cell count response
p<0.01

HIV HIV/HBV p-value
Number with ALT>120/PY
322/24639 40/1507
Incidence rate (event/100 PY)
1.29, (95% CI 1.12-1.46 ) 2.49, (95% CI 1.55-3.43 )
Unadjusted HR (95% CI) 1.00 1.99 (1.43, 2.77) <0.001
Adjusted* HR (95% CI) 1.00 1.76 (1.26, 2.46) 0.0009
Number with ALT>200/PY
110/25,246 19/1589
Incidence rate (event/100 PY)
0.43, (95% CI 0.33-0.53) 1.16, (95% CI 0.52-1.80)
Unadjusted HR (95% CI) 1.00 2.70 (1.66, 4.40) <0.001
Adjusted* HR (95% CI) 1.00 2.30 (1.39, 3.81) 0.001
Results: Risk of hepatotoxicity
Patients with the event at baseline were excluded* adjusted for gender, age, WHO HIV Disease Stage, Hemoglobin level (g/dL), CD4+ cell count (cells/μL), BMI (kg/m2) , current TB, NVP use, all at year of initiation, as well as year of ARV initiation

Results: Cumulative incidence of moderate-severe hepatotoxicity

Strengths and limitations
• Large cohort in SSA examining the effect of HBV on HIV treatment outcomes
• Long duration of follow up, comprehensive data on important confounders (TB therapy, alcohol), death
• Lack of HBV serologic and virologic data (HBeAg, HBV DNA)
• HIV virologic endpoints not assessed• Specific causes of death not examined

Conclusions
• Prevalence of HIV/HBV co-infection (6.2%) in this Tanzanian cohort relatively high
• Antiretroviral treatment outcomes are impacted by the presence of HBV• Lower CD4+ counts throughout immune
restoration• almost 20% higher* risk of mortality • higher risk of moderate-severe hepatotoxicity
*p=0.07

Further study
• Causes of death –do our results suggest a shift towards more non-AIDS related mortality in SSA?
• Mechanisms involved in HBV and HIV-related immune-suppression and any effect on long-term morbidity and mortality?
• Etiology of hepatotoxic events and effect (if any) on long-term liver disease progression
• The impact of long-term suppressive HBV therapy on these outcomes with agents that are more durable than lamivudine (such as tenofovir)

Acknowledgements
• Co-authors and MDH Management• All study participants• HSPH Data managers• Wafaie Fawzi (HSPH), Chloe Thio (JHI), Robert
Murphy (NU)This research was supported by the President’s Emergency Plan for AIDS Relief (PEPFAR) through HRSA under the terms of grant number U51HA02522 through the Harvard School of Public HealthThe speaker has no conflicts of interest to declare.

Results: risk of mortality by ARV regimen (contains TDF vs. not)
* Note, ALL regimens contained LAM
Outcome ARV regimen Events
/Number at risk
MultivariateInteraction p
value TDF/HBV
statusHR for HBV status p-value
MortalityIncluded
TDF 59/573 0.70 (0.34, 1.44) 0.33
0.30
Did not include TDF 1244/14031 1.28 (1.02,
1.61) 0.03