pepfar strategic information and public health...
TRANSCRIPT
CDC’s Role in
PEPFAR Strategic Information and
Public Health Evaluation
Institute of Medicine
January 7, 2010
William C. Levine, MD, MSc
Global AIDS Program
CDC, Atlanta
2
Overview
Country-level and headquarters approaches toward
strategic information and PHE implementation
Examples:
PMTCT in Botswana
ART Track 1.0 and ART costing
I-RARE in South Africa
Kenya AIDS Indicator Survey
CDC Global AIDS Program (GAP) priorities and
contributions in support of PEPFAR

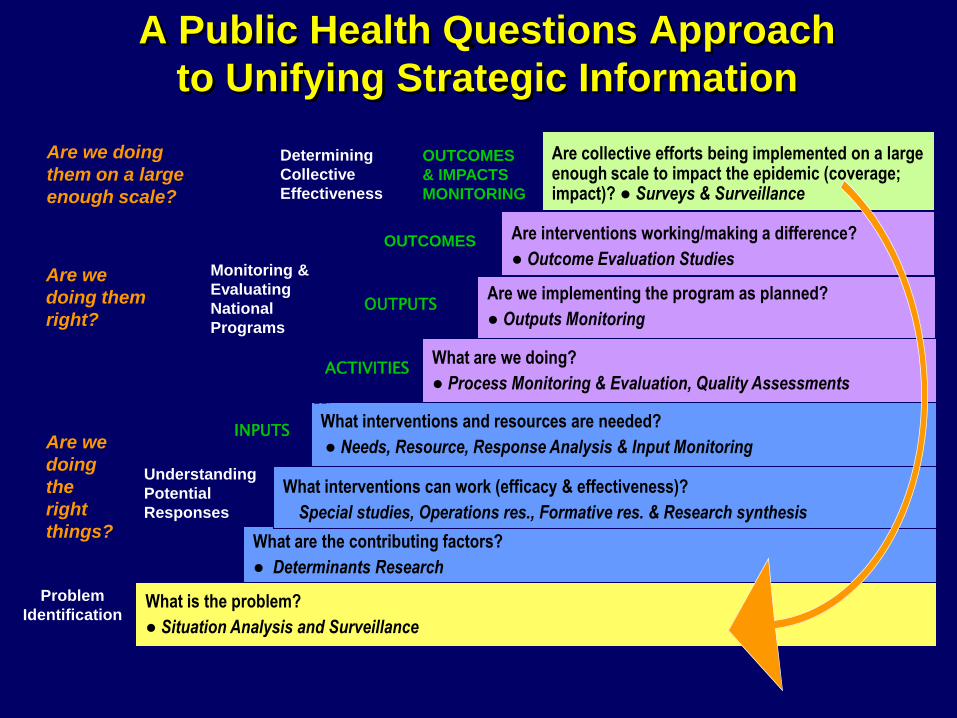
What is the problem?
● Situation Analysis and Surveillance
What are the contributing factors?
● Determinants Research
What interventions and resources are needed?
● Needs, Resource, Response Analysis & Input Monitoring
What interventions can work (efficacy & effectiveness)?
Special studies, Operations res., Formative res. & Research synthesis
Are we implementing the program as planned?
● Outputs Monitoring
What are we doing?
● Process Monitoring & Evaluation, Quality Assessments
Are interventions working/making a difference?
● Outcome Evaluation Studies
Are collective efforts being implemented on a large enough scale to impact the epidemic (coverage; impact)? ● Surveys & Surveillance
Understanding
Potential
Responses
Monitoring &
Evaluating
National
Programs
Determining
Collective
Effectiveness
ACTIVITIES
OUTPUTS
INPUTS
OUTCOMES
OUTCOMES
& IMPACTS
MONITORING
Problem
Identification
A Public Health Questions Approach
to Unifying Strategic Information
Are we
doing
the
right
things?
Are we
doing them
right?
Are we doing
them on a large
enough scale?
Case Study:
Routine HIV Testing in
Botswana
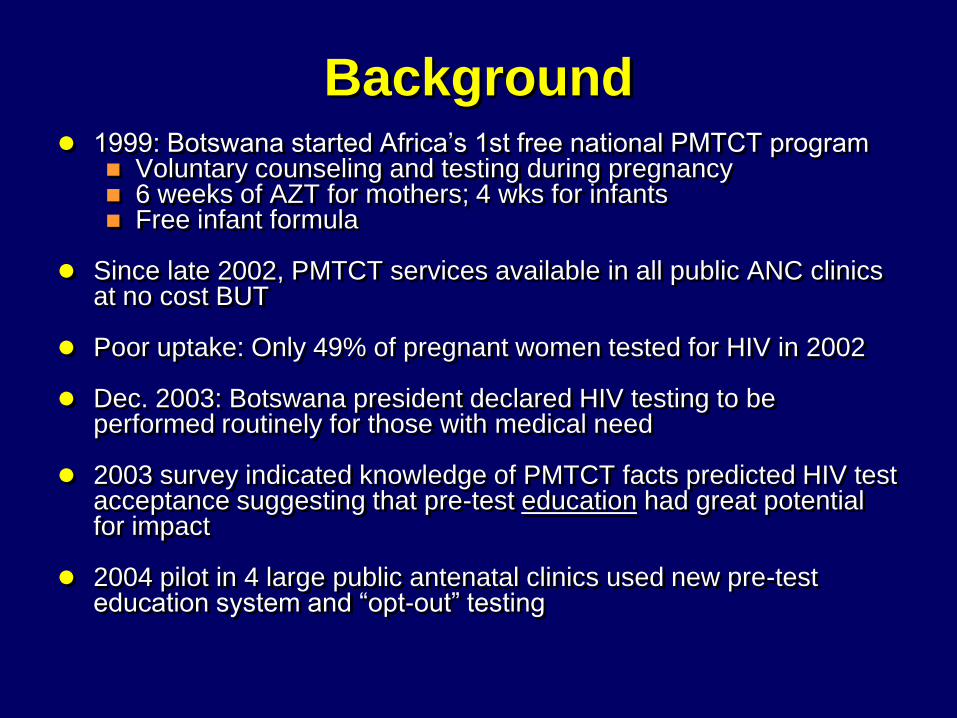
Background 1999: Botswana started Africa’s 1st free national PMTCT program
Voluntary counseling and testing during pregnancy 6 weeks of AZT for mothers; 4 wks for infants Free infant formula
Since late 2002, PMTCT services available in all public ANC clinics at no cost BUT
Poor uptake: Only 49% of pregnant women tested for HIV in 2002
Dec. 2003: Botswana president declared HIV testing to be performed routinely for those with medical need
2003 survey indicated knowledge of PMTCT facts predicted HIV test acceptance suggesting that pre-test education had great potential for impact
2004 pilot in 4 large public antenatal clinics used new pre-test education system and “opt-out” testing

HIV testing in antenatal care using voluntary vs. routine
testing strategies – Francistown, Botswana 2003-2004
(all differences p<0.05)
0
10
20
30
40
50
60
70
80
90
100
Voluntary Routine
Perc
en
t o
f p
reg
nan
t w
om
en
Tested
Returned after test
Given results
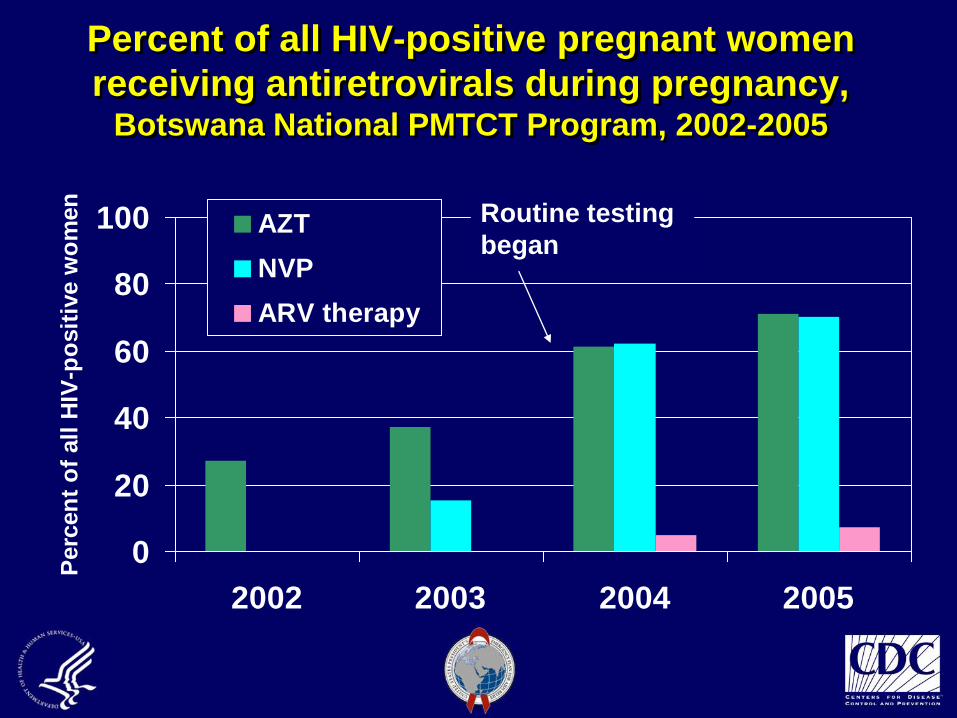
Percent of all HIV-positive pregnant women
receiving antiretrovirals during pregnancy, Botswana National PMTCT Program, 2002-2005
0
20
40
60
80
100
2002 2003 2004 2005
Perc
en
t o
f all
HIV
-po
sit
ive w
om
en
AZT
NVP
ARV therapy
Routine testing
began
National Impact
In late 2004 “routine” HIV testing was implemented nationally by the PMTCT program with CDC-Botswana assistance Routine testing a key reason Probably highest uptake in Africa
Successful Francistown protocol used as template for national implementation
Data used in development of generic PMTCT training curriculum
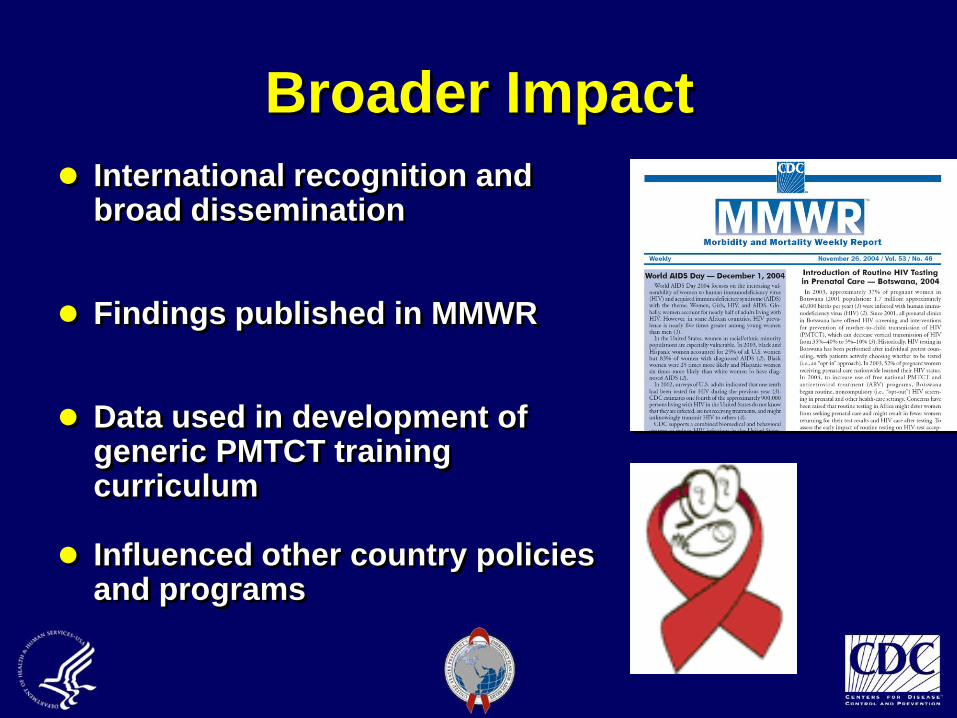
Broader Impact
International recognition and broad dissemination
Findings published in MMWR
Data used in development of generic PMTCT training curriculum
Influenced other country policies and programs
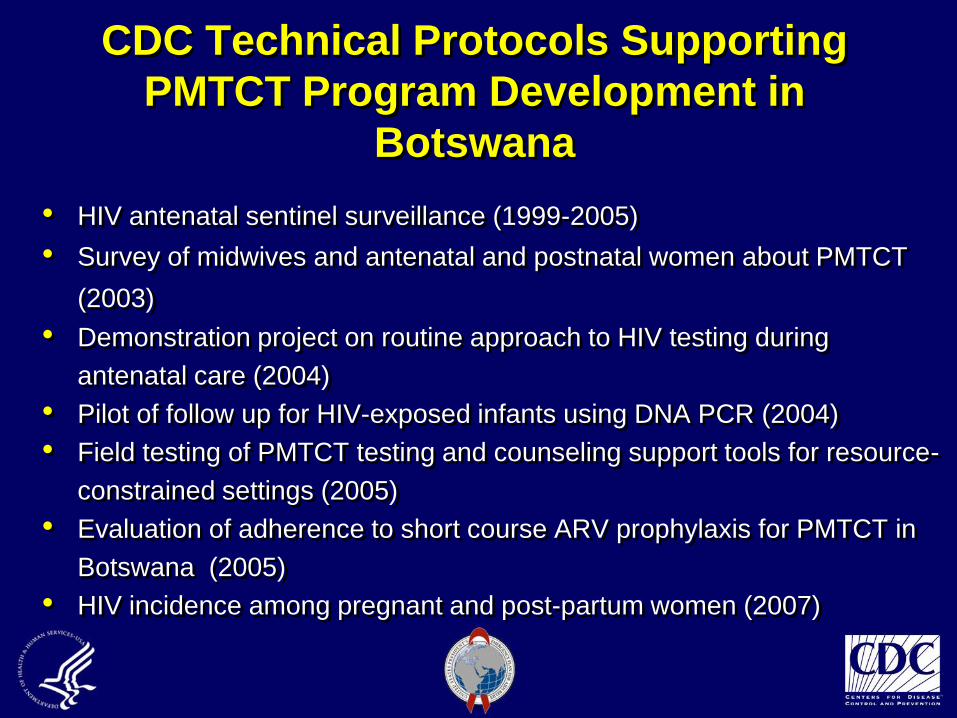
CDC Technical Protocols Supporting
PMTCT Program Development in
Botswana
• HIV antenatal sentinel surveillance (1999-2005)
• Survey of midwives and antenatal and postnatal women about PMTCT
(2003)
• Demonstration project on routine approach to HIV testing during
antenatal care (2004)
• Pilot of follow up for HIV-exposed infants using DNA PCR (2004)
• Field testing of PMTCT testing and counseling support tools for resource-
constrained settings (2005)
• Evaluation of adherence to short course ARV prophylaxis for PMTCT in
Botswana (2005)
• HIV incidence among pregnant and post-partum women (2007)
What is the problem?
● Situation Analysis and Surveillance
What are the contributing factors?
● Determinants Research
What interventions and resources are needed?
● Needs, Resource, Response Analysis & Input Monitoring
What interventions can work (efficacy & effectiveness)?
Special studies, Operations res., Formative res. & Research synthesis
Are we implementing the program as planned?
● Outputs Monitoring
What are we doing?
● Process Monitoring & Evaluation, Quality Assessments
Are interventions working/making a difference?
● Outcome Evaluation Studies
Are collective efforts being implemented on a large enough scale to impact the epidemic (coverage; impact)? ● Surveys & Surveillance
Understanding
Potential
Responses
Monitoring &
Evaluating
National
Programs
Determining
Collective
Effectiveness
ACTIVITIES
OUTPUTS
INPUTS
OUTCOMES
OUTCOMES
& IMPACTS
MONITORING
Problem
Identification
A Public Health Questions Approach
to Unifying Strategic Information
Are we
doing
the
right
things?
Are we
doing them
right?
Are we doing
them on a large
enough scale?
TRACK 1.0 ART Programs
Monitoring and Evaluating
National ProgramsActivities, Outputs, Outcomes
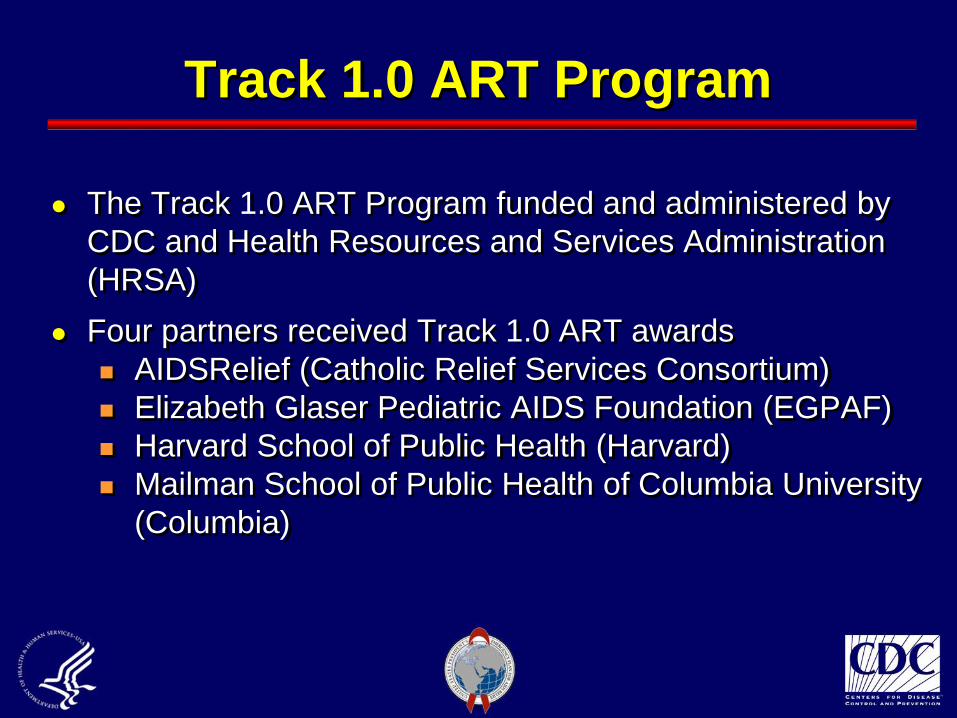
Track 1.0 ART Program
The Track 1.0 ART Program funded and administered by
CDC and Health Resources and Services Administration
(HRSA)
Four partners received Track 1.0 ART awards
AIDSRelief (Catholic Relief Services Consortium)
Elizabeth Glaser Pediatric AIDS Foundation (EGPAF)
Harvard School of Public Health (Harvard)
Mailman School of Public Health of Columbia University
(Columbia)
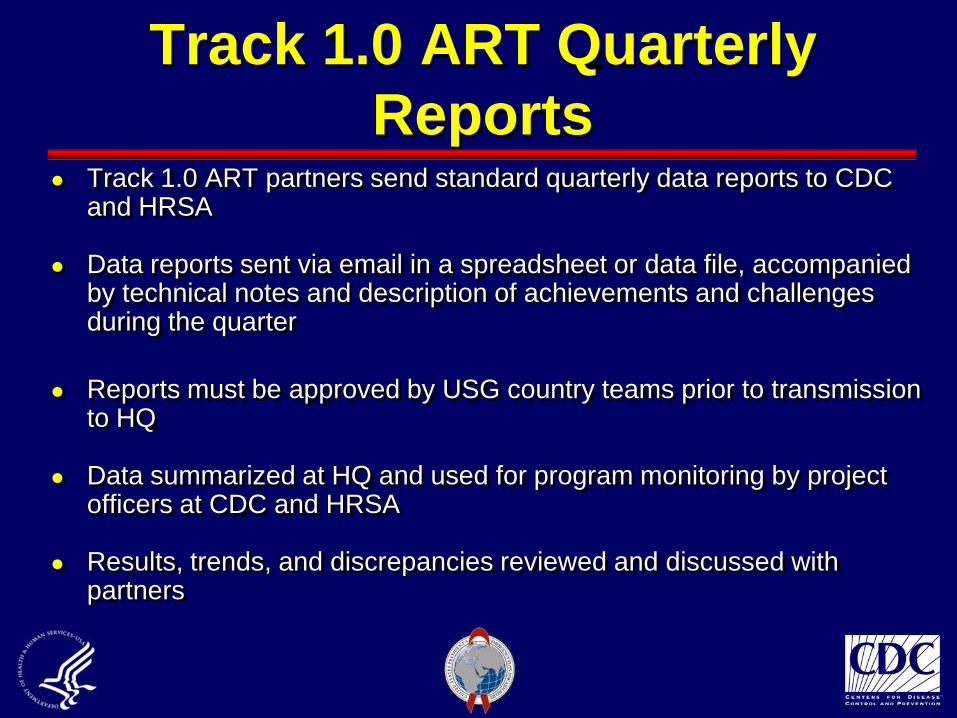
Track 1.0 ART Quarterly
Reports Track 1.0 ART partners send standard quarterly data reports to CDC
and HRSA
Data reports sent via email in a spreadsheet or data file, accompanied by technical notes and description of achievements and challenges during the quarter
Reports must be approved by USG country teams prior to transmission to HQ
Data summarized at HQ and used for program monitoring by project officers at CDC and HRSA
Results, trends, and discrepancies reviewed and discussed with partners
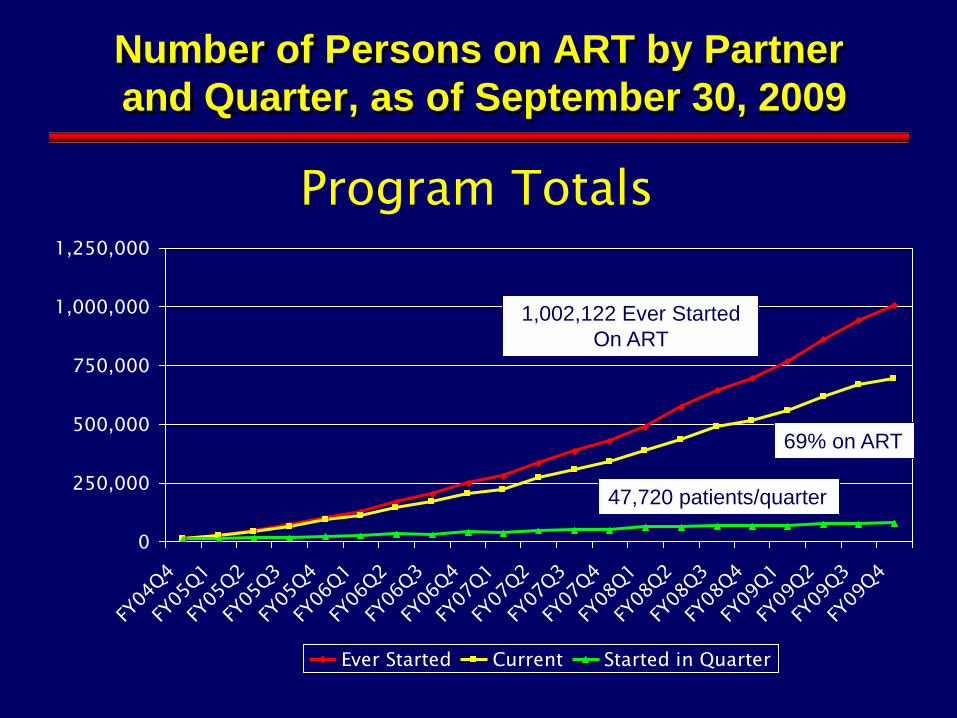
Number of Persons on ART by Partner
and Quarter, as of September 30, 2009
0
250,000
500,000
750,000
1,000,000
1,250,000
FY04
Q4
FY05
Q1
FY05
Q2
FY05
Q3
FY05
Q4
FY06
Q1
FY06
Q2
FY06
Q3
FY06
Q4
FY07
Q1
FY07
Q2
FY07
Q3
FY07
Q4
FY08
Q1
FY08
Q2
FY08
Q3
FY08
Q4
FY09
Q1
FY09
Q2
FY09
Q3
FY09
Q4
Ever Started Current Started in Quarter
Program Totals
69% on ART
47,720 patients/quarter
1,002,122 Ever Started
On ART
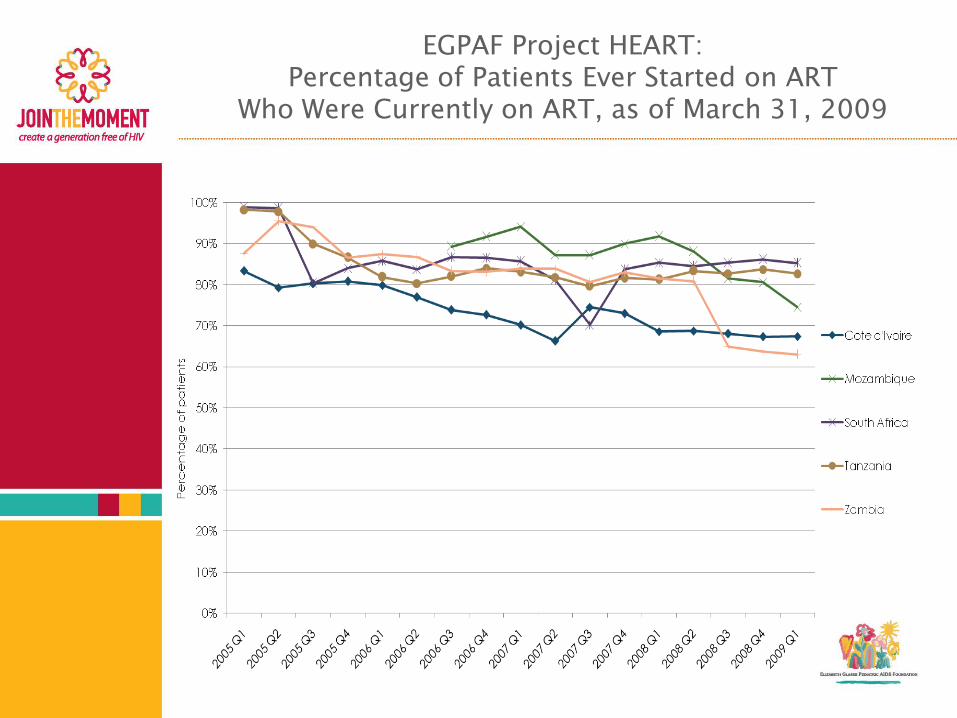
EGPAF Project HEART:Percentage of Patients Ever Started on ART
Who Were Currently on ART, as of March 31, 2009
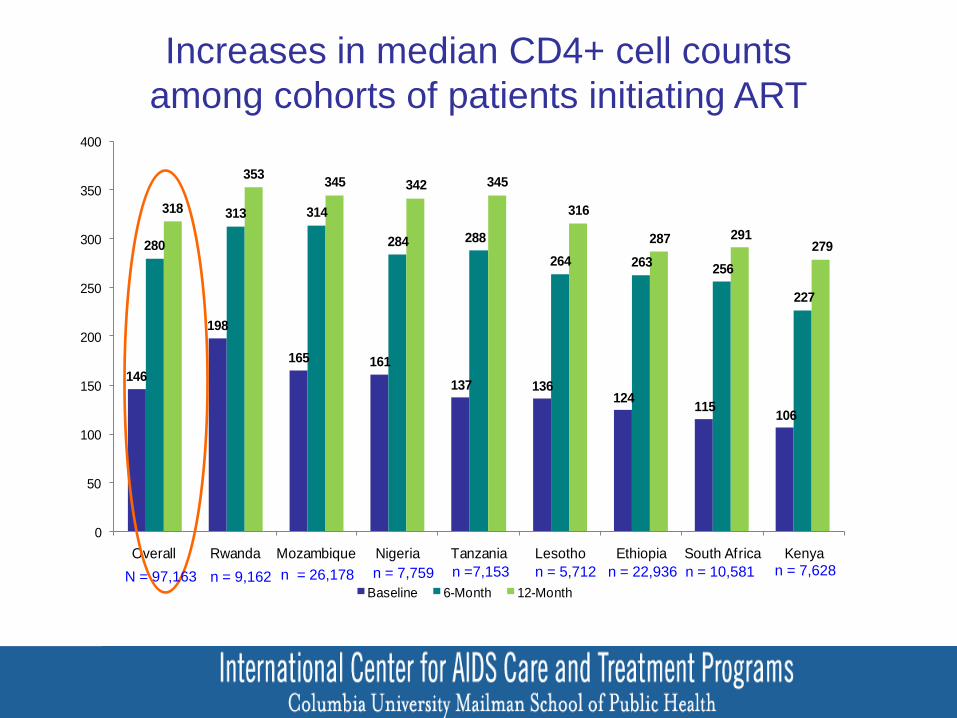
146
198
165 161
137 136124
115106
280
313 314
284 288
264 263256
227
318
353345 342 345
316
287 291279
0
50
100
150
200
250
300
350
400
Overall Rwanda Mozambique Nigeria Tanzania Lesotho Ethiopia South Africa Kenya
Baseline 6-Month 12-Month
Increases in median CD4+ cell counts
among cohorts of patients initiating ART
CD
4 C
ell
Co
un
t (c
ells
/ul)
n = 5,712 n = 10,581n = 22,936n = 9,162 n = 7,628 n =7,153N = 97,163
111
n = 7,759n = 26,178
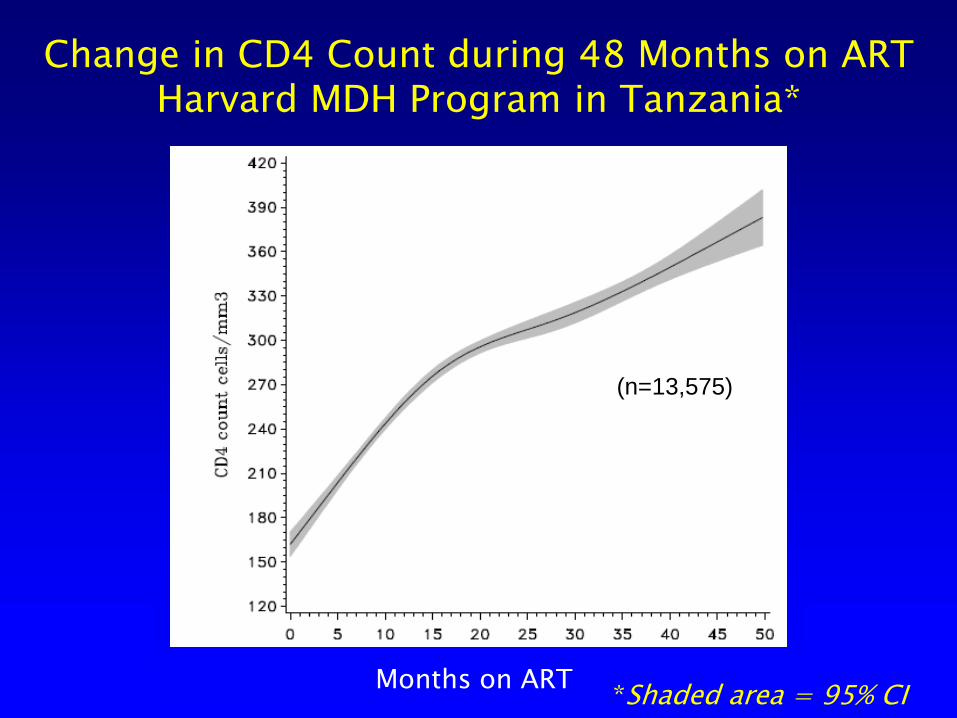
Change in CD4 Count during 48 Months on ART Harvard MDH Program in Tanzania*
Months on ART*Shaded area = 95% CI
(n=13,575)
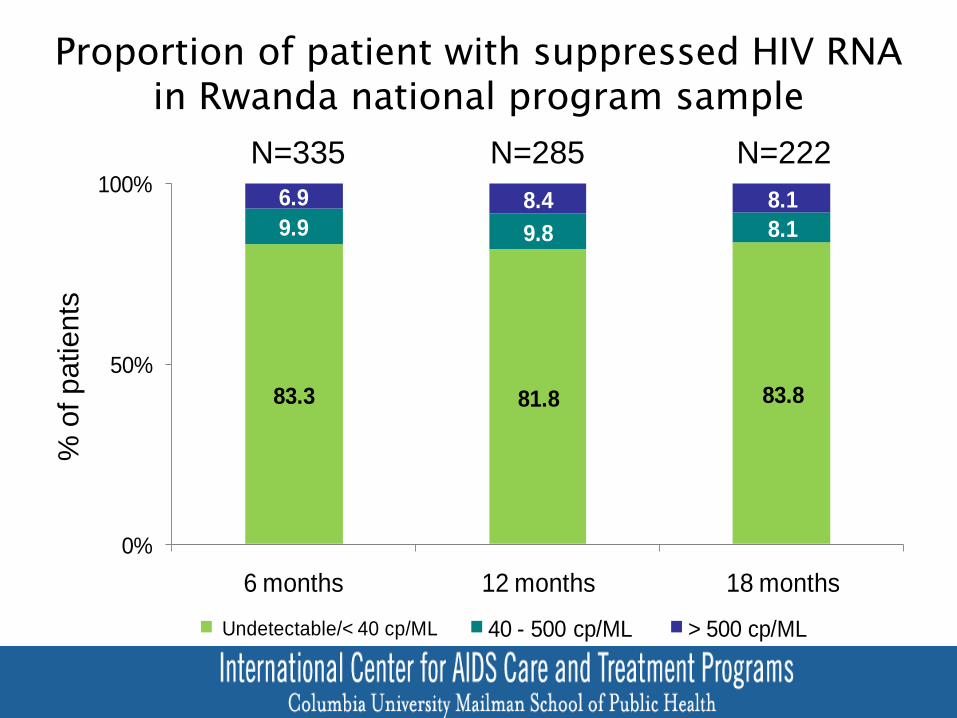
83.3 81.8 83.8
9.9 9.8 8.1
6.9 8.4 8.1
0%
50%
100%
6 months 12 months 18 months
Undetectable/< 40 cp/ML 40 - 500 cp/ML > 500 cp/ML
N=335 N=285 N=222
Proportion of patient with suppressed HIV RNAin Rwanda national program sample
% o
f p
atients
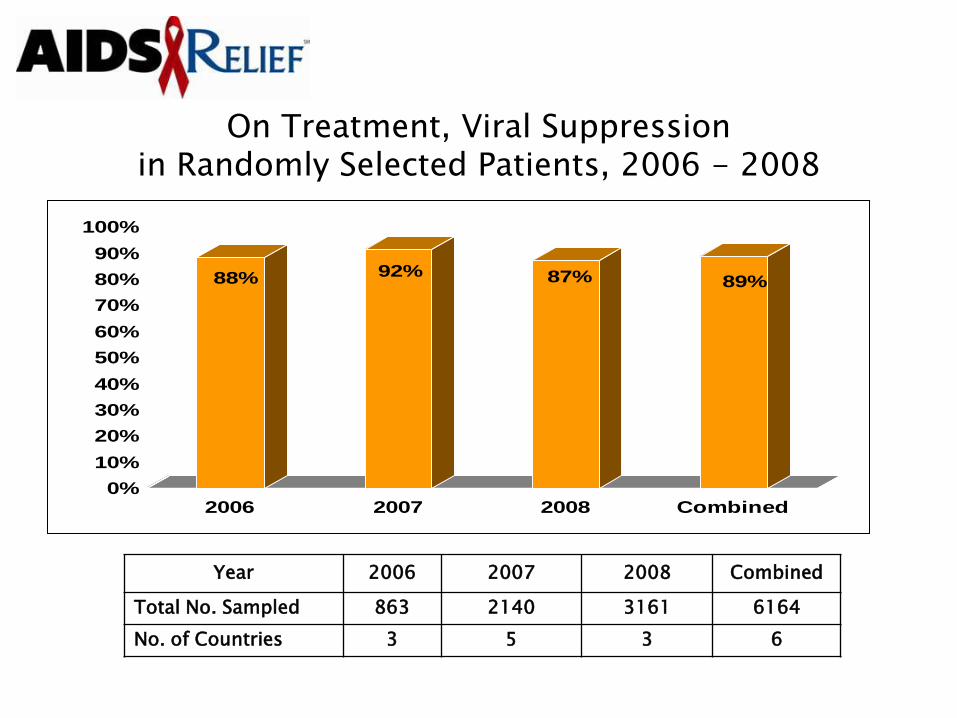
On Treatment, Viral Suppressionin Randomly Selected Patients, 2006 - 2008
88% 92% 87% 89%
0%
10%
20%
30%
40%
50%
60%
70%
80%
90%
100%
2006 2007 2008 Combined
Year 2006 2007 2008 Combined
Total No. Sampled 863 2140 3161 6164
No. of Countries 3 5 3 6

PEPFAR Track 1.0 Implementing Partner
Site Evaluations
Conducted biannually by a member of the GAP Adult Care and Treatment Team
A variety of CDC Track 1.0 partner sites visited for evaluation of infrastructure, staffing, services offered, quality
Sites evaluated in the following areas: HIV/AIDS care and treatment (adult and pediatric) PMTCT Laboratory services Pharmacy
Site-specific and country implementing partner reports submitted to PEPFAR and in-country teams
Follow-up of major problems to ensure that they are addressed
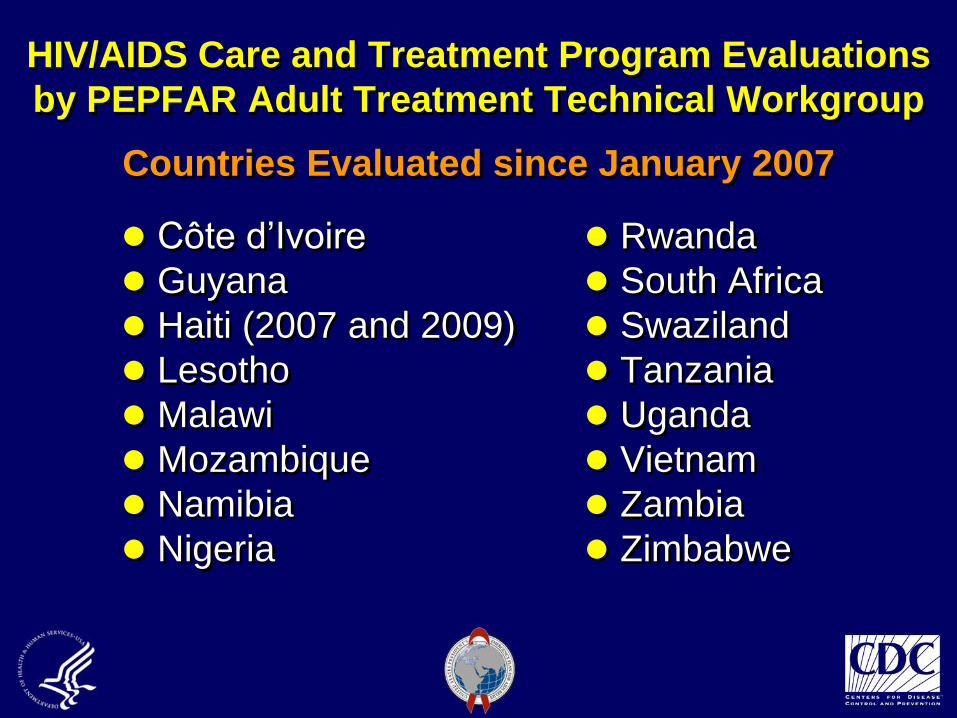
HIV/AIDS Care and Treatment Program Evaluations
by PEPFAR Adult Treatment Technical Workgroup
Countries Evaluated since January 2007
Côte d’Ivoire
Guyana
Haiti (2007 and 2009)
Lesotho
Malawi
Mozambique
Namibia
Nigeria
Rwanda
South Africa
Swaziland
Tanzania
Uganda
Vietnam
Zambia
Zimbabwe
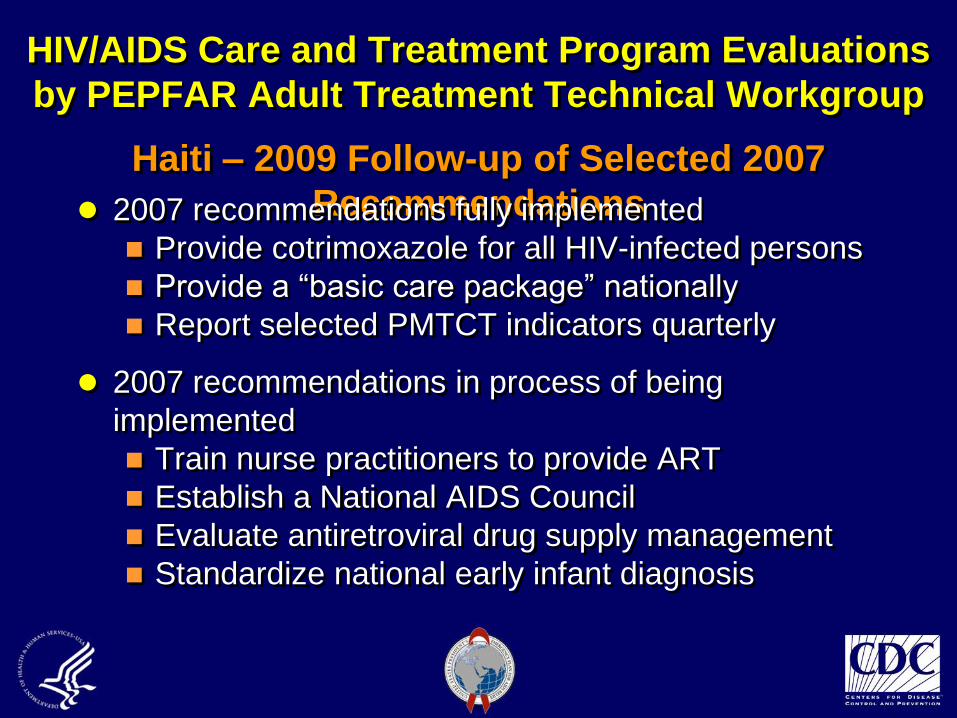
HIV/AIDS Care and Treatment Program Evaluations
by PEPFAR Adult Treatment Technical Workgroup
Haiti – 2009 Follow-up of Selected 2007
Recommendations 2007 recommendations fully implemented
Provide cotrimoxazole for all HIV-infected persons
Provide a “basic care package” nationally
Report selected PMTCT indicators quarterly
2007 recommendations in process of being
implemented
Train nurse practitioners to provide ART
Establish a National AIDS Council
Evaluate antiretroviral drug supply management
Standardize national early infant diagnosis
PEPFAR ART Costing
Project
Understanding Potential ResponsesInputs: Needs & Resource Analysis
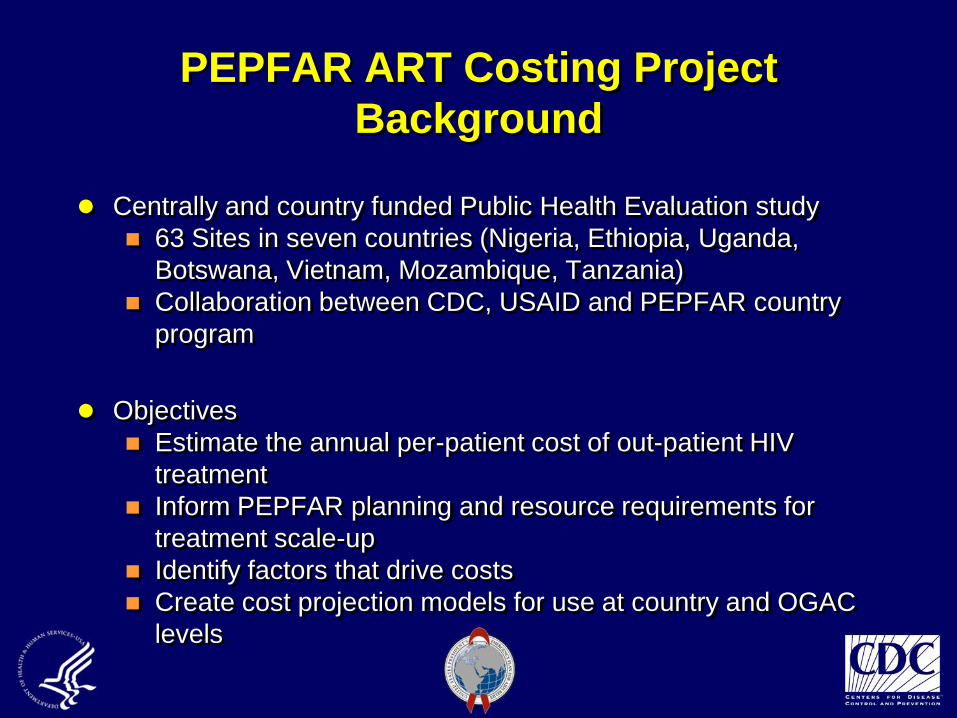
PEPFAR ART Costing Project
Background
Centrally and country funded Public Health Evaluation study
63 Sites in seven countries (Nigeria, Ethiopia, Uganda,
Botswana, Vietnam, Mozambique, Tanzania)
Collaboration between CDC, USAID and PEPFAR country
program
Objectives
Estimate the annual per-patient cost of out-patient HIV
treatment
Inform PEPFAR planning and resource requirements for
treatment scale-up
Identify factors that drive costs
Create cost projection models for use at country and OGAC
levels
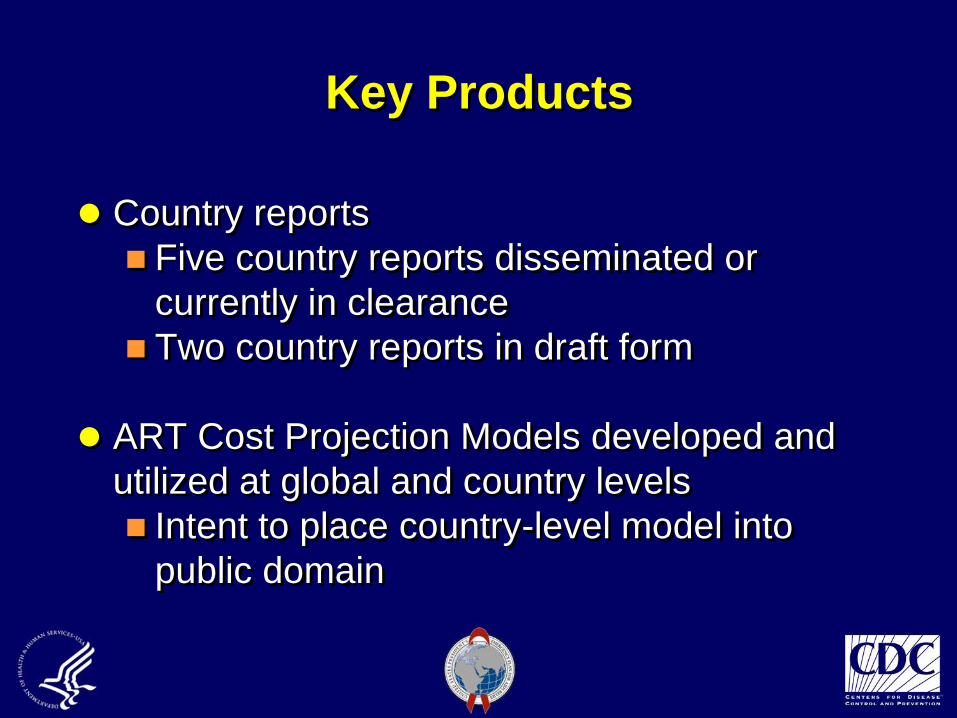
Key Products
Country reports
Five country reports disseminated or
currently in clearance
Two country reports in draft form
ART Cost Projection Models developed and
utilized at global and country levels
Intent to place country-level model into
public domain

Global Uses of PEPFAR Costing
Project Data and Model
First-generation costing model based on these data informed scale-up and resource-needs projections for the 2008 PEPFAR reauthorization legislation
Evolving model and growing dataset utilized to inform global planning and resource needs for ART budget requests in FYs 2009-2011
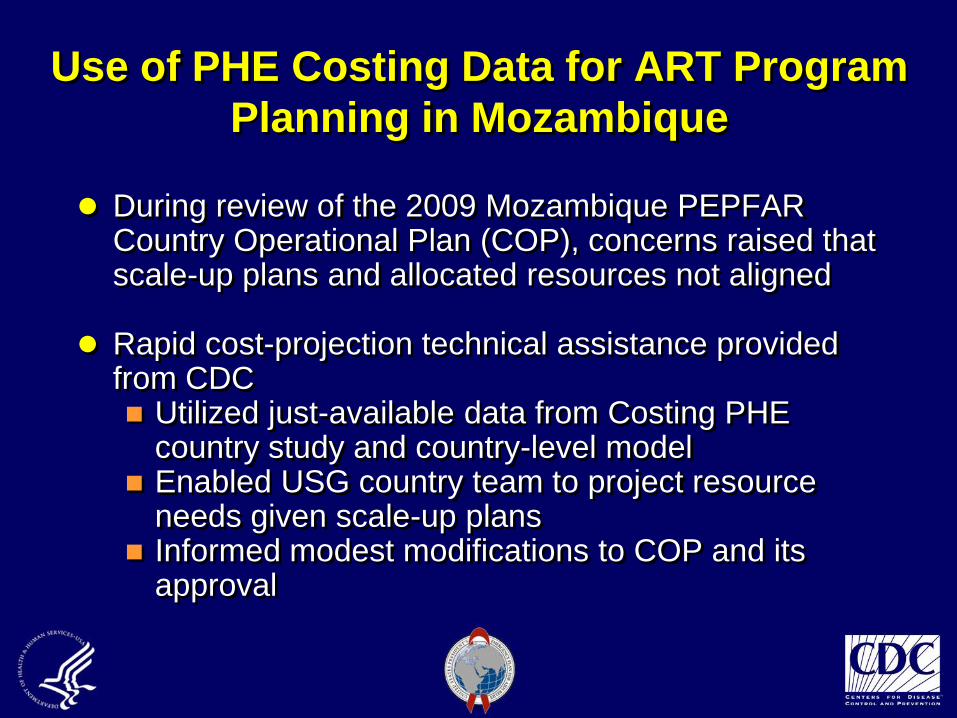
Use of PHE Costing Data for ART Program
Planning in Mozambique
During review of the 2009 Mozambique PEPFAR Country Operational Plan (COP), concerns raised that scale-up plans and allocated resources not aligned
Rapid cost-projection technical assistance provided from CDC Utilized just-available data from Costing PHE
country study and country-level model Enabled USG country team to project resource
needs given scale-up plans Informed modest modifications to COP and its
approval
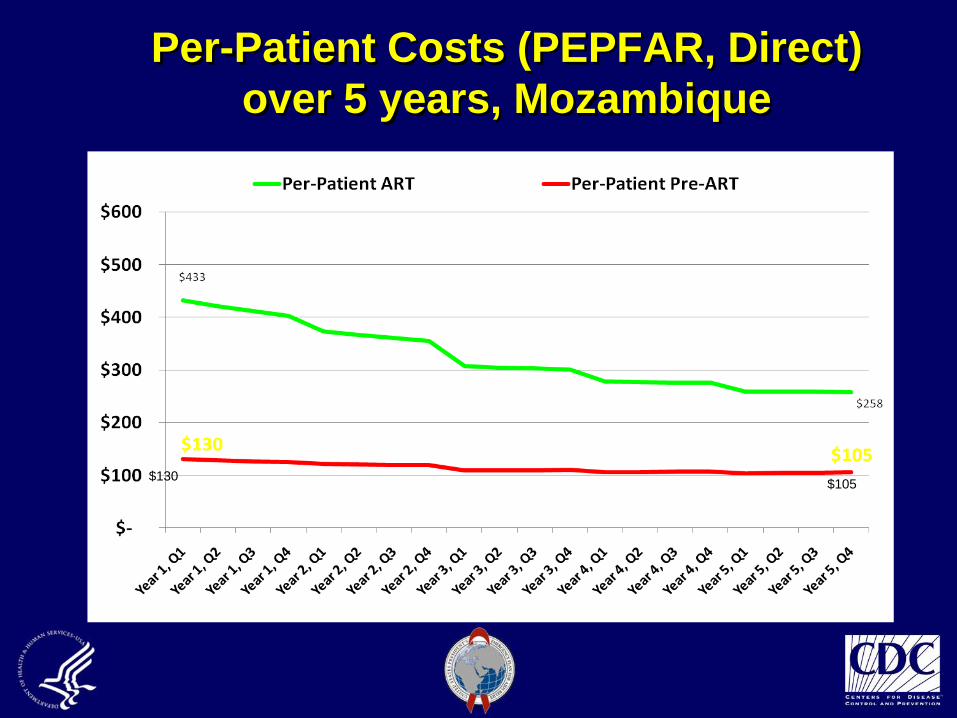
Per-Patient Costs (PEPFAR, Direct)
over 5 years, Mozambique
$130$105
Future Directions and Priorities for
Costing and Modeling Efforts
Increased demands for accurate estimation of
resource requirements to justify budget requests
Costing activities being extended to all program
areas
Additional models in development
New prevention services model
Care model
Revised HCW model
Extension of ART Cost Projection Model to
incorporate VCT, PMTCT on front-end
Patient-level disease progression model
International Rapid Assessment
Response and Evaluation (I-RARE)
Understanding Potential ResponsesDeterminants and Formative Research

(I-RARE): Drug use and sexual risk among non-injecting
and injecting drug users in Cape Town, Pretoria and
Durban, South Africa
Objective: To assess patterns of drug use and sexual risk that increase vulnerability to HIV in South Africa
Methods: Qualitative assessment including observation, mapping, key informant interviews, focus groups and HIV testing
Study Population: Drug using commercial sex workers and MSM, injection drug and non-injection drugs users, service providers
Sample Size: 240 drug users and 20 service providers in each of three cities
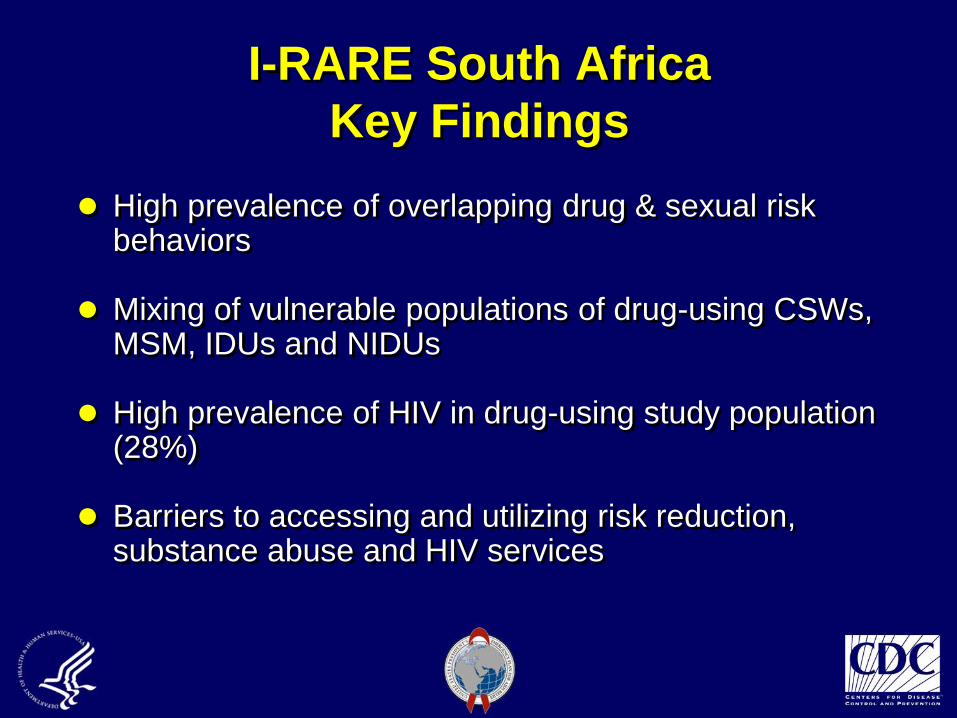
I-RARE South Africa
Key Findings
High prevalence of overlapping drug & sexual risk behaviors
Mixing of vulnerable populations of drug-using CSWs, MSM, IDUs and NIDUs
High prevalence of HIV in drug-using study population (28%)
Barriers to accessing and utilizing risk reduction, substance abuse and HIV services
I-RARE South Africa
Policy and Programmatic Initiatives
Multi-sectoral consortia linking drug abuse treatment and HIV service delivery organizations developed in each participating city
Capacity developed among organizations working with the target populations to address HIV prevention and drug use Targeted outreach to drug users and drug-using sub-
populations (drug using sex workers and MSM)
Implementation of VCT in select drug treatment sites
Use of mobile VCT services for drug-using MSM
Kenya AIDS Indicator
Survey
Problem Identification /
Outcomes & Impact MonitoringSurveys & Surveillance
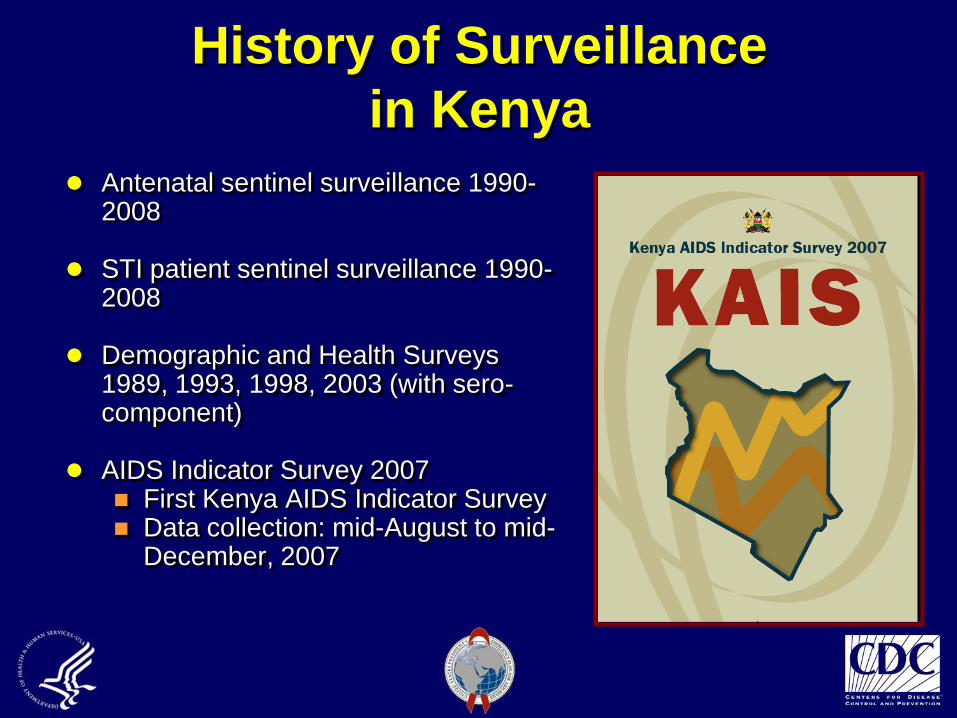
History of Surveillance
in Kenya
Antenatal sentinel surveillance 1990-2008
STI patient sentinel surveillance 1990-2008
Demographic and Health Surveys 1989, 1993, 1998, 2003 (with sero-component)
AIDS Indicator Survey 2007 First Kenya AIDS Indicator Survey Data collection: mid-August to mid-
December, 2007
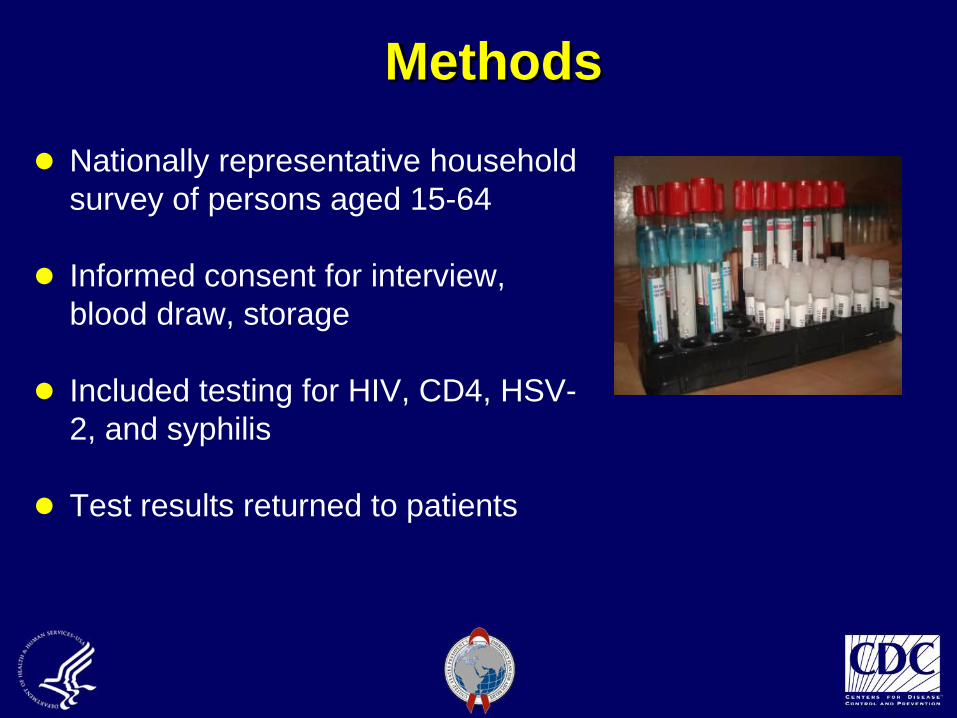
Methods
Nationally representative household
survey of persons aged 15-64
Informed consent for interview,
blood draw, storage
Included testing for HIV, CD4, HSV-
2, and syphilis
Test results returned to patients
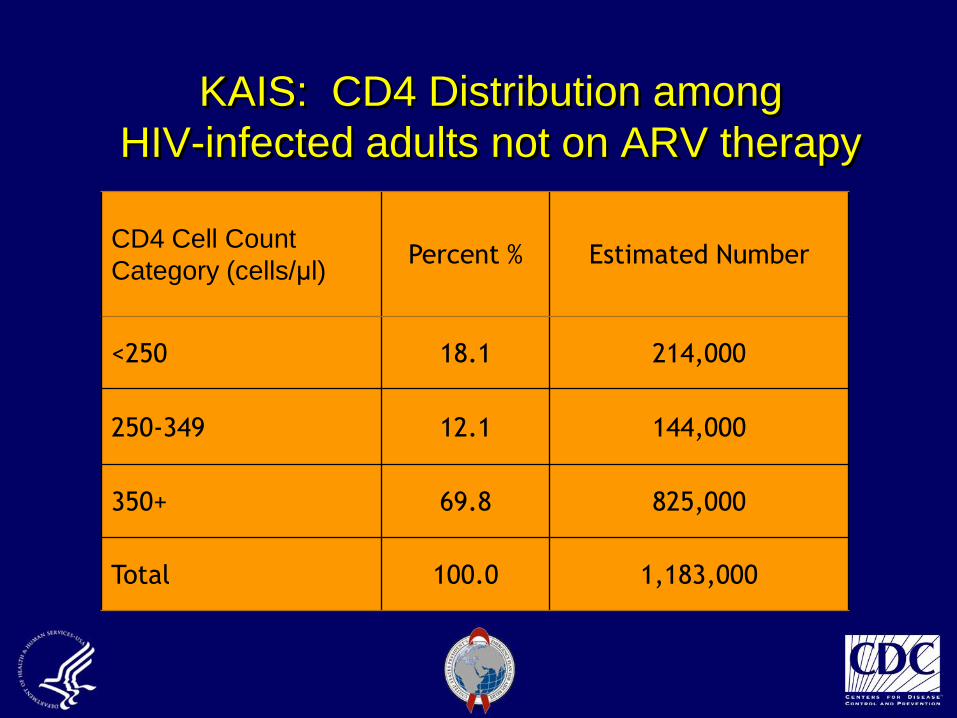
KAIS: CD4 Distribution among
HIV-infected adults not on ARV therapy
CD4 Cell Count
Category (cells/μl)Percent % Estimated Number
<250 18.1 214,000
250-349 12.1 144,000
350+ 69.8 825,000
Total 100.0 1,183,000
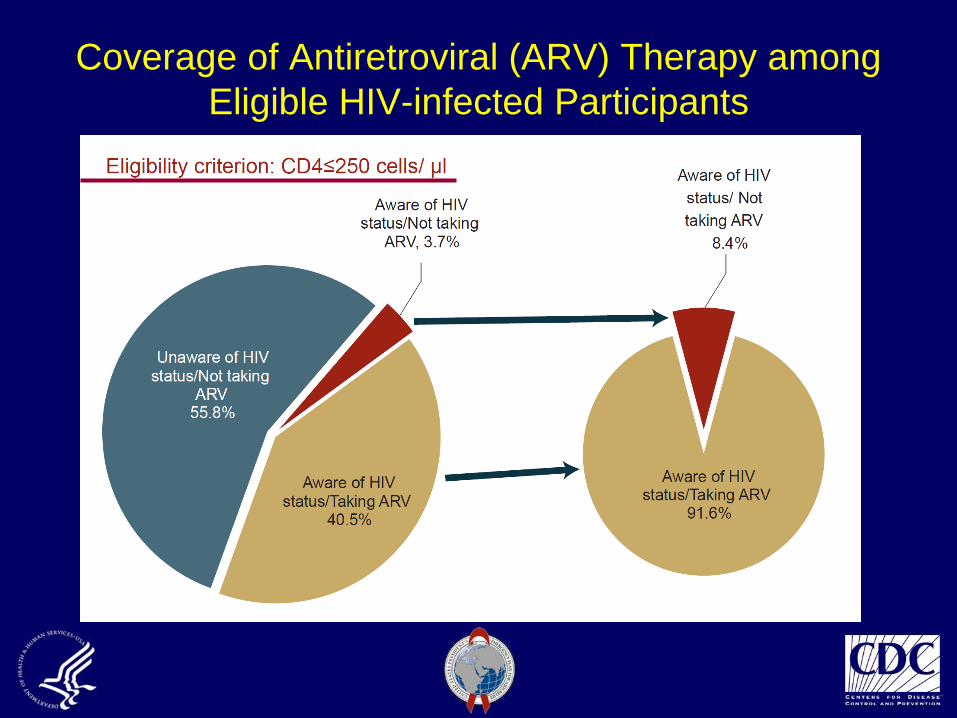
Coverage of Antiretroviral (ARV) Therapy among
Eligible HIV-infected Participants
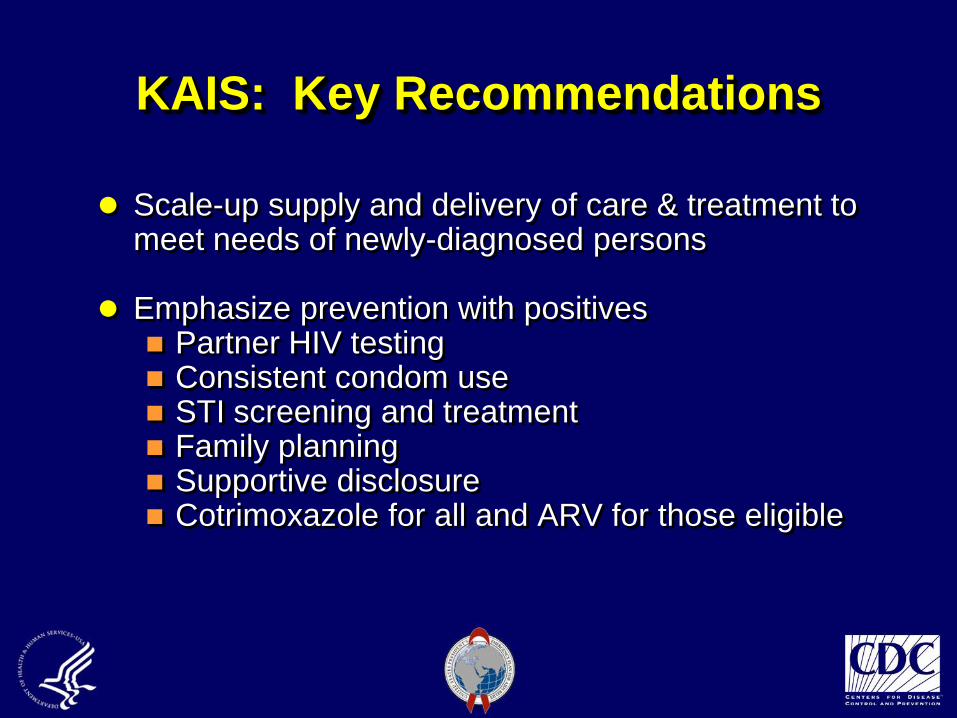
KAIS: Key Recommendations
Scale-up supply and delivery of care & treatment to meet needs of newly-diagnosed persons
Emphasize prevention with positives Partner HIV testing Consistent condom use STI screening and treatment Family planning Supportive disclosure Cotrimoxazole for all and ARV for those eligible
CDC’s Priorities and
Contributions in Support of
PEPFAR
42
CDC’s Global Health Strategy
Work in partnership to: Assist Ministries of Health to plan, effectively manage, and evaluate
health programs
Achieve goals adopted by USG programs and international
organizations to improve health, including disease eradication and
elimination targets
Expand CDC’s global health programs that focus on the leading causes
of mortality, morbidity and disability, especially chronic disease and
injuries
Generate and apply new knowledge to achieve health goals
Strengthen health systems and their impact
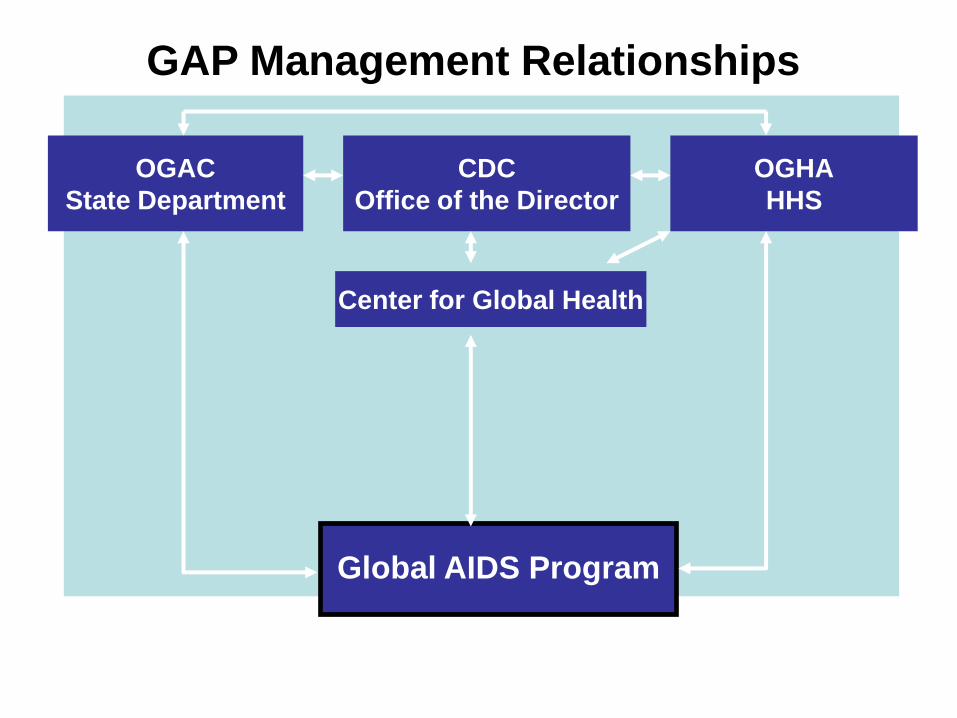
OGHA
HHS
OGAC
State Department
CDC
Office of the Director
Global AIDS Program
Center for Global Health
GAP Management Relationships
44
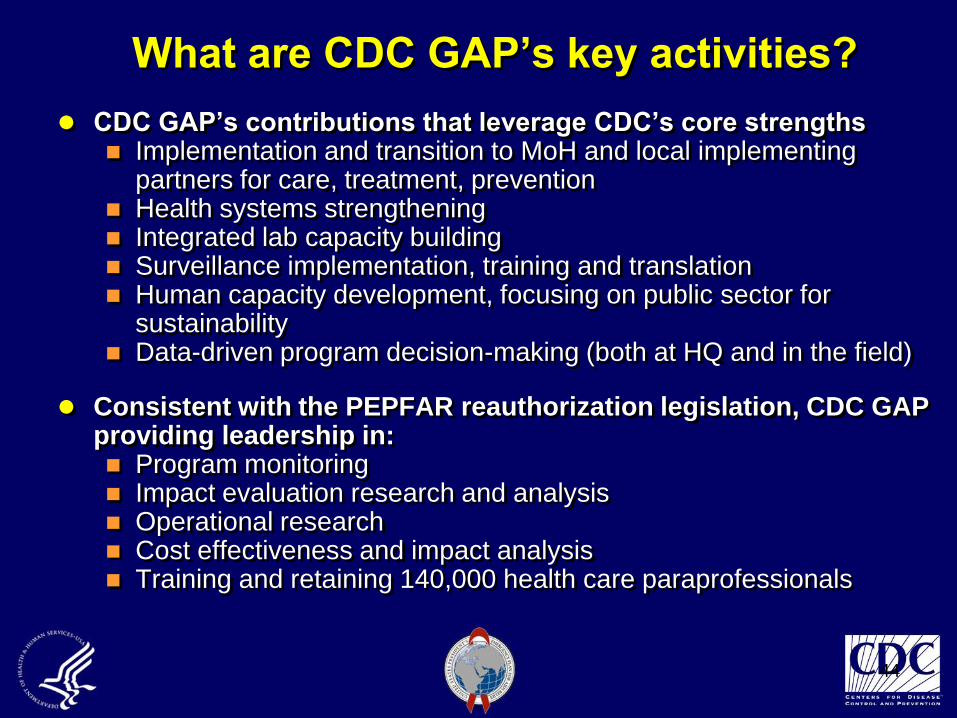
What are CDC GAP’s key activities?
CDC GAP’s contributions that leverage CDC’s core strengths Implementation and transition to MoH and local implementing
partners for care, treatment, prevention Health systems strengthening Integrated lab capacity building Surveillance implementation, training and translation Human capacity development, focusing on public sector for
sustainability Data-driven program decision-making (both at HQ and in the field)
Consistent with the PEPFAR reauthorization legislation, CDC GAP providing leadership in: Program monitoring Impact evaluation research and analysis Operational research Cost effectiveness and impact analysis Training and retaining 140,000 health care paraprofessionals
45
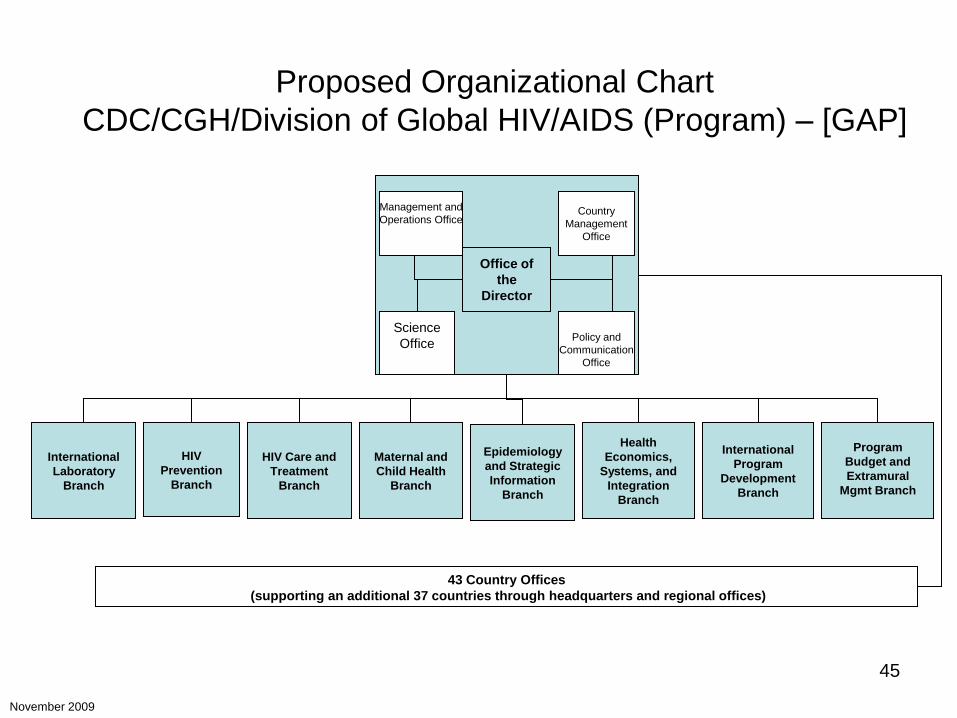
HIV Care and
Treatment
Branch
International
Laboratory
Branch
Management and
Operations Office
Science
Office
Country
Management
Office
Policy and
Communication
Office
Office of
the
Director
43 Country Offices
(supporting an additional 37 countries through headquarters and regional offices)
HIV
Prevention
Branch
International
Program
Development
Branch
Epidemiology
and Strategic
Information
Branch
November 2009
Maternal and
Child Health
Branch
Program
Budget and
Extramural
Mgmt Branch
Health
Economics,
Systems, and
Integration
Branch
Proposed Organizational Chart
CDC/CGH/Division of Global HIV/AIDS (Program) – [GAP]
Global AIDS Program
Priorities for PEPFAR II
Increase host-country government capacity for
leading and managing HIV/AIDS programs
Strengthen surveillance, monitoring and evaluation,
and health information systems in support of
HIV/AIDS program development
Increase evidence-based HIV/AIDS prevention
programs
Expand quality HIV/AIDS care and treatment services
and transition these services to local ownership