pepsico reports fourth quarter and full-year 2015 results · 1 purchase, new york telephone:...
TRANSCRIPT
1
Purchase, New York Telephone: 914-253-2000 www.pepsico.com
PepsiCo Reports Fourth Quarter and Full-Year 2015 Results
• Achieves or Exceeds Full-Year 2015 Targets
• Increases Annualized Dividend per Share by 7.1%
• Provides 2016 Financial Outlook
Organic/Core1 Fourth Quarter and Full-Year 2015 Results
Fourth Quarter Full YearOrganic revenue growth 4% 5%Core gross margin expansion 165 bps 140 bpsCore EPS $1.06 $4.57Core constant currency EPS growth 3% 10%
Reported (GAAP) Fourth Quarter and Full-Year 2015 Results
Fourth Quarter Full YearNet revenue change (7%) (5%)Foreign exchange impact on net revenue (8%) (10%)Gross margin expansion 185 bps 130 bpsEPS $1.17 $3.67EPS change 35% (14%)Foreign exchange impact on EPS (8%) (11%)
PURCHASE, N.Y. - February 11, 2016 - PepsiCo, Inc. (NYSE: PEP) today reported organic revenue growth of 4 percent for the fourth quarter of 2015 and 5 percent for the full year, and core earnings per share of $1.06 for the quarter and $4.57 for the year.
“We are happy to report that we met or exceeded every financial goal we set for 2015, demonstrating consistent performance in the face of volatile macros,” said Chairman and CEO Indra Nooyi.
1 Please refer to the Glossary for the definitions of Non-GAAP financial measures including core, constant currency, organic and free cash flow.

2
“Our portfolio has been strategically designed to weather the current macroeconomic challenges. Our results reflect the balance of our brand portfolio, geographic footprint, consistent marketplace execution and a relentless focus on productivity. While facing the challenges of a choppy macro environment, we continued to make thoughtful investments in our future. By making investments in our brands, product innovation and supply chain, we have fortified our business for sustained growth. Notably, we increased advertising and marketing expense as a percentage of sales by 40 basis points for the full year and 85 basis points in the fourth quarter.
“Our financial performance translated into strong cash generation, enabling us to continue to provide attractive cash returns to our shareholders. In 2015 we returned more than $9 billion to shareholders in the form of dividends and share repurchases, bringing our cumulative 10-year shareholder cash returns to more than $65 billion.
“Looking ahead to 2016, we expect solid financial performance despite expected continued macroeconomic challenges, particularly in certain key developing and emerging markets. Returning cash to shareholders remains a top priority. We are increasing our dividend per share for the 44th consecutive year, beginning with our June 2016 payment, and we expect to return approximately $7 billion to shareholders through a combination of dividends and share repurchases.”

3
Summary Fourth Quarter 2015 Performance (Percent Growth)
ORGANIC/CORE REPORTED (GAAP)
OrganicVolumea
OrganicRevenuea
Core ConstantCurrency
Operating ProfitbNet
RevenueOperating
Profitc
FLNA 1 3 6 2 5QFNA (2) 1 --e (1) 4NAB 1 3 3 2 13Latin America (1)/(1)d 8 (31)f (26) (53)ESSA 1/--d 3.5 7 (17) (21)AMENA 3/3d 4 2 (3.5) (3)Total Divisions 1/1d 4 (1)g
Total PepsiCo 1/1d 4 (2)h (7) 10
a Organic results are non-GAAP financial measures that adjust for impacts of acquisitions, divestitures and other structural changes, including the previously announced Venezuela deconsolidation, and foreign exchange translation, as applicable. For more information about our organic results and the impact of the Venezuela deconsolidation, see “Reconciliation of GAAP and Non-GAAP Information” in the attached exhibits. Please refer to the Glossary for the definition of “Organic.”
b Core constant currency results are non-GAAP financial measures that exclude certain items affecting comparability and foreign exchange translation. For more information about our core constant currency results, see “Reconciliation of GAAP and Non-GAAP Information” in the attached exhibits. Please refer to the Glossary for definitions of “Core” and “Constant Currency.”
c Reported operating profit performance was impacted by certain items excluded from our core results in both 2015 and 2014. See “Reconciliation of GAAP and Non-GAAP Information” in the attached exhibits for more information about these items.
d Snacks/Beverages.
e 6 percent increase excluding an impairment charge associated with ceasing operations of a dairy joint venture.
f 13 percent decrease excluding Venezuela from the Q4 2014 base and the net impact of efficiency initiatives.
g 1 percent increase excluding Venezuela from the Q4 2014 base.
h Flat excluding Venezuela from the Q4 2014 base.

4
Summary of Fourth Quarter Financial Performance:
• Organic revenue grew 4 percent and reported net revenue declined 7 percent. Foreign exchange translation had an 8-percentage-point unfavorable impact on reported net revenue.
• Core gross margin expanded 165 basis points and core operating margin decreased 20 basis points. Operating margin was negatively impacted by an 85 basis point increase in advertising and marketing expense as a percent of sales, partially offset by the implementation of effective revenue management strategies and previously announced productivity initiatives. Reported gross margin and operating margin both expanded 185 basis points.
• Core constant currency operating profit declined 2 percent. The impact of the deconsolidation of Venezuela negatively impacted fourth quarter operating profit performance by 2 percentage points. Reported operating profit increased 10 percent and benefited from lower restructuring and impairment charges, pension-related settlements, including the lapping of a pension lump sum settlement charge, the mark-to-market net impact on commodity hedges, and the lapping of a re-measurement of certain net monetary assets of our Venezuelan businesses, partially offset by unfavorable foreign exchange translation.
• Company’s core effective tax rate was 22.5 percent, which compares to 25.5 percent in the prior-year quarter. The reported effective tax rate was 11.2 percent, below the prior year quarter of 25.6 percent, as a result of a non-cash tax benefit.
• Core EPS was $1.06 and reported EPS was $1.17. Core EPS excludes a $0.16 per share non-cash tax benefit and a $0.01 per share benefit for a pension-related settlement, partially offset by $0.06 per share of restructuring and impairment charges related to our previously announced productivity initiatives.

5
Discussion of Fourth Quarter Division Core Constant Currency Operating Profit
Results:
Core constant currency operating profit results for all divisions were positively impacted by
organic revenue results as presented in the tables on pages 3 and A-6. In addition, results for
each division were impacted by the following:
Frito-Lay North America (FLNA)
Positively impacted by productivity gains and lower commodity costs, partially offset by
operating cost inflation.
Quaker Foods North America (QFNA)
Positively impacted by productivity gains and lower commodity costs, offset by higher
advertising and marketing expense, operating cost inflation and an impairment charge
associated with ceasing operations of a dairy joint venture.
North America Beverages (NAB)
Positively impacted by lower commodity costs and productivity gains, partially offset by
operating cost inflation and higher advertising and marketing expense.
Latin America
Negatively impacted by operating cost inflation, including strategic investments, higher
commodity costs, primarily from transaction-related foreign exchange, the impact of the
deconsolidation of Venezuela, the net impact of efficiency initiatives, a true up for a contingent
liability and higher advertising and marketing expense, partially offset by productivity gains.
Europe Sub-Saharan Africa (ESSA)
Positively impacted by productivity gains and the net impact of efficiency initiatives, partially
offset by higher commodity costs, primarily from transaction-related foreign exchange,
operating cost inflation and higher advertising and marketing expense.
Asia, Middle East and North Africa (AMENA)
Positively impacted by productivity gains, lower commodity costs and the net impact of efficiency
initiatives, partially offset by operating cost inflation and higher advertising and marketing
expense.

6
Summary of Full-Year 2015 Performance (Percent Growth)
ORGANIC/CORE REPORTED (GAAP)
OrganicVolumea
OrganicRevenuea
Core ConstantCurrency
Operating ProfitbNet
RevenueOperating
Profitc
FLNA 1 3 7 2 6QFNA -- 1 (10)e (1) (10)NAB 1 3 7 2 15Latin America 1/-- d 20 9f (13) n/mi
ESSA 1/(2)d 2 2.5 (22) (22)AMENA 4/1d 4 5 (4) (4.5)Total Divisions 1/--d 5 5.5g
Total PepsiCo 1/--d 5 6h (5) (13)
a Organic results are non-GAAP financial measures that adjust for impacts of acquisitions, divestitures and other structural changes, including the previously announced Venezuela deconsolidation, and foreign exchange translation, as applicable. For more information about our organic results and the impact of the Venezuela deconsolidation, see “Reconciliation of GAAP and Non-GAAP Information” in the attached exhibits. Please refer to the Glossary for the definition of “Organic.”
b Core constant currency results are non-GAAP financial measures that exclude certain items affecting comparability and foreign exchange translation. For more information about our core constant currency results, see “Reconciliation of GAAP and Non-GAAP Information” in the attached exhibits. Please refer to the Glossary for definitions of “Core” and “Constant Currency.”
c Reported operating profit performance was impacted by certain items excluded from our core results in both 2015 and 2014. See “Reconciliation of GAAP and Non-GAAP Information” in the attached exhibits for more information about these items.
d Snacks/Beverages.
e 5 percent increase excluding a gain associated with the divestiture of a cereal business in Q3 2014 and impairment charges related to a dairy joint venture in the current year.
f 15 percent increase excluding Venezuela from the Q4 2014 base and the net impact of efficiency initiatives.
g 6 percent increase excluding Venezuela from the Q4 2014 base.
h 7 percent increase excluding Venezuela from the Q4 2014 base.
i n/m = not meaningful due to the non-core Venezuela impairment charges of $1.4 billion, recognized in the third quarter of 2015 to reduce the carrying value of the Company’s investments in its Venezuelan wholly-owned subsidiaries and joint venture.
7
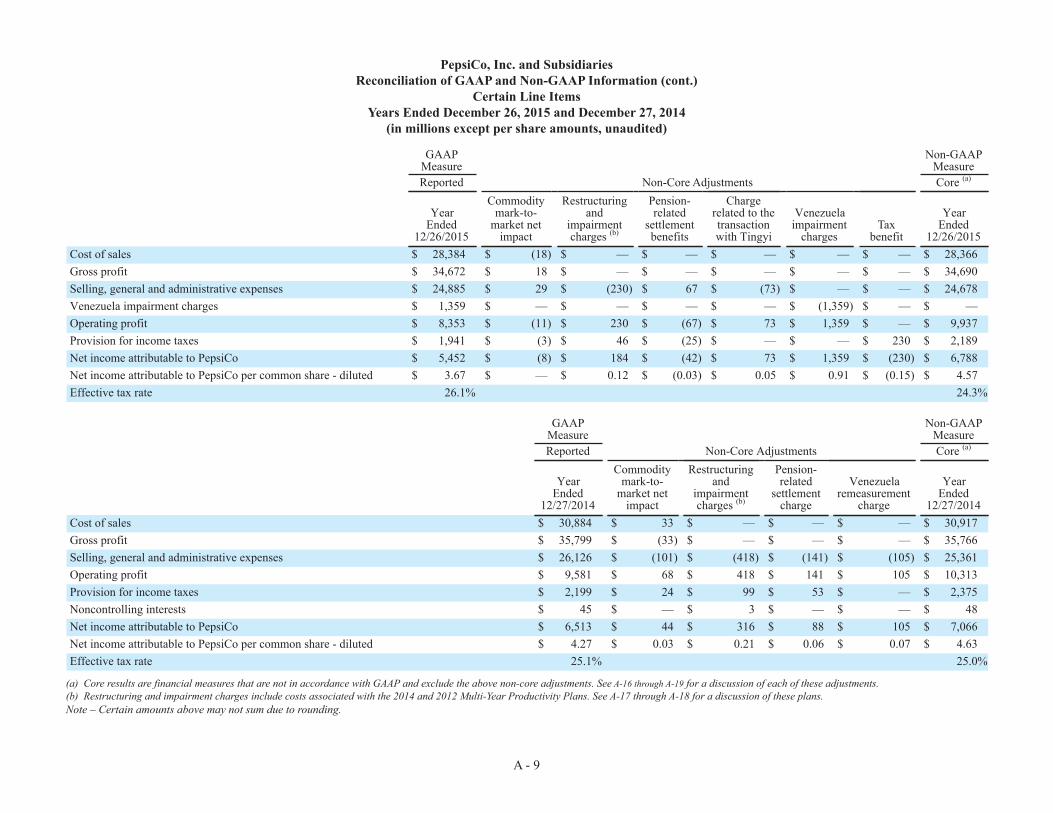
Summary of Full-Year 2015 Financial Performance:
• Organic revenue grew 5 percent and reported net revenue declined 5 percent. Foreign exchange translation had a 10-percentage-point unfavorable impact on reported net revenue.
• Core gross margin and core operating margin expanded 140 basis points and 30 basis points, respectively. Operating margin improvement reflects the implementation of effective revenue management strategies and productivity initiatives, partially offset by impairment charges related to a dairy joint venture and a 40 basis point increase in advertising and marketing expense to 6.3 percent of sales. Reported gross margin expanded 130 basis points while reported operating margin declined 110 basis points, primarily reflecting the Venezuela charges.
• Core constant currency operating profit increased 6 percent. Reported operating profit declined 13 percent reflecting the Venezuela charges, unfavorable foreign exchange translation and a charge to write off the recorded value of the Tingyi-Asashi Beverages Holding Co. Ltd. (TAB) call option, partially offset by pension-related settlements, including the lapping of a pension lump sum settlement charge, lower restructuring and impairment charges, the mark-to-market net impact on commodity hedges and the lapping of a re-measurement of certain net monetary assets of our Venezuelan businesses.
• Core effective tax rate was 24.3 percent for 2015, which compares to 25.0 percent in the prior-year. Reported effective tax rate was 26.1 percent, above the prior-year’s rate of 25.1 percent.
• Core EPS was $4.57 and reported EPS was $3.67. Core EPS excludes $0.91 per share of Venezuela charges, $0.12 per share of restructuring and impairment charges related to our previously announced productivity initiatives and $0.05 per share to write off the recorded value of the TAB call option, partially offset by $0.15 per share for a non-cash tax benefit and a $0.03 per share benefit for pension-related settlements.
• Cash flow provided by operating activities was $10.6 billion for the year. Free cash flow excluding certain items was $8.1 billion for the year.
• Core net return on invested capital was 19.6 percent for the year, an increase of 210 basis points from the prior year. Reported return on invested capital was 13.1 percent for the year, a decrease of 10 basis points from the prior year.
8
Discussion of Full-Year Division Core Constant Currency Operating Profit Results:Core constant currency operating profit results for all divisions were positively impacted by
organic revenue increases as presented in the tables on pages 6 and A-6. In addition, results
for each division were impacted by the following:
Frito-Lay North America (FLNA)
Positively impacted by productivity gains and lower commodity costs, partially offset by operating cost inflation and higher advertising and marketing expense.
Quaker Foods North America (QFNA)
Negatively impacted by impairment charges related to a dairy joint venture, operating cost inflation, higher advertising and marketing expense and the lapping of a gain associated with the divestiture of a cereal business in the prior year. These impacts were partially offset by productivity gains, lower commodity costs and favorable product mix.
North America Beverages (NAB)
Positively impacted by productivity gains and lower commodity costs, partially offset by operating cost inflation and higher advertising and marketing expense.
Latin America
Positively impacted by productivity gains, partially offset by operating cost inflation, higher commodity costs, primarily from transaction-related foreign exchange, the fourth-quarter impact of the deconsolidation of Venezuela as well as the net impact of efficiency initiatives.
Europe Sub-Saharan Africa (ESSA)
Positively impacted by productivity gains, the net impact of efficiency initiatives and the net impact of prior-year impairment charges associated with a brand in Greece, partially offset by higher commodity costs, primarily from transaction-related foreign exchange, operating cost inflation, higher advertising and marketing expense and the lapping of a prior-year gain associated with the sale of agricultural assets.
Asia, Middle East and North Africa (AMENA)
Positively impacted by productivity gains and lower commodity costs. These impacts were partially offset by operating cost inflation, higher advertising and marketing expense and an impairment charge associated with a joint venture. In addition, the net impact of the refranchising of a portion of our beverage businesses in India and in the Middle East had a slight positive impact, which includes a gain from the India refranchising in the current year and lapping of a prior-year gain in the Middle East.

9
2016 Guidance and Outlook2
The Company expects 2016 organic revenue growth of approximately 4 percent, excluding the
impact of the 53rd week. Based on current foreign exchange market consensus rates, foreign
exchange translation is expected to negatively impact reported net revenue growth by 4
percentage points and the 53rd week in 2016 is expected to contribute approximately 1
percentage point to reported net revenue growth.
The Company expects 2016 core earnings per share of $4.66, driven by the following
expectations and factors:
2015 core earnings per share $4.57Expected core constant currency EPS growth (excluding Venezuela deconsolidation) 8%Negative impact of Venezuela deconsolidation (2)%Negative impact of foreign currency translation3 (4)%Expected 2016 core earnings per share $4.66
Core earnings per share guidance includes the following detailed expectations:
• Low-single-digit commodity deflation excluding the impact of transaction-related foreign
exchange. Including the impact of transaction-related foreign exchange, commodities
are expected to have low-single-digit inflation;
• The benefit of a 53rd week will be reinvested in certain productivity and growth initiatives;
• Productivity savings of approximately $1 billion;
• Lower corporate unallocated expense, driven primarily by lower pension expense;
• Higher net interest expense driven by higher debt balances; and
• A core effective tax rate approximately even with the 2015 full-year core effective tax
rate.
Further, the Company expects:
• Over $10 billion in cash flow from operating activities and more than $7 billion in free
cash flow (excluding certain items); and
• Net capital spending of approximately $3 billion.
2 PepsiCo’s fiscal year ends on the last Saturday of each December, resulting in an additional week of results every
five or six years. PepsiCo’s 2016 fiscal year includes 53 weeks of results.3 Based on current foreign exchange market consensus rates.

10
The Company also announced a 7.1 percent increase in its annualized dividend to $3.01 per
share from $2.81 per share, effective with the dividend expected to be paid in June 2016. Total
dividends to shareholders are expected to be approximately $4 billion in 2016. In addition, the
Company anticipates share repurchases of approximately $3 billion, resulting in expected total
cash returned to shareholders of approximately $7 billion in 2016.
Conference Call:
At 8 a.m. (Eastern Time) today, the Company will host a conference call with investors and
financial analysts to discuss fourth quarter and full-year 2015 results and the outlook for 2016.
Further details will be accessible on the Company’s website at www.pepsico.com/investors.
Contacts: Investor MediaJamie Caulfield Jay CooneySenior Vice President, Investor Relations Vice President, Communications914-253-3035 [email protected] [email protected]

A - 1
PepsiCo, Inc. and SubsidiariesCondensed Consolidated Statement of Income
(in millions except per share amounts; unaudited)
Quarter Ended Year Ended 12/26/2015 12/27/2014 Change 12/26/2015 12/27/2014 ChangeNet Revenue $ 18,585 $ 19,948 (7)% $ 63,056 $ 66,683 (5)%Cost of sales 8,380 9,364 (11)% 28,384 30,884 (8)%Gross profit 10,205 10,584 (4)% 34,672 35,799 (3)%Selling, general and administrative expenses 7,943 8,526 (7)% 24,885 26,126 (5)%Venezuela impairment charges — — — % 1,359 — n/mAmortization of intangible assets 22 27 (18)% 75 92 (18)%Operating Profit 2,240 2,031 10 % 8,353 9,581 (13)%Interest expense (317) (284) 11 % (970) (909) 7 %Interest income and other 28 34 (19)% 59 85 (30)%Income before income taxes 1,951 1,781 10 % 7,442 8,757 (15)%Provision for income taxes 218 455 (52)% 1,941 2,199 (12)%Net income 1,733 1,326 31 % 5,501 6,558 (16)%Less: Net income attributable to noncontrolling interests 15 15 (1)% 49 45 8 %Net Income Attributable to PepsiCo $ 1,718 $ 1,311 31 % $ 5,452 $ 6,513 (16)%
DilutedNet Income Attributable to PepsiCo per Common Share $ 1.17 $ 0.87 35 % $ 3.67 $ 4.27 (14)%Weighted-average common shares outstanding 1,470 1,514 1,485 1,527
Cash dividends declared per common share $ 0.7025 $ 0.655 $ 2.7625 $ 2.5325

A - 2
PepsiCo, Inc. and SubsidiariesSupplemental Financial Information
(in millions and unaudited)
Quarter Ended Year Ended 12/26/2015 12/27/2014 Change 12/26/2015 12/27/2014 ChangeNet RevenueFrito-Lay North America $ 4,456 $ 4,370 2 % $ 14,782 $ 14,502 2 %Quaker Foods North America 775 784 (1)% 2,543 2,568 (1)%North America Beverages 5,847 5,736 2 % 20,618 20,171 2 %Latin America 2,307 3,132 (26)% 8,228 9,425 (13)%Europe Sub-Saharan Africa 3,283 3,939 (17)% 10,510 13,399 (22)%Asia, Middle East & North Africa 1,917 1,987 (3.5)% 6,375 6,618 (4)%Total Net Revenue $ 18,585 $ 19,948 (7)% $ 63,056 $ 66,683 (5)%
Operating ProfitFrito-Lay North America $ 1,292 $ 1,230 5 % $ 4,304 $ 4,054 6 %Quaker Foods North America 179 172 4 % 560 621 (10)%North America Beverages 639 567 13 % 2,785 2,421 15 %Latin America 214 453 (53)% (206) 1,636 (113)%Europe Sub-Saharan Africa 221 278 (21)% 1,081 1,389 (22)%Asia, Middle East & North Africa 139 144 (3)% 941 985 (4.5)%Division Operating Profit 2,684 2,844 (6)% 9,465 11,106 (15)%Corporate Unallocated
Commodity Mark-to-Market Net Impact 1 (100) 11 (68)Restructuring and Impairment Charges (2) (21) (13) (41)Pension Lump Sum Settlement Charge — (141) — (141)Venezuela Remeasurement Charge — (126) — (126)Other (443) (425) (1,110) (1,149)
(444) (813) (45)% (1,112) (1,525) (27)%Total Operating Profit $ 2,240 $ 2,031 10 % $ 8,353 $ 9,581 (13)%

A - 3
PepsiCo, Inc. and SubsidiariesCondensed Consolidated Statement of Cash Flows
(in millions) Year Ended 12/26/2015 12/27/2014
(unaudited)Operating ActivitiesNet income $ 5,501 $ 6,558Depreciation and amortization 2,416 2,625Share-based compensation expense 295 297Restructuring and impairment charges 230 418Cash payments for restructuring charges (208) (266)Charge related to the transaction with Tingyi (Cayman Islands) Holding Corp. (Tingyi) 73 —Venezuela impairment charges 1,359 —Venezuela remeasurement charge — 105Excess tax benefits from share-based payment arrangements (133) (114)Pension and retiree medical plan expenses 467 667Pension and retiree medical plan contributions (205) (655)Deferred income taxes and other tax charges and credits 78 (19)Change in assets and liabilities:
Accounts and notes receivable (461) (343)Inventories (244) (111)Prepaid expenses and other current assets (50) 80Accounts payable and other current liabilities 1,692 1,162Income taxes payable 55 371
Other, net (285) (269)Net Cash Provided by Operating Activities 10,580 10,506Investing ActivitiesCapital spending (2,758) (2,859)Sales of property, plant and equipment 86 115Acquisitions and investments in noncontrolled affiliates (86) (88)Reduction of cash due to Venezuela deconsolidation (568) —Divestitures 76 203Short-term investments, net (314) (2,298)Other investing, net (5) (10)Net Cash Used for Investing Activities (3,569) (4,937)Financing ActivitiesProceeds from issuances of long-term debt 8,702 3,855Payments of long-term debt (4,095) (2,189)Short-term borrowings, net 25 (1,997)Cash dividends paid (4,040) (3,730)Share repurchases - common (5,000) (5,012)Share repurchases - preferred (5) (10)Proceeds from exercises of stock options 504 755Excess tax benefits from share-based payment arrangements 133 114Other financing (52) (50)Net Cash Used for Financing Activities (3,828) (8,264)Effect of exchange rate changes on cash and cash equivalents (221) (546)Net Increase/(Decrease) in Cash and Cash Equivalents 2,962 (3,241)Cash and Cash Equivalents, Beginning of Year 6,134 9,375Cash and Cash Equivalents, End of Year $ 9,096 $ 6,134

A - 4
PepsiCo, Inc. and SubsidiariesCondensed Consolidated Balance Sheet(in millions except per share amounts)
12/26/2015 12/27/2014 (unaudited) AssetsCurrent Assets
Cash and cash equivalents $ 9,096 $ 6,134Short-term investments 2,913 2,592Accounts and notes receivable, net 6,437 6,651Inventories
Raw materials 1,312 1,593Work-in-process 161 173Finished goods 1,247 1,377
2,720 3,143Prepaid expenses and other current assets 1,865 2,143
Total Current Assets 23,031 20,663Property, plant and equipment, net 16,317 17,244Amortizable intangible assets, net 1,270 1,449Goodwill 14,177 14,965Other nonamortizable intangible assets 11,811 12,639
Nonamortizable Intangible Assets 25,988 27,604Investments in noncontrolled affiliates 2,311 2,689Other assets 750 860
Total Assets $ 69,667 $ 70,509
Liabilities and EquityCurrent Liabilities
Short-term obligations $ 4,071 $ 5,076Accounts payable and other current liabilities 13,507 13,016
Total Current Liabilities 17,578 18,092Long-term debt obligations 29,213 23,821Other liabilities 5,887 5,744Deferred income taxes 4,959 5,304
Total Liabilities 57,637 52,961
Commitments and Contingencies
Preferred stock, no par value 41 41Repurchased preferred stock (186) (181)PepsiCo Common Shareholders’ Equity
Common stock, par value 12/3¢ per share (authorized 3,600 shares, issued, net of repurchased common stock at par value: 1,448 and 1,488 shares, respectively) 24 25
Capital in excess of par value 4,076 4,115Retained earnings 50,472 49,092Accumulated other comprehensive loss (13,319) (10,669)Repurchased common stock, in excess of par value (418 and 378 shares, respectively) (29,185) (24,985)
Total PepsiCo Common Shareholders’ Equity 12,068 17,578Noncontrolling interests 107 110
Total Equity 12,030 17,548Total Liabilities and Equity $ 69,667 $ 70,509

A - 5
PepsiCo, Inc. and SubsidiariesSupplemental Share and Stock-Based Compensation Data
(in millions except dollar amounts, unaudited)
Quarter Ended Year Ended 12/26/2015 12/27/2014 12/26/2015 12/27/2014Beginning Net Shares Outstanding 1,462 1,503 1,488 1,529Options Exercised, Restricted Stock Units (RSUs), Performance Stock Units
(PSUs) and PepsiCo Equity Performance Units (PEPunits) Converted 4 4 12 16Shares Repurchased (18) (19) (52) (57)Ending Net Shares Outstanding 1,448 1,488 1,448 1,488
Weighted Average Basic 1,454 1,494 1,469 1,509Dilutive Securities:
Options 8 10 8 10RSUs, PSUs, PEPunits and Other 7 9 7 7ESOP Convertible Preferred Stock 1 1 1 1
Weighted Average Diluted 1,470 1,514 1,485 1,527
Average Share Price for the Period $ 98.12 $ 95.16 $ 96.74 $ 88.60Growth Versus Prior Year 3% 15% 9% 10%
Options Outstanding 31 39 35 43Options in the Money 30 39 33 43Dilutive Shares from Options 8 10 8 10Dilutive Shares from Options as a % of Options in the Money 27% 27% 27% 23%
Average Exercise Price of Options in the Money $ 65.39 $ 64.06 $ 64.85 $ 63.51
RSUs, PSUs, PEPunits and Other Outstanding 10 12 11 13Dilutive Shares from RSUs, PSUs, PEPunits and Other 7 9 7 7
Weighted-Average Grant-Date Fair Value of RSUs and PSUs Outstanding $ 84.03 $ 74.49 $ 82.66 $ 74.27Weighted-Average Grant-Date Fair Value of PEPunits Outstanding $ 62.77 $ 61.04 $ 62.89 $ 60.92

A - 6
PepsiCo, Inc. and SubsidiariesReconciliation of GAAP and Non-GAAP Information
Organic Revenue Growth RatesQuarter and Year Ended December 26, 2015
(unaudited)
Percent ImpactGAAP
MeasureNon-GAAP
Measure
Reported% Change
Organic% Change (a)
Net Revenue Year over Year % Change VolumeEffective
net pricingAcquisitions and
divestitures
Foreignexchangetranslation
Venezuela deconsolidation (b)
QuarterEnded
12/26/2015
QuarterEnded
12/26/2015Frito-Lay North America 1 2 — (1) — 2 3Quaker Foods North America (1) 2 — (2) — (1) 1North America Beverages — 3.5 — (1) — 2 3Latin America — 8 — (19) (15) (26) 8Europe Sub-Saharan Africa — 4 — (20) — (17) 3.5Asia, Middle East & North Africa 4 — (1) (6) — (3.5) 4Total PepsiCo 0.5 3 — (8) (2) (7) 4
Percent ImpactGAAP
MeasureNon-GAAP
Measure
Reported% Change
Organic% Change (a)
Net Revenue Year over Year % Change VolumeEffective
net pricingAcquisitions and
divestitures
Foreignexchangetranslation
Venezuela deconsolidation (b)
Year Ended
12/26/2015
YearEnded
12/26/2015Frito-Lay North America 1 2 — (1) — 2 3Quaker Foods North America 1 — — (2) — (1) 1North America Beverages 0.5 3 — (1) — 2 3Latin America 1 19 — (27) (6) (13) 20Europe Sub-Saharan Africa (2) 4 — (24) — (22) 2Asia, Middle East & North Africa 4 0.5 (3) (5) — (4) 4Total PepsiCo 0.5 5 — (10) (1) (5) 5
(a) Organic percent change is a financial measure that is not in accordance with GAAP and is calculated by excluding the impact of acquisitions and divestitures, foreign exchange translation and the Venezuela deconsolidation from reported growth.
(b) Represents the impact of the exclusion of the fourth quarter 2014 results of our Venezuelan businesses, which were deconsolidated as of the end of the third quarter of 2015.
Note – Certain amounts above may not sum due to rounding.

A - 7
PepsiCo, Inc. and SubsidiariesReconciliation of GAAP and Non-GAAP Information (cont.)
Year over Year Growth RatesQuarter and Year Ended December 26, 2015 (unaudited)
GAAP
Measure Non-GAAP
MeasureNon-GAAP
Measure
Reported% Change Percent Impact of Non-Core Adjustments
Core (a) % Change
PercentImpact of
Core Constant
Currency (a)
% Change
Operating Profit Year over Year % Change
QuarterEnded
12/26/2015
Commoditymark-to-
market netimpact
Restructuringand
impairmentcharges (b)
Pension-related
settlement(benefit)/
charge
Venezuelaremeasurement
charge
QuarterEnded
12/26/2015
Foreignexchangetranslation
QuarterEnded
12/26/2015Frito-Lay North America 5 — (1) — — 4 1 6Quaker Foods North America 4 — (6) — — (1) 1 —North America Beverages 13 — (5.5) (5) — 2 2 3Latin America (53) — 0.5 — 4 (48) 17 (31)Europe Sub-Saharan Africa (21) — 8 — — (12) 19 7Asia, Middle East & North Africa (3) — 2 — — (1) 3 2Division Operating Profit (6) — (1) (1) 1 (6) 6 (1)Impact of Corporate Unallocated 16 (4) (1) (7) (6) (2) 1 (1)Total Operating Profit 10 (4) (2) (8) (5) (8) 7 (2)Net Income Attributable to PepsiCo 31 (7) 8 —Net Income Attributable to PepsiCo per common share - diluted 35 (5) 8 3
GAAP
Measure Non-GAAP
Measure Non-GAAP
Measure
Reported% Change Percent Impact of Non-Core Adjustments
Core (a) % Change
PercentImpact of
Core Constant
Currency (a)
% Change
Operating Profit Year over Year % Change
Year Ended
12/26/2015
Commoditymark-to-
market netimpact
Restructuringand
impairmentcharges (b)
Pension-related
settlement(benefits)/
charge
Charge related to the transaction with Tingyi
Venezuela impairment
charges
Venezuelaremeasurement
charge
Year Ended
12/26/2015
Foreignexchangetranslation
Year Ended
12/26/2015Frito-Lay North America 6 — (1) — — — — 5.5 1 7Quaker Foods North America (10) — (1.5) — — — — (11) 1 (10)North America Beverages 15 — (6) (3) — — — 6 1 7Latin America (113) — 1 — — 83 1 (28) 37 9Europe Sub-Saharan Africa (22) — 2 — — — — (20) 22 2.5Asia, Middle East & North Africa (4.5) — (1) — 7 — — 2 3 5Division Operating Profit (15) — (1) (1) 1 12 — (4) 9 5.5Impact of Corporate Unallocated 2 (1) (0.5) (1.5) — 2 (1) — 1 1Total Operating Profit (13) (1) (2) (2) 1 14 (1) (4) 10 6Net Income Attributable to PepsiCo (16) (4) 11 7Net Income Attributable to PepsiCo per common share - diluted (14) (1) 11 10
(a) Core results and core constant currency results are financial measures that are not in accordance with GAAP and exclude the above non-core adjustments. See A-16 through A-19 for a discussion of each of these adjustments.(b) Restructuring and impairment charges include costs associated with the 2014 and 2012 Multi-Year Productivity Plans. See A-17 through A-18 for a discussion of these plans.Note – Certain amounts above may not sum due to rounding.

A - 8
PepsiCo, Inc. and SubsidiariesReconciliation of GAAP and Non-GAAP Information (cont.)
Certain Line ItemsQuarters Ended December 26, 2015 and December 27, 2014
(in millions except per share amounts, unaudited)
GAAPMeasure
Non-GAAPMeasure
Reported Non-Core Adjustments Core (a)
QuarterEnded
12/26/2015
Commoditymark-to-
market netimpact
Restructuring and
impairmentcharges (b)
Pension-related
settlementbenefit Tax benefit
QuarterEnded
12/26/2015 Cost of sales $ 8,380 $ 17 $ — $ — $ — $ 8,397Gross profit $ 10,205 $ (17) $ — $ — $ — $ 10,188Selling, general and administrative expenses $ 7,943 $ (16) $ (117) $ 30 $ — $ 7,840Operating profit $ 2,240 $ (1) $ 117 $ (30) $ — $ 2,326Provision for income taxes $ 218 $ (1) $ 22 $ (11) $ 230 $ 458Net income attributable to PepsiCo $ 1,718 $ — $ 95 $ (19) $ (230) $ 1,564Net income attributable to PepsiCo per common share - diluted $ 1.17 $ — $ 0.06 $ (0.01) $ (0.16) $ 1.06Effective tax rate 11.2% 22.5%
GAAPMeasure
Non-GAAPMeasure
Reported Non-Core Adjustments Core (a)
QuarterEnded
12/27/2014
Commoditymark-to-
market netimpact
Restructuring and
impairmentcharges (b)
Pension-related
settlementcharge
Venezuelaremeasurement
charge
QuarterEnded
12/27/2014 Cost of sales $ 9,364 $ (18) $ — $ — $ — $ 9,346Gross profit $ 10,584 $ 18 $ — $ — $ — $ 10,602Selling, general and administrative expenses $ 8,526 $ (82) $ (160) $ (141) $ (105) $ 8,038Operating profit $ 2,031 $ 100 $ 160 $ 141 $ 105 $ 2,537Provision for income taxes $ 455 $ 35 $ 40 $ 53 $ — $ 583Net income attributable to PepsiCo $ 1,311 $ 65 $ 120 $ 88 $ 105 $ 1,689Net income attributable to PepsiCo per common share - diluted $ 0.87 $ 0.04 $ 0.08 $ 0.06 $ 0.07 $ 1.12Effective tax rate 25.6% 25.5%
(a) Core results are financial measures that are not in accordance with GAAP and exclude the above non-core adjustments. See A-16 through A-19 for a discussion of each of these adjustments.(b) Restructuring and impairment charges include costs associated with the 2014 and 2012 Multi-Year Productivity Plans. See A-17 through A-18 for a discussion of these plans.Note – Certain amounts above may not sum due to rounding.
A - 9
PepsiCo, Inc. and SubsidiariesReconciliation of GAAP and Non-GAAP Information (cont.)
Certain Line ItemsYears Ended December 26, 2015 and December 27, 2014
(in millions except per share amounts, unaudited)
GAAP
MeasureNon-GAAP
Measure Reported Non-Core Adjustments Core (a)
YearEnded
12/26/2015
Commodity mark-to-
market netimpact
Restructuring and
impairmentcharges (b)
Pension-related
settlementbenefits
Chargerelated to thetransactionwith Tingyi
Venezuelaimpairment
chargesTax
benefit
YearEnded
12/26/2015Cost of sales $ 28,384 $ (18) $ — $ — $ — $ — $ — $ 28,366Gross profit $ 34,672 $ 18 $ — $ — $ — $ — $ — $ 34,690Selling, general and administrative expenses $ 24,885 $ 29 $ (230) $ 67 $ (73) $ — $ — $ 24,678Venezuela impairment charges $ 1,359 $ — $ — $ — $ — $ (1,359) $ — $ —Operating profit $ 8,353 $ (11) $ 230 $ (67) $ 73 $ 1,359 $ — $ 9,937Provision for income taxes $ 1,941 $ (3) $ 46 $ (25) $ — $ — $ 230 $ 2,189Net income attributable to PepsiCo $ 5,452 $ (8) $ 184 $ (42) $ 73 $ 1,359 $ (230) $ 6,788Net income attributable to PepsiCo per common share - diluted $ 3.67 $ — $ 0.12 $ (0.03) $ 0.05 $ 0.91 $ (0.15) $ 4.57Effective tax rate 26.1% 24.3%
GAAP
MeasureNon-GAAP
Measure Reported Non-Core Adjustments Core (a)
YearEnded
12/27/2014
Commoditymark-to-
market netimpact
Restructuring and
impairmentcharges (b)
Pension-related
settlement charge
Venezuelaremeasurement
charge
YearEnded
12/27/2014Cost of sales $ 30,884 $ 33 $ — $ — $ — $ 30,917Gross profit $ 35,799 $ (33) $ — $ — $ — $ 35,766Selling, general and administrative expenses $ 26,126 $ (101) $ (418) $ (141) $ (105) $ 25,361Operating profit $ 9,581 $ 68 $ 418 $ 141 $ 105 $ 10,313Provision for income taxes $ 2,199 $ 24 $ 99 $ 53 $ — $ 2,375Noncontrolling interests $ 45 $ — $ 3 $ — $ — $ 48Net income attributable to PepsiCo $ 6,513 $ 44 $ 316 $ 88 $ 105 $ 7,066Net income attributable to PepsiCo per common share - diluted $ 4.27 $ 0.03 $ 0.21 $ 0.06 $ 0.07 $ 4.63Effective tax rate 25.1% 25.0%
(a) Core results are financial measures that are not in accordance with GAAP and exclude the above non-core adjustments. See A-16 through A-19 for a discussion of each of these adjustments.(b) Restructuring and impairment charges include costs associated with the 2014 and 2012 Multi-Year Productivity Plans. See A-17 through A-18 for a discussion of these plans.Note – Certain amounts above may not sum due to rounding.

A - 10
PepsiCo, Inc. and SubsidiariesReconciliation of GAAP and Non-GAAP Information (cont.)
Operating Profit by DivisionQuarters Ended December 26, 2015 and December 27, 2014
(in millions, unaudited)
GAAP
Measure
Non-Core Adjustments
Non-GAAPMeasure
Reported Core (a)
Operating Profit
QuarterEnded
12/26/2015
Commoditymark-to-market
net impact
Restructuring and
impairment charges (b)
Pension-related
settlementbenefit
Quarter Ended
12/26/2015Frito-Lay North America $ 1,292 $ — $ 6 $ — $ 1,298Quaker Foods North America 179 — 1 — 180North America Beverages 639 — 14 (30) 623Latin America 214 — 20 — 234Europe Sub-Saharan Africa 221 — 52 — 273Asia, Middle East & North Africa 139 — 22 — 161Division Operating Profit 2,684 — 115 (30) 2,769Corporate Unallocated (444) (1) 2 — (443)Total Operating Profit $ 2,240 $ (1) $ 117 $ (30) $ 2,326
GAAP
Measure
Non-Core Adjustments
Non-GAAPMeasure
Reported Core (a)
Operating Profit
QuarterEnded
12/27/2014
Commoditymark-to-market
net impact
Restructuring and
impairment charges (b)
Pension-related
settlement charge
Venezuelaremeasurement
charge
Quarter Ended
12/27/2014Frito-Lay North America $ 1,230 $ — $ 13 $ — $ — $ 1,243Quaker Foods North America 172 — 12 — — 184North America Beverages 567 — 44 — — 611Latin America 453 — 18 — (21) 450Europe Sub-Saharan Africa 278 — 34 — — 312Asia, Middle East & North Africa 144 — 18 — — 162Division Operating Profit 2,844 — 139 — (21) 2,962Corporate Unallocated (813) 100 21 141 126 (425)Total Operating Profit $ 2,031 $ 100 $ 160 $ 141 $ 105 $ 2,537
(a) Core results are financial measures that are not in accordance with GAAP and exclude the above non-core adjustments. See A-16 through A-19 for a discussion of each of these adjustments.(b) Restructuring and impairment charges include costs associated with the 2014 and 2012 Multi-Year Productivity Plans. See A-17 through A-18 for a discussion of these plans.
A - 11
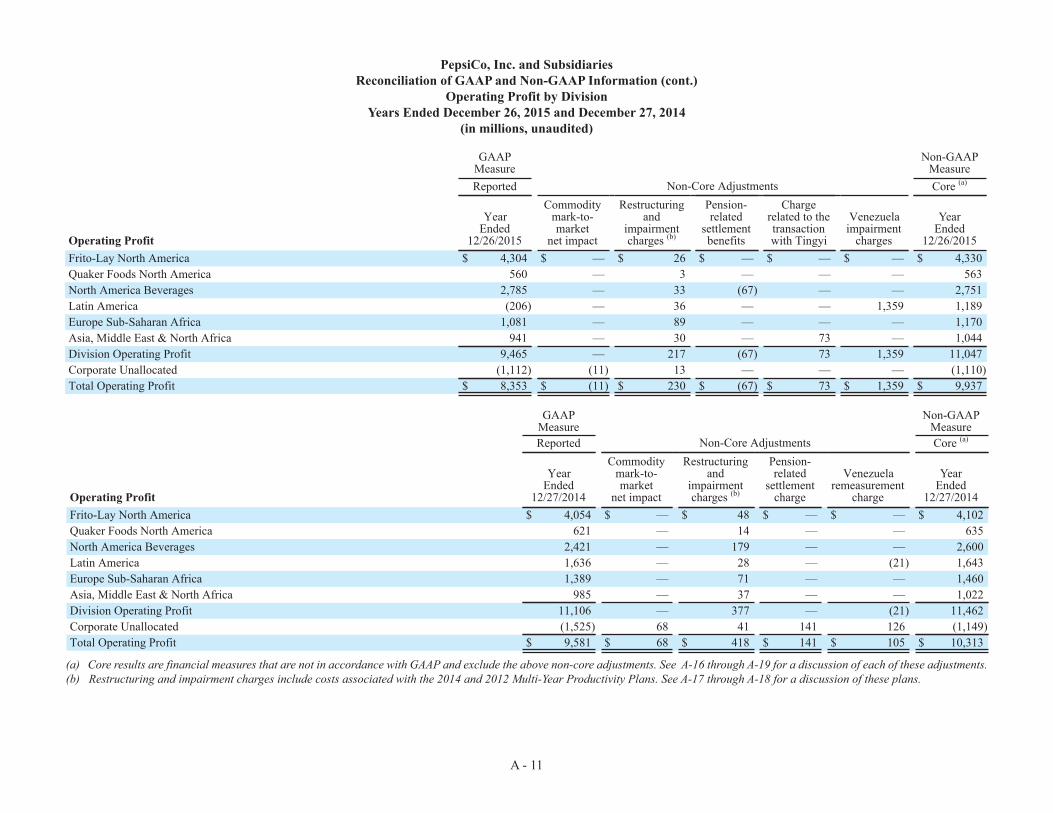
PepsiCo, Inc. and SubsidiariesReconciliation of GAAP and Non-GAAP Information (cont.)
Operating Profit by DivisionYears Ended December 26, 2015 and December 27, 2014
(in millions, unaudited)
GAAP
MeasureNon-Core Adjustments
Non-GAAPMeasure
Reported Core (a)
Operating Profit
YearEnded
12/26/2015
Commoditymark-to-market
net impact
Restructuring and
impairmentcharges (b)
Pension-related
settlementbenefits
Chargerelated to thetransactionwith Tingyi
Venezuelaimpairment
charges
Year Ended
12/26/2015Frito-Lay North America $ 4,304 $ — $ 26 $ — $ — $ — $ 4,330Quaker Foods North America 560 — 3 — — — 563North America Beverages 2,785 — 33 (67) — — 2,751Latin America (206) — 36 — — 1,359 1,189Europe Sub-Saharan Africa 1,081 — 89 — — — 1,170Asia, Middle East & North Africa 941 — 30 — 73 — 1,044Division Operating Profit 9,465 — 217 (67) 73 1,359 11,047Corporate Unallocated (1,112) (11) 13 — — — (1,110)Total Operating Profit $ 8,353 $ (11) $ 230 $ (67) $ 73 $ 1,359 $ 9,937
GAAP
MeasureNon-Core Adjustments
Non-GAAPMeasure
Reported Core (a)
Operating Profit
YearEnded
12/27/2014
Commoditymark-to-market
net impact
Restructuring and
impairmentcharges (b)
Pension-related
settlement charge
Venezuelaremeasurement
charge
Year Ended
12/27/2014Frito-Lay North America $ 4,054 $ — $ 48 $ — $ — $ 4,102Quaker Foods North America 621 — 14 — — 635North America Beverages 2,421 — 179 — — 2,600Latin America 1,636 — 28 — (21) 1,643Europe Sub-Saharan Africa 1,389 — 71 — — 1,460Asia, Middle East & North Africa 985 — 37 — — 1,022Division Operating Profit 11,106 — 377 — (21) 11,462Corporate Unallocated (1,525) 68 41 141 126 (1,149)Total Operating Profit $ 9,581 $ 68 $ 418 $ 141 $ 105 $ 10,313
(a) Core results are financial measures that are not in accordance with GAAP and exclude the above non-core adjustments. See A-16 through A-19 for a discussion of each of these adjustments.(b) Restructuring and impairment charges include costs associated with the 2014 and 2012 Multi-Year Productivity Plans. See A-17 through A-18 for a discussion of these plans.

A - 12
PepsiCo, Inc. and SubsidiariesReconciliation of GAAP and Non-GAAP Information (cont.)
(unaudited)
Gross Margin Growth Reconciliation
Quarter Ended Year Ended 12/26/2015 12/26/2015Reported Gross Margin Growth 185 bps 130 bpsCommodity Mark-to-Market Net Impact (18) 8Core Gross Margin Growth 167 bps 138 bps
Quaker Foods North America Operating Profit Growth Reconciliation
Quarter Ended Year Ended 12/26/2015 12/26/2015Reported Operating Profit Growth 4 % (10) %Restructuring and Impairment Charges (6) (1.5)Core Operating Profit Growth (1) (11)Impact of Foreign Exchange Translation 1 1Core Constant Currency Operating Profit Growth — (10)Impairment Charges Associated with Our Dairy Joint Venture 6 12Prior Year Gain Associated with a Divestiture of a Cereal Business — 3Core Constant Currency Operating Profit Growth Excluding Impairment Charges Associated
with Our Dairy Joint Venture and Gain Associated with a Divestiture of a Cereal Business 6 % 5 %
Latin America Operating Profit Growth Reconciliation
Quarter Ended Year Ended 12/26/2015 12/26/2015Reported Operating Profit Growth (53) % (113) %Restructuring and Impairment Charges 0.5 1Venezuela Impairment Charges — 83Venezuela Remeasurement Charge 4 1Core Operating Profit Growth (48) (28)Impact of Foreign Exchange Translation 17 37Core Constant Currency Operating Profit Growth (31) 9Net Impact of Efficiency Initiatives 8 2Impact of Excluding Venezuela from Q4 2014 Base (a) 9 4Core Constant Currency Operating Profit Growth Excluding Net Impact of Efficiency
Initiatives and Venezuela from Q4 2014 Base (13) % 15 %
(a) Represents the impact of the exclusion of the fourth quarter 2014 results of our Venezuelan businesses, which were deconsolidated as of the end of the third quarter of 2015.
Note – Certain amounts above may not sum due to rounding.

A - 13
PepsiCo, Inc. and SubsidiariesReconciliation of GAAP and Non-GAAP Information (cont.)
(unaudited)Total Divisions Operating Profit Growth Reconciliation
Quarter Ended Year Ended 12/26/2015 12/26/2015Reported Operating Profit Growth (6) % (15) %Restructuring and Impairment Charges (1) (1)Pension-Related Settlement (Benefits)/Charge (1) (1)Charge Related to the Transaction with Tingyi — 1Venezuela Impairment Charges — 12Venezuela Remeasurement Charge 1 —Core Operating Profit Growth (6) (4)Impact of Foreign Exchange Translation 6 9Core Constant Currency Operating Profit Growth (1) 5.5Impact of Excluding Venezuela from Q4 2014 Base (b) 2 0.5Core Constant Currency Operating Profit Growth Excluding Venezuela from Q4 2014 Base 1 % 6 %
Total PepsiCo Operating Profit Growth Reconciliation
Quarter Ended Year Ended 12/26/2015 12/26/2015Reported Operating Profit Growth 10 % (13) %Commodity Mark-to-Market Net Impact (4) (1)Restructuring and Impairment Charges (2) (2)Pension-Related Settlement (Benefits)/Charge (8) (2)Charge Related to the Transaction with Tingyi — 1Venezuela Impairment Charges — 14Venezuela Remeasurement Charge (5) (1)Core Operating Profit Growth (8) (4)Impact of Foreign Exchange Translation 7 10Core Constant Currency Operating Profit Growth (2) 6Impact of Excluding Venezuela from Q4 2014 Base (b) 2 1Core Constant Currency Operating Profit Growth Excluding Venezuela from Q4 2014 Base — % 7 %
Operating Margin Growth Reconciliation
Quarter Ended Year Ended 12/26/2015 12/26/2015Reported Operating Margin Growth 187 bps (112) bpsCommodity Mark-to-Market Net Impact (50) (12)Restructuring and Impairment Charges (17) (26)Pension-Related Settlement (Benefits)/Charge (87) (32)Charge Related to the Transaction with Tingyi — 12Venezuela Impairment Charges — 215Venezuela Remeasurement Charge (53) (16)Core Operating Margin Growth (20) bps 29 bps
(b) Represents the impact of the exclusion of the fourth quarter 2014 results of our Venezuelan businesses, which were deconsolidated as of the end of the third quarter of 2015.
Note – Certain amounts above may not sum due to rounding.
A - 14
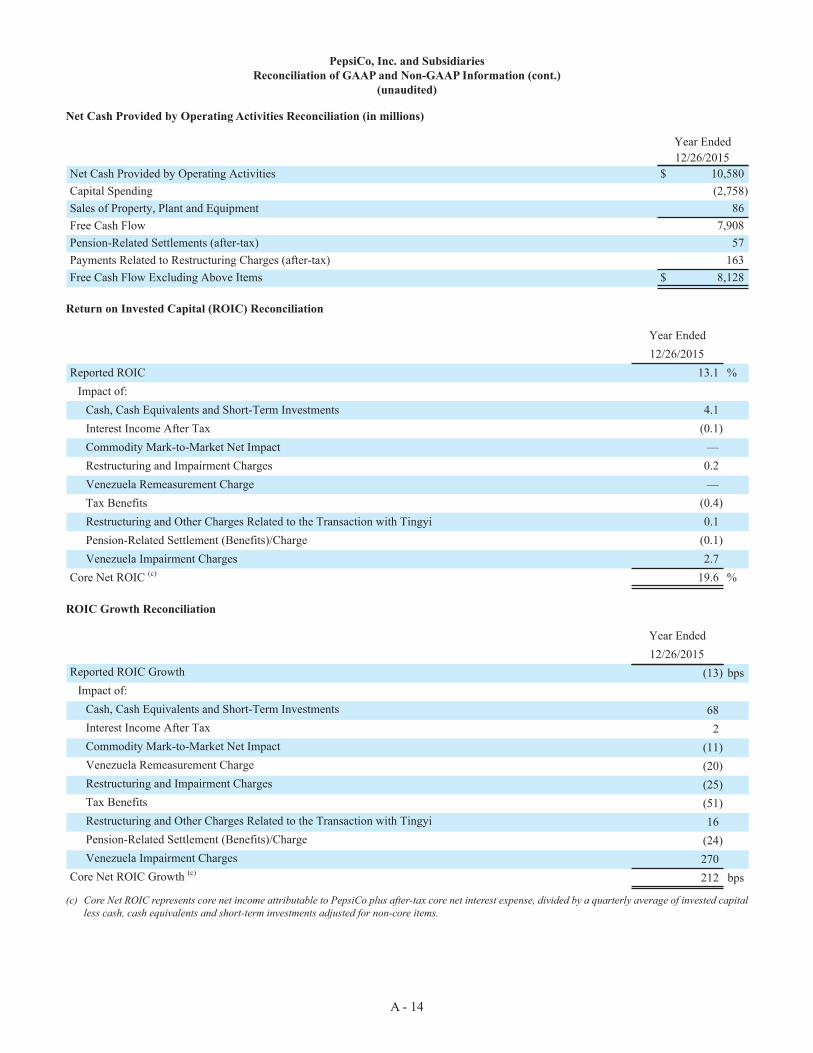
PepsiCo, Inc. and SubsidiariesReconciliation of GAAP and Non-GAAP Information (cont.)
(unaudited)
Net Cash Provided by Operating Activities Reconciliation (in millions)
Year Ended 12/26/2015
Net Cash Provided by Operating Activities $ 10,580Capital Spending (2,758)Sales of Property, Plant and Equipment 86Free Cash Flow 7,908Pension-Related Settlements (after-tax) 57Payments Related to Restructuring Charges (after-tax) 163Free Cash Flow Excluding Above Items $ 8,128
Return on Invested Capital (ROIC) Reconciliation
Year Ended 12/26/2015Reported ROIC 13.1 %
Impact of:Cash, Cash Equivalents and Short-Term Investments 4.1Interest Income After Tax (0.1)Commodity Mark-to-Market Net Impact —Restructuring and Impairment Charges 0.2Venezuela Remeasurement Charge —Tax Benefits (0.4)Restructuring and Other Charges Related to the Transaction with Tingyi 0.1Pension-Related Settlement (Benefits)/Charge (0.1)Venezuela Impairment Charges 2.7
Core Net ROIC (c) 19.6 %
ROIC Growth Reconciliation
Year Ended 12/26/2015Reported ROIC Growth (13) bps
Impact of:Cash, Cash Equivalents and Short-Term Investments 68Interest Income After Tax 2Commodity Mark-to-Market Net Impact (11)Venezuela Remeasurement Charge (20)Restructuring and Impairment Charges (25)Tax Benefits (51)Restructuring and Other Charges Related to the Transaction with Tingyi 16Pension-Related Settlement (Benefits)/Charge (24)Venezuela Impairment Charges 270
Core Net ROIC Growth (c) 212 bps
(c) Core Net ROIC represents core net income attributable to PepsiCo plus after-tax core net interest expense, divided by a quarterly average of invested capital less cash, cash equivalents and short-term investments adjusted for non-core items.

A - 15
PepsiCo, Inc. and SubsidiariesReconciliation of GAAP and Non-GAAP Information (cont.)
(unaudited)
Net Cash Provided by Operating Activities Reconciliation (in billions)
2016
GuidanceNet Cash Provided by Operating Activities $ ~ 10Net Capital Spending ~ 3Free Cash Flow ~ 7Certain Other Items (d) ~ —Free Cash Flow Excluding Certain Other Items $ ~ 7
(d) Certain other items include discretionary pension and retiree medical contributions and payments related to restructuring charges and the tax impact associated with these items, as applicable.

A - 16
Cautionary StatementStatements in this communication that are “forward-looking statements,” including our 2016 guidance, are based on currently available information, operating plans and projections about future events and trends. Terminology such as “aim,” “anticipate,” “believe,” “drive,” “estimate,” “expect,” “expressed confidence,” “forecast,” “future,” “goal,” “guidance,” “intend,” “may,” “objective,” “outlook,” “plan,” “position,” “potential,” “project,” “seek,” “should,” “strategy,” “target,” “will” or similar statements or variations of such terms are intended to identify forward-looking statements, although not all forward-looking statements contain such terms. Forward-looking statements inherently involve risks and uncertainties that could cause actual results to differ materially from those predicted in such forward-looking statements. Such risks and uncertainties include, but are not limited to: changes in demand for PepsiCo’s products, as a result of changes in consumer preferences or otherwise; changes in the legal and regulatory environment; imposition of new taxes, disagreements with tax authorities or additional tax liabilities; PepsiCo’s ability to compete effectively; PepsiCo’s ability to grow its business in developing and emerging markets or unstable political conditions, civil unrest or other developments and risks in the markets where PepsiCo’s products are made, manufactured, distributed or sold; unfavorable economic conditions in the countries in which PepsiCo operates; increased costs, disruption of supply or shortages of raw materials and other supplies; failure to realize anticipated benefits from PepsiCo’s productivity initiatives or global operating model; business disruptions; product contamination or tampering or issues or concerns with respect to product quality, safety and integrity; damage to PepsiCo’s reputation or brand image; failure to successfully complete or integrate acquisitions and joint ventures into PepsiCo’s existing operations or to complete or manage divestitures or refranchisings; changes in estimates and underlying assumptions regarding future performance that could result in an impairment charge; PepsiCo’s ability to recruit, hire or retain key employees or a highly skilled and diverse workforce; loss of any key customer or changes to the retail landscape; any downgrade or potential downgrade of PepsiCo’s credit ratings; the ability to protect information systems against, or effectively respond to, a cybersecurity incident or other disruption; PepsiCo’s ability to implement shared services or utilize information technology systems and networks effectively; fluctuations or other changes in exchange rates; climate change or water scarcity, or legal, regulatory or market measures to address climate change or water scarcity; failure to successfully negotiate collective bargaining agreements, or strikes or work stoppages; infringement of intellectual property rights; potential liabilities and costs from litigation or legal proceedings; and other factors that may adversely affect the price of PepsiCo’s common stock and financial performance.
For additional information on these and other factors that could cause PepsiCo’s actual results to materially differ from those set forth herein, please see PepsiCo’s filings with the Securities and Exchange Commission, including its most recent annual report on Form 10-K and subsequent reports on Forms 10-Q and 8-K. Investors are cautioned not to place undue reliance on any such forward-looking statements, which speak only as of the date they are made. PepsiCo undertakes no obligation to update any forward-looking statements, whether as a result of new information, future events or otherwise.
Miscellaneous DisclosuresIn discussing financial results and guidance, the company may refer to certain measures not in accordance with Generally Accepted Accounting Principles (GAAP). Reconciliations of any such non-GAAP measures to the most directly comparable financial measures in accordance with GAAP can be found in the attached exhibits, as well as on the company’s website at www.pepsico.com in the “Investors” section under “Events & Presentations.” Our non-GAAP measures exclude from reported results those items that management believes are not indicative of our ongoing performance and reflect how management evaluates our operating results and trends.
GlossaryAcquisitions and divestitures: All merger and acquisition activity, including the impact of acquisitions, divestitures and changes in ownership or control in consolidated subsidiaries and nonconsolidated equity investees.
Beverage volume: Volume shipped to retailers and independent distributors from both PepsiCo and our bottlers. Constant currency: Financial results assuming constant foreign currency exchange rates used for translation based on the rates in effect for the comparable prior-year period. In order to compute our constant currency results, we multiply or divide, as appropriate, our current year U.S. dollar results by the current year average foreign exchange rates and then multiply or divide, as appropriate, those amounts by the prior year average foreign exchange rates.
Core: Core results are non-GAAP financial measures which exclude certain items from our historical results. In 2015, core results exclude the commodity mark-to-market net impact included in corporate unallocated expenses, restructuring and impairment charges, pension-related settlement benefits, a charge related to the transaction with Tingyi, Venezuela impairment charges and a non-cash tax benefit. In 2014, core results exclude the commodity mark-to-market net impact included in corporate unallocated expenses, restructuring and impairment charges, a pension lump sum settlement charge and a Venezuela remeasurement charge. See “Reconciliation of GAAP and Non-GAAP Information” for additional information.

A - 17
Division operating profit: The aggregation of the operating profit for each of our reportable segments, which excludes the impact of corporate unallocated expenses.
Effective net pricing: Reflects the year-over-year impact of discrete pricing actions, sales incentive activities and mix resulting from selling varying products in different package sizes and in different countries.
Free cash flow: Net cash provided by operating activities less capital spending plus sales of property, plant and equipment. See above for a reconciliation of this non-GAAP financial measure to the most directly comparable financial measure in accordance with GAAP (operating cash flow).
Free cash flow, excluding certain items: Free cash flow, excluding: (1) payments related to restructuring charges, (2) pension-related settlements from previous acquisitions, and (3) the tax impacts associated with each of these items, as applicable. This non-GAAP financial measure is our primary measure used to monitor cash flow performance. Also referred to as “core free cash flow.” See above for a reconciliation of this non-GAAP financial measure to the most directly comparable financial measure in accordance with GAAP (operating cash flow). See “Reconciliation of GAAP and Non-GAAP Information” for additional information.
Mark-to-market gain or loss or net impact: Change in market value for commodity contracts that we purchase to mitigate the volatility in costs of energy and raw materials that we consume. The market value is determined based on average prices on national exchanges and recently reported transactions in the marketplace.
Net capital spending: Capital spending less cash proceeds from sales of property, plant and equipment. Organic: A measure that adjusts for impacts of acquisitions, divestitures and other structural changes, including the Venezuela deconsolidation, and foreign exchange translation. This measure excludes the fourth quarter 2014 results of our Venezuelan businesses, which were deconsolidated effective as of the end of the third quarter of 2015. This measure also excludes the impact of the 53rd reporting week in 2016. In excluding the impact of foreign exchange translation, we assume constant foreign exchange rates used for translation based on the rates in effect for the comparable prior-year period. See the definition of “Constant currency” for additional information.
Reconciliation of GAAP and Non-GAAP Information (unaudited)Division operating profit, core results, core constant currency results and organic results are non-GAAP financial measures as they exclude certain items noted below. These measures are not in accordance with GAAP. However, we believe investors should consider these measures as they are indicative of our ongoing performance and reflect how management evaluates our operational results and trends. These measures are not, and should not be viewed as, substitutes for GAAP reporting measures.
Commodity mark-to-market net impact
In the quarter and year ended December 26, 2015, we recognized $1 million and $11 million of mark-to-market net gains, respectively, on commodity hedges in corporate unallocated expenses. In the quarter and year ended December 27, 2014, we recognized $100 million and $68 million of mark-to-market net losses, respectively, on commodity hedges in corporate unallocated expenses. We centrally manage commodity derivatives on behalf of our divisions. These commodity derivatives include agricultural products, metals and energy. Commodity derivatives that do not qualify for hedge accounting treatment are marked to market each period with the resulting gains and losses recorded in corporate unallocated expenses, as either cost of sales or selling, general and administrative expenses, depending on the underlying commodity. These gains and losses are subsequently reflected in division results when the divisions recognize the cost of the underlying commodity in operating profit.
Restructuring and impairment charges
2014 Multi-Year Productivity Plan
In the quarter and year ended December 26, 2015, we incurred restructuring charges of $75 million and $169 million, respectively, in conjunction with the multi-year productivity plan we publicly announced in 2014 (2014 Productivity Plan). In the quarter and year ended December 27, 2014, we incurred restructuring charges of $130 million and $357 million, respectively, in conjunction with our 2014 Productivity Plan. The 2014 Productivity Plan includes the next generation of productivity initiatives that we believe will strengthen our food, snack and beverage businesses by: accelerating our investment in manufacturing automation; further optimizing our global manufacturing footprint, including closing certain manufacturing facilities; re-engineering our go-to-market systems in developed markets; expanding shared services; and implementing simplified organization structures to drive efficiency. The 2014 Productivity Plan is in addition to the 2012 Productivity Plan and is expected to continue the benefits of that plan.

A - 18
2012 Multi-Year Productivity Plan
In the quarter and year ended December 26, 2015, we incurred restructuring charges of $42 million and $61 million, respectively, in conjunction with the multi-year productivity plan we publicly announced in 2012 (2012 Productivity Plan). In the quarter and year ended December 27, 2014, we incurred restructuring charges of $30 million and $61 million, respectively, in conjunction with our 2012 Productivity Plan. The 2012 Productivity Plan included actions in every aspect of our business that we believe would strengthen our complementary food, snack and beverage businesses by: leveraging new technologies and processes across PepsiCo’s operations, go-to-market and information systems; heightening the focus on best practice sharing across the globe; consolidating manufacturing, warehouse and sales facilities; and implementing simplified organization structures, with wider spans of control and fewer layers of management. The 2012 Productivity Plan has enhanced PepsiCo’s cost-competitiveness and provided a source of funding for future brand-building and innovation initiatives.
Pension-related settlements
In the quarter and year ended December 26, 2015, we recorded pension-related settlement benefits of $30 million and $67 million, respectively, associated with the settlement of pension-related liabilities from previous acquisitions.
In the quarter and year ended December 27, 2014, we recorded a pension lump sum settlement charge of $141 million related to payments for pension liabilities to certain former employees who had vested benefits.
Charge related to the transaction with Tingyi
In 2015, we recorded a pre- and after-tax charge of $73 million ($0.05 per share) related to a write-off of the recorded value of a call option to increase our holding in TAB to 20%.
Venezuela Prior to the end of the third quarter of 2015, the financial position and results of operations of our Venezuelan businesses, which consist of our wholly-owned subsidiaries and our beverage joint venture with our franchise bottler in Venezuela, were reported under highly inflationary accounting, with the functional currency of the U.S. dollar.
The evolving conditions in Venezuela, including increasingly restrictive exchange control regulations and reduced access to dollars through official currency exchange markets, resulted in an other-than-temporary lack of exchangeability between the Venezuelan bolivar and the U.S. dollar, which, together with other factors, significantly impacted our ability to effectively manage our Venezuelan businesses. As a result, effective as of the end of the third quarter of 2015, we concluded that we did not meet the accounting criteria for control over our wholly-owned Venezuelan subsidiaries, and therefore we deconsolidated our wholly-owned Venezuelan subsidiaries effective as of the end of the third quarter of 2015. We also concluded that, effective as of the end of the third quarter of 2015, we no longer had significant influence over our joint venture, which was previously accounted for under the equity method. As a result of these conclusions, effective at the end of the third quarter of 2015, we began accounting for our investments in our wholly-owned Venezuelan subsidiaries and our joint venture using the cost method of accounting and recorded pre- and after-tax charges of $1.4 billion in our Consolidated Statement of Income to reduce the value of the cost method investments to their estimated fair values, resulting in a full impairment. The impairment charges primarily included approximately $1.2 billion related to our investments in previously consolidated Venezuelan subsidiaries and our joint venture, and $111 million related to the reclassification of cumulative translation losses. The estimated fair value of the investments in our Venezuelan entities was derived using discounted cash flow analyses, including U.S. dollar exchange and discount rate assumptions that reflect the inflation and economic uncertainty in Venezuela, and are considered non-recurring Level 3 measurements within the fair value hierarchy. The factors that led to the above-mentioned conclusions at the end of the third quarter of 2015 continued to exist as of the end of 2015.
As of the end of 2015, consistent with the end of the third quarter of 2015, we did not consolidate the assets and liabilities of our Venezuelan subsidiaries in our Consolidated Balance Sheet. Beginning in the fourth quarter of 2015, we no longer included the results of our Venezuelan businesses in our Consolidated Statement of Income and our financial results only included revenue relating to the sales of inventory to our Venezuelan entities to the extent cash was received for those sales. In 2015, the results of our operations in Venezuela, which include the months of January through August, generated 2% of our net revenue and 2% of our operating profit, prior to the impairment charges of $1.4 billion.
Any dividends from our Venezuelan entities will be recorded as income upon receipt of the cash. We did not receive any U.S. dollars in the fourth quarter of 2015 from our Venezuelan entities. Our ongoing contractual commitments to our Venezuelan businesses are not material.
Venezuela impairment charges
In the year ended December 26, 2015, we recorded pre- and after-tax charges of $1.4 billion related to the impairment of investments in our wholly-owned Venezuelan subsidiaries and beverage joint venture.
A - 19
Venezuela remeasurement charge
In the quarter and year ended December 27, 2014, we recorded a $105 million net charge related to our remeasurement of the bolivar for certain net monetary assets of our Venezuelan businesses. $126 million of this charge was recorded in corporate unallocated expenses, with the balance (equity income of $21 million) recorded in our Latin America segment.
Free cash flow, excluding certain items
Free cash flow (excluding the items noted in the Net Cash Provided by Operating Activities Reconciliation table) is the primary measure management uses to monitor cash flow performance. This is not a measure defined by GAAP. Since net capital spending is essential to our product innovation initiatives and maintaining our operational capabilities, we believe that it is a recurring and necessary use of cash. As such, we believe investors should also consider net capital spending when evaluating our cash from operating activities. Additionally, we consider certain other items (included in the Net Cash Provided by Operating Activities Reconciliation table) in evaluating free cash flow that we believe investors should consider in evaluating our free cash flow results.
Tax benefit
In the year ended December 26, 2015, we recognized a non-cash tax benefit of $230 million associated with our agreement with the IRS resolving substantially all open matters related to the audits for taxable years 2010 through 2011, which reduced our reserve for uncertain tax positions for the tax years 2010 through 2011.
2016 guidance
Our 2016 core tax rate guidance and our 2016 core constant currency EPS growth guidance exclude the commodity mark-to-market net impact included in corporate unallocated expenses and restructuring and impairment charges. Our 2016 organic revenue growth guidance excludes the impact of acquisitions, divestitures and other structural changes, including the Venezuela deconsolidation, and foreign exchange translation. Our 2016 organic revenue growth guidance also excludes the impact of a 53rd reporting week in 2016. In addition, our 2016 organic revenue growth guidance and our 2016 core constant currency EPS growth guidance exclude the impact of foreign exchange. We are not able to reconcile our full year projected 2016 core tax rate to our full year projected 2016 reported tax rate and our full year projected 2016 core constant currency EPS growth to our full year projected 2016 reported EPS growth because we are unable to predict the 2016 impact of foreign exchange or the mark-to-market net impact on commodity hedges due to the unpredictability of future changes in foreign exchange rates and commodity prices. We are also unable to reconcile our full year projected 2016 organic revenue growth to our full year projected 2016 reported net revenue growth because we are unable to predict the 2016 impact of foreign exchange due to the unpredictability of future changes in foreign exchange rates. Therefore, we are unable to provide a reconciliation of these measures.