perception of car brands with an emphasis on expected
TRANSCRIPT

Perception of car brands with an emphasis on expected benefits and features as prerequisites for customer satisfaction
Katarina JANOSKOVA
University of Zilina, Zilina, Slovakia [email protected]
Pavol KRAL
University of Zilina, Zilina, Slovakia
Gheorghe H. POPESCU
Christian University, Bucharest, Romania
Zuzana ROWLAND School of Expertness and Valuation, Ceske Budejovice, Czech Republic
Katarina KRAMAROVA
University of Zilina, Zilina, Slovakia
Abstract. Brand management plays a crucial role in increasing the loyalty of current customers as well as in gaining new customers. The product brand significantly influences shopping behaviour of customers. Many customers prefer branded products to non-branded ones. Some of them prefer branded products in general; some of them prefer branded products only for selected products. This paper is focused on the analysis of the perception of ten favourite car brands by Slovak consumers with an emphasis on the quality, prestige, image and expected benefits and features. The aims of the paper are divided into three main parts: i) find out the selected car brand rank based on the influence on the purchasing behaviour of Slovak consumers; ii) assess the impact of selected socio-demographic characteristics on the expected benefits as well as on the features that the respondent´s chosen car brand should have; iii) identify the main reason why respondents focus on preferred car brands. The correlation of these factors was tested on a sample of 2002 respondents from the Slovak republic. The analysed data represent a partial result of an extensive survey. The chosen mathematical-statistical methods such as correlation analysis and testing of statistical hypotheses were applied to fulfil the purpose of the research. Based on a survey, the most influential car brands include Skoda and Volkswagen. Especially the Skoda brand has a significant position in Slovakia, given by tradition, history and place of production of these cars.
Keywords: brand, customer perception, brand perception, marketing research, Slovakia, Chi-Square test Please cite the article as follows: Janoskova, K., Kral, P., Popescu, G. H., Rowland, Z., and Kramarova,
K. (2021), “Perception of car brands with an emphasis on expected benefits and features as
prerequisites for customer satisfaction”, Management & Marketing. Challenges for the Knowledge
Society, Vol. 16, No. 3, pp. 300-315. DOI: 10.2478/mmcks-2021-0018.
301:MMCKS
Vol. 16, No. 3, pp. 300-315, ISSN 2069–8887| Management & Marketing. Challenges for the Knowledge Society
Introduction From the consumer´s point of view, the car is one of the primary means of meeting the need to move. Buying a car is related to the rational shopping behaviour. All attributes of brand can be considered as an important determinant in the decision-making process. For this reason, it is very important to monitor this sector from the perspective of car brand perception by Slovak consumers. Nowadays the automotive industry is undergoing significant technological change. From the marketing point of view, this situation is seen as a technical redefinition of the market because car manufacturers are forced to adapt to the regulation/trends/ constraints imposed by environmental legislation. On the one hand, this situation can be perceived as a limitation, but on the other hand, it can be perceived as a space suitable for the implementation of new branding strategies, based on which we expect a new rearrangement of the vehicle market, respectively changing the attitudes and perceptions of existing automotive brands. Nowadays, vehicle manufacturers have the opportunity to change their brand´s perception from the consumers’ perspective and their attitudes toward particular car brands.
The aims of paper are divided into three main parts: i) find out the selected car brand rank based on the influence on the purchasing behaviour of Slovak consumers; ii) assess the impact of selected socio-demographic characteristics (age, gender, economic status, net monthly income and education) on the expected benefits as well as on the features that respondent´s chosen car brand should have; iii) identify the main reasons why respondents focus on preferred car brands.
Literature review The literature review will present important works and studies discussing the possibilities of increasing customer satisfaction, expectations, attitudes and preferences in relation to branded products, with a closer focus on cars. Due to the growing competition and changes in the business environment, companies need to implement customer-focused strategies that are based on service quality, customer satisfaction and customer loyalty (Ngo & Nguyen, 2016). Current customers have various attitudes and requirements. Sanayei & Shafeai (2009) addressed the diversity of these attitudes. They state that many customer attitudes cannot be measurable by traditional ways. A satisfied customer is the key to the success and long-term existence of a company on the market. Customer satisfaction is a prerequisite for competitive advantage. The importance of customer satisfaction is generally known and accepted fact needed for the long-term success of the company in the current market environment. Currently, the customer has a choice from a number of competitive alternatives for almost every purchase decision. Therefore, for the company it is no longer enough to offer only quality products and passively wait for the customer. It must do much more. The company must obtain its customers and then retain them through a wide range of additional services, through an approach and actions in every moment of cooperation between them (Nadanyiova, 2014; Gygler & Sroka, 2017; Fanelli & Ryden, 2018; Gorb, 2017; Kasych & Vochozka, 2017). Customer satisfaction is a crucial determinant of business success that lies in the identification of factors influencing customer satisfaction (Wen & Lurie, 2018). Brand is a very important factor that affects the perceptions and evaluations of customer. Many

302:MMCKS
Vol. 16, No. 3, pp. 300-315, ISSN 2069–8887| Management & Marketing. Challenges for the Knowledge Society
authors agree that a brand evokes in consumers emotions influenced by their experience with the brand (Krizanova et al., 2013, Krizanova & Majerova, 2015; Kliestikova et al., 2019; Mirica, 2018; Kanovska, 2018; Mala & Bencikova, 2018). Branding is considered a separete marketing tool, which is an important factor – it is the product feature that distinquishes it from competing products. (Moravcikova et al., 2017). The buying decision of the customers and their satisfaction are significantly affected by the brand (Gogolova & Majerova, 2014). All the more so if we talk about cars where consumers usually behave rationally and given that the buying decision is influenced by various factors. A significant factor that is related to the brand is quality. While quality is perceived by customers through visible signals such as quality labels, certification marks, or seals approval (Moussa & Touzani, 2008 in Yu et al., 2018), Valaskova et al. (2018) conclude that the attitudes of consumers towards the brand are not the same in all cases. The attitudes and expectations of customers are affected by their different socio-demographic characteristics, such as age, income or family status. On the other hand, dependence between consumers´ attitudes and selected socio-demographic characteristics is relatively weak. The most common reason why customers buy branded products are cost effectiveness, quality, and loyalty to the retailer. It is possible to find many studies provided the same results. The perception of the brand from the customer´s perspective and their satisfaction is influenced by many factors and the company´s activities.
Measuring customer satisfaction is an important part of marketing research in enterprise modelling. It is the key to formulate customer value strategies and continuously improve them. These issues were the focus of many authors´ interests, e. g. Zarandi et al. (2004) whose research deals with the fuzzy querying language of regular relational databases called SQLf.
Even in the case of the automotive industry, the car brand is unconditionally associated with quality. Car manufacturers must constantly improve the quality of cars, which is associated with pressures to reduce time to develop new products. The product development process is under pressure, because automotive companies want to achieve higher customer satisfaction, improve business effectiveness, and develop higher-quality products with fewer resources in less time. Customer satisfaction is considered in the automotive industry to be an important factor of product performance in the marketplace and its measurement is necessary to set future goals for further improvement (Yadav & Goel, 2008).
One of the main goals of automotive companies is to ensure increased customer satisfaction. This issue is the main topic of research by Sicoe et al. (2017) who investigated the possibility of improvement of customer satisfaction through Quality Assurance Matrix and QC-Story methods. Customer satisfaction is a key topic of several authors, e.g. Mills et al. (2016), whose research is focused on customer needs profitability in the automotive industry.
Many studies deal with the issue of customer satisfaction in the context of customers´ personal characteristics. Research realized by Suchanek & Kralova (2018) is based on the assumption that personal characteristics influence satisfaction as well as how the customer views satisfaction. The main personal characteristics used in their research were gender, age and income. Nath (2009) dealt with customer expectations toward the car in an unorganized environment. His main findings are that the customers´ decision to buy a

303:MMCKS
Vol. 16, No. 3, pp. 300-315, ISSN 2069–8887| Management & Marketing. Challenges for the Knowledge Society
new generation car is influenced by several factors that can be identified as economic benefit factor and social benefit factor.
Consumers´ behavior is influenced by several motivating determinants such as customer attitudes that reflect the customer´s positive and negative internal feelings in the context of the brand. Customer attitudes are not visible, but can be derived from the consumer behaviors and communication. Customer attitudes are created based on own experience with the brand and available brand information. Moons & Pelsmacke (2015) distinguish between products with functional and symbolic positioning. Functional products are related to the functional associations, and symbolic products are related to more abstract associations. Our research is focused on the behavioural and symbolic meaning that cars carry, such as attitudes, expectations, benefits, and level of customer’s satisfaction. Vehicle technical characteristics and parameters are not its point of interest.
Methodology The data analysed in order to fulfil the research goals were obtained through a marketing survey conducted by an external marketing agency in March 2018. This extensive survey was part of a long-term research task focused on creating and integrating financial-behavioural model for brand management in the specific conditions of Slovakia. The survey examined the preferences, attitudes and expectations of Slovak consumers in relation to the brands of selected products: banks, coke drinks, sportswear and automobiles.
This article presents only results from one part of this survey – consumer preferences toward car brands.
The survey sample was selected by the simple random sampling method. Survey sample contains respondents who are at least 16 years old. The survey was conducted through a questionnaire that contained 34 questions. Respondents expressed their preferences through the 5-point Likert scale (1 - completely disagree; 2 – rather disagree; 3 - neutral; 4 – rather agree; 5 - absolutely agree). Socio-demographic characteristics of respondents are presented in tab. 1.
Table 1.Basic characteristics of the sample of respondents
Gender male female
985 (49 %) 1017 (51 %)
Age 16 - 25 26 - 35 36 - 45 46 - 55 55 - 65 66 and more
438 (22 %) 423 (21 %) 377 (19 %) 381 (19 %) 293 (15 %) 90 (4 %)
Education primary/vocational secondary university
1071 (53 %) 687 (34 %) 244 (12%)
Status student employed unemployed
self-employed
retired maternity
leave
330 (16 %) 965 (48 %) 128 (6 %) 123 (6 %) 314 (16 %) 142 (7 %)
Net monthly household income
up to 500 € 501 – 1000€ 1001 - 1500 € 1501 – 2000 € 2001 – 2500 € over 2500 €
342 (17 %) 692 (35 %) 558 (28 %) 255 (13 %) 88 (4 %) 67 (3 %)
Source: Authors’ own research.
304:MMCKS
Vol. 16, No. 3, pp. 300-315, ISSN 2069–8887| Management & Marketing. Challenges for the Knowledge Society
The sample size was sufficient and balanced in terms of gender, and age. The final sample contained 2002 respondents, of which 49.2% (985) were males and 50.8% (1017) were females. Respondents from all regions of Slovakia participated in the survey. The average age of the respondents was 39.8 years. The most numerous group in terms of education were respondents with the primary/vocational education (1071; 53.5%) and the smallest groups was respondents with a university degree (244; 12.2%). The most frequent status of respondents was employed (965; 48.2%) and the less frequent status was self-employed (123; 6%). The last monitored area within the basic characteristics of respondents was the net monthly household income, where the most numerous group consisted of respondents living in a household with the net monthly income in range of 501 – 1000 Eur.
The data obtained through the survey were evaluated and analyzed using mathematical – statistical methods. In order to meet the aims of research, the hypotheses were formulated. These hypotheses were verified by applying the Chi-square test at a significance level of 0.05. If the dependence between the variables was confirmed using the Pearson´s chi-squared coefficient, we verified its strength by means of Cramer´s V Coefficient and the Contingency Coefficient. Three degrees of dependence were applied:
• weak – value of coefficient from 0 to 0.3; • moderate – value of coefficient between 0.3 and 0.8; • strong – value of coefficient between 0.8 and 1.0.
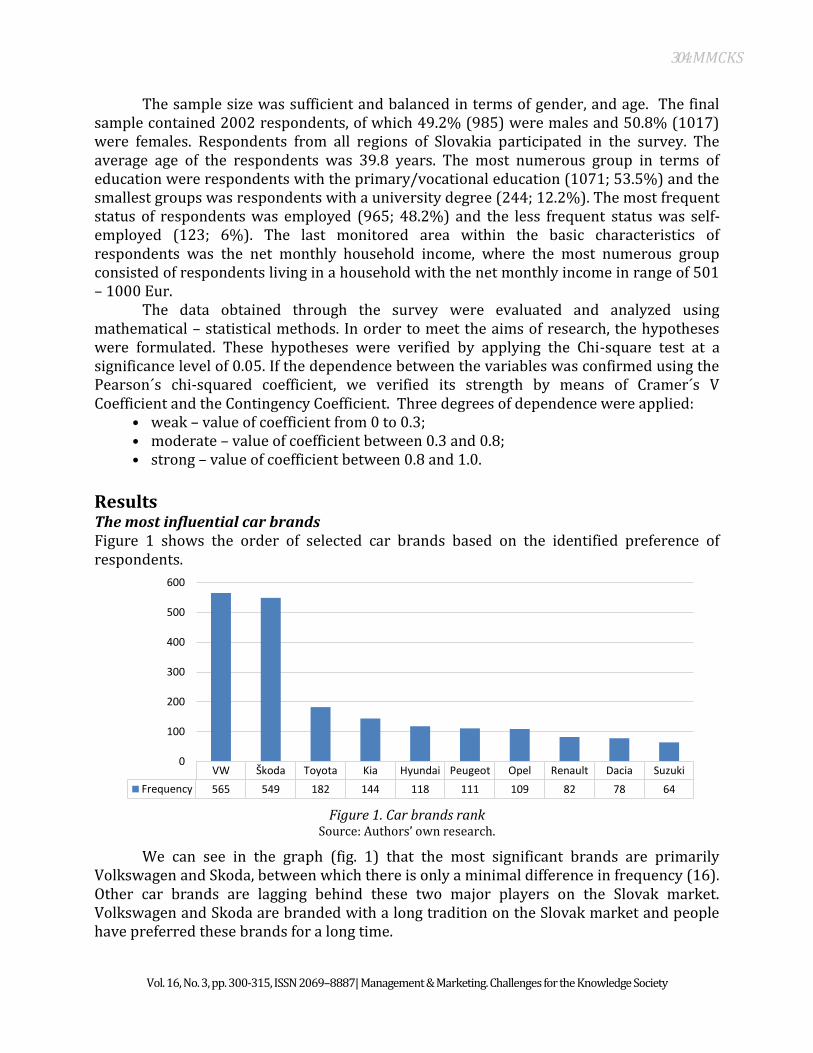
Results The most influential car brands Figure 1 shows the order of selected car brands based on the identified preference of respondents.
Figure 1. Car brands rank
Source: Authors’ own research.
We can see in the graph (fig. 1) that the most significant brands are primarily Volkswagen and Skoda, between which there is only a minimal difference in frequency (16). Other car brands are lagging behind these two major players on the Slovak market. Volkswagen and Skoda are branded with a long tradition on the Slovak market and people have preferred these brands for a long time.
VW Škoda Toyota Kia Hyundai Peugeot Opel Renault Dacia Suzuki
Frequency 565 549 182 144 118 111 109 82 78 64
0
100
200
300
400
500
600

305:MMCKS
Vol. 16, No. 3, pp. 300-315, ISSN 2069–8887| Management & Marketing. Challenges for the Knowledge Society
The questionnaire contained a question through which we found out which three car brands are the first that they imagine after reading the question. The first car brand is Skoda with a frequency of 1047. This result was expected because of the biggest market share of Skoda car in Slovakia. The second most frequently ranked was BMW (634) and Audi ranked third (631). The Volkswagen brand ranks fourth (504) and Mercedes with a frequency of 398 closes the cap. Other brands are Kia (382), Opel (267), Ford (218), Peugeot (192), Renault (168), Mazda (146), Toyota (145), Fiat (134), Volvo (128), Citroen (119), Seat (93), Hyundai (80), Suzuki (78), Nissan (78), Porsche (58), Dacia (55), Honda (43), Ferrari (42), Jaguar (36), Mitsubishi (27), Subaru (26), Alfa Romeo (20), Chevrolet (18), Lexus (17), and Tesla (17).
Based on the above, we can confirm that the production of cars is most closely associated with the Skoda brand, which many Slovak customers consider the domestic brand. Skoda brand certainly gained the initial position because of the effective communication policy implemented on the domestic market as well as abroad (Gogolova & Majerova, 2014).
We assumed that consumers are different and the expected benefits and features will be greatly influenced by their socio-demographic characteristics. The impact of socio-demographic characteristics on expected benefits and features Customers expect the purchased products (in our case, cars) brings them some benefits. These expected benefits represent a significant factor in the purchasing decision. Customers are different, and so are the benefits they expect from products. In our research, we focused on the expected benefits such as feeling happy, better social status, making new friends, attractiveness, and lifestyle. In the first part of the research, we focused on finding out how the mentioned expected benefits differ depending on different socio-demographic characteristics such as gender, age, economic status, education, and net income. In order to verify this fact, the first hypothesis was formulated:
H0: There is no dependency between the selected socio-demographic character and the expected benefit.
H1: There is a dependency between the selected socio-demographic character and the expected benefit.
In order to meet the partial goal of research, 25 hypotheses were tested applying the Chi-square test at the significance level 0.05. Results are presented in the summary table (tab. 2) that contains degree of correlation, statistical significance and values of Cramer´s V coefficient and Contingency coefficient.
Table 2. Testing the dependence between socio-demographic characteristics and expected benefits
Expected benefit
Socio-demographic data
Age (A1) Gender
(A2) Economic
status (A3) Net monthly income (A4)
Education (A5)
Makes me happier (B1)
Degree of correlation low low independent low low
Statistical significance yes yes - yes yes
Cramer´s V 0.067 0.091 - 0.072 0.075
Contingency Coefficient 0.132 0.091 - 0.143 0.105

306:MMCKS
Vol. 16, No. 3, pp. 300-315, ISSN 2069–8887| Management & Marketing. Challenges for the Knowledge Society
Increases my social status (B2)
Degree of correlation low low independent independent independent
Statistical significance yes yes - - -
Cramer´s V 0.071 0.083 - - -
Contingency Coefficient 0.141 0.083 - - -
Makes easier to make friends (B3)
Degree of correlation low low independent independent low
Statistical significance yes yes - - yes
Cramer´s V 0.066 0.105 - - 0.075
Contingency Coefficient 0.130 0.104 - - 0.105
Attracts attention(B4)
Degree of correlation low low independent low low
Statistical significance yes yes - yes yes
Cramer´s V 0.074 0.090 - 0.072 0.066
Contingency Coefficient 0.146 0.090 - 0.143 0.093
Belong to my lifestyle (B5)
Degree of correlation independent independent independent low independent
Statistical significance - - - yes -
Cramer´s V - - - 0.080 -
Contingency Coefficient - - - 0.158 -
Source: Authors’ own research.
The assumption that there is a significant relationship between socio-demographic characteristics and expected benefits has only been partially confirmed. The dependence was confirmed only between some variables (A1/B1, A1/B2, A1/B3, A1/B4, A2/B1, A2/B2, A2/B3, A2/B4, A4/B1, A4/B4, A4/B5, A5/B1, A5/B3, and A5/B4). A very interesting finding is that the economic status does not affect customer expectations, while in the case of products such as a car, we expected this dependence. The most influential factors are age and gender, where we identified a low impact on expected benefits (B1 – B4). This dependence is low, but statistically significant.
Customers tend to associate car brands with certain features that they expect from a car of that brand. These features, as well as the expected benefits, are an important factor in the purchasing decision. Even in this case, the expected features differ depending on various factors, such as socio-demographic characteristics, but also the amount of information that a potential customer has about a particular car brand. In our research, we focused on the expected features such as prestige, quality, modernity, and security. In the second part of the research, we focused on finding out how the mentioned expected features differ depending on different socio-demographic characteristic such as gender, age, economic status, net income, and education. In order to verify this fact, the second hypothesis was formulated:
H0: There is no dependency between the selected socio-demographic character and the expected features
H1: There is a dependency between the selected socio-demographic character and the expected features
In order to meet the second partial goal of research, 20 hypotheses were tested by applying the Chi-square test at the significance level 0.05. Results are presented in the summary table (tab. 3), which contains the degree of correlation, statistical significance and values of Cramer´s V coefficient and Contingency coefficient.

307:MMCKS
Vol. 16, No. 3, pp. 300-315, ISSN 2069–8887| Management & Marketing. Challenges for the Knowledge Society
Table 3. Testing the dependence between socio-demographic characteristics and expected features
Expected benefit
Socio-demographic data
Age (A1) Gender
(A2) Economic
status (A3) Net monthly income (A4)
Education (A5)
Prestige (C1) Degree of correlation independent independent independent independent low
Statistical significance - - - - yes
Cramer´s V - - - - 0.068
Contingency Coefficient - - - - 0.096
Quality (C2) Degree of correlation low independent low low low
Statistical significance yes - yes yes yes
Cramer´s V 0.069 - 0.068 0.083 0.068
Contingency Coefficient 0.136 - 0.134 0.165 0.096
Modernity(C3) Degree of correlation low independent low low low
Statistical significance yes - yes yes yes
Cramer´s V 0.066 - 0.067 0.091 0.078
Contingency Coefficient 0.130 - 0.132 0.178 0.110
Security (C4) Degree of correlation independent low independent low independent
Statistical significance - yes - yes -
Cramer´s V - 0.080 - 0.065 -
Contingency Coefficient - 0.080 - 0.128 -
Source: Authors’ own research.
The assumption that there is a significant relationship between socio-demographic characteristics and expected features of the preferred car brand has only been partially confirmed. In most cases, the null hypothesis was adopted. The dependence was confirmed only between some variables (A1/C2, A1/C3, A2/C4, A3/C2, A3/C3, A4/C2, A4/C3, A4/C4, A5/C1, A5/C2, A5/C3), but in all cases, the dependency is very low, however statistically significant.
Main reasons to focus on preferred car brands The next part of the research was focused on investigating the reasons why consumers buy a preferred car brand. Respondents in the questions expressed their agreement with the statements using a scale of 1 to 5, where 1 means strong disagreement and 5 means strong agreement. Values 2 – 4 provided a more sensible choice of response. Three hypotheses were formulated:
H1: There is no dependency between focusing on a preferred car brand and expecting a certain level of quality.
H2: There is no dependency between focusing on a preferred car brand and a feeling of happiness.
H3: There is no dependency between focusing on a preferred car brand and increasing social status.

308:MMCKS
Vol. 16, No. 3, pp. 300-315, ISSN 2069–8887| Management & Marketing. Challenges for the Knowledge Society
The purpose of testing the first hypothesis was to verify if the reason for buying a preferred car brand is that customers associate the preferred brand with expecting a certain level of quality.
H0: There is no dependency between focusing on a preferred car brand and expecting a certain level of quality.
H1: There is a dependency between focusing on a preferred car brand and expecting a certain level of the quality.
A total of 1,837 respondents answered these questions. The rest of the respondents (165) were unable to comment on the issues. Frequencies are in the following crosstable (tab. 4).
Table 4. Crosstab – Focusing on preferred car brand vs. expecting quality
Expecting of Quality TOTAL
1* 2 3 4 5**
Focusing on preferred car brand
1* 24 11 22 48 146 251 2 13 15 58 86 104 276
3 9 17 112 178 228 544
4 3 3 22 164 263 455
5** 1 5 3 23 279 311
TOTAL 50 51 217 499 1020 1837
* Completely disagree ** Absolutely agree
Source: own processing using IBM SPSS Statistics ver. 25
The most numerous combination of answers (279) is a strong agreement with both statements. Based on this quick analysis we can assume that there is some dependence between these variables. This group of respondents contains inhabitants with the following characteristics: male, primary or lower secondary education, employed, aged from 26 to 35 years.
Table 5. Chi-Square Test – Focusing on preferred car brand vs. expecting quality
Value df Asymptotic Significance (2-sided)
Pearson Chi-Square 360.462a 16 ,000
N of Valid Cases 1837
a. 0 cells (0.0%) have expected count less than 5. The minimum expected count is 6.83.
Source: own processing using IBM SPSS Statistics ver. 25
The condition for using the Chi-Square Test has been met (tab. 5). Our assumption was confirmed. P-value (Asymptotic Significance) is 0.000; p-value is less than the level of significance α = 0.05 (0.000 < 0.05). We reject the null hypothesis of independence and accept the alternative hypothesis, i.e., there is a dependency between the variables. It means that respondents are focusing on preferred car brand because they expect the proclaimed level of quality.

309:MMCKS
Vol. 16, No. 3, pp. 300-315, ISSN 2069–8887| Management & Marketing. Challenges for the Knowledge Society
Table 6. Symmetric Measures – Focusing on preferred car brand vs. expecting quality
Value Approximate Significance
Nominal by nominal Cramer's V .221 .000 Contingency Coefficient .405 .000
N of Valid Cases 1837
Source: own processing using IBM SPSS Statistics ver. 25
Strength of dependency has been tested through Cramer´s V and Contingency Coefficient (tab. 6). Based on the value of Contingency Coefficient (0.405), we can say that the dependence between variables is moderately strong; the value of the Approximate Significance (0.000) confirms that this dependency is statistically significant.
The purpose of testing the second hypothesis was to verify if the reason for buying a
preferred car brand is whether the preferred car brand makes them happier. H0: There is no dependency between focusing on a preferred car brand and a
feeling of happiness. H1: There is a dependency between focusing on a preferred car brand and a
feeling of happiness. A total of 1,829 respondents answered these questions. The rest of the respondents
(173) were unable to comment on the issues. Frequencies are in the following crosstable (tab. 7).
Table 7. Crosstab – Focusing on preferred car brand vs. makes me happy
Makes me happy TOTAL
1* 2 3 4 5**
Focusing on preferred car brand
1* 95 28 46 42 45 256 2 20 71 80 71 38 280
3 31 38 225 157 85 536
4 9 20 74 238 109 450
5** 10 13 23 65 196 307
TOTAL 165 170 448 573 473 1829 * Completely disagree ** Absolutely agree
Source: own processing using IBM SPSS Statistics ver. 25
The most numerous combination of responses (238) is to agree to both arguments with a force of 4 on the ranking scale. On this basis, we can assume that there will be some degree of dependence between the parameters. In this group of respondents, there are predominantly people with the following characteristics: male, primary or lower secondary education, employee, 46-55 years old.
Table 8 . Chi-Square Test – Focusing on preferred car brand vs. makes me happy
Value df Asymptotic Significance (2-sided)
310:MMCKS
Vol. 16, No. 3, pp. 300-315, ISSN 2069–8887| Management & Marketing. Challenges for the Knowledge Society
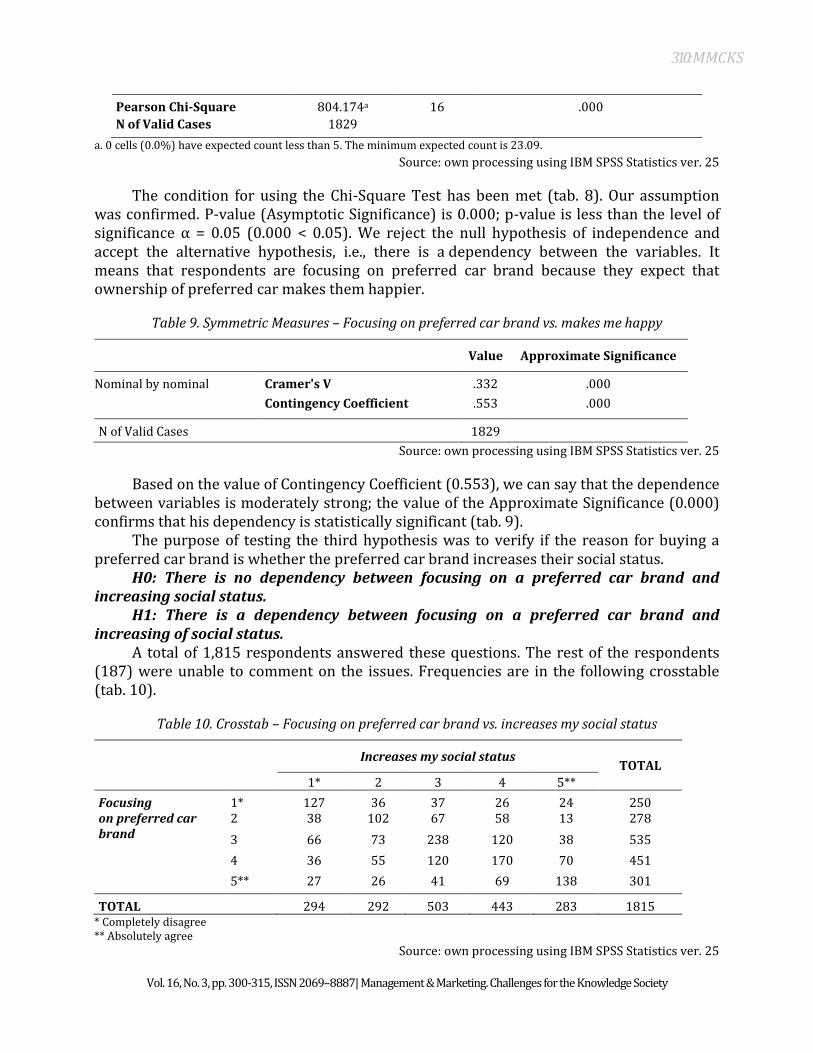
Pearson Chi-Square 804.174a 16 .000
N of Valid Cases 1829
a. 0 cells (0.0%) have expected count less than 5. The minimum expected count is 23.09.
Source: own processing using IBM SPSS Statistics ver. 25
The condition for using the Chi-Square Test has been met (tab. 8). Our assumption was confirmed. P-value (Asymptotic Significance) is 0.000; p-value is less than the level of significance α = 0.05 (0.000 < 0.05). We reject the null hypothesis of independence and accept the alternative hypothesis, i.e., there is a dependency between the variables. It means that respondents are focusing on preferred car brand because they expect that ownership of preferred car makes them happier.
Table 9. Symmetric Measures – Focusing on preferred car brand vs. makes me happy
Value Approximate Significance
Nominal by nominal Cramer's V .332 .000
Contingency Coefficient .553 .000
N of Valid Cases 1829
Source: own processing using IBM SPSS Statistics ver. 25
Based on the value of Contingency Coefficient (0.553), we can say that the dependence between variables is moderately strong; the value of the Approximate Significance (0.000) confirms that his dependency is statistically significant (tab. 9).
The purpose of testing the third hypothesis was to verify if the reason for buying a preferred car brand is whether the preferred car brand increases their social status.
H0: There is no dependency between focusing on a preferred car brand and increasing social status.
H1: There is a dependency between focusing on a preferred car brand and increasing of social status.
A total of 1,815 respondents answered these questions. The rest of the respondents (187) were unable to comment on the issues. Frequencies are in the following crosstable (tab. 10).
Table 10. Crosstab – Focusing on preferred car brand vs. increases my social status
Increases my social status TOTAL
1* 2 3 4 5**
Focusing on preferred car brand
1* 127 36 37 26 24 250 2 38 102 67 58 13 278
3 66 73 238 120 38 535
4 36 55 120 170 70 451
5** 27 26 41 69 138 301
TOTAL 294 292 503 443 283 1815 * Completely disagree ** Absolutely agree
Source: own processing using IBM SPSS Statistics ver. 25

311:MMCKS
Vol. 16, No. 3, pp. 300-315, ISSN 2069–8887| Management & Marketing. Challenges for the Knowledge Society
The most numerous combination of responses (238) is to agree to both arguments with a force of 3 on the ranking scale. On the base of this mean value of consent, we can assume that respondents could not incline to the consent or disagreement side and chose a neutral median value. In this group of respondents, there are predominantly people with the following characteristics: male, primary or lower secondary education, employee, from two age categories (34-45 years and 46-55 years).
Table 11. Chi-Square Test – Focusing on preferred car brand vs. increases my social status
Value df Asymptotic Significance (2-sided)
Pearson Chi-Square 685.860a 16 .000
N of Valid Cases 1815 a. 0 cells (0,0%) have expected count less than 5. The minimum expected count is 38.98.
Source: own processing using IBM SPSS Statistics ver. 25
The condition for using the Chi-Square Test has been met (tab. 11). P-value (Asymptotic Significance) is 0.000; p-value is less than the level of significance α = 0.05 (0.000 < 0.05). We reject the null hypothesis of independence and accept the alternative hypothesis; i.e., there is a dependency between the variables. It means that respondents are focusing on preferred car brand because they expect that ownership of preferred car increase their social status.
Table 12 . Symmetric Measures – Focusing on preferred car brand vs. increases my social status
Value Approximate Significance
Nominal by nominal Cramer's V .307 .000
Contingency Coefficient
.524 .000
N of Valid Cases 1815
Source: own processing using IBM SPSS Statistics ver. 25
Based on the value of Contingency Coefficient (0.524), we can say that the dependence between variables is moderately strong; the value of the Approximate Significance (0.000) confirms that his dependency is statistically significant (tab. 12).
Discussion Based on the results of the survey, we can say that the brands with the greatest impact on the purchasing behaviour of Slovak consumers are Skoda and Volkswagen. It is very important to mention that other brands have the opportunity to increase their impact on customers in the current process of transforming the automotive market. What brands will be preferred over the next few years depends on their ability to flexibly respond to the increasingly stringent rules aimed at reducing the negative environmental impacts of cars while respecting customers´ expectations, such as expected benefits and features of car brands.
We assumed that customers are affected by key factors motivate them to focus on the selected car brand. These factors are quality, feeling of happiness and increasing of social
312:MMCKS
Vol. 16, No. 3, pp. 300-315, ISSN 2069–8887| Management & Marketing. Challenges for the Knowledge Society
status. It was confirmed that customers, in particular, expect their quality requirements to be met. This fact confirms Azman & Gomiscek´s (2015) opinion that perceived quality of services and customer satisfaction is a concept that is increasingly important because of its impact on customer loyalty and other effects on the performance of a company. Many types of research have confirmed that quality (products, services, relationships) has a significant impact on customer satisfaction, not just in the automotive sector. For example, Gajic & Boolaky (2015) found out that the key factors were quality of the relationship, the knowledge needed to help maximize the benefits of the product, range of products and services offerings that meet customers’ needs. The interesting finding was that the customer satisfaction is most affected by the service quality. Ngo & Nguzen (2016) confirmed in their research that there is the interrelationship between service quality, customer satisfaction, and customer loyalty. Shpetim (2012) also investigated relationship among service quality, satisfaction, trust and store loyalty as important variables with significant impact on the companies´ performance. The second important factor that is the object of our interest is the happiness of the customer. We investigated if buying a car makes the customer happy. Many authors state that there is a correlation between quality and customer happiness. Research realized by Gong & Yi (2018) shows that overall service quality has a positive influence on customer satisfaction, which in turn leads to customer loyalty and customer happiness. The last important factor that is the object of our investigation is social status. Many authors dealt with this factor, but from the other point of view. We investigated if people buy the preferred brand of car because it can increase their social status. Other authors in their research investigated opposite effect, i.e., effect of customer social status on their shopping decision making, e. g. Yagil & Medler-Liray (2019).
Within the research, the identical survey will be realized in the next year. The purpose of this future study is to identify the development of preferences and attitudes of Slovak consumers towards brands.
Conclusion The automotive industry has a long history in the Slovak Republic. At present, Slovakia is regarded as a world automotive power. The most influential car brands include Skoda and Volkswagen. Especially the Skoda brand has a significant position in Slovakia, given by tradition, history and place of production of these cars. Slovaks have tended to choose Skoda brand for a long time. They still consider it a domestic brand. Usually, the purchase of cars is accompanied by long-term and consistent decision-making process, because of the fact that cars are products of long-term consumption whose price exceeds the average monthly wage in the national economy several times. The decision on buying cars is a rational purchasing decision. Rational buying behaviour is often conditioned by the brand used so far, which also explains the impact of the Skoda brand proven in the realized survey. The primary theoretical benefit of research is the finding that in the decision-making process, it is not only the tradition and functional characteristics of cars that play a significant role, but also the benefits and features of customers expect from cars that were the subject of our research. The practical contributions of research lie in obtaining information from Slovak consumers and their subsequent analysis. The assumption of a significant impact of the socio-demographic characteristics of the respondents on the expected benefits and features was not confirmed. But for some of the characteristics, at least a slight effect was shown but statistically significant. We discussed why customer is

313:MMCKS
Vol. 16, No. 3, pp. 300-315, ISSN 2069–8887| Management & Marketing. Challenges for the Knowledge Society
focusing their attention on preferred car brands. It has been confirmed that the main reason are the expected quality, the fact that the preferred brand car will make respondents happier and increase their social status. In all three cases, a moderate dependence was confirmed, which is statistically significant.
Acknowledgements
This research was financially supported by the Slovak Research and Development Agency – Grant No.APVV-15-0505: Integrated model of management support for building and managing the brand value in the specific conditions of the Slovak Republic.
References
Azman, S. & Gomiscek, B. (2015). Functional form of connections between perceived service quality, customer satisfaction and customer loyalty in the automotive servicing industry. TOTAL QUALITY MANAGEMENT & BUSINESS EXCELLENCE, 26(7), 7-8.
Cygler, J. & Sroka, W. (2017). Coopetition Disadvantages: The Case of the High Tech Companies, Inzinerine Ekonomika-Engineering Economics, 28(5), 494-504.
Fanelli, V. & Ryden, A.K. (2018). Pricing a Swing Contract in a Gas Sale Company. Economics, Management, and Financial Markets, 13(2), 40-55.
Gajic, N. & Boolaky, M. (2015). Impact of Technical Support on Customer Satisfaction: Case of Automotive Paints. SAGE OPEN, 5 (4).
Gogolova, M. & Majerova, J. (2014). Analysis of the Communication Policy of Car Brand Skoda in the Slovak Market. Proceedings form the 2nd International Conference on Management Innovation and Business Innovation, 44, 9-+.
Gong, T. & Yi, Y. (2018). The effect of service quality on customer satisfaction, loyalty, and happiness in five Asian countries. Psychology & Marketing, 35(6), 427-422.
Kanovska, L. (2018). Smart Services and Their Benefits for Manufacturers from a Global Perspective. Ekonomicko-manazerskespektrum, 12(2), 46-56.
Kasych, A. & Vochozka, M. (2017). Theoretical and methodical principles of managing enterprise sustainable development. Marketing and Management of Innovations, 2, 298-305.
Kliestikova, J., Durana, P. & Kovacova, M. (2019). Naked Consumer's Mind Under Branded Dress: Case Study of Slovak Republic. Central European Business Review, 8(1), 15-32.
Krizanova, A., Majerova, J., Kliestik, T. & Majercak, P. (2013). Theoretical Aspects of Brand Building in Seafood Industry. NAŠE MORE, 60(5-6), 105-112.
Krizanova, A. & Majerova, J. (2015). Corporate social responsibility of car brands – comparative analysis of practical application and Slovak customer´s perceptions. Proceedings ICABR 2015: X. International Conference on Applied Business Research, 552-560. Madrid, Spain.
Mala, D. & Bencikova, D. (2018). Innovations of a green product, Ekonomicko-manazerskespektrum, 12(1), 64-74.
Mills, R., Newnes, L. B. & Nassehi, A. (2016). Balancing global customer needs and profitability using a novel business model for new model programmes in the automotive industry. Proceedings of the 6th International Conference on Changeable, Agile, Reconfigurable and Virtual Production, 52, 56-61.

314:MMCKS
Vol. 16, No. 3, pp. 300-315, ISSN 2069–8887| Management & Marketing. Challenges for the Knowledge Society
Mirică (Dumitrescu), C.O. (2018). Judgments and Decision Making in Consumer Behavior: The Use of Psychophysiological Measures to Investigate Emotions and Cognitive Responses.Economics, Management, and Financial Markets, 13(4), 39–44.
Moons, I. & de Pelsmacker, P. (2015). Self-Brand Personality Differences and Attitudes towards Electric Cars. Sustainability, 7(9), 12322-12339.
Moravcikova, D., Krizanova, A., Kliestikova, A. & Rypakova, M. (2017). Green Marketing as the Source of the Competitive Advantage of the Business. Sustainability,9(12), art. no. 2218.
Moussa, S. & Touzani, M. (2008). The perceived credibility of quality labels: A scale validation with refinement. International Journal of Consumer Studies, 32(5), 526-533.
Nadanyiova, M. (2014). The Customer Satisfaction with Services Railway Company Cargo Slovakia as a Factor of Competitiveness. Transport Means - Proceedings of the International Conference, 120-124.
Nath, C. K. (2009). Customers´ expectations towards car in an unorganized environment – factoral analysis. African Journal of Business Management, 3(4), 160-167.
Ngo, V. M. & Nguyen, H. H. (2016). The relationship between service quality, customer satisfaction and customer loyalty: An investigation in Vietnamese retail banking sector, Journal of Competitiveness, 8(2), 103-116.
Sanayei, A. & Shafaei, R. (2009). Analyzing the Extent of Notice to Customer Attitude in the Organizational Structure of Vendors and Its Effect on a-Buyer´s Trust (A Case Study in Iranian Car Producers). Proceedings of the 5th International Conference on Global Security, Safety, and Sustainability, 45, 64-75
Sicoe, G. M., Belu, N., Rachieru, N. & Nicoalae, E. V. (2017). Improvement of the customer satisfaction through Quality Assurance Matrix and QC-Story methods: A case study from automotive industry. International Congress of Automotive and Transport Engineering – Mobility Engineering and Environment (CAR 2017), vol. 252, Pitesti, Romania.
Steluta, V. D., Constantin, M. A. & Catalin, P. (2014). Ploiesti Citizens´ Attitude towards Car Brands. 23rd International Business Information Management Association Conference on VISION 2020:Sustainable Growth, Economic Development, and Global Competitiveness, Valencia, Spain.
Suchanek, P. & Kralov, M. (2018). The Influence of Customers´ Personal Characteristics on their Satisfaction with the Food Industry. Journal of Competitiveness, 10(4), 151-170.
Valaskova, K., Kliestikova, J. & Krizanova, A. (2018). Consumer Perception of Private Label Products: An Empirical Research. Journal of Competitiveness, 10(3), 149-163.
Wen, N., &Lurie, N. H. (2018). The Case for Compatibility: Product Attitudes and Purchase Intentions for Upper versus Lowercase Brand Name. Journal of Retailing, 94(4), 393-407.
Yadav, O. P. & Goel, P. S. (2008). Customer satisfaction driven quality improvement target planning for product development in automotive industry. International Journal of Production Economics, 113(2), 997-1011.
Yagil, D. & Medler-Liraz, H. (2019). The effect of customer social status and dissatisfaction on service performance. Service Business, 13(1), 153-169.
315:MMCKS
Vol. 16, No. 3, pp. 300-315, ISSN 2069–8887| Management & Marketing. Challenges for the Knowledge Society
Yu, S.B., Hudders, L. & Cauberghe, V. (2018). Seeling Luxury Products Online: The Effect of a Quality Label on Risk Percpetion, Purchase Intention and Attitude toward the Brand. Journal of Electronic Commerce Research, 19, 16-35.
Zarandi, M. H. F., Turksen, I. B. & Maadani, B. (2004). Customer satisfaction assessment with fuzzy queries and ANFIS for an automotive industry. Annual meeting of the North American Fuzzy information processing society, 1 and 2, 723-728.