perception of string quartet synchronization - … · original research article published: 14...
TRANSCRIPT

ORIGINAL RESEARCH ARTICLEpublished: 14 October 2014
doi: 10.3389/fpsyg.2014.01115
Perception of string quartet synchronizationAlan M. Wing 1*, Satoshi Endo1,2 , Tim Yates 3 and Adrian Bradbury 4
1 SyMoN lab, School of Psychology, University of Birmingham, Birmingham, UK2 The Chair of Information-oriented Control, Department of Electrical Engineering and Information Technology, Technische Universität München, München,
Germany3 Health and Safety Laboratory, Buxton, UK4 Royal Academy of Music, University of London, London, UK
Edited by:
Sofia Dahl, Aalborg UniversityCopenhagen, Denmark
Reviewed by:
Peter Keller, Max Planck Institute forHuman Cognitive and Brain Sciences,GermanyTommi Himberg, Aalto University,Finland
*Correspondence:
Alan M. Wing, SyMoN lab, School ofPsychology, University ofBirmingham, Edgbaston, Birmingham,West Midlands B15 2TT, UKe-mail: [email protected]
Timing variation in small group musical performance results from intentional, expressive,and unintentional, error components in individual player timing. These timing fluctuationsproduce variability in between-player note asynchrony and require timing adjustmentsto keep the ensemble together. The size of the adjustments relative to the asynchrony(correction gain) affects the amount and nature of asynchrony variability. We presentnew listening tests to estimate thresholds for perception of between-player asynchronyvariability and to determine whether listeners use differences in the nature of the variability,as well as in its magnitude, to judge asynchrony. In two experiments, computer-simulatedensemble performances of a 48-note excerpt from Haydn Op. 74 No. 1 were generated.Between-player note asynchrony was systematically manipulated in terms of level ofwithin-player timing variability (Experiment 1) and correction gain (Experiment 2). Oneach trial, participants listened to two samples, one (“target”) with more between-playerasynchrony variability than the other (“test”), and reported which was “less together.” Inboth experiments, the test sample correction gain was fixed at the statistically optimalvalue of 0.25 and the within-player timing variability was minimal (zero except for randomvariability in the initial note). In Experiment 1 the target correction gain was fixed at 0.25 andthe timing variability was adjusted over trials by a staircase algorithm designed to convergeon the level of asynchrony variability giving 75% correct identification. In Experiment 2the timing variability in the target was set at half that in Experiment 1 and the correctiongain was varied to converge on 75% correct identification. Our results show that thebetween-player asynchrony variability giving 75% correct identification in Experiment 2 wassignificantly lower than in Experiment 1. This finding indicates that people are sensitive toboth the degree of variance and the micro-structure of the time-series of the asynchroniescaused by differences in correction gain when judging lack of togetherness in quartetperformance.
Keywords: timing, synchronization, string quartet, feedback correction, listening test
INTRODUCTIONTiming in ensemble musical performance is variable, both withinand between players. A large part of this variability is intentional,arising from scored differences in note duration or players’intentional departures from the score as part of musical inter-pretation, e.g., lengthening of notes when slowing the tempoat the end of a piece. However, some unintentional varia-tion in timing may also be expected in the duration of notes(e.g., the longer the note, the greater is likely to be the timingvariability) or as a result of tempo fluctuations. Although playersmay seek to reduce the level of unintentional variation by practice,it cannot be eliminated completely. In consequence, there will besmall asynchronies between the note onsets of the various players.These asynchronies will vary from note to note, which may affectthe listener’s perception of ensemble and this is the focus of thepresent paper.
Recordings of various ensembles have shown that between-player asynchrony variability [measured in terms of SD] in
professional ensembles playing various pieces from the repertoire[metronome indications between 40 and 130 beats per minute,(bpm)] is typically in the 10s of milliseconds range, reducingwith increasing tempo (Rasch, 1979, 1998). In a string trio(violin, viola, and cello) the average between-player asynchronySD was 49 ms (at an average 79 bpm) while the correspondingvalue for a wind ensemble (oboe, clarinet, bassoon) was 32 ms(at 88 bpm). The range was 24–73 ms. Recently Wing et al.(2014) reported figures for asynchrony SD of 24 and 28 ms(at 157 bpm) for two string quartets (first and second violin,viola, and cello). In the current study we develop a listening testto examine the perceptibility of differences in the variability ofbetween-player asynchrony in music performance. We ask: what isthe threshold for perceiving a difference between the asynchronyvariability of two otherwise identical performances of a stringquartet?
Although there is between-player asynchrony variability inquartet playing it appears to be stable over the course of a
www.frontiersin.org October 2014 | Volume 5 | Article 1115 | 1
Wing et al. Synchronization perception (v10)
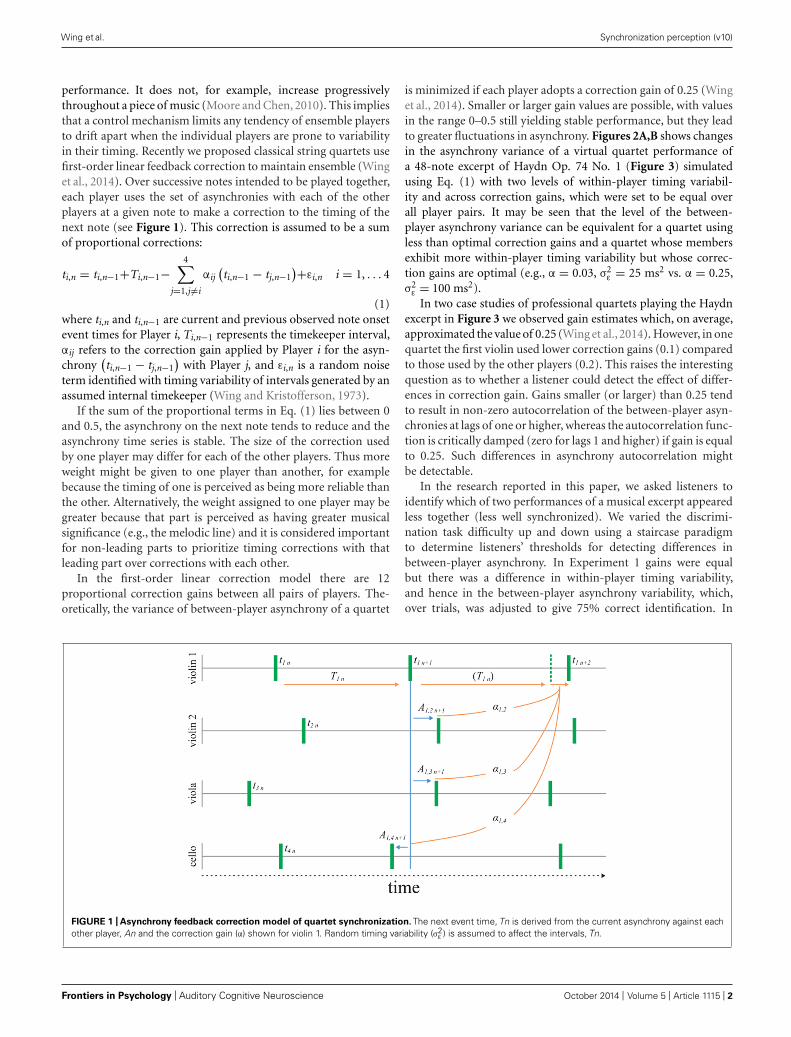
performance. It does not, for example, increase progressivelythroughout a piece of music (Moore and Chen, 2010). This impliesthat a control mechanism limits any tendency of ensemble playersto drift apart when the individual players are prone to variabilityin their timing. Recently we proposed classical string quartets usefirst-order linear feedback correction to maintain ensemble (Winget al., 2014). Over successive notes intended to be played together,each player uses the set of asynchronies with each of the otherplayers at a given note to make a correction to the timing of thenext note (see Figure 1). This correction is assumed to be a sumof proportional corrections:
ti,n = ti,n−1+Ti,n−1−4∑
j=1,j �=i
αij(ti,n−1 − tj,n−1
)+εi,n i = 1, . . . 4
(1)where ti,n and ti,n−1 are current and previous observed note onsetevent times for Player i, Ti,n−1 represents the timekeeper interval,αij refers to the correction gain applied by Player i for the asyn-chrony
(ti,n−1 − tj,n−1
)with Player j, and εi,n is a random noise
term identified with timing variability of intervals generated by anassumed internal timekeeper (Wing and Kristofferson, 1973).
If the sum of the proportional terms in Eq. (1) lies between 0and 0.5, the asynchrony on the next note tends to reduce and theasynchrony time series is stable. The size of the correction usedby one player may differ for each of the other players. Thus moreweight might be given to one player than another, for examplebecause the timing of one is perceived as being more reliable thanthe other. Alternatively, the weight assigned to one player may begreater because that part is perceived as having greater musicalsignificance (e.g., the melodic line) and it is considered importantfor non-leading parts to prioritize timing corrections with thatleading part over corrections with each other.
In the first-order linear correction model there are 12proportional correction gains between all pairs of players. The-oretically, the variance of between-player asynchrony of a quartet
is minimized if each player adopts a correction gain of 0.25 (Winget al., 2014). Smaller or larger gain values are possible, with valuesin the range 0–0.5 still yielding stable performance, but they leadto greater fluctuations in asynchrony. Figures 2A,B shows changesin the asynchrony variance of a virtual quartet performance ofa 48-note excerpt of Haydn Op. 74 No. 1 (Figure 3) simulatedusing Eq. (1) with two levels of within-player timing variabil-ity and across correction gains, which were set to be equal overall player pairs. It may be seen that the level of the between-player asynchrony variance can be equivalent for a quartet usingless than optimal correction gains and a quartet whose membersexhibit more within-player timing variability but whose correc-tion gains are optimal (e.g., α = 0.03, σ2
ε = 25 ms2 vs. α = 0.25,σ2
ε = 100 ms2).In two case studies of professional quartets playing the Haydn
excerpt in Figure 3 we observed gain estimates which, on average,approximated the value of 0.25 (Wing et al.,2014). However, in onequartet the first violin used lower correction gains (0.1) comparedto those used by the other players (0.2). This raises the interestingquestion as to whether a listener could detect the effect of differ-ences in correction gain. Gains smaller (or larger) than 0.25 tendto result in non-zero autocorrelation of the between-player asyn-chronies at lags of one or higher, whereas the autocorrelation func-tion is critically damped (zero for lags 1 and higher) if gain is equalto 0.25. Such differences in asynchrony autocorrelation mightbe detectable.
In the research reported in this paper, we asked listeners toidentify which of two performances of a musical excerpt appearedless together (less well synchronized). We varied the discrimi-nation task difficulty up and down using a staircase paradigmto determine listeners’ thresholds for detecting differences inbetween-player asynchrony. In Experiment 1 gains were equalbut there was a difference in within-player timing variability,and hence in the between-player asynchrony variability, which,over trials, was adjusted to give 75% correct identification. In
FIGURE 1 | Asynchrony feedback correction model of quartet synchronization. The next event time, Tn is derived from the current asynchrony against eachother player, An and the correction gain (α) shown for violin 1. Random timing variability (σ2
ε ) is assumed to affect the intervals, Tn.
Frontiers in Psychology | Auditory Cognitive Neuroscience October 2014 | Volume 5 | Article 1115 | 2

Wing et al. Synchronization perception (v10)
FIGURE 2 | (A) Asynchrony variance functions when the timing variabilityis set to 25 ms2 (blue) and 100 ms2 (green). The data are averages of10000 iterations. (B) single trial examples of optimal gain with higher(middle) or lower (bottom) timing variability σ2
ε and less than optimal gainwith lower timing variability (top). (C) Mean asynchrony variance (±1 SD)of the quartet across 48 notes averaged over 10000 simulations. Left: asa function of timing variability, with gain = 0.25. Right: as a function ofgain, with timing variability fixed at 100 ms2. (D) An example of two sets
of staircase functions from two separate blocks for a single participant inExperiment 2. The vertical axis shows the difference in the gain from thenon-target stimulus [α = 0.25]. On a given run of trials (green or blue)two staircases with higher (bold line, filled data points) and lower (normalline, empty data points) initial gain differences were presented inalternation on successive trials. In each staircase the gain difference wasincreased after an incorrect response and reduced after a correctresponse.
FIGURE 3 | Excerpt from Haydn Op. 74 No. 1 (fourth movement bars 12–24) used in the listening tests.
Experiment 2 the timing variability was fixed at half the thresholdlevel obtained in Experiment 1 and there was a difference in gainswhich, over trials, was adjusted to give 75% correct identification.We expected that the resulting difference in asynchrony varianceobtained in Experiment 2 would be smaller than that observed inExperiment 1, despite the same accuracy of target identification,
on the assumption that the listener is sensitive to the form, andnot just the amount, of variance in note asynchrony.
MATERIALS AND METHODSNine participants without specialized musical training(28.6 ± 13.6 years, five males, four right-handed), who provided
www.frontiersin.org October 2014 | Volume 5 | Article 1115 | 3

Wing et al. Synchronization perception (v10)
informed consent according to ethics approved by Universityof Birmingham ethics committee, took part in the study. Intwo experiments (Experiments 1, 2), on each trial the partic-ipants listened to two samples of a virtual quartet performingthe 48 note excerpt shown in Figure 3 and then reported whichsample (the “test” or the “target”) sounded less together (less wellsynchronized).
We used the first-order linear correction model (Eq. 1) to gen-erate the event times of the virtual quartet at a rate of 162 bpmwhile the variance of the asynchronies between the players wasadjusted by changes in the within-player timing variability (σ2
ε )in Experiment 1 or the correction gain (α) in Experiment 2. Ineach experiment, the (non-target) test stimulus had zero timingvariability (σ2
ε = 0), and a correction gain of 0.25 set equal acrossall players. For the test stimulus the only random timing errorwas in the first note – the resulting error in between-player asyn-chrony was rapidly compensated over subsequent notes as in Eq.(1). First note onset time was normally distributed with a varianceof 25 ms2 for all instruments. The target stimulus had non-zeroasynchrony variance. This was adjusted on successive trials by anadaptive staircase algorithm using accelerated stochastic approxi-mation (Kesten, 1958) to adjust step size and converge on the levelof timing variability (Experiment 1) or gain (Experiment 2) thatgave 75% correct target identification (Figure 2D). Feedback wasgiven at the end of each trial as to whether the target stimulus hadbeen correctly identified.
Due to the random nature of the stimulus generation process,asynchrony variance can vary between stimuli generated usingidentical within-player timing variability (Experiment 1) or gain(Experiment 2) as illustrated in Figure 2C. To ensure that thebetween-player asynchrony variance of the stochastically gener-ated stimulus was close to the theoretical value for the timingvariability or gain value specified by the staircase, 10000 sets oftime-series were generated for each set of simulation parame-ters before the experiment, and the mean asynchrony variancewas determined at each level. The required simulation parameters
for given asynchrony variances were then calculated using linearinterpolation between the simulated mean asynchrony variances.If the resulting generated stimulus asynchrony variance (calculatedper note, and averaged over all 48 notes) was outside a toleranceregion of the theoretical variance plus or minus 10−7 s2, thennew stimuli were generated until one resulted with asynchronyvariance within the tolerance region. In Experiment 1 the asyn-chrony variance threshold at which the listener correctly identifiedthe target on 75% of trials corresponding to [σ2
ε = ThCENTRAL,α = 0.25] was measured by fitting the logistic function to the psy-chometric data consisting of binned fractional correct responses(Figure 4). In Experiment 2, the timing variability was fixed athalf the level, i.e., [σ2
ε = ThCENTRAL/2] corresponding to thethreshold determined in Experiment 1, and the gain was con-trolled by the staircase algorithm to converge on 75% correct targetidentification.
The simulated time series data were combined with note pitchand duration information to create a midi file using the MidiToolbox in MATLAB (Eerola and Toiviainen, 2004). Velocity wasset at 80 and there was no variation in loudness across notes orbetween instruments. The duration of the eighth notes was 50 msand staccato was expressed by halving the note duration. Thegenerated stimuli were presented using a standard media player(winamp/windows media player) through a pair of headphones(Audio Technica, ATH-M30/ Sennheiser) at a comfortable vol-ume in a quiet room. Participants performed 80 trials divided intotwo blocks per experiment and, altogether, the experiment tookapproximately 80 min to complete.
RESULTSThe average tempo for the stimuli generated in Experiments 1and 2 was 162.0 ± 3.3 bpm. For each participant, responseswere divided into 10 bins by staircase levels, and the meanfraction of correct response was calculated per bin. The pro-portion of correct responses was then fitted with a logisticfunction and the 75% correct response level was determined as
FIGURE 4 | Binned proportion of correct responses as a function of (left) the timing variability (Experiment 1) and (right) gain difference in non-target
and target quartets (Experiment 2) calculated for a single participant.
Frontiers in Psychology | Auditory Cognitive Neuroscience October 2014 | Volume 5 | Article 1115 | 4

Wing et al. Synchronization perception (v10)
Table 1 |Threshold expressed in terms of variance of asynchrony
(ms2).
Participant Experiment 1 Experiment 2
1 62.3 17.0
2 193.6 48.4
3 66.9 11.5
4 82.9 21.1
5 32.3 8.9
6 32.8 8.9
7 34.9 12.9
8 42.8 8.9
9 29.9 26.3
Mean 64.3 (52.0) 18.2 (12.8)
the detection threshold of between-player asynchrony variance(see Figure 4; Table 1). In Experiment 1, the mean asyn-chrony variance of the target sample at threshold was 64.3 ms2
(SD = 52.0 ms2). The threshold was reduced to an average of18.2 ms2 (SD = 12.8 ms2) when the time series of the asyn-chronies between pairs of players were altered by the introductionof the varied correction gains in Experiment 2. A paired-samplet-test (after taking natural logarithms to normalize the distribu-tions) confirmed that the threshold in Experiment 2 was lowerthan the threshold in Experiment 1, t(8) = 7.978, p < 0.0005.The log detection threshold of the asynchrony variance foreach participant in Experiment 1 was not reliably correlated(r = 0.08, p = 0.823) with the sensitivity to the gain differ-ence as defined by the threshold reduction rate in Experiment2 [1-var(Experiment 2)/var(Experiment 1)].
Experiment 2 differed from Experiment 1 in that the correctiongain was varied, which, in turn, affected the nature of variationin the asynchronies between players as revealed by the lag oneautocorrelation. The largest of the lag one autocorrelations forthe six pairs of between-player asynchronies was selected on eachtrial. The autocorrelation was reliably larger in Experiment 2 (0.84,SD = 0.05) than Experiment 1 (0.39, SD = 0.024 ), [t(8) = –20.848,p < 0.0005].
DISCUSSIONIn a typical small group ensemble, the different instrumentsexhibit small variations in timing and this results in variableaysnchrony between the note onsets of the various player pairs.Rasch (1979, 1998) documented SDs of between-player asyn-chrony in a string and a woodwind trio in the range 24–73 mswhile Wing et al. (2014) reported values within this range in twostring quartets. Such variability in between-player asynchrony isa challenge for the maintenance of ensemble and it was pro-posed that string quartets accordingly employ first-order linearcorrection of asynchrony between all pairs of players (Wing et al.,2014). In this quartet timing model, a correction value or gainof 0.25 is optimal in the sense of minimizing the variability ofasynchrony. However, gains can range over 0–0.5 and still produce
stable performance such that a synchronization error between twoplayers is quickly reduced over the next few notes. If the gainlies between 0 and 0.25, the asynchrony correction is overdamped(the reducing error has the same sign over successive notes) and ifbetween 0.25 and 0.5, the correction is underdamped (the reduc-ing error alternates in sign). When the gain is 0.25 the correctionis critically damped in that it is fully eliminated on the nextnote. The question this poses is whether differences in correctiongain are discriminable to the listener through the patternof asynchrony errors?
In this paper we present a method for determining the thresholdat which listeners can discriminate between two virtual quartets,simulated using the first-order linear correction model. Using thismethod, Experiment 1 reveals that when the correction gains areoptimal, the average threshold for discriminating between twomusical excerpts differing only in between-player asynchrony vari-ability is appreciably less (by a factor of 5 in terms of SD) than thepublished estimates of ensemble asynchrony variability referredto above. This suggests that listeners would be able to distin-guish between typical quartets on the basis of differences in theirasynchrony variability. Moreover, in Experiment 2, when the twomusical excerpts differed in correction gain, they were discrimi-nated at a point where the difference in asynchrony variability wasat a level well below (by a factor of 2 in terms of SD) the thresholdestimated in Experiment 1. This suggests that listeners are sensi-tive to the form of correction, probably because of the structurepresent in the variability of the asynchronies. For example, con-sider when the gain approaches zero, when discrimination againstoptimal gain becomes more reliable. The asynchronies exhibit per-sistent positive or negative departures from average (reliably largerlag one autocorrelation in Experiment 2 compared to Experiment1), producing between player shifts in phase, and this may havebeen the cue used by participants.
In Experiment 2 we examined correction gains in the range0 to 0.25. Gains in this range produce damped convergence onzero asynchrony error. It would be interesting to know whethercorrection gains between 0.25 and 0.5, which result in alternationin the sign of the asynchrony as it reduces to zero with successivenotes, would be more noticeable and lead to better discrimina-tion of the target stimulus. It might be supposed that correctiongains set by the individual player are subject to error. If devia-tions from the optimal value of 0.25 are less perceptible for thelistener than when gains are greater than 0.25, players might adoptthe strategy of setting their target gain less than 0.25. However,there are other possible reasons for setting the gain less than 0.25.For example, if there is appreciable variability in neuromuscularperformance delays, the optimal value decreases with increasingmotor variability (Burge et al., 2008).
Our method of obtaining discriminability estimates involveda very low level of variability (with optimal correction gain) inthe test stimulus. This might be considered unrealistic for musi-cal contexts where the discrimination task would typically involveidentifying the more variable of two quartets, where both haveappreciable asynchrony variability. The ability to discriminate tar-get from test is likely to decline with increase in baseline variabilityby analogy with the increase in threshold for duration discrim-ination with duration (Getty, 1975). In future research it will
www.frontiersin.org October 2014 | Volume 5 | Article 1115 | 5

Wing et al. Synchronization perception (v10)
be interesting to examine a musically more realistic situation inwhich the baseline variability of the test stimulus correspondsto the variability of a professional quartet and to determine thejust noticeable difference with increased variability in the targetquartet. Further methodological adjustments for greater musicalrealism could involve the addition of timing complexities such asrhythm, non-homophony (which would require a beat- or pulse-based rather than note-based unit of analysis) and variation indynamics. If the additional stimulus dimensions are uncorrelatedwith asynchrony variability, judgments about asynchrony variancemight become harder due to attention demands, parelleling, forinstance, the effects of judging intensity on concurrent judgmentsof duration (Casini and Macar, 1997).
In summary we have presented new listening tests for theability to discriminate variability of note onset asynchrony instring quartet performance. The results of the first experimentshow that people discriminate differences in asynchrony variabilitythat are appreciably less than the variability typical of profes-sional quartets. The second experiment shows that discriminationis further improved if the performances differ in the correc-tion gain employed to counteract timing variability and maintainensemble.
ACKNOWLEDGMENTThis research was supported by funding to Alan M. Wing fromEPSRC grant no EP/I031030/1 and FP7 ICT grant no 287888,www.coglaboration.eu.
REFERENCESCasini, L., and Macar, F. (1997). Effects of attention manipulation on judgments of
duration and of intensity in the visual modality. Mem. Cogn. 22, 673–686. doi:10.3758/BF03211325
Eerola, T., and Toiviainen, P. (2004). MIDI Toolbox: MATLAB Tools for MusicResearch. University of Jyväskylä: Kopijyvä, Jyväskylä. Available at: http://www.jyu.fi/hum/laitokset/musiikki/en/research/coe/materials/miditoolbox/
Getty, D. J. (1975). Discrimination of short temporal intervals: a comparison of twomodels. Percept. Psychophys. 18, 1–8. doi: 10.3758/BF03199358
Kesten, H. (1958). Accelerated stochastic approximation. Ann. Math. Stat. 29, 41–59.doi: 10.1214/aoms/1177706705
Moore, G., and Chen, J. (2010). Timings and interactions of skilled musicians. Biol.Cybern. 103, 401–414. doi: 10.1007/s00422-010-0407-5
Rasch, R. A. (1979). Synchronization in performed ensemble music. Acta Acust.United Acust. 43, 121–131.
Rasch, R. A. (1998). “Timing and synchronisation in ensemble performance,” inGenerative Processes in Music, ed. J. A. Sloboda (Oxford: Oxford University Press),70–90.
Wing, A. M., Endo, S., Bradbury, A., and Vorberg, D. (2014). Optimal feedbackcorrection in string quartet synchronisation. J. R. Soc. Interface 11:20131125. doi:10.1098/rsif.2013.1125
Wing, A. M., and Kristofferson, A. (1973). Response delays and the timing of discretemotor responses. Percept. Psychophys. 14, 5–12. doi: 10.3758/BF03198607
Conflict of Interest Statement: The authors declare that the research was conductedin the absence of any commercial or financial relationships that could be construedas a potential conflict of interest.
Received: 31 May 2014; accepted: 15 September 2014; published online: 14 October2014.Citation: Wing AM, Endo S, Yates T and Bradbury A (2014) Perception of stringquartet synchronization. Front. Psychol. 5:1115. doi: 10.3389/fpsyg.2014.01115This article was submitted to Auditory Cognitive Neuroscience, a section of the Frontiersin Psychology.Copyright © 2014 Wing, Endo, Yates and Bradbury. This is an open-access arti-cle distributed under the terms of the Creative Commons Attribution License(CC BY). The use, distribution or reproduction in other forums is permitted,provided the original author(s) or licensor are credited and that the original pub-lication in this journal is cited, in accordance with accepted academic practice. Nouse, distribution or reproduction is permitted which does not comply with theseterms.
Frontiers in Psychology | Auditory Cognitive Neuroscience October 2014 | Volume 5 | Article 1115 | 6