perceptual learning of simple stimuli modifies stimulus ... · pdf fileperceptual learning of...
TRANSCRIPT

Perceptual Learning of Simple Stimuli Modifies StimulusRepresentations in Posterior Inferior Temporal Cortex
Hamed Zivari Adab1, Ivo D. Popivanov1, Wim Vanduffel1,2,3,and Rufin Vogels1
Abstract
■ Practicing simple visual detection and discrimination tasksimproves performance, a signature of adult brain plasticity.The neural mechanisms that underlie these changes in perfor-mance are still unclear. Previously, we reported that practicein discriminating the orientation of noisy gratings (coarseorientation discrimination) increased the ability of singleneurons in the early visual area V4 to discriminate the trainedstimuli. Here, we ask whether practice in this task also changesthe stimulus tuning properties of later visual cortical areas,despite the use of simple grating stimuli. To identify candidateareas, we used fMRI to map activations to noisy gratings intrained rhesus monkeys, revealing a region in the posteriorinferior temporal (PIT) cortex. Subsequent single unit record-ings in PIT showed that the degree of orientation selectivity
was similar to that of area V4 and that the PIT neurons discrim-inated the trained orientations better than the untrained orien-tations. Unlike in previous single unit studies of perceptuallearning in early visual cortex, more PIT neurons preferredtrained compared with untrained orientations. The effects oftraining on the responses to the grating stimuli were alsopresent when the animals were performing a difficult orthogo-nal task in which the grating stimuli were task-irrelevant, sug-gesting that the training effect does not need attention to beexpressed. The PIT neurons could support orientation dis-crimination at low signal-to-noise levels. These findings sug-gest that extensive practice in discriminating simple gratingstimuli not only affects early visual cortex but also changesthe stimulus tuning of a late visual cortical area. ■
INTRODUCTION
Practice in sensory detection and discrimination tasksimproves task performance (Gibson, 1963). Althoughsuch perceptual learning effects in the visual system havebeen studied extensively at the behavioral level (Aberg &Herzog, 2012; Sagi, 2011; Fine & Jacobs, 2002), the under-lying neural mechanisms are still unclear. Initial studiesshowed changes in the tuning of macaque V1 and V4neurons after extensive training in a fine orientation dis-crimination task (Raiguel, Vogels, Mysore, & Orban, 2006;Yang & Maunsell, 2004; Schoups, Vogels, Qian, & Orban,2001) with smaller and less consistent effects across stud-ies in V1 (Ghose, Yang, & Maunsell, 2002; Schoups et al.,2001). However, studies in dorsal stream areas, middletemporal and medial superior temporal, showed no per-ceptual learning effects on neural tuning or responsestrength during direction (Law & Gold, 2008), heading(Gu et al., 2011), or depth discrimination tasks (Uka, Sasaki,& Kumano, 2012). In these areas, the correlation betweenbehavioral choices and neural responses increased duringearly task learning for depth discrimination (Uka et al.,2012) and during direction discrimination learning (Law &
Gold, 2008), which may suggest that the learning to dis-criminate involves a reweighting of the stable visual corticalsignals that are used to form the perceptual decision (Law& Gold, 2009). This idea is supported by evidence ofperceptual learning-induced changes in decision-relatedresponses of lateral intraparietal neurons to the choicetargets in the motion direction task (Law & Gold, 2008).
We recently reported that the response properties ofmacaque area V4 changes during the course of practicinga coarse orientation discrimination task (Adab & Vogels,2011). In that task, the animals discriminated two gratingsthat differed by 90°. Task difficulty was manipulated byadding noise to the grating, that is, by lowering the signal-to-noise ratio (SNR). Behavioral performance at low SNRsincreased during the course of training, which was accom-panied by an improvement of V4 neurons to discriminatethe gratings. However, V4 is only a single area amongmanyvisual areas that might show perceptual learning-relatedchanges in the representation of the simple discriminandain this task. Indeed, areas downstream from V4 may showother or more pronounced changes in their stimulus rep-resentations by virtue of the connections between V4 andsuch areas or by inherent plasticity of these later areas.These potential changes in the tuning properties of latervisual areas can contribute to changes in the performanceduring perceptual learning and thus should be taken into
1KU Leuven, 2MGH Martinos Centre, Charlestown, MA, 3HarvardMedical School
© 2014 Massachusetts Institute of Technology Journal of Cognitive Neuroscience 26:10, pp. 2187–2200doi:10.1162/jocn_a_00641
account in models of perceptual learning. Thus, here weasked whether and how the representations of the trainednoisy grating stimuli in late visual cortical areas werechanged by perceptual learning. To answer this question,we first identified candidate areas that responded to lowSNR stimuli with monkey fMRI. The fMRI data yielded aposterior inferior temporal (PIT) cortical region that wasactivated by the low SNR gratings in the trained mon-keys. We subsequently recorded the responses of singleneurons to trained and untrained orientations in thisfMRI defined PIT region, assessing whether their re-sponse properties were affected by practicing orientationdiscrimination.
METHODS
Subjects
The two rhesus monkeys (Macaca mulatta, both male)of our V4 learning study (Adab & Vogels, 2011) served assubjects. After that study, the animals continued to prac-tice the coarse orientation discrimination task at a fixedstimulus location of 3° eccentricity (lower visual field,225° polar angle). In addition, they received training inthe color discrimination task. Before the fMRI mappingstudy, both animals were trained to fixate for long dura-tions in a mock fMRI setup. During the fixation training,the monkeys were exposed to natural images that differedfrom those used in the fMRI mapping. Animal care andexperimental procedures were approved by the ethicalcommittee of the KU Leuven Medical School.
Noisy Grating Stimuli
The gamma-corrected grating stimuli and display werethe same as in the V4 study (Adab & Vogels, 2011). Circularpatches (2° diameter) containing a 100% Michelson con-trast sinusoidal grating (2 cycles/degree) were spatiallymasked by noise and then superimposed on a noise back-ground that filled the display. The SNR was manipulatedby random replacement of the grating pixels by noise.The noise of the background and stimuli patches wasrefreshed on every trial in the single unit recording tasks.0% SNR patches were detectable at stimulus onset, whichaimed to reduce spatial uncertainty. The noise of boththe stimulus and the background was generated from thesame sinusoidal luminance distribution. The trained orien-tations were 22.5° and 112.5° in monkey M and 67.5° and157.5° in monkey P.
fMRI Methods, Design, and Data Analysis
Methods
Functional scans were obtained while the monkeys werefixating a small red target (0.14° wide). During scanning,the monkeys sat in a sphinx position with their headsfixed in an MR-compatible chair at a distance of approxi-
mately 57 cm from a screen. The gamma-corrected stim-uli were projected onto the screen. Eye position wascontinuously monitored (120 Hz; Iscan, Burlington, MA)during scanning. The monkey received a juice reward formaintaining fixation within a square window of 2° × 2°.Before scanning, the contrast agent monocrystalline
iron oxide nanoparticle (MION; Feraheme, AMAG Pharma-ceuticals, Inc., Lexington, MA, 8–11 mg/kg) was injectedintravenously. The monkeys were scanned on a 3TSiemens Trio scanner following standard procedures(Vanduffel et al., 2001). fMRIs were acquired with acustom-made eight-channel coil (Ekstrom, Roelfsema,Arsenault, Bonmassar, & Vanduffel, 2008) and a gradient-echo single-shot EPI sequence (repetition time = 2 sec,echo time = 17 msec, flip angle = 75°, 80 × 80 matrix,40 slices, no gap, 1.25 mm isotropic voxel size). Slices wereoriented transversally covering the whole brain. High-resolution anatomical MRIs were acquired under ketamine/xylazine anesthesia, using a single radial transmit–receivesurface coil and a MPRAGE sequence (repetition time =2200 msec, echo time = 4.05 msec, flip angle = 13°, 320 ×260 matrix, 208 slices, 0.4 mm isotropic voxel size).
Event-related Design
The stimuli were 20% SNR gratings of different orien-tations (22.5°, 67.5°, 112.5°, and 157.5°) and random dottexture patterns (randomly positioned dots with sizesvarying between 0.06° and 0.43°). The data obtained withthe random dot pattern are not relevant for the presentanalysis and will not be described here. A novel noisygrating was used for each presentation. The stimuli weresuperimposed on a noisy background and presented atthe trained or untrained location (3° eccentricity in the leftor right lower visual quadrant, respectively) for 300 msecwith a variable ISI of 3500 msec (range = 3000–4000 msec)on average. The background noise was varied across runs.The stimuli defined six conditions: trained orientationsat the trained and untrained locations, untrained orien-tations at trained and untrained locations, and the tex-ture at the trained and untrained locations. In additionto these six conditions, there was a “fixation” conditionconsisting of the noise background with the same dura-tion as the stimulus presentations. Each run started withthe presentation of the background for 10 sec, followedby 99 events (including the “fixation” condition null event;each event lasting 300 msec) and ended with another14 sec of only the background. The duration of a run was400 sec. The fixation target was presented continuouslythroughout the whole run. The seven conditions werepresented in a pseudorandom order with the constraintthat a particular condition had to be preceded equallyoften by each condition within a given run ( Jastorff,Kourtzi, & Giese, 2009). Forty-nine (7 × 7) events wererequired to completely counterbalance the sequence.We included 99 events in each run, ensuring completecounterbalancing for events except the first one of a run.
2188 Journal of Cognitive Neuroscience Volume 26, Number 10

This first event for a given run was selected from eachcondition with equal probability.
Data Analysis
The procedure for processing the data has been de-scribed in detail elsewhere (Popivanov, Jastorff, Vanduffel,& Vogels, 2012). The only exception is that our functionaldata were smoothed using a 1.5-mm full-width half-heightGaussian kernel. Data analysis was performed with SPM5(Wellcome Department of Cognitive Neurology, UK). Allruns in which the monkey was fixating at least 94% ofthe time were combined in a fixed effects model for eachmonkey separately in native space. The results wereanalyzed with a general linear model with five regressors(texture pattern, trained and untrained orientations com-bined at the trained and untrained locations and the“fixation” condition) plus six additional head-motionregressors per run. Each of these five conditions wasmodeled by convolving a Gamma function (delta = 0,tau = 8, and exponent = 0.3), modeling the MIONhemodynamic response function, at the onset of thecondition. We then computed general linear model con-trasts between the grating presentations at trained anduntrained locations and the “fixation” condition. Addi-tional analyses with regressors for each of the seven con-ditions (separating trained and untrained orientations)were also conducted.
Single Unit Recordings: Tasks
Passive Fixation Task
Eight oriented gratings (0°, 22.5°, 45°, 67.5°, 90°, 112.5°,135°, and 157.5°) with 80% SNR were presented inter-leaved during passive fixation (fixation point size: 0.27°)at either trained (for recordings in the trained hemi-sphere) or untrained locations (for recordings in theuntrained hemisphere). Each stimulus was shown for250 msec, preceded and followed by a fixation periodof 500 and 100 msec, respectively. Completed trials wererewarded by a drop of juice. The display was filled duringthe whole course of a trial with the background noise,which was refreshed on each trial. The mean number ofpresentations was 19 per orientation. Fixation windowsize was 1.5° × 1.5° for all tasks.
Color Discrimination Task (Figure 1B)
A colored spot of 1° diameter was presented in the upperipsilateral visual field at 10.3° eccentricity together with anoisy grating at the contralateral trained (for recordingsin the trained hemisphere) or untrained (for recordingsin the untrained hemisphere) locations. The grating andthe colored spot were presented for 250 msec followinga fixation period of 500 msec. After their presentation,
the monkey had to continue fixating for another 200 msec.This fixation period was followed by the presentation oftwo target points, and the animals indicated the color ofthe spot by saccading toward the corresponding target.Correct responses were rewarded by a drop of juice. Thedisplay was filled with the background noise during thewhole course of a trial. The color difference was titratedfor each monkey. The SNR (10–40%) and orientation(two orthogonal trained and two orthogonal untrainedorientations that differed by 45° from the trained) ofthe grating were independent of the target color. Thenoise of the gratings and background were refreshedon each trial. The mean number of presentations was18 per orientation and SNR.
Coarse Orientation Discrimination Task (Figure 1A)
This task is identical to that described elsewhere (Adab &Vogels, 2011). Either one of two trained oriented gratingswhich could have different SNR levels (0–40%) was pre-sented for 250msec on top of the noise background follow-ing a fixation period of 500 msec. After another 200 msec,the animals had to indicate the orientation by a saccadiceye movement to one of the two presented target points.Correct responses were rewarded with a drop of juice.Orientations and SNRs were presented in random order.The noise of the gratings and the background were re-freshed on each trial. The phase of the gratings was ran-domized across trials.
Receptive Field Mapping
Receptive fields were quantitatively mapped in a subsetof the neurons in the trained and untrained hemisphere.Temporally modulated checkerboards (9.5 Hz; stimulussize = 3° × 3°; checker size = 1.5°) were presented for107 msec in a random order at a 7 × 7 locations (spacing =3°) of an invisible grid centered on the fixation point dur-ing fixation. The receptive fields of the neurons in therecorded part of PIT showed on average the strongestactivity in the contralateral lower visual field quadrantwith a peak at or close to the trained (neurons fromtrained hemisphere) or untrained locations (neuronsfrom untrained hemisphere). The latter position bias isnot surprising because we searched for responsive neuronswith stimuli at the trained or untrained location.
Single Unit Recording Methods and Data Analysis
Standard electrophysiological recording techniques wereemployed. Action potentials were recorded with epoxy-coated tungsten electrodes. Subjectsʼ eye movementswere monitored using infrared eye tracking (500 Hz; Eye-Link, Ontario, Canada). Single units were discriminatedon-line with a threshold and time window discriminator
Adab et al. 2189

and timings of well-isolated single units were savedtogether with behavioral events for later offline analysis.MR (MPRAGE; resolution = 600 μm3) images of the brainwith markers of recording grid positions were acquiredbefore and in between recording sessions for verificationof the recordings sites. These anatomical images werecoregistered with the fMRI t score images. In the “trainedhemisphere” of monkey M, we recorded at nine adjoin-ing guide tube positions (spacing = 1 mm) but 87/123 re-sponsive neurons were from three neighboring guide tubepositions (1 mm apart; about 7 mm anterior with respectto the auditory meatus). In the “untrained” hemisphere ofmonkey M, recordings were from four neighboring guidetube positions, with 41/66 neurons from one guide tube
position. In the “trained” hemisphere of monkey P, record-ings were from three neighboring guide tube positionswith 45/55 neurons from a single guide tube position(6 mm anterior). In order not to bias the data, we pooledall responsive neurons from different recording positions.Responsive neurons were searched during passive fixationwith eight oriented gratings.Only unaborted trials were analyzed. For all tasks except
the receptive field mapping, spikes were counted withintwo windows: −250:0 for baseline and 50:300 for grossresponse, 0 being stimulus onset. The area under thereceiver operating characteristic curve (AUROC), Fanofactor, and choice probability (CP) were computed usinggross responses. Other analyses were performed on net
Figure 1. Discrimination tasks.(A) Coarse orientationdiscrimination task. Afteran initial fixation period of500 msec, a grating maskedby noise was presented for250 msec. The grating waspresented in the lower leftvisual field at 3° eccentricityon a noise background. Thegratings could have one oftwo orthogonal trainedorientations. After gratingpresentation, the monkeyswere required to continuefixating for another 200 msecafter which two red targetsappeared. The monkeys thenindicated the orientation bymaking a saccadic eyemovement to one of thetwo targets (illustratedby blue arrow). A correctsaccade was followed by asmall liquid reward. (B)Color discrimination task.The stimulus sequence wasthe same as in (A), exceptthat a small colored spot(1° diameter) was presented,simultaneously with thegrating, at 10.3° eccentricityin the upper ipsilateral visualfield. This spot was presentedin one of two slightlydifferent colors. The animalhad to ignore the gratingand indicate which colorwas presented by means ofa saccade (illustrated byblue arrow) to one of twosubsequently shown targets.In both figure panels, thered box around the gratingwas not shown during theexperiment but is presentedhere for illustration purposesonly. The SNR of the illustratedgratings is 40%.
2190 Journal of Cognitive Neuroscience Volume 26, Number 10
response (gross-baseline). To compute the AUROC and CPin the discrimination tasks, the “best” and “worst”orientations of the orientation pair were determined foreach neuron by the mean net response at 40% SNR.For the passive fixation task, the “best” and “worst”orientation for the trained stimulus pair was definedusing the net responses to each of the orientations.The same was true for the untrained stimulus pair, whichconsisted of orientations that differed by 45° from thetrained orientations. These orientations, which differedbetween the animals, were chosen as the untrainedorientation pair because doing so the untrained andtrained stimulus pairs were counterbalanced across ani-mals. Thus, response differences between these pairscould be related to training instead of physical orientationdifferences. AUROCs were computed using an identicalprocedure for trained and untrained orientation pairs.The Fano factor is the trial-to-trial variance divided bythe response averaged across those same trials. Theorientation selectivity of each neuron was quantified bythe Selectivity Index (SI):
SI ¼ffiffiffiffiffiffiffiffiffiffiffiffiffiffiffiffiffiffiffiffiffiffiffiffiffiffiffiffiffiffiffiffiffiffiffiffiffiffiffiffiffiffiffiffiffiffiffiffiffiffiffiffiffiffiffiffiffiffiffiffiffiffiffiffiffiffiffiffiffiffiffiffiffiffiffiffiffiffiffiffiffiffiffiffiffiffiffiffiffiffiPn
i¼1 Ri � sinð2OiÞ� �2 þ Pn
i¼1 Ri � cosð2OiÞ� �2q
Pni¼1 Ri
with Ri and Oi being the mean net response andorientation for stimulus i (n = 8), respectively. If Ri ofa neuron was negative, the absolute minimum mean netresponse across the eight orientations was added to theresponses to compute SI. We verified all effects shownfor the SI using another metric of orientation selectivity:(net response for the orientation eliciting the largestnet response − net response for orientation eliciting thesmallest response) / (net response for the orientationeliciting the largest net response).The preferred orientation is the orientation, out of
the eight tested in the passive fixation task, with thegreatest net response. The population orientation tuningcurves were computed by defining the preferred orien-tation of each neuron using the odd or the even trials,and then the tuning curve was computed for the otherhalf of the trials. This procedure, in which (i) the pre-ferred orientation and (ii) the responses to the stimulusorientations used to compute the tuning curves arebased on independent trials, avoids an overestimationof the peak of the tuning curve. The tuning curves wereaveraged across neurons, after alignment of the indi-vidual tuning curves with respect to the preferred orien-tation. Following Adab and Vogels (2011), CPs werecomputed by z scoring the responses for each SNR<40% with at least one correct and one incorrect choicefor each orientation. The grand CP (Britten, Newsome,Shadlen, Celebrini, & Movshon, 1996) is the AUROC forthe distributions of the z scores, pooled across SNRsand orientations, and sorted according to the animalʼschoice.
RESULTS
We trained two monkeys extensively in a coarse orien-tation discrimination task (Figure 1A) at low SNRs (Adab& Vogels, 2011). Using fMRI, we first localized regionsthat were activated by gratings of 20% SNR. Guided bythe fMRI data, we then recorded single unit activity inan inferior temporal (IT) area, PIT, which was activatedby these stimuli.
fMRI Mapping of Areas Activated by Low SNRGratings after Training
With an event-related fMRI design, we sequentially pre-sented four differently oriented gratings (22.5°–157.5°,randomly shown in steps of 45°) of 20% SNR at thetrained location and at an untrained location having thesame 3° eccentricity. Spatial frequency (2 cycle/degree)and size (2°) were identical to the stimuli used in thetraining phase of the monkeys.
For monkey P, we analyzed 25 runs (700 stimulus pre-sentations per condition) in which the monkey was fix-ating for at least 94% within a fixation window of 2° ×2°, whereas 65 runs (1820 presentations/condition)passed this fixation criterion in monkey M. To map poten-tial regions that demonstrate perceptual learning-relatedchanges, we took a conservative approach by contrast-ing the responses to the low signal 20% SNR gratingswith the noise background. We took this approach be-cause learning-related changes in the tuning of singleneurons may not show up in fMRI activations that arebased on the contrast of trained versus untrained orien-tations and thus can be missed. In fact, contrasting thetrained and untrained orientations produced no significantactivations (at p < .05; family-wise error [FWE] corrected)in this study.
Contrasting the fMRI response to the noisy gratings(pooled across the four orientations) with the responseto the noise background resulted in four activated regions( p < .05 in at least one hemisphere; FWE corrected; t >4.9): V2/V3, V4, a region in the PIT cortex and in pFC (area46v). The presence of the V4 recording chamber on thetrained hemisphere prevented close positioning of thephased-array receive coil over the trained hemisphere.Thus, activation levels between hemispheres could notbe directly compared.
The PIT activation was significant in each of the fourhemispheres, either at the FWE-corrected (2/4 hemi-spheres) or at uncorrected level ( p< .001; “trained” hemi-sphere monkeyM and “untrained” hemisphere monkey P).The location of this activation was consistent in bothanimals, being close to the anterior part of posteriormiddle temporal sulcus (PMTS; Figure 2), extendingsomewhat more dorsally toward the ventral bank of theSTS in monkey M.
The fMRI activation to the high noise grating stimuliin this PIT region in both trained animals guided the
Adab et al. 2191

subsequent electrophysiological recordings. We addressedtwo major questions: (1) to what degree do single neuronsin this region show orientation selective responses togratings and (2) are the response properties of theseneurons affected by the coarse orientation discriminationlearning?
SingleUnitResponses in the fMRI-definedPITRegion:Orientation Selectivity
We made vertical microelectrode penetrations from thelower bank of the STS to the PMTS, covering the PITregion that was defined by the fMRI activation to the20% SNR gratings irrespective of their orientation. Wesearched for responsive neurons while the animals wereperforming a passive fixation task in which gratings ofeight different orientations (0°–157.5°, step = 22.5°) withhigh SNR (80%) were presented on top of the noisebackground at the trained location. Responsive cells wereobserved on the lateral convexity of PIT dorsal to and inthe PMTS. The range of the depths of the responsiveneurons (based on depth readings) was approximately4.3 mm in monkey P and 5.9 mm in monkey M, withinterquartile depth ranges of 1.8 mm and 2.7 mm, respec-tively. This is much wider than orientation columns inearly visual cortical cortex (Tanigawa, Lu, & Roe, 2010),and to the best of our knowledge, there is no evidencefor orientation columns in macaque PIT (Vanduffel,Tootell, Schoups, & Orban, 2002). All responsive PITneurons were pooled in the analyses presented below
(n = 178 neurons; monkey P: 55 neurons; monkey M:123 neurons).The large majority of the responsive neurons (overall
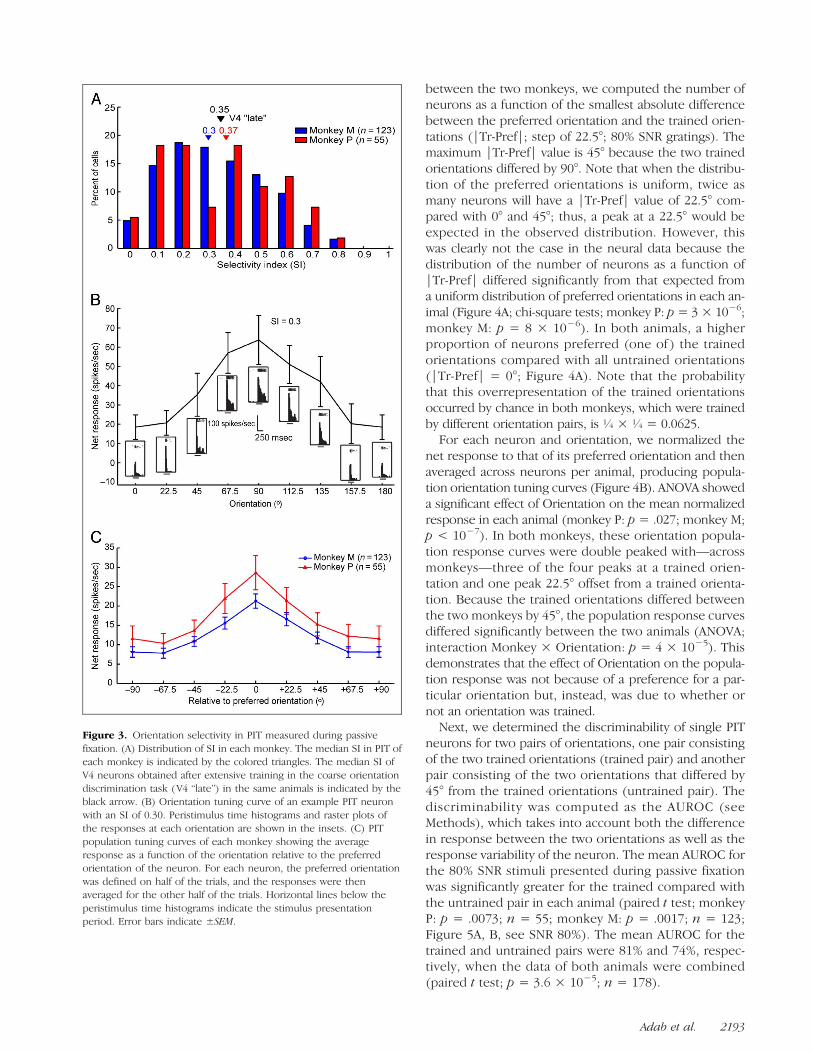
87%; monkey P: 95%; monkey M: 83%) showed a signif-icant effect of orientation (one-way ANOVA; p< .05) testedduring passive fixation. The degree of orientation selec-tivity was quantified by the SI (see Methods). The medianSI was 0.31 (monkey P: 0.37; monkey M: 0.30; Figure 3A).The orientation tuning of a PIT neuron with an SI of 0.30,which is close to that of the median value of the popula-tion, is shown in Figure 3B, whereas that of the populationsof neurons for each animal are presented in Figure 3C.Note that the population tuning curves were computedby defining the preferred orientation of each neuron onhalf of the trials and averaging the responses for the otherhalf of the trials, which avoids an overestimation of thepeak of the tuning curve. Overall, the degree of orientationselectivity in this PIT region (measured after extensive train-ing in the coarse orientationdiscrimination task)was similarto that observed in V4 in the same animals at the “late” stageof the training (median SI = 0.35; Adab & Vogels, 2011).
Single Unit Responses in the fMRI-definedPIT Region: Effects of Practicing CoarseOrientation Discrimination
First, we assessed whether the coarse orientation trainingaffected the orientation preference of the neurons, thatis, whether relatively more neurons preferred the trainedorientations. Because the trained orientations differed
Figure 2. fMRI mapping of activations to 20% SNR gratings. Two coronal and two lateral sections showing the V4 (green dashed ellipse) andPIT (blue dashed ellipse) activations in monkey M (A) and monkey P (B). The shown activations are from the contrast (trained and untrainedorientations)—noise background, which was thresholded at t > 3. Total number of stimulus presentations were 1820 and 700 in monkey Mand monkey P, respectively. L = left; R = right; P = posterior; A = anterior; D = dorsal; V = ventral.
2192 Journal of Cognitive Neuroscience Volume 26, Number 10
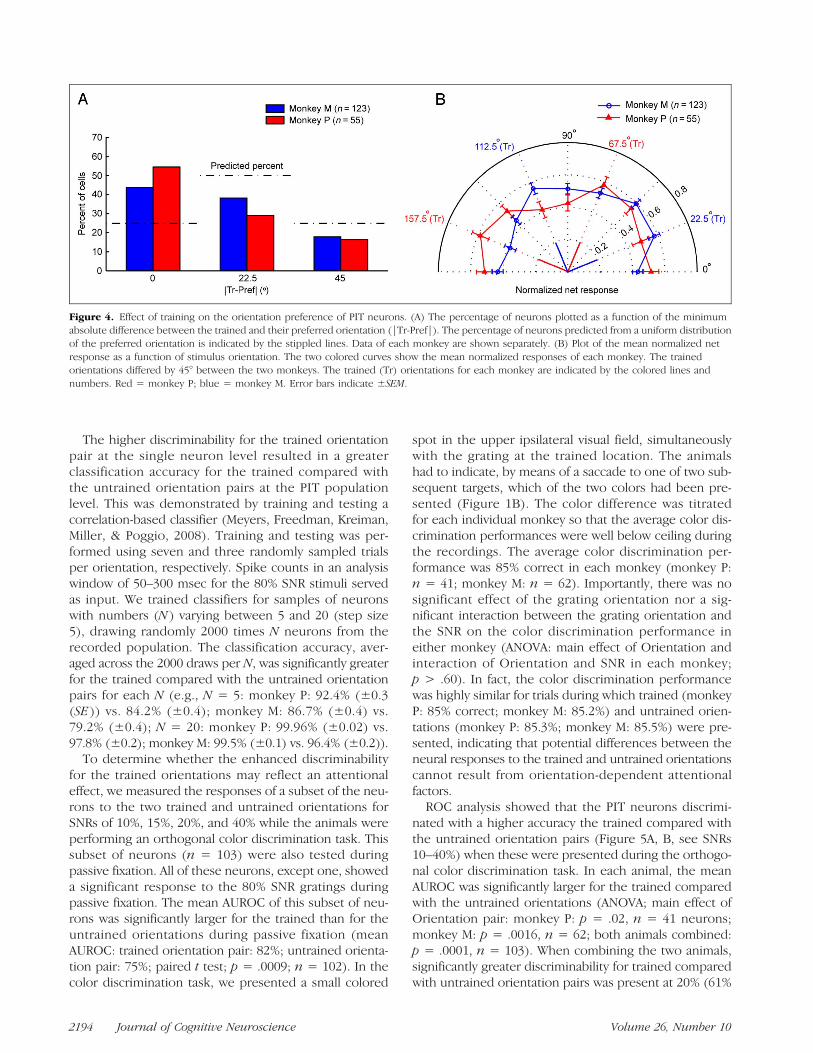
between the two monkeys, we computed the number ofneurons as a function of the smallest absolute differencebetween the preferred orientation and the trained orien-tations (|Tr-Pref|; step of 22.5°; 80% SNR gratings). Themaximum |Tr-Pref| value is 45° because the two trainedorientations differed by 90°. Note that when the distribu-tion of the preferred orientations is uniform, twice asmany neurons will have a |Tr-Pref| value of 22.5° com-pared with 0° and 45°; thus, a peak at a 22.5° would beexpected in the observed distribution. However, thiswas clearly not the case in the neural data because thedistribution of the number of neurons as a function of|Tr-Pref| differed significantly from that expected froma uniform distribution of preferred orientations in each an-imal (Figure 4A; chi-square tests; monkey P: p= 3 × 10⁻⁶;monkey M: p = 8 × 10⁻⁶). In both animals, a higherproportion of neurons preferred (one of ) the trainedorientations compared with all untrained orientations(|Tr-Pref| = 0°; Figure 4A). Note that the probabilitythat this overrepresentation of the trained orientationsoccurred by chance in both monkeys, which were trainedby different orientation pairs, is ¼ × ¼ = 0.0625.
For each neuron and orientation, we normalized thenet response to that of its preferred orientation and thenaveraged across neurons per animal, producing popula-tion orientation tuning curves (Figure 4B). ANOVA showeda significant effect of Orientation on the mean normalizedresponse in each animal (monkey P: p = .027; monkey M;p < 10−7). In both monkeys, these orientation popula-tion response curves were double peaked with—acrossmonkeys—three of the four peaks at a trained orien-tation and one peak 22.5° offset from a trained orienta-tion. Because the trained orientations differed betweenthe two monkeys by 45°, the population response curvesdiffered significantly between the two animals (ANOVA;interaction Monkey × Orientation: p = 4 × 10⁻⁵). Thisdemonstrates that the effect of Orientation on the popula-tion response was not because of a preference for a par-ticular orientation but, instead, was due to whether ornot an orientation was trained.
Next, we determined the discriminability of single PITneurons for two pairs of orientations, one pair consistingof the two trained orientations (trained pair) and anotherpair consisting of the two orientations that differed by45° from the trained orientations (untrained pair). Thediscriminability was computed as the AUROC (seeMethods), which takes into account both the differencein response between the two orientations as well as theresponse variability of the neuron. The mean AUROC forthe 80% SNR stimuli presented during passive fixationwas significantly greater for the trained compared withthe untrained pair in each animal (paired t test; monkeyP: p = .0073; n = 55; monkey M: p = .0017; n = 123;Figure 5A, B, see SNR 80%). The mean AUROC for thetrained and untrained pairs were 81% and 74%, respec-tively, when the data of both animals were combined(paired t test; p = 3.6 × 10⁻⁵; n = 178).
Figure 3. Orientation selectivity in PIT measured during passivefixation. (A) Distribution of SI in each monkey. The median SI in PIT ofeach monkey is indicated by the colored triangles. The median SI ofV4 neurons obtained after extensive training in the coarse orientationdiscrimination task (V4 “late”) in the same animals is indicated by theblack arrow. (B) Orientation tuning curve of an example PIT neuronwith an SI of 0.30. Peristimulus time histograms and raster plots ofthe responses at each orientation are shown in the insets. (C) PITpopulation tuning curves of each monkey showing the averageresponse as a function of the orientation relative to the preferredorientation of the neuron. For each neuron, the preferred orientationwas defined on half of the trials, and the responses were thenaveraged for the other half of the trials. Horizontal lines below theperistimulus time histograms indicate the stimulus presentationperiod. Error bars indicate ±SEM.
Adab et al. 2193
The higher discriminability for the trained orientationpair at the single neuron level resulted in a greaterclassification accuracy for the trained compared withthe untrained orientation pairs at the PIT populationlevel. This was demonstrated by training and testing acorrelation-based classifier (Meyers, Freedman, Kreiman,Miller, & Poggio, 2008). Training and testing was per-formed using seven and three randomly sampled trialsper orientation, respectively. Spike counts in an analysiswindow of 50–300 msec for the 80% SNR stimuli servedas input. We trained classifiers for samples of neuronswith numbers (N) varying between 5 and 20 (step size5), drawing randomly 2000 times N neurons from therecorded population. The classification accuracy, aver-aged across the 2000 draws per N, was significantly greaterfor the trained compared with the untrained orientationpairs for each N (e.g., N = 5: monkey P: 92.4% (±0.3(SE )) vs. 84.2% (±0.4); monkey M: 86.7% (±0.4) vs.79.2% (±0.4); N = 20: monkey P: 99.96% (±0.02) vs.97.8% (±0.2); monkey M: 99.5% (±0.1) vs. 96.4% (±0.2)).
To determine whether the enhanced discriminabilityfor the trained orientations may reflect an attentionaleffect, we measured the responses of a subset of the neu-rons to the two trained and untrained orientations forSNRs of 10%, 15%, 20%, and 40% while the animals wereperforming an orthogonal color discrimination task. Thissubset of neurons (n = 103) were also tested duringpassive fixation. All of these neurons, except one, showeda significant response to the 80% SNR gratings duringpassive fixation. The mean AUROC of this subset of neu-rons was significantly larger for the trained than for theuntrained orientations during passive fixation (meanAUROC: trained orientation pair: 82%; untrained orienta-tion pair: 75%; paired t test; p = .0009; n = 102). In thecolor discrimination task, we presented a small colored
spot in the upper ipsilateral visual field, simultaneouslywith the grating at the trained location. The animalshad to indicate, by means of a saccade to one of two sub-sequent targets, which of the two colors had been pre-sented (Figure 1B). The color difference was titratedfor each individual monkey so that the average color dis-crimination performances were well below ceiling duringthe recordings. The average color discrimination per-formance was 85% correct in each monkey (monkey P:n = 41; monkey M: n = 62). Importantly, there was nosignificant effect of the grating orientation nor a sig-nificant interaction between the grating orientation andthe SNR on the color discrimination performance ineither monkey (ANOVA: main effect of Orientation andinteraction of Orientation and SNR in each monkey;p > .60). In fact, the color discrimination performancewas highly similar for trials during which trained (monkeyP: 85% correct; monkey M: 85.2%) and untrained orien-tations (monkey P: 85.3%; monkey M: 85.5%) were pre-sented, indicating that potential differences between theneural responses to the trained and untrained orientationscannot result from orientation-dependent attentionalfactors.ROC analysis showed that the PIT neurons discrimi-
nated with a higher accuracy the trained compared withthe untrained orientation pairs (Figure 5A, B, see SNRs10–40%) when these were presented during the orthogo-nal color discrimination task. In each animal, the meanAUROC was significantly larger for the trained comparedwith the untrained orientations (ANOVA; main effect ofOrientation pair: monkey P: p = .02, n = 41 neurons;monkey M: p = .0016, n = 62; both animals combined:p = .0001, n = 103). When combining the two animals,significantly greater discriminability for trained comparedwith untrained orientation pairs was present at 20% (61%
Figure 4. Effect of training on the orientation preference of PIT neurons. (A) The percentage of neurons plotted as a function of the minimumabsolute difference between the trained and their preferred orientation (|Tr-Pref|). The percentage of neurons predicted from a uniform distributionof the preferred orientation is indicated by the stippled lines. Data of each monkey are shown separately. (B) Plot of the mean normalized netresponse as a function of stimulus orientation. The two colored curves show the mean normalized responses of each monkey. The trainedorientations differed by 45° between the two monkeys. The trained (Tr) orientations for each monkey are indicated by the colored lines andnumbers. Red = monkey P; blue = monkey M. Error bars indicate ±SEM.
2194 Journal of Cognitive Neuroscience Volume 26, Number 10
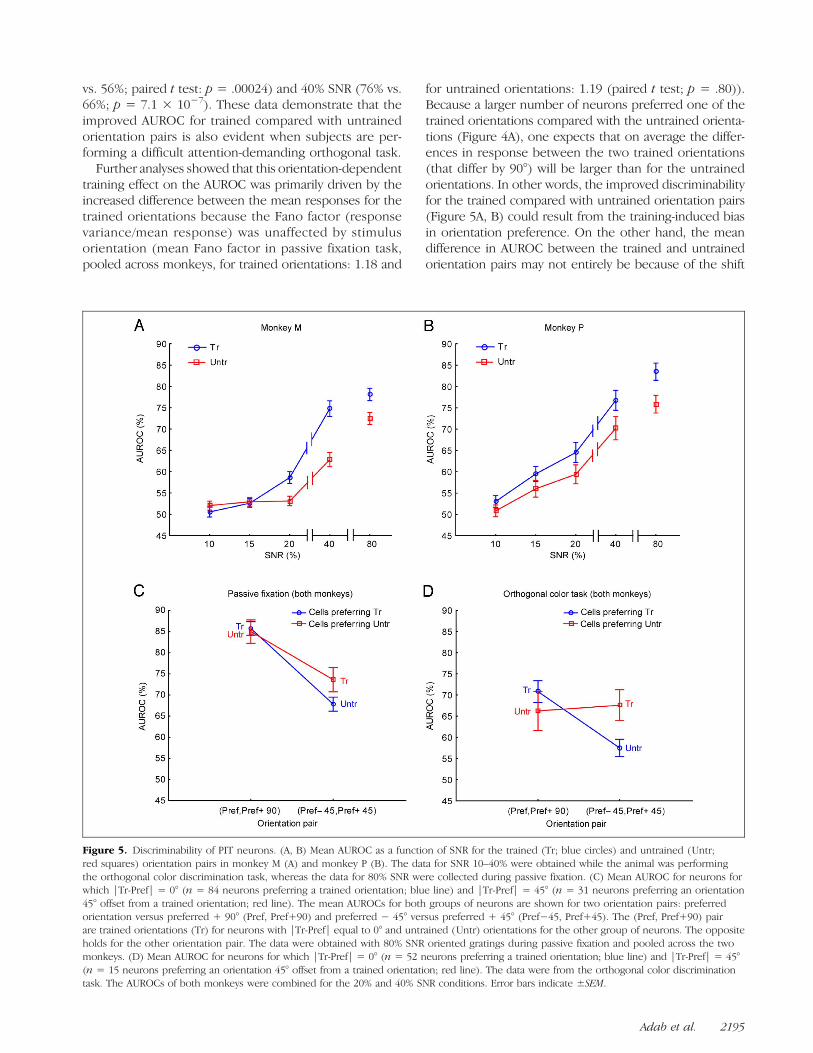
vs. 56%; paired t test: p = .00024) and 40% SNR (76% vs.66%; p = 7.1 × 10⁻⁷). These data demonstrate that theimproved AUROC for trained compared with untrainedorientation pairs is also evident when subjects are per-forming a difficult attention-demanding orthogonal task.Further analyses showed that this orientation-dependent
training effect on the AUROC was primarily driven by theincreased difference between the mean responses for thetrained orientations because the Fano factor (responsevariance/mean response) was unaffected by stimulusorientation (mean Fano factor in passive fixation task,pooled across monkeys, for trained orientations: 1.18 and
for untrained orientations: 1.19 (paired t test; p = .80)).Because a larger number of neurons preferred one of thetrained orientations compared with the untrained orienta-tions (Figure 4A), one expects that on average the differ-ences in response between the two trained orientations(that differ by 90°) will be larger than for the untrainedorientations. In other words, the improved discriminabilityfor the trained compared with untrained orientation pairs(Figure 5A, B) could result from the training-induced biasin orientation preference. On the other hand, the meandifference in AUROC between the trained and untrainedorientation pairs may not entirely be because of the shift
Figure 5. Discriminability of PIT neurons. (A, B) Mean AUROC as a function of SNR for the trained (Tr; blue circles) and untrained (Untr;red squares) orientation pairs in monkey M (A) and monkey P (B). The data for SNR 10–40% were obtained while the animal was performingthe orthogonal color discrimination task, whereas the data for 80% SNR were collected during passive fixation. (C) Mean AUROC for neurons forwhich |Tr-Pref| = 0° (n = 84 neurons preferring a trained orientation; blue line) and |Tr-Pref| = 45° (n = 31 neurons preferring an orientation45° offset from a trained orientation; red line). The mean AUROCs for both groups of neurons are shown for two orientation pairs: preferredorientation versus preferred + 90° (Pref, Pref+90) and preferred − 45° versus preferred + 45° (Pref−45, Pref+45). The (Pref, Pref+90) pairare trained orientations (Tr) for neurons with |Tr-Pref| equal to 0° and untrained (Untr) orientations for the other group of neurons. The oppositeholds for the other orientation pair. The data were obtained with 80% SNR oriented gratings during passive fixation and pooled across the twomonkeys. (D) Mean AUROC for neurons for which |Tr-Pref| = 0° (n = 52 neurons preferring a trained orientation; blue line) and |Tr-Pref| = 45°(n = 15 neurons preferring an orientation 45° offset from a trained orientation; red line). The data were from the orthogonal color discriminationtask. The AUROCs of both monkeys were combined for the 20% and 40% SNR conditions. Error bars indicate ±SEM.
Adab et al. 2195
in orientation preference. To examine this, we computedthe AUROC for the trained and untrained orientationpairs for two groups of neurons, those preferring atrained orientation (|Tr-Pref| = 0°) and those preferringan untrained orientation (|Tr-Pref| = 45°). If the effectof training on AUROC depends only on the orientationpreference shift, then one would expect that the meanAUROCs for the trained and untrained orientation pairsdo not differ between these two groups of neurons.Figure 5C shows the mean AUROCs for both groups ofneurons recorded during passive fixation for two orien-tation pairs: preferred orientation versus preferred + 90°(Pref, Pref+90) and preferred − 45° versus preferred +45° (Pref-45, Pref+45). Note that the (Pref, Pref+90) pairare trained orientations for neurons with |Tr-Pref| equalto 0° and untrained orientations for the other group ofneurons. The opposite holds for the other orientationpair (see Figure 5C). As expected, the mean AUROC islarger for the (Pref, Pref+90) compared with the (Pref-45,Pref+45) pair (ANOVA; main effect of Orientation pair: p<10−7) because the former includes the preferred orien-tation. If the training effect seen in Figure 5(A, B) merelyresulted from the higher proportion of neurons tuned totrained orientations, then one would expect that the meanAUROCs for the two pairs would be similar for the twogroups of neurons. However, the interaction betweenorientation pair and neuron group was close to significance(ANOVAwith factorsMonkey, Orientation pair, and Neurongroup; p= .09) with a higher AUROC for the trained orien-tation pair for the neurons preferring an untrained orien-tation (n = 31 neurons) compared with the untrainedorientation pair for neurons preferring a trained orientation(n = 84). The mean AUROC for an orientation pair thatincluded the preferred orientation (Pref, Pref+90) did notdiffer between the two groups of neurons.
The interaction between Orientation pair and Neurongroup was stronger and highly significant for the data ob-tained in the color discrimination task (ANOVA; p =.00056; Figure 5D). For this analysis, the AUROCs of bothmonkeys for the 20% and 40% SNR conditions were com-bined because a significant effect of Training was onlypresent for these SNRs (see above). For the neurons pre-ferring the trained orientations (n = 52; blue curve), themean AUROC was—as expected—greater when the ori-entation pair included the preferred orientation (Pref,Pref+90) compared with the other pair (orientations45° offset from preferred orientation). However, thiswas not the case for the neurons preferring orientations45° offset from the trained orientations (n = 15; redcurve). For these neurons, the mean AUROC for thetrained orientations was similar to that for the untrainedorientations, although the trained orientations in theseneurons were 45° offset from their preferred orientation.This interaction between orientation pair and neurongroup was stronger at the lower SNRs employed in thecolor task than for the 80% SNR stimulus used in thepassive fixation task (compare Figure 5C and D). This
difference in the strength of the interaction may reflectthe difference in SNR, that is, additional learning effectsfor the highly trained low SNR stimuli. Overall, the datasuggest that the training enhanced the discriminabilityfor the trained orientations even for neurons not prefer-ring the trained orientations. On the basis of these data,the increase in AUROC for the trained compared with theuntrained orientations does not solely reflect the largerproportion of neurons tuned to the trained orientation.Indeed, in addition to the shift in preferred orientation,there was an enhanced discriminability for the trainedorientations, especially at lower SNRs and for neuronspreferring the untrained orientations.We recorded also from single neurons of the fMRI-
activated PIT region of the “untrained” hemisphere ofmonkey M. The median SI of the 66 responsive PIT neu-rons in the “untrained” hemisphere was 0.14, which wassignificantly lower than the median SI of 0.30 for thetrained hemisphere in the same animal (n = 123; Mann–WhitneyU test; p=1.02×10⁻⁷). Thus, although responsesto the preferred orientations had similar strengths in the“trained” and “untrained” hemisphere, the average orien-tation tuning was broader in the untrained comparedwith the trained hemisphere (Figure 6A). The mean nor-malized response was similar across orientations in the“untrained” hemisphere (one-way ANOVA: p = .14) anddiffered significantly from that obtained in the “trained”hemisphere of the same animal (ANOVA: interactionOrien-tation and Hemisphere: p = .0078; Figure 6B). Whereas44% of the PIT neurons of the “trained” hemisphere ofmonkey M preferred the trained orientations, only 25%showed such preference in the “untrained” hemisphere.Neither during passive fixation nor when performingthe orthogonal color discrimination task (mean behav-ioral performance of 87% correct) did the mean AUROCfor the “untrained” hemisphere neurons differ betweenthe trained and untrained orientation pairs (passive fixa-tion, 80% SNR; paired t test: p = .80, n = 66; color dis-crimination, ANOVA: main effect of Orientation pair: p=.50; interaction Orientation and SNR: p = .66, n = 31;Figure 6D). However, ANOVA showed a significant inter-action between the Hemisphere and Orientation pairduring passive fixation ( p = .027, n = 189) and a signifi-cant interaction between Hemisphere, Orientation pair,and SNR during the color discrimination ( p = .00073,n = 93; Figure 6C, D). In summary, although orientation-sensitive neurons were present in the “untrained” hemi-sphere, their responses were similar for trained anduntrained orientations, unlike in the “trained” hemisphere.
PIT Responses in the Coarse OrientationDiscrimination Task
We recorded the responses of a subsample of the 81 PITneurons (monkey P: 30 responsive neurons; monkey M:51 neurons; only “trained” hemisphere) while the animalswere performing the coarse orientation discrimination
2196 Journal of Cognitive Neuroscience Volume 26, Number 10

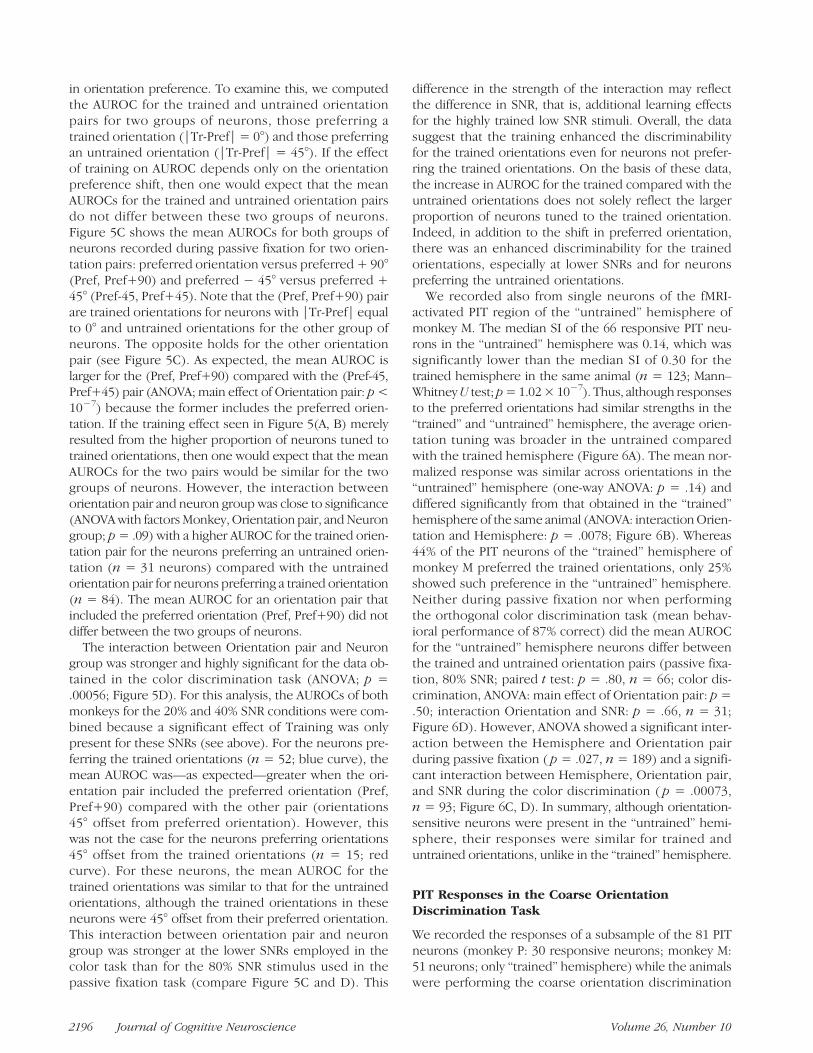
task for randomly interleaved SNRs that varied between 0and 40% (trained orientations at the trained location).The psychometric curves, averaged across the behav-ioral data of those recordings, were highly similar forthe two animals (Figure 7A, red and blue solid lines,ANOVA: main effect of Monkey: p = .09, interactionMonkey and SNR: p = .49), with a 75% correct thresholdof 12% SNR. Also, the neurometric curves did not differsignificantly between the two animals (Figure 7A, redand blue stippled lines, ANOVA: main effect of Monkey:p = .24, interaction Monkey and SNR: p = .58). Theaverage neurometric curve was substantially lower thanthe psychometric, with a 75% correct neural thresholdbetween 20% and 40% SNR in each monkey. None-theless, the average neural performance at 10% SNR (meanAUROC = 56%; n = 81 neurons) was significantly abovechance (t test; p = 2.2 × 10⁻⁷). Thus, the population ofPIT neurons can signal the orientation of trained stimuliwith high levels of noise. Figure 7A also compares theneurometric performance of the PIT neurons with the
average neurometric performance obtained in V4 (n =59) of the same animals at the “late” stage of training(Adab & Vogels, 2011). ANOVA on the pooled data ofthe two animals with factors SNR and Area showed a sig-nificant interaction between the two factors ( p = .024),which was due to a significantly higher neurometric perfor-mance in area V4 (83%) compared with PIT (77%; unpairedt test; p = .009) at 40% SNR. No significant differencesbetween the two areas were present at lower SNRs.
To assess whether the PIT responses covaried with thebehavioral responses of the animals, we computed foreach neuron grand CPs, combining data for SNRs smallerthan 40% (see Methods). The mean CP was 0.53, whichis significantly larger than chance (t test; p = .0013; n =81; Figure 7B). The mean CP rose to 0.56 ( p = .001;n = 20) when considering only neurons for which theAUROC was greater than 90% at 40% SNR in the coarseorientation discrimination. The mean CP in PIT tendedto be larger than that observed in V4 in the same ani-mals (mean: 0.52; neurons with AUROC > 90% at 40%
Figure 6. Orientation selectivity and discriminability in trained and untrained hemispheres of monkey M compared. (A) PIT population tuningcurves in the trained (Tr hemi) and untrained (Untr hemi) hemisphere. Same conventions as in Figure 3C. (B) Plot of the mean normalized netresponse as a function of stimulus orientation for the trained (blue) and untrained (green) hemisphere. The two trained (Tr) orientations areindicated by the blue stippled lines. (C, D) Mean AUROC as a function of SNR for the trained (Tr ori; circles) and untrained (Untr ori; squares)orientation pairs in the trained (C) and untrained (D) hemisphere. The data for SNR 10–40% were obtained while the animal was performingthe orthogonal color discrimination task, whereas the data for 80% SNR were collected during passive fixation. Panel C (trained hemisphere) is thesame as Figure 5A, and it is shown here for direct comparison with D (untrained hemisphere). Error bars indicate ±SEM.
Adab et al. 2197
SNR: 0.53; Adab& Vogels, 2011), a trend that failed to reachstatistical significance (Mann–Whitney U test, p = .2).Applying the correction procedure proposed by Kangand Maunsell (2012) for unbalanced ratios of behavioralchoices across stimulus conditions yielded somewhatlarger grand CPs for PIT (mean = 0.56; n = 81).
DISCUSSION
Functional imaging in monkeys that were trained to dis-criminate two orthogonal gratings, with low SNR, revealedactivations induced by noisy gratings in a posterior ITregion. Subsequent single unit recordings in PIT showedorientation selective responses that were comparable toV4 neurons in the same animals. More importantly, morePIT neurons preferred the trained compared with un-trained orientations and showed a greater discriminabilityof trained versus untrained orientations. The effects of
training on the responses to grating stimuli were alsopresent when the animals were performing a difficultorthogonal task in which the grating stimuli were task-irrelevant, suggesting that the training effect does notneed attention to be expressed. This is in contrast tosome perceptual learning effects in V1 with more complexstimuli, which were only present during task performance(Li, Piech, & Gilbert, 2004, 2008). A comparison of theresponses between trained and untrained hemispheressuggested that the orientation selectivity in this regionwas enhanced by training. These data show that theresponses of a late cortical area, PIT, change during theperceptual learning of a simple discrimination task usingsimple oriented gratings.The PIT region we recorded from appears to cor-
respond to the lower visual field representation of PIT/TEO with low eccentricity receptive fields (Boussaoud,Desimone, & Ungerleider, 1991). This region is anteriorto V4A (Roe et al., 2012). Tracer studies suggest that thisPIT/TEO region receives direct input from dorsal V4(Ungerleider, Galkin, Desimone, & Gattass, 2008) as wellas of other extrastriate areas (Markov et al., 2014). Singleunit recordings have shown that neurons in PIT are formselective (Yasuda, Banno, & Komatsu, 2010; Connor,Brincat, & Pasupathy, 2007; Hikosaka, 1999; Kobatake& Tanaka, 1994; Desimone & Gross, 1979), but despitetheir form selectivity, many still respond to simple features(Kobatake & Tanaka, 1994). In an older study, Vogels andOrban (1994) reported a mean orientation SI of 0.36 in aregion that, likely, overlapped with PIT, which is com-parable to that observed here in PIT of the trained hemi-sphere. These previous recordings were performed afterextensive training in a successive orientation discrimi-nation task. This observation, together with the presentfinding that orientation selectivity was lower in the un-trained compared with the trained hemisphere, suggeststhat high orientation selectivity in PIT may require exten-sive training in orientation discrimination.To the best of our knowledge, no other studies on
orientation selectivity in PIT exist. Previous single cellstudies demonstrated learning effects for shapes andobjects in macaque IT cortex (Woloszyn & Sheinberg,2012; Li & Dicarlo, 2008, 2010; Cox & DiCarlo, 2008;De Baene, Ons, Wagemans, & Vogels, 2008; Op de Beeck,Wagemans,&Vogels, 2007; Freedman, Riesenhuber, Poggio,& Miller, 2006; Baker, Behrmann, & Olson, 2002; Kobatake,Wang, & Tanaka, 1998), but without exception, these stud-ies recorded more anterior in IT. Srihasam, Mandeville,Morocz, Sullivan, and Livingstone (2012) reported fMRIactivations in juvenile but not adult monkeys after symboltraining in the occipitotemporal sulcus, more medial thanwhere we recorded. Thus, our study is the first demon-strating learning-related changes in lateral, posterior IT.Human fMRI studies have revealed that learning changesthe representation of low saliency shapes in higher-ordervisual cortical areas such as LOC and the posterior fusiformregion (Kourtzi, Betts, Sarkheil, & Welchman, 2005),
Figure 7. Behavior and neural responses during the coarse orientationdiscrimination task. (A) Average psychometric (full lines) andneurometric (stippled lines) curves. Blue: PIT recordings in monkey M;red: PIT recordings in monkey P; black: V4 recordings average ofboth animals (“late” training period). Error bars indicate ±SEM.(B) Distribution of grand CP shown for each monkey separately.The median CP of the two animals combined is indicated by the arrow.
2198 Journal of Cognitive Neuroscience Volume 26, Number 10

although in this case the stimuli were more complex thanthose employed in our study.We show here that for simple stimuli, gratings, a higher-
order visual area undergoes changes in its responsesfollowing training. Thus, training to discriminate simplevisual stimuli modifies the responses of neurons in mul-tiple visual areas at different levels of processing, andthere is no reason to assume that only those in earlyvisual cortex contribute to the behavioral performanceimprovement. In fact, CPs were similar in PIT and V4,which may indicate that both areas contribute to thebehavioral decisions. Because V4 and PIT neurons projectmainly to the same regions (Webster, Bachevalier, &Ungerleider, 1994; Distler, Boussaoud, Desimone, &Ungerleider, 1993), except for projections to areas locatedmore anterior in the temporal lobe, they could be readout in parallel in the present task. Alternatively, becausePIT is hierarchically a higher region than V4, it is possiblethat PIT neurons contribute more than V4 to the decisionsin this task, with the similar CPs in both areas reflectingnoise correlations between these areas. Causal methods,artificially interfering with neural activity, will be neededto distinguish these possibilities.Unlike what we show here for PIT, previous single unit
studies of perceptual learning in areas V1 (Ghose et al.,2002; Crist, Li, & Gilbert, 2001; Schoups et al., 2001), V2(Ghose et al., 2002), and V4 (Adab & Vogels, 2011;Raiguel et al., 2006; Yang & Maunsell, 2004) found noincrease in the proportion of neurons tuned to trainedstimuli. The findings in V1, V2, and V4 contrast with per-ceptual learning effects in monkey primary somato-sensory (Recanzone, Merzenich, Jenkins, Grajski, &Dinse, 1992) and auditory (Recanzone, Schreiner, &Merzenich, 1993) cortices, which did show enhancedrepresentations of the trained stimuli. These findingscombined with ours suggest that perceptual learning-related plasticity in late (such as PIT) but not early visualcortical areas resembles the plasticity present in primaryauditory and somatosensory cortices.It is unclear to what degree the learning-related changes
we observed in PIT reflect changes in the areas that pro-vide input to PIT (Markov et al., 2014). We prefer thehypothesis that the effects we observed in PIT at leastpartially reflect plasticity in PIT and do not merely resultfrom a pooling of perceptual learning related changes inthe areas that provide input to PIT. The increased re-sponses to the trained orientations and more neuronspreferring the trained orientations in PIT might reflectthe fine tuning of a trained orientation template (Dosher& Lu, 1998), which enhances the signal for the trainedorientations. This fine tuning can be viewed as a re-weighting of the input to PIT neurons, favoring the trainedorientations. Thus, perceptual learning may modify theresponse of multiple visual areas in a cascade, which ismore complex than posited in current formal models ofperceptual learning that considered changes in only earlyvisual cortex (Bejjanki, Beck, Lu, & Pouget, 2011; Roelfsema
& van Ooyen, 2005) or of the link between a stable earlyvisual cortical signal and the decision (Sotiropoulos, Seitz, &Series, 2011; Law & Gold, 2009; Petrov, Dosher, & Lu, 2005).
Acknowledgments
Wethank I. Puttemans, P.Kayenbergh,G.Meulemans, S. Verstraeten,M. Docx, W. Depuydt, D. Mantini, R. Peeters, T. Janssens, andM. De Paep for assistance and Dr. J. Taubert for critical read-ing of a draft. This study was supported by GOA, IUAP, PF, FWO,and the People Programme (Marie Curie Actions) of the EU 7thFramework Programme FP7/2007-2013/ (REA Grant PITN-GA-2011-290011).
Reprint requests should be sent to Rufin Vogels, Neurofysiologie,Campus Gasthuisberg, Herestraat, 3000, Leuven, Belgium, or viae-mail: [email protected].
REFERENCES
Aberg, K. C., & Herzog, M. H. (2012). About similarcharacteristics of visual perceptual learning and LTP. VisionResearch, 61, 100–106.
Adab, H. Z., & Vogels, R. (2011). Practicing coarse orientationdiscrimination improves orientation signals in macaquecortical area v4. Current Biology, 21, 1661–1666.
Baker, C. I., Behrmann, M., & Olson, C. R. (2002). Impact oflearning on representation of parts and wholes in monkeyinferotemporal cortex. Nature Neuroscience, 5, 1210–1216.
Bejjanki, V. R., Beck, J. M., Lu, Z. L., & Pouget, A. (2011).Perceptual learning as improved probabilistic inference inearly sensory areas. Nature Neuroscience, 14, 642–648.
Boussaoud, D., Desimone, R., & Ungerleider, L. G. (1991).Visual topography of area TEO in the macaque. Journal ofComparative Neurology, 306, 554–575.
Britten, K. H., Newsome, W. T., Shadlen, M. N., Celebrini, S., &Movshon, J. A. (1996). A relationship between behavioralchoice and the visual responses of neurons in macaque MT.Visual Neuroscience, 13, 87–100.
Connor, C. E., Brincat, S. L., & Pasupathy, A. (2007).Transformation of shape information in the ventral pathway.Current Opinion in Neurobiology, 17, 140–147.
Cox, D. D., & DiCarlo, J. J. (2008). Does learned shapeselectivity in inferior temporal cortex automatically generalizeacross retinal position? Journal of Neuroscience, 28,10045–10055.
Crist, R. E., Li, W., & Gilbert, C. D. (2001). Learning to see:Experience and attention in primary visual cortex. NatureNeuroscience, 4, 519–525.
De Baene, W., Ons, B., Wagemans, J., & Vogels, R. (2008).Effects of category learning on the stimulus selectivity ofmacaque inferior temporal neurons. Learning and Memory,15, 717–727.
Desimone, R., & Gross, C. G. (1979). Visual areas in thetemporal cortex of the macaque. Brain Research, 178,363–380.
Distler, C., Boussaoud, D., Desimone, R., & Ungerleider, L. G.(1993). Cortical connections of inferior temporal area TEO inmacaque monkeys. Journal of Comparative Neurology, 334,125–150.
Dosher, B. A., & Lu, Z. L. (1998). Perceptual learning reflectsexternal noise filtering and internal noise reduction throughchannel reweighting. Proceedings of the National Academyof Sciences, U.S.A., 95, 13988–13993.
Ekstrom, L. B., Roelfsema, P. R., Arsenault, J. T., Bonmassar, G.,& Vanduffel, W. (2008). Bottom–up dependent gating offrontal signals in early visual cortex. Science, 321, 414–417.
Adab et al. 2199

Fine, I., & Jacobs, R. A. (2002). Comparing perceptual learningtasks: A review. Journal of Vision, 2, 190–203.
Freedman, D. J., Riesenhuber, M., Poggio, T., & Miller, E. K.(2006). Experience-dependent sharpening of visual shapeselectivity in inferior temporal cortex. Cerebral Cortex, 16,1631–1644.
Ghose, G. M., Yang, T., & Maunsell, J. H. (2002). Physiologicalcorrelates of perceptual learning in monkey V1 and V2.Journal of Neurophysiology, 87, 1867–1888.
Gibson, E. J. (1963). Perceptual learning. Annual Review ofPsychology, 14, 29–56.
Gu, Y., Liu, S., Fetsch, C. R., Yang, Y., Fok, S., Sunkara, A.,et al. (2011). Perceptual learning reduces interneuronalcorrelations in macaque visual cortex. Neuron, 71, 750–761.
Hikosaka, K. (1999). Tolerances of responses to visual patternsin neurons of the posterior inferotemporal cortex in themacaque against changing stimulus size and orientation, anddeleting patterns. Behavioural Brain Research, 100, 67–76.
Jastorff, J., Kourtzi, Z., & Giese, M. A. (2009). Visual learningshapes the processing of complex movement stimuli in thehuman brain. Journal of Neuroscience, 29, 14026–14038.
Kang, I., & Maunsell, J. H. R. (2012). Potential confounds inestimating trial-to-trial correlations between neuronalresponse and behavior using choice probabilities. Journal ofNeurophysiology, 108, 3403–3415.
Kobatake, E., & Tanaka, K. (1994). Neuronal selectivities tocomplex object features in the ventral visual pathway of themacaque cerebral cortex. Journal of Neurophysiology, 71,856–867.
Kobatake, E., Wang, G., & Tanaka, K. (1998). Effects of shape-discrimination training on the selectivity of inferotemporalcells in adult monkeys. Journal of Neurophysiology, 80,324–330.
Kourtzi, Z., Betts, L. R., Sarkheil, P., & Welchman, A. E. (2005).Distributed neural plasticity for shape learning in the humanvisual cortex. PLoS Biology, 3, e204.
Law, C. T., & Gold, J. I. (2008). Neural correlates of perceptuallearning in a sensory-motor, but not a sensory, cortical area.Nature Neuroscience, 11, 505–513.
Law, C. T., & Gold, J. I. (2009). Reinforcement learning canaccount for associative and perceptual learning on a visual-decision task. Nature Neuroscience, 12, 655–663.
Li, N., & Dicarlo, J. J. (2008). Unsupervised natural experiencerapidly alters invariant object representation in visual cortex.Science, 321, 1502–1507.
Li, N., &Dicarlo, J. J. (2010). Unsupervised natural visual experiencerapidly reshapes size-invariant object representation in inferiortemporal cortex. Neuron, 67, 1062–1075.
Li, W., Piech, V., & Gilbert, C. D. (2004). Perceptual learning andtop–down influences in primary visual cortex. NatureNeuroscience, 7, 651–657.
Li, W., Piech, V., & Gilbert, C. D. (2008). Learning to link visualcontours. Neuron, 57, 442–451.
Markov, N. T., Ercsey-Ravasz, M. M., Gomes, A. R. R., Lamy, C.,Magrou, L., Vezoli, J., et al. (2014). A weighted and directedinterareal connectivity matrix for macaque cerebral cortex.Cerebral Cortex, 24, 17–36.
Meyers, E. M., Freedman, D. J., Kreiman, G., Miller, E. K., &Poggio, T. (2008). Dynamic population coding of categoryinformation in inferior temporal and prefrontal cortex.Journal of Neurophysiology, 100, 1407–1419.
Op de Beeck, H. P., Wagemans, J., & Vogels, R. (2007). Effectsof perceptual learning in visual backward masking on theresponses of macaque inferior temporal neurons.Neuroscience, 145, 775–789.
Petrov, A. A., Dosher, B. A., & Lu, Z. L. (2005). The dynamics ofperceptual learning: An incremental reweighting model.Psychological Review, 112, 715–743.
Popivanov, I. D., Jastorff, J., Vanduffel, W., & Vogels, R. (2012).Stimulus representations in body-selective regions of themacaque cortex assessed with event-related fMRI.Neuroimage, 63, 723–741.
Raiguel, S., Vogels, R., Mysore, S. G., & Orban, G. A. (2006).Learning to see the difference specifically alters the mostinformative V4 neurons. Journal of Neuroscience, 26,6589–6602.
Recanzone, G. H., Merzenich, M. M., Jenkins, W. M., Grajski,K. A., & Dinse, H. R. (1992). Topographic reorganization ofthe hand representation in cortical area 3B of owl monkeystrained in a frequency-discrimination task. Journal ofNeurophysiology, 67, 1031–1056.
Recanzone, G. H., Schreiner, C. E., & Merzenich, M. M. (1993).Plasticity in the frequency representation of primary auditorycortex following discrimination training in adult owlmonkeys. Journal of Neuroscience, 13, 87–103.
Roe, A. W., Chelazzi, L., Connor, C. E., Conway, B. R., Fujita, I.,Gallant, J. L., et al. (2012). Toward a unified theory of visualarea V4. Neuron, 74, 12–29.
Roelfsema, P. R., & van Ooyen, A. (2005). Attention-gatedreinforcement learning of internal representations forclassification. Neural Computation, 17, 2176–2214.
Sagi, D. (2011). Perceptual learning in Vision Research. VisionResearch, 51, 1552–1566.
Schoups, A., Vogels, R., Qian, N., & Orban, G. (2001). Practisingorientation identification improves orientation coding in V1neurons. Nature, 412, 549–553.
Sotiropoulos, G., Seitz, A. R., & Series, P. (2011). Perceptuallearning in visual hyperacuity: A reweighting model. VisionResearch, 51, 585–599.
Srihasam, K., Mandeville, J. B., Morocz, I. A., Sullivan, K. J., &Livingstone, M. S. (2012). Behavioral and anatomicalconsequences of early versus late symbol training inmacaques. Neuron, 73, 608–619.
Tanigawa, H., Lu, H. D. D., & Roe, A. W. (2010). Functionalorganization for color and orientation in macaque V4. NatureNeuroscience, 13, 1542–1548.
Uka, T., Sasaki, R., & Kumano, H. (2012). Change in choice-related response modulation in area MT during learning of adepth-discrimination task is consistent with task learning.Journal of Neuroscience, 32, 13689–13700.
Ungerleider, L. G., Galkin, T. W., Desimone, R., & Gattass, R.(2008). Cortical connections of area V4 in the macaque.Cerebral Cortex, 18, 477–499.
Vanduffel, W., Fize, D., Mandeville, J. B., Nelissen, K., Van, H. P.,Rosen, B. R., et al. (2001). Visual motion processinginvestigated using contrast agent-enhanced fMRI in awakebehaving monkeys. Neuron, 32, 565–577.
Vanduffel, W., Tootell, R. B. H., Schoups, A. A., & Orban, G. A.(2002). The organization of orientation selectivity throughoutmacaque visual cortex. Cerebral Cortex, 12, 647–662.
Vogels, R., & Orban, G. A. (1994). Activity of inferior temporalneurons during orientation discrimination with successivelypresented gratings. Journal of Neurophysiology, 71, 1428–1451.
Webster, M. J., Bachevalier, J., & Ungerleider, L. G. (1994).Connections of inferior temporal areas TEO and TE withparietal and frontal cortex in macaque monkeys. CerebralCortex, 4, 470–483.
Woloszyn, L., & Sheinberg, D. L. (2012). Effects of long-termvisual experience on responses of distinct classes of singleunits in inferior temporal cortex. Neuron, 74, 193–205.
Yang, T., & Maunsell, J. H. (2004). The effect of perceptuallearning on neuronal responses in monkey visual area V4.Journal of Neuroscience, 24, 1617–1626.
Yasuda, M., Banno, T., & Komatsu, H. (2010). Color selectivityof neurons in the posterior inferior temporal cortex of themacaque monkey. Cerebral Cortex, 20, 1630–1646.
2200 Journal of Cognitive Neuroscience Volume 26, Number 10