performance revie action / projects : vsf greenfield project at vilayat fully commissioned intensive...
TRANSCRIPT

Performance Review
Quarter 4 : 2014-15
Grasim Industries Limited
A VSF and Cement Major
Statements in this “Presentation” describing the Company’s objectives, estimates, expectations or predictions may be “forward looking statements” within the meaning of applicable securities laws and regulations. Actual results could differ materially from those expressed or implied. Important factors that could make a difference to the Company’s operations include global and Indian demand supply conditions, finished goods prices, feedstock availability and prices, cyclical demand and pricing in the Company’s principal markets, changes in Government regulations, tax regimes, economic developments within India and the countries within which the Company conducts business and other factors such as litigation and labour negotiations. The Company assumes no responsibility to publicly amend, modify or revise any forward looking statement, on the basis of any subsequent development, information or events, or otherwise.
Cautionary Statement

Highlights
Business Review
Financial Performance
Capex Plan
Summary
Contents

Highlights – Quarter 4
Business Environment :
Global Economy : divergent signs continue
US economy appears to be on road to recovery, though concerns continue
Growth affected in China amidst investment slowdown
European economy remains fragile
US dollar appreciated sharply against major currencies
1
4.1
7.2 7.5 6.6
5.3
7.0 7.8 7.5
2.0
4.0
6.0
8.0
10.0
Q4 FY13
Q1 FY14
Q2 FY14
Q3 FY14
Q4 FY14
Q1 FY15
Q2 FY15
Q3 FY15
GDP growth * (%) Indian Economy: Though GDP and other fundamentals are improving
gradually, investment growth yet to show signs of pick up
Lower inflation, fiscal deficit and CAD
Successful Coal blocks auction and amendment in Mining regulations
Cement demand recorded de-growth due to low Government spending
and slowdown in Housing sector
However, Initiatives announced in the Union Budget to boost investment
in infrastructure
* Based on New series

Strategic Action / Projects :
VSF Greenfield project at Vilayat fully commissioned
Intensive business development and strengthening of supply chain through launch of brand LIVA
Consolidation of Chemical business initiated with proposal to merge
Aditya Birla Chemicals (India) Limited (ABCIL) with Grasim
Caustic Soda capacity will increase by 78% to ~804K TPA post merger (including ~59K TPA under acquisition by ABCIL)
with presence across India
Merger w.e.f. the appointed date i.e. 1st April, 2015, is expected to be completed by Q3 this year upon getting
requisite approvals
Acquisition of cement units of Jaiprakash Associates in Madhya Pradesh by UltraTech on track
Application already made to High court and CCI for approval, expected to be operational in Q3
Additional Clinker line of 2 Mn. TPA commissioned at Shambhupura, Rajasthan
On commissioning of Grinding capacity and acquisition plans, the domestic capacity will rise from 60 Mn. TPA to
71 Mn. TPA by Q4 this year
Highlights – Quarter 4
Operating Performance:
Standalone business has shown growth with VSF and Chemical sales volume increasing by 19% and 21% respectively post commissioning of Vilayat project
Lower realisation impacted VSF business profitability
Cement Business PBIDT up by 3% on the back of improvement in realisation, despite 2% decline in volume 2

Business Review
VSF
Chemical
Cement Subsidiary

0.75
1.00
1.25
1.50
1.75
2.00
2.25
$/Kg. International Fibre Prices
Cotton PSF VSF
Viscose Staple Fibre : Highlights
Global Industry Scenario VSF continues to be in over capacity scenario,
though VSF demand is fastest growing among competing fibres
Pricing pressure further intensified with sharp decline in prices of competing fibres PSF prices declined sharply by ~15% QoQ led by
lower crude prices
While Cotton prices remained range bound on QoQ
basis, On YoY basis prices declined by 27% due to
record inventory and change in Chinese policy
VSF prices also remained under pressure and
declined by ~4% QoQ and ~7% YoY
Business performance Production up by 24% over last year with
commissioning of Vilayat plant Sales volume has also gone up significantly by 19%
over last year Average realisation were down 7% YoY, in line
with the trend in international markets Sales also includes off-grade material produced
during stabilisation phase of Vilayat plant
Quarter 3
2014-15
Quarter 4 % Change
(YoY) 2014-15 2013-14
454,425 Capacity - Annual (MT) 498,225 377,775 32
113,605 Capacity - Quarter (MT)* 117,450 94,444 24
105,834 Production (MT) 111,341 89,507 24
97,001$ Sales Volumes (MT) 118,486$ 99,385 19
1,203 Net Revenue (` Cr.) 1,405 1,274 10
3
* Operational capacity during the quarter $ Excluding trial run sales of 1,933 MT at Vilayat (2,796 MT in Q3)
1.53
0.97
1.59
87 80
`/Kg.
113
75
85
95
105
115
125
135
Domestic Fibre Prices
Cotton PSF Grey VSF

Viscose Staple Fibre : Highlights
….)
Variable cost have declined by 7% with reduction in Pulp cost by 13% This has helped in partially offsetting the impact
of lower VSF realisation
However fixed costs have gone up Commissioning of Vilayat project, under
stabilisation
Due to change in interest rate, there was
provisions for retirement benefits of ` 15 crore in
Q4 this year against write back of ` 10 crore in Q4
last year
PBIDT lower at ` 97 crore Margins were impacted by lower realisation led
by over capacity
Depreciation has gone up with commissioning of Vilayat project impacting PBIT
Pulp JVs Financial performance impacted due to lower
realisation, partially offset by
Higher DG Pulp volumes - up by 6% YoY
Paper pulp mill records improved
performance with higher production, sales
and realisation
Sequentially performance has improved led by
higher volumes and realisations
Quarter 3
2014-15
Quarter 4 % Change
(YoY) 2014-15 2013-14
Standalone Business:
136 PBIDT (` Cr.) 97 128 (25)
11.2% PBIDT Margin (%) 6.9% 10.0%
98 PBIT (` Cr.) 39 89 (56)
9.4% ROAvCE % (Excl. CWIP) 3.4% 11.7%
Pulp & Fibre Joint Ventures – Grasim’s Share (` Cr.):
462 Revenue 501 566 (11)
(27)* PBIDT 33 38 (13)
Consolidated Business (Pulp and Fibre):
112 PBIDT (` Cr.) 128 157 (18)
4
* Includes ` 28 crore of MTM losses in Domsjo

Amidst difficult conditions, new capacity additions have slowed down, which should gradually improve
industry utilisation
Stabilisation of Vilayat unit and gradual conversion to specialty product should improve volume and
realisations
Concerted market and product development activities leading to market expansion in domestic segment
Launch of LIVA brand to increase visibility of VSF products in domestic markets
Focus on improving quality and increase in share of specialty products
Realisations expected to remain under pressure in near term
Weakness in Cotton and PSF prices may further impact the VSF growth rate
Production from Nagda plant to impact in Q1 this year due to water shortage, till onset of Monsoon
Viscose Staple Fibre : Outlook
5
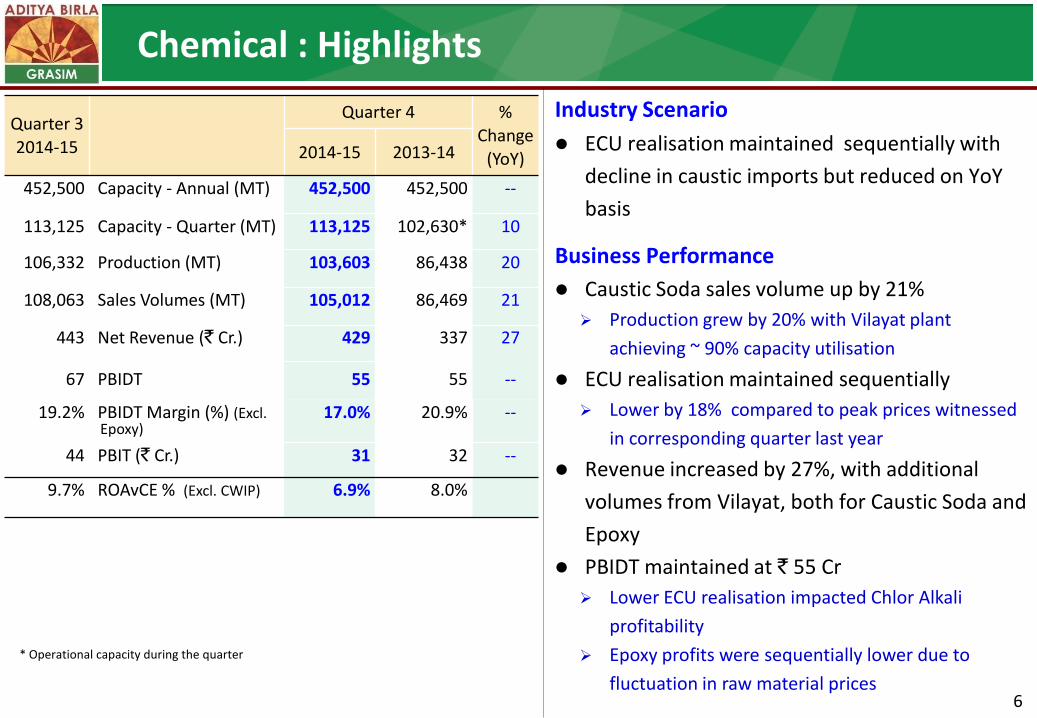
Chemical : Highlights
Industry Scenario
ECU realisation maintained sequentially with
decline in caustic imports but reduced on YoY
basis
Business Performance
Caustic Soda sales volume up by 21%
Production grew by 20% with Vilayat plant
achieving ~ 90% capacity utilisation
ECU realisation maintained sequentially
Lower by 18% compared to peak prices witnessed
in corresponding quarter last year
Revenue increased by 27%, with additional
volumes from Vilayat, both for Caustic Soda and
Epoxy
PBIDT maintained at ` 55 Cr
Lower ECU realisation impacted Chlor Alkali
profitability
Epoxy profits were sequentially lower due to
fluctuation in raw material prices
Quarter 3
2014-15
Quarter 4 %
Change
(YoY) 2014-15 2013-14
452,500 Capacity - Annual (MT) 452,500 452,500 --
113,125 Capacity - Quarter (MT) 113,125 102,630* 10
106,332 Production (MT) 103,603 86,438 20
108,063 Sales Volumes (MT) 105,012 86,469 21
443 Net Revenue (` Cr.) 429 337 27
67 PBIDT 55 55 --
19.2% PBIDT Margin (%) (Excl. Epoxy)
17.0% 20.9% --
44 PBIT (` Cr.) 31 32 --
9.7% ROAvCE % (Excl. CWIP)
6.9% 8.0%
* Operational capacity during the quarter
6

150
200
250
300
350
400
09-10 10-11 11-12 12-13 13-14 14-15
276
304319
353367
390
Cement : Highlights
Industry Scenario
Renewed focus on infrastructure still not started
yielding results
Low infrastructure spending, subdued housing
activity impacted demand Volume declined YoY, although improved over Q3
Industry capacity utilisation 67% for Q4 Annual demand 255-260 Mn Ton vs Capacity of 390
Mn. TPA
Business Performance Domestic capacity expanded to 60.2 Mn. TPA 4.8 Mn. from Gujarat units acquisition in Q1
1.4 Mn. from Rajashree plant expansion in Q3
Capacity utilisation of Indian operations at
78%
Cement sales volume declined by 3% YoY
Putty sales increased by 17%, White Cement
volume were down marginally
Quarter 3
2014-15
Quarter 4 % Change
(YoY) 2014-15 2013-14
Grey Cement (Mn. MT)
49.70 Clinker capacity - Annual 51.70 46.10 12
63.15 Cement Capacity – Annual 63.15 56.95 11
15.80 Cement Capacity - Qtr. 15.80 13.87 13
11.31 Production 12.46 12.81 (3)
Sales Volume
11.48 - Cement $ 12.52 12.83 (2)
0.32 - Clinker 0.26 0.15 69
White Cement & Putty (LMT)
3.17 Sales Volumes $ 3.52 3.28 7
Mn. Tons
Estimated Industry Capacity
7
$ includes captive consumption (RMC and Value added products)

Quarter 3
2014-15
Quarter 4 % Change
(YoY) 2014-15 2013-14
5,947 Net Revenue (` Cr.) 6,597 6,315 4
1,058 PBIDT (` Cr.) 1,435 1,389 3
18.0% PBIDT Margin (%) 21.6% 21.8%
762 PBIT (` Cr.) 1,129 1,088 4
10.3% ROAvCE (%) (Excl. CWIP) 14.7% 17.3% --
Cement realisation improved on YoY basis to pass increase in cost
Total variable cost increased by 5%
Manufacturing Variable Cost increased marginally
While increase in royalty on limestone and new
levy under MMDR Act increased the cost, the
lower energy prices helped in offsetting the
impact
Logistic cost up by 9%, benefit of lower diesel
price negated by increase in rail freight, change in
market mix, lower availability of rakes
PBIDT increased by 3%
Cement : Financials
8

Cement : Outlook
Cement demand expected to grow linked with GDP
Demand revival from infrastructure projects supported by higher budgetary allocation
Housing demand to improve with higher Government focus and softening in interest rates
Capacity utilisation to improve gradually with expected improvement in growth and slowdown in
capacity creation
Capacity additions are constrained by current profitability and long gestation period
Softening of energy prices in global markets augur well for the Cement sector
9
India Overseas Total Expected by
Present capacity 60.2 3.0 63.2 Projects under Implementation:
• Grinding units in West Bengal, Bihar and Haryana to support Clinker capacity already commissioned at Raipur and Shambhupura
6.0 6.0 FY16
• Bahrain Grinding unit 0.6 0.6 Early FY17
• JAL’s Bela and Sidhi plants (MP) under acquisition 4.9 4.9 Cement capacity to be further augmented by 1.8 – 2.5 Mn. TPA based on surplus clinker
Total 71.1 3.6 74.7
(Mn. TPA)

Financial Performance

8418
49 92 282
(21)
8820
Q4FY2013-14
VSF & JVs Chemical Cement Inter Co. Eliminations &
Others
Q4FY 2014-15
Consolidated Revenue
` C
rore
10
5%
8,418 49 92 282 (21) 8,820
1,717
337
6,315
49
1,766
429
6,597
28 -
1,000
2,000
3,000
4,000
5,000
6,000
7,000
VSF & E Pulp JVs Chemical Cement Others
Q4FY14 Q4FY15

Financial Performance – Consolidated (` Crore)
11
Finance Cost and Depreciation has increased on account of commissioning of new capacities and acquisition of Gujarat cement units
Tax expenses for the quarter / year include: One-time impact of ` 58 Cr. towards additional deferred tax liability due to increase in rate of surcharge on
Income tax (Net on minority ` 38 Cr.) Tax charge for the corresponding quarter last year was after netting of provision of ` 103 Cr. for earlier years
no longer required (Net on minority ` 65 Cr.)
% Change % Change
2014-15 2013-14 YoY 2014-15 2013-14 YoY
32,847 29,323 12 Revenue 8,820 8,418 5
27,703 24,409 13 Operating Costs 7,271 6,891 6
5,683 5,491 4 PBIDT 1,658 1,655 -
667 447 49 Finance cost 183 108 69
1,563 1,457 7 Depreciation 417 389 7
3,453 3,586 (4) PBT 1,058 1,158 (9)
1,016 735 38 Tax Expenses 326 168 94
838 883 (5) Minority Share 261 340 (23)
154 103 50 Share in Profit of Associates 45 30 49
1,753 2,072 (15) PAT (Before EI) 516 679 (24)
9 - Exceptional Item 9 -
1,744 2,072 (16) PAT 507 679 (25)
189.6 225.5 (16) EPS (`) 55.1 73.9 (25)
Adjusted For:
36 (87) a. Non Recurring Tax Expenses
(Net of Minority Share)38 (65)
9 - b. Diminution provision in respect of BLPP 9 -
1,789 1,985 (10) PAT 555 614 (10)
Full Year Quarter 4

1655
(29) --46 (14)
1658
Qtr. 4 2013-14
VSF & JVs Chemical Cement Others incl.Inter Co.
Eliminations
Qtr. 4 2014-15
Consolidated PBIDT
` C
rore
1,655 (29) -- 46 (14) 1,658
12
157 55
1,389
54 128
55
1,435
40
-
200
400
600
800
1,000
1,200
1,400
1,600
VSF & Pulp JVs Chemical Cement Others
Q4FY14 Q4FY15

Net Profit
(` Crore)
13
Quarter 3
2014-15
Total
Co.
Grasim'
s share
Total
Co.
Grasim'
s share
Grasim's
share
Total
Co.
Grasim'
s share
Total
Co.
Grasim'
s share
556 896 (38) Standalone PAT 57 130 (56)
530 896 94 Standalone PAT (After EI) 31 130
2,098 1,264 2,206 1,330 (5) 240 UltraTech Cement 657 396 865 522 (24)
14 14 18 18 3 Grasim Bhiwani Textiles 4 4 7 7
2 3 0.5 Samruddhi Swastik and Sun God
(Investment Subsidiaries) 1 1
(160) (111) (286) (107) (48) Fibre and Pulp JVs 36 15 (12) (2)
3,193 155 1,968 101 53 33 Idea Cellular 942 45 590 30 48
(110) (170) 13 Inter Company Eliminations / Others 16 (8)
1,214 1,176 3 240 Grasim's Share in Subsidiaries / JVs 476 549 (13)
(16) 334 Grasim Consolidated PAT (After EI) (25)
1,789 1,985 (10) 334
Comparable PAT (Excluding EI & non
recurring tax expenses, Net of Minority
Share )
555 614 (10)
Full Year
%
Change
Quarter 4
%
Change
2014-15 2013-14 2014-15 2013-14
1,744 2,072 507 679

Balance Sheet : Grasim (` Crore)
15
As on
31stMar'15
As on
31stMar'14EQUITY & LIABILITIES
As on
31stMar'15
As on
31stMar'14
Shareholders' Funds11,183 10,828 Net Worth 23,140 21,614
- - Minority Interest 7,682 6,936 Non Current Liabilities
857 1,004 Long Term Borrowings 6,384 7,612 615 462 Deferred Tax Liability (Net) 3,410 2,803
89 57 Long Term Liabilities & Provisions 297 220 Current Liabilities
258 298 ST Borrowings/Current Maturities of LT Borrowings 5,546 2,069
1,366 1,229 Current Liabilities & Provisions 7,576 6,481 14,367 13,878 SOURCES OF FUNDS 54,035 47,736
ASSETSNon-Current Assets
5,188 3,548 Net Fixed Assets 28,550 21,935 522 1,947 Capital WIP & Advances 3,507 5,008 - - Goodwill on Consolidation 3,283 3,277
Non- Current Investments2,636 2,636 Cement Subsidiary - - 1,850 1,784 Other Investments 3,839 2,673
454 339 Long Term Loans and Advances 1,533 880 Current Assets
864 1,184 Current Investments (MF/Bonds) 3,416 4,938 2,853 2,440 Other Current Assets 9,907 9,025
14,367 13,878 APPLICATION OF FUNDS 54,035 47,736 1,115 1,302 Total Borrowings 11,930 9,681 1,096 1,359 Total Liquid Funds 5,790 6,239
19 (57) Net Debt 6,140 3,442
Standalone Consolidated

Strong Financials
Strong Balance Sheet to support growth plans
16
(` Crore)Full Year
2014-15
Full Year
2013-14
Full Year
2014-15
Full Year
2013-14
Net Worth 11,183 10,828 23,140 21,614
Debt 1,115 1,302 11,930 9,681
Net Debt (+) over liquid funds (-) 19 (57) 6,140 3,442
Capital Employed 12,912 12,592 46,162 41,035
Debt:Equity (x) 0.10 0.12 0.39 0.34
Net Debt: Equity (x) - - 0.20 0.12
Net Debt / PBIDT 0.02 - 1.08 0.63
Interest Cover 13.8 13.2 6.8 9.0
Book Value (`) 1,217 1,179 2,519 2,353
ROAvCE (%) (Excluding CWIP) 10.5 12.1
RONW (%) 7.8 10.0
ConsolidatedStandalone

Capex
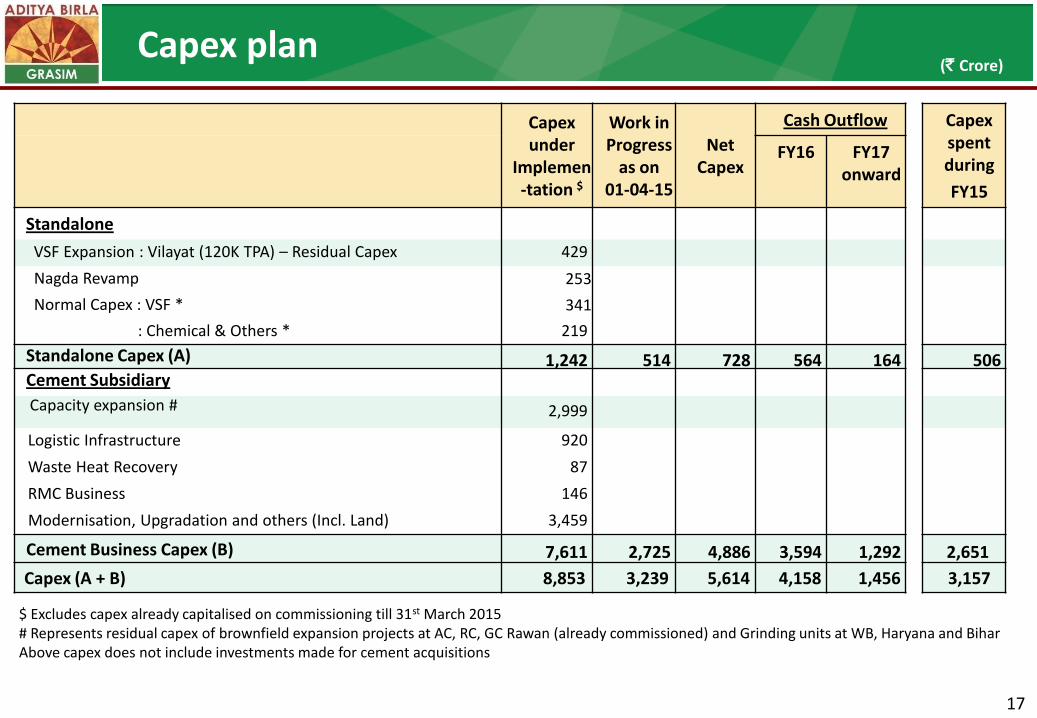
Capex plan
$ Excludes capex already capitalised on commissioning till 31st March 2015 # Represents residual capex of brownfield expansion projects at AC, RC, GC Rawan (already commissioned) and Grinding units at WB, Haryana and Bihar Above capex does not include investments made for cement acquisitions
(` Crore)
17
Capex under
Implemen-tation $
Work in Progress
as on 01-04-15
Net Capex
Cash Outflow Capex spent during
FY15
FY16 FY17 onward
Standalone
VSF Expansion : Vilayat (120K TPA) – Residual Capex 429
Nagda Revamp 253
Normal Capex : VSF * 341
: Chemical & Others * 219
Standalone Capex (A) 1,242 514 728 564 164 506 Cement Subsidiary
Capacity expansion #
2,999
Logistic Infrastructure 920
Waste Heat Recovery 87
RMC Business 146
Modernisation, Upgradation and others (Incl. Land) 3,459
Cement Business Capex (B) 7,611 2,725 4,886 3,594 1,292 2,651
Capex (A + B) 8,853 3,239 5,614 4,158 1,456 3,157

Summary

Summary
VSF business performance impacted on account of lower realisation in line with decline in competing
fibre prices coupled with overcapacity
Ramping up of production at Vilayat to drive volumes, better product mix and profitability
ABCIL merger to drive Chemical business volumes and profitability
Cement business maintained operating profit though PAT impacted due to higher interest and
depreciation cost
Ramping up of the existing units, recently acquired units in Gujarat & Brownfield expansion under implementation
to drive growth
All Businesses to consolidate leadership with commissioning of projects and acquisitions under progress
Positive sentiments coupled with expected policy initiatives by Government should provide impetus
18

Pulp, Fibre & Allied Chemical
VSF 498K TPA Chemicals
Overseas VSF JV Pulp JVs
AV Terrace Bay $ 353K TPA, (40%)
Domsjo $ 255K TPA, (33.3%)
AV Nackawic $ 189K TPA, (45%)
AV Cell $ 126K TPA, (45%)
Grasim Bhiwani
Textiles * 18 Mn. Mtr.
(100%)
UltraTech Cement * (60.25%)
* Subsidiary, $ JV, # Associate
Organizational Structure
Idea Cellular # (4.76%)
Birla Jingwei $ 72K TPA, (26%)
Pulp 70K TPA
Others
Domestic
Overseas 3 Mn. TPA,
(UAE, Bangladesh, Sri Lanka)
12 Composite Plants
12 Split Grinding Units
97 RMC Plants
White Cement & Wall Care Putty
1.4 Mn. TPA
Nagda 162K TPA
Kharach 128K TPA
Harihar 87K TPA
Vilayat 120K TPA
Nagda 270K TPA
Vilayat 182K TPA
19
Epoxy 51K TPA
Caustic
452K TPA
Grey Cement
60.2 Mn. TPA
BCML $ (26%)

UltraTech Cement Plants
UltraTech Grinding Units (G)
UltraTech White Cement Plant
UltraTech Bulk Cement Terminals
UltraTech Putty Plant
Fibre plants
Pulp plant
Chemical plant
Textiles units
Not to scale
T
F
P
C
B
Plant Locations– Grasim & its subsidiaries
Shambhupura
Jawad
Raipur
Malkhed
Jodhpur
Reddipalayam
Bangalore
Bathinda(G)
Hotgi(G)
B
Pipavav
Jafrabad
Magdalla (G) Awarpur
Hirmi Jharsuguda (G)
Durgapur(G)
Tadpatri
Arakonam(G)
Ratnagiri(G)
B Navi Mumbai
B Mangalore
Bharuch F
Nagda F C
Bhiwani T
Harihar F P
Kotputli Dadri Panipat
T Malanpur
Aligarh
Ginigera
F Vilayat
P
P Katni
B
Cochin
20
P
Sewagram Wanakbori
C

Thank You

Grasim Industries Limited
Annexure

Annexure
Consolidated Financial Performance
Standalone Financial Performance
Consolidated and Standalone Profitability
Revenue & PBIDT Chart
VSF Summary
Chemical Summary
Cement Summary

Consolidated Financial Performance
(` Crore)
21
2014-15 2013-14 2014-15 2013-14
Net Sales & Op. Income 8,819.6 8,418.0 5 32,847.4 29,323.3 12
Other Income 109.6 128.0 (14) 539.0 576.3 (6)
PBIDT 1,658.5 1,655.3 - 5,683.4 5,491.0 4
PBIDT Margin (%) 18.6% 19.4% 17.0% 18.4%
Finance Cost 182.6 108.2 69 667.4 447.3 49
Depreciation 417.5 389.2 7 1,563.2 1,457.5 7
PBT 1,058.4 1,157.9 (9) 3,452.8 3,586.2 (4)
Exceptional Item (9.5) - (9.5) -
PBT (After exceptional item) 1,048.9 1,157.9 (9) 3,443.3 3,586.2 (4)
Total Tax 326.2 168.3 94 1,015.9 734.8 38
PAT (Before Minority Share) 722.7 989.6 (27) 2,427.4 2,851.4 (15)
Add: Share in Profit of Associates 44.9 30.2 49 154.2 102.9 50
Less: Minority Share 260.9 340.5 (23) 837.9 882.8 (5)
PAT (After Minority Share) 506.7 679.3 (25) 1,743.8 2,071.5 (16)
Cash Profit (Before Minority Share) 1,502.0 1,553.4 (3) 5,142.7 4,912.5 5
Quarter - 4 %
Change
%
Change
Full Year

Standalone Financial Performance
(` Crore)
22
2014-15 2013-14 2014-15 2013-14
Net Sales & Op. Income 1,733.2 1,548.9 12 6,332.6 5,603.5 13
Other Income 50.7 63.0 (19) 348.1 384.8 (10)
PBIDT 179.9 221.6 (19) 1,013.0 1,246.1 (19)
PBIDT Margin (%) 10.1% 13.8% 15.2% 20.8%
Finance Cost 13.1 10.9 20 39.3 41.5 (5)
Depreciation 84.3 63.5 33 262.5 219.6 20
PBT 82.5 147.2 (44) 711.2 985.0 (28)
Exceptional Item (26.2) - (26.2) -
PBT (After exceptional item) 56.2 147.2 684.9 985.0
Tax Expense 25.2 16.9 49 155.0 89.0 74
PAT 31.0 130.3 (76) 529.9 896.0 (41)
EPS 3.4 14.2 (76) 57.6 97.5 (41)
Cash Profit 166.8 210.7 (21) 973.7 1,204.6 (19)
Quarter 4% Change % Change
Full Year

Profitability Snapshot
# before exceptional / extraordinary gain
23
(` Crore) FY FY FY FY FY FY FY FY
2011-12 2012-13 2013-14 2014-15 2011-12 2012-13 2013-14 2014-15
Net Turnover & Op. Income 4,974 5,255 5,604 6,333 25,244 27,909 29,324 32,847
PBIDT 1,722 1,523 1,246 1,013 6,321 6,543 5,491 5,683
PBIDT Margin (%) 31.7 26.8 20.8 15.2 24.3 22.9 18.4 17.0
Finance Cost 36 39 42 39 314 324 447 667
PBDT 1,686 1,484 1,205 974 6,007 6,219 5,044 5,016
Tax Expenses 365 303 89 155 1,321 1,467 735 1,016
PAT # (After Minority Share) 1,177 1,022 896 556 2,647 2,500 2,072 1,753
EPS (`) # 128.2 111.3 97.5 60.5 288.4 272.3 225.5 190.8
DPS (`) 22.5 22.5 21.0 -- -- -- -- --
ROAvCE (PBIT Basis - Excl. CWIP)(%) 18.6 17.1 12.1 10.5
RONW (%) # 16.7 13.6 10.0 7.8
Interest Cover (x) 36.8 21.3 13.2 13.8 13.4 10.6 9.0 6.8
Standalone Consolidated

Revenue Chart
(` Crore)
24
% % Quarter 3
2014-15 2013-14 Change 2014-15 2013-14 Change 2014-15
4,974 4,714 6 Viscose Staple Fibre 1,405 1,274 10 1,203
1,701 1,075 58 Chemical 429 337 27 443
89 96 Others 22 22 19
(431) (281) Eliminations (Inter Segment) (122) (84) (105)
6,333 5,604 13 Standalone Net Revenue 1,733 1,549 12 1,561
Subsidiaries
24,349 21,652 12 Cement 6,597 6,315 4 5,947
464 453 2 Textiles 121 110 115
2,072 2,025 2 Pulp JVs and Fibre JV (Pro Rata) 501 566 (11) 462
(369) (410) Eliminations (Inter Company)/Others (133) (121) (47)
26,515 23,720 12 Total for Subsidiaries & JVs 7,086 6,869 3 6,477
32,847 29,323 12 Consolidated Net Revenue 8,820 8,418 5 8,038
Full Year `
Quarter 4
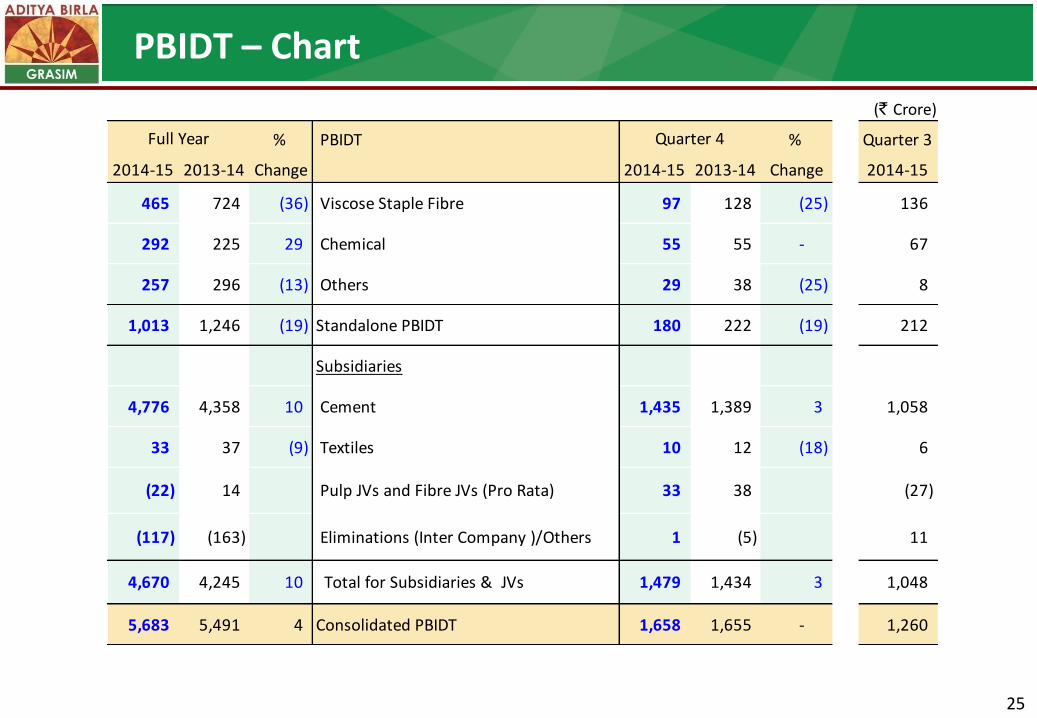
PBIDT – Chart
(` Crore)
25
% PBIDT % Quarter 3
2014-15 2013-14 Change 2014-15 2013-14 Change 2014-15
465 724 (36) Viscose Staple Fibre 97 128 (25) 136
292 225 29 Chemical 55 55 - 67
257 296 (13) Others 29 38 (25) 8
1,013 1,246 (19) Standalone PBIDT 180 222 (19) 212
Subsidiaries
4,776 4,358 10 Cement 1,435 1,389 3 1,058
33 37 (9) Textiles 10 12 (18) 6
(22) 14 Pulp JVs and Fibre JVs (Pro Rata) 33 38 (27)
(117) (163) Eliminations (Inter Company )/Others 1 (5) 11
4,670 4,245 10 Total for Subsidiaries & JVs 1,479 1,434 3 1,048
5,683 5,491 4 Consolidated PBIDT 1,658 1,655 - 1,260
Quarter 4Full Year

Viscose Staple Fibre : Summary
26
* Operational capacity during the period
2014-15 2013-14 2014-15 2013-14
Capacity * TPA 1,17,450 94,444 24 4,33,600 3,75,520 15
Production MT 1,11,341 89,507 24 4,07,952 3,61,012 13
Sales Volumes MT 1,18,486 99,385 19 4,02,802 3,66,978 10
Net Revenue ` Cr. 1,405 1,274 10 4,974 4,714 6
PBIDT ` Cr. 97 128 (25) 465 724 (36)
PBIDT Margin % 6.9% 10.0% -- 9.3% 15.2% --
PBIT ` Cr. 39 89 (56) 305 574 (47)
Capital Employed (Incl. CWIP) ` Cr. 5,282 5,043 5 5,282 5,043 5
ROAvCE (Excl. CWIP) % 3.4% 11.7% -- 10.0% 20.0% --
%
Change
Quarter 4 %
Change
Full Year

Chemical : Summary
27
* Operational capacity during the period
* *
2014-15 2013-14 2014-15 2013-14
Capacity * TPA 1,13,125 1,02,630 10 4,52,500 3,51,790 29
Production MT 1,03,603 86,438 20 4,11,738 3,13,479 31
Sales Volumes MT 1,05,012 86,469 21 4,09,220 3,14,488 30
Net Revenue ` Cr. 429 337 27 1,701 1,075 58
PBIDT ` Cr. 55 55 - 292 225 29
PBIDT Margin % 17.0% 20.9% -- 21.6% 22.5% --
PBIT ` Cr. 31 32 - 198 161 23
Capital Employed (Incl. CWIP) ` Cr. 1,922 1,888 2 1,922 1,888 2
ROAvCE (Excl. CWIP) % 6.9% 8.0% -- 14.5% 14.0% --
Quarter 4 %
Change
%
Change
Full Year

Cement : Summary
$ Includes captive consumption for RMC
$$ Includes captive consumption for value added products
28
2014-15 2013-14 2014-15 2013-14
Grey Cement
Capacity Mn. TPA 15.80 13.87 14 63.15 56.95 11
Production Mn. MT 12.46 12.81 (3) 46.71 43.60 7
Cement Sales Volumes $ Mn. MT 12.52 12.83 (2) 47.09 44.06 7
Clinker Sales Volumes Mn. MT 0.26 0.15 69 1.08 0.60 81
White Cement & Putty
Sales Volumes $$ Lac MT 3.52 3.28 7 12.24 11.41 7
Net Revenue ` Cr. 6,597 6,315 4 24,349 21,652 12
PBIDT ` Cr. 1,435 1,389 3 4,776 4,358 10
PBIDT Margin % 21.6% 21.8% -- 19.3% 19.8% --
PBIT ` Cr. 1,129 1,088 4 3,572 3,219 11
Capital Employed (Incl. CWIP) ` Cr. 33,831 28,977 17 33,831 28,977 17
ROAvCE (Excl. CWIP) % 14.7% 17.3% -- 12.5% 12.8% --
%
Change
%
Change
Quarter 4 Full Year