performance amelioration of fingerprint recognition -...
TRANSCRIPT

Performance Amelioration of
Fingerprint Recognitionby
Li WangB.Eng Software Engineering
Master of Computer Science
Thesis
Submitted for fulfillment of the requirements for the degree of
Doctor of Philosophy (0190)
Faculty of Information Technology
Monash University
Oct, 2014

c© Copyright
by
Li Wang
2014

Declaration
I hereby declare that this thesis contains no material which has been
accepted for the award of any other degree or diploma at any university
or equivalent institution and that, to the best of my knowledge and belief,
this thesis contains no material previously published or written by another
person, except where due reference is made in the text of the thesis.
Li Wang
31 Oct,2014
i

Dedicated to my parents
To my wife
ii

Acknowledgements
I would like to express my deepest appreciation and thanks to my super-
visors Dr. Nandita Bhattacharjee and Dr Maria Indrawan. Their advice on
my research, my life as well as on my career have been priceless. Without
their guidance and persistent help this thesis would not have been possible.
I would particularly like to thank Professor Bala Srinivasan and Profes-
sor Gopal Gupta who have given me precious assistance and suggestions on
my research. Professor Bala Srinivasa is my informal supervisor, and has
done a lot of reversion work of my thesis and given amount of invaluable
feedbacks. I also appreciate the valuable feedbacks offered by Dr. Peter
Tischer who attended my confirmation, mid-candidature review and pre-
submission seminars.
In addition, I would like to thank all faculty staff who have helped me
in my research career at Monash University. I would like to offer my special
thanks to Leeanne Evans who helped me process various applications.
Specially, I would to thank Dr. Noriake Sato for helping me improve my
language skills. I would also than Dr. Jan Miller who did the proofreading
work for me.
Furthermore, I would like to thank my friends and colleagues: Parman,
Nitin, Nevo, Anwar who have helped me a lot during my PhD career.
Finally, I would like to thank all my family members. I owe my deepest
gratitude to my parents for their unconditional support throughout my
degree. My father passed away during my last year of candidature, I wish
him a happy life in heaven. I also wish my mom a happy and healthy life.
Words cannot express how grateful I am to my mother-in law, father-in-law
and my wife. My wife has been extraordinarily tolerant and supportive to
iii

both my life and research.
iv
List of Publications
[1] Wang, L., Bhattacharjee, N., Gupta, G., Srinivasan, B., 2010. Adap-
tive Approach to Fingerprint Image Enhancement. 8th International Con-
ference on Advances in Mobile Computing and Multimedia,42-49, Paris,
France.
[2] Wang, L., Bhattacharjee, N., Srinivasan, B., 2011, A novel technique
for singular point detection based on Poincare Index, Proceedings of the
9th International Conference on Advances in Mobile Computing and Mul-
timedia, 12-18, Ho Chi Minh City, Vietnam.
[3] Wang, L., Bhattacharjee, N., Srinivasan, B., 2012, Fingerprint Ref-
erence Point Detection Based on Local Ridge Orientation Patterns of Fin-
gerprints, 2012 International Joint Conference on Neural Networks, 1-8,
Brisbane, Australia.
[4] Wang, L., Bhattacharjee, N., Srinivasan, B., 2012, A Method for
Fingerprint Alignment and Matching, Proceedings of the 10th International
Conference on Advances in Mobile Computing and Multimedia, 297–301,
Bali, Indonesia.
[5] Wang, L., Srinivasan, B., Bhattacharjee, N., 2011. Security Analysis
and Improvements on WLANs. Journal Of Networks, 6(3), 470-481.
v

Abstract
Fingerprints have been used for personal identification for centuries be-
cause of their uniqueness and consistency over time. Fingerprint recogni-
tion is one of the most popular methods for personal identification due to its
high accuracy, cost efficiency and ease of acquisition. Automated fingerprint
recognition has the advantages of fast processing and high accuracy, however
its performance deeply depends on the quality of the collected fingerprint
images. The matching accuracy of current automatic fingerprint recogni-
tion systems decreases dramatically when the quality of fingerprint images
are poor. For example, a fingerprint image may contain massive noise,
cleaves or inks. In these cases, manual fingerprint recognition achieves bet-
ter matching results than automatic systems. One of the major challenges
in fingerprint recognition is how to improve the performance of an automatic
fingerprint recognition system in terms of reliability and accuracy especially
for low quality images.
The motivation of this research is derived from the raised need for finger-
print recognition techniques with better matching accuracy and reliability.
How to improve the accuracy and reliability of an automatic fingerprint
recognition system when processing low quality fingerprint images is the
major objective of this research work. Because feature extraction and fea-
ture matching are two main components in a fingerprint recognition system,
the above objective could be restated as: (i), to design reliable and accu-
rate feature extraction techniques suitable for low quality images and (ii),
appropriate matching methods or matching metric with high tolerance for
image noise and feature extraction errors.
vi

In order to achieve the above objectives, much effort has been made
to improve the matching accuracy of an automatic fingerprint recognition
system by introducing the following methods: an fingerprint image pre-
processing method in the spatial domain, two different singular point de-
tection approaches, and a new matching metric named binarized minutiae
block for fingerprint matching.
Firstly, we have investigated current fingerprint enhancement techniques.
A typical fingerprint enhancement module is composed of an image pre-
processing stage and a contextual filtering stage. Traditionally, image pre-
processing (or named pixel-wise enhancement) techniques are used to im-
prove the contrast of an image rather than removing noise. In this study,
we found that removing noise and improving the image quality in this stage
enables the subsequent contextual filtering stage to obtain a better clarity
of ridge and valley structure especially for poor quality fingerprint images,
particularly suitable for wet and smudged fingerprint images, based on ex-
perimental observation. Therefore, we proposed an image pre-processing ap-
proach using contrast stretching and power-law transformation techniques
to improve the quality of fingerprint images. The metric goodness index
(which is used to evaluate the image quality) is used to evaluate this method.
The experimental results show that this approach is able to improve the
clarity of ridge and valley structures especially for wet and smudged fin-
gerprints. The average goodness index value obtained from the experiment
is improved by 14% compared to other reported methods. In addition, it
enables the subsequent contextual filtering (e.g. Gabor filtering) stage for
better image enhancement results, and ultimately improve the reliability of
feature extraction (e.g. minutiae extraction).
vii
Secondly, we have investigated feature extraction techniques, especially
singular point detection which is a global feature in a fingerprint. The
performance of current singular point detection techniques is relatively low
for poor quality images (mostly around 90% of correct detection rate, and
much lower for Poincare Index based approaches). As a consequence, it
becomes the major bottle neck for fingerprint recognition techniques which
rely on singular points, such as reference point based fingerprint global
pre-alignment and fingerprint classification. In order to address this is-
sue, we first investigated the popular Poincare Index based approaches.
The Poincare Index technique highly depends on image quality, and it suf-
fers from the problem of a large number of spurious singular points espe-
cially for low quality images. As a consequence, we designed a rule-based
post-proccessing technique to validate and remove spurious singular points.
The experimental results show that the correct detection rate on average is
89.48% on DB1a and DB2a of Fingerprint Verification Competition (FVC)
2002 datasets. These datasets contain fingerprint images with various qual-
ity levels, and are especially suitable for evaluation of fingerprint recognition
algorithms. It is around 3% improvement over other reported Poincare In-
dex based approaches in terms of overall correct detection rate. However,
one limitation of the Poincaree Index technique is that it processes data lo-
cally while singular points are global features, which are easily influenced by
local noise and may cause a number of spurious singular points, especially
for low quality images. Therefore, we have proposed a new singular point
detection method globally over the whole image, based on the analysis of
local ridge orientation maps. In addition, this method is also able to locate
a reference point for arch type fingerprints which is useful for fingerprint
viii

pre-alignment as a reference point as well as for fingerprint classification.
The experimental results show that the correct detection rate on average
is 94.05% on the datasets of FVC 2002 DB1a and DB2a. This experimen-
tal result is superior than any other reported methods in terms of correct
detection rate of singular points.
Finally, we have investigated the current fingerprint matching methods,
and proposed a new matching metric named binarized minutiae block for
fingerprint matching. Current matching methods could be classified as:
minutiae based, correlation based, and other non-minutiae based methods.
Among these methods, correlation and other non-minutiae based methods
have better tolerance to image noise and feature extraction errors than
minutiae based methods. However, minutiae based methods have better
tolerance to non-linear distortion and obtain better matching results on
medium or high quality images. This new metric utilize the minutiae and
its surrounding texture information. Thus, it has high tolerance to image
noise and feature extraction errors as well as non-linear distortion. These
binarized minutiae blocks are normalized to the same minutiae direction for
easy comparison. Then, the local similarities are calculated by the dissim-
ilarities between each pair of binarized minutiae blocks. In addition, four
global similarity calculation methods are designed and implemented using
this matching metric. The experimental results show that this method
achieves overall matching accuracy of 98.24%, 97.87% and 98.19% on the
datasets FVC2002 DB1a, DB2a and FVC2006 DB2a. As a consequence, the
results suggest that using binarized minutiae blocks is an alternative way to
obtain accurate and reliable matching results other than correlation based
(grey scale texture information), minutiae based and other non-minutiae
ix

based methods. Compared to other state-of-the-art matching methods, this
metric achieves better experimental results in terms of matching accuracy
than most reported matching methods on the same testing databases.
In conclusion, this thesis focuses on the research of how to improve
the overall matching accuracy of a fingerprint recognition system even for
low quality images. Several methods have been developed to achieve this
research objective. The experimental results show that these proposed fin-
gerprint recognition techniques are able to improve the recognition accuracy
significantly.
x
Contents
1 Introduction 1
1.1 Overview . . . . . . . . . . . . . . . . . . . . . . . . . . . . . 1
1.2 Issues and Challenges . . . . . . . . . . . . . . . . . . . . . . 3
1.3 Motivations and Objectives . . . . . . . . . . . . . . . . . . 8
1.4 Contributions . . . . . . . . . . . . . . . . . . . . . . . . . . 9
1.5 Organization of Thesis . . . . . . . . . . . . . . . . . . . . . 11
2 Background of Fingerprint Recognition 13
2.1 Fingerprints and Other Biometrics . . . . . . . . . . . . . . 13
2.2 Fingerprint Features . . . . . . . . . . . . . . . . . . . . . . 18
2.2.1 Fingerprint image variations . . . . . . . . . . . . . 21
2.3 Fingerprint Recognition Systems . . . . . . . . . . . . . . . 25
2.4 Components in Feature Extraction and Matching . . . . . . 29
2.4.1 Fingerprint image segmentation . . . . . . . . . . . . 32
2.4.2 Image pre-processing . . . . . . . . . . . . . . . . . . 40
2.4.3 Ridge orientation and frequency estimation . . . . . . 42
2.4.4 Contextual filtering . . . . . . . . . . . . . . . . . . . 46
2.4.5 Singular point detection . . . . . . . . . . . . . . . . 49
2.4.6 Minutiae extraction . . . . . . . . . . . . . . . . . . . 51
i

2.4.7 Fingerprint alignment and matching . . . . . . . . . 55
2.4.7.1 Fingerprint alignment . . . . . . . . . . . . 56
2.4.7.2 Fingerprint matching . . . . . . . . . . . . . 57
2.4.7.3 State of art matching techniques . . . . . . 61
2.5 Matching Metrics to Evaluate a Fingerprint Recognition Sys-
tem . . . . . . . . . . . . . . . . . . . . . . . . . . . . . . . . 63
2.6 Databases for Experiments . . . . . . . . . . . . . . . . . . . 68
2.7 Conclusion . . . . . . . . . . . . . . . . . . . . . . . . . . . . 69
3 Image Pre-processing for Image Quality Enhancement 72
3.1 Overview . . . . . . . . . . . . . . . . . . . . . . . . . . . . . 74
3.2 Proposed algorithm for enhancement of fingerprint images . 75
3.2.1 Power-law transformation and contrast stretching . . 76
3.2.2 Proposed algorithm for fingerprint image enhancement 79
3.2.3 Parameters estimation . . . . . . . . . . . . . . . . . 83
3.2.4 Result of Gabor filtering and binarization . . . . . . 86
3.3 Experimental results . . . . . . . . . . . . . . . . . . . . . . 89
3.4 Conclusion . . . . . . . . . . . . . . . . . . . . . . . . . . . . 92
4 Reliable Singular Point Detection 96
4.1 A Rule Based Post-processing Method for Poincare Index
Based SP Detection . . . . . . . . . . . . . . . . . . . . . . . 98
4.1.1 Poincare Index implementation . . . . . . . . . . . . 98
4.1.2 Validation and selection of detected SPs . . . . . . . 101
4.1.2.1 Segmentation . . . . . . . . . . . . . . . . . 101
4.1.2.2 Post-processing for SPs validation . . . . . . 102
4.1.3 Experimental Results . . . . . . . . . . . . . . . . . . 107
ii
4.1.4 Advantages and disadvantages . . . . . . . . . . . . . 110
4.2 A Method for SP Detection Based on Local Ridge Orienta-
tion . . . . . . . . . . . . . . . . . . . . . . . . . . . . . . . 112
4.2.1 The proposed approach for SP detection . . . . . . . 112
4.2.1.1 Recognize the SP types . . . . . . . . . . . 115
4.2.1.2 Validation of detected SPs . . . . . . . . . . 117
4.2.1.3 Validation of SPs based on patterns of ori-
entation segments . . . . . . . . . . . . . . 118
4.2.1.4 Reference point detection for arch fingerprints121
4.2.2 Experimental Results . . . . . . . . . . . . . . . . . . 123
4.3 Conclusion . . . . . . . . . . . . . . . . . . . . . . . . . . . . 130
5 Fingerprint Matching Using Binarized Minutiae Blocks 132
5.1 Fingerprint Matching based on the Binarized Minutiae Blocks
. . . . . . . . . . . . . . . . . . . . . . . . . . . . . . . . . . 135
5.1.1 Generating fingerprint template . . . . . . . . . . . . 135
5.1.2 Local Minutiae Similarity Calculation . . . . . . . . . 141
5.1.3 Global similarity calculation . . . . . . . . . . . . . . 144
5.1.3.1 Pre-alignment by SP before the matching . 148
5.1.3.2 Minutiae pair validation by exploring the
minutiae interrelationships . . . . . . . . . . 153
5.1.3.2.1 Minutiae pair validation by distance
and angle . . . . . . . . . . . . . . 154
5.1.3.2.2 Matching score calculation after minu-
tiae validation . . . . . . . . . . . . 157
iii

5.1.4 Use the reliable minutiae pairs for alignment before
matching . . . . . . . . . . . . . . . . . . . . . . . . . 158
5.1.4.1 Matching score calculation: based on matched
minutiae number . . . . . . . . . . . . . . . 159
5.1.4.2 Matching score calculation: based on matched
minutiae number and block similarity . . . . 161
5.1.4.3 Using average matching score of N times’
alignments . . . . . . . . . . . . . . . . . . 163
5.2 Experiments . . . . . . . . . . . . . . . . . . . . . . . . . . . 166
5.2.1 Fingerprint matching procedure . . . . . . . . . . . . 166
5.2.2 Experimental environment and matching protocols . 167
5.2.3 Parameter selections . . . . . . . . . . . . . . . . . . 168
5.2.3.1 The influence of chosen block size . . . . . . 169
5.2.4 Experimental results and comparisons . . . . . . . . 170
5.2.4.1 Analysis of decidability index of using BMB 176
5.3 Conclusions . . . . . . . . . . . . . . . . . . . . . . . . . . . 180
6 Conclusion 182
6.1 Research Contributions . . . . . . . . . . . . . . . . . . . . . 183
6.2 Future works . . . . . . . . . . . . . . . . . . . . . . . . . . 186
Appendices 188
A Some Samples of Fingerprint Images in FVC databases 189
iv

List of Figures
1.1 An example of normalization described in [HWJ98]. . . . . . 5
1.2 Features in a fingerprint. Core points and delta points are
two types of singular point. Ridge bifurcation and ending are
two important types of minutiae. . . . . . . . . . . . . . . . 6
2.1 Samples of different biometrics (images from internet). . . . 14
2.2 Three levels of fingerprint features. It shows the features ex-
tracted from level 1 to 3 respectively. The first one is the
orientation map and singular points, the second one shows
two types of minutiae, and the last one shows level 3 fea-
tures.(from [Jai11]) . . . . . . . . . . . . . . . . . . . . . . . 19
2.3 Each row shows two fingerprint images from the same finger
from FVC2002 database. Maio et al. [MMJP09] reported
that these fingers were falsely non-matched by most of the
algorithms submitted to FVC2002. . . . . . . . . . . . . . . 24
2.4 The flowcharts of fingerprint identification and verification
systems (from [SB11]). . . . . . . . . . . . . . . . . . . . . . 26
2.5 A big picture of a fingerprint recognition system. . . . . . . 28
2.6 Different types of fingerprint classified by their global shapes. 29
v

2.7 The procedure of feature extraction and matching in a fin-
gerprint recognition system. . . . . . . . . . . . . . . . . . . 31
2.8 Two segmentation techniques: (a) an example of fingerprint
segmentation by Ratha’s [RCJ95] approach; (b) an example
of fingerprint segmentation by Chen et al.’s [CTCY04] ap-
proach; . . . . . . . . . . . . . . . . . . . . . . . . . . . . . . 33
2.9 Two samples of segmentation using the method in [WBGS10].
The black line surrounding the fingerprint area indicates the
mask boundary. The fingerprint images are from FVC 2002
databases [MMC+02]. . . . . . . . . . . . . . . . . . . . . . 37
2.10 Two examples of latent fingerprint images. . . . . . . . . . . 39
2.11 An example of normalization described in [HWJ98]. . . . . . 41
2.12 The result of local orientation estimation: (a), a fingerprint
image and (b), the plot of ridge orientation. . . . . . . . . . 44
2.13 (a), An oriented window centered at pixel (xi, yj); (b), The
x-signature on the right clearly exhibits five peaks; the four
distances between consecutive peaks are averaged to deter-
mine the local ridge frequency (from [HWJ98]) . . . . . . . . 44
2.14 Graphical representation (lateral view and top view) of the
Gabor filter defined by the parameters θ= 135 degrees, f =
1/5, and σx= σy = 3 (from [MMJP09]). . . . . . . . . . . . . 48
2.15 An example of fingerprint image processing results by Gabor
filtering: (a) the original fingerprint image is from FVC 2002
database; (b) the processed fingerprint image after Gabor
filtering; and (c) is the binarized image. Note the above
images are segmented, and σx = σy = 2. . . . . . . . . . . . 48
vi

2.16 A sample fingerprint binarization and thinning process. (a) A
fingerprint grey-scale image(from FVC2002 DB1a database);
(b) the image obtained after binarization of the image in (a);
(c) skeleton image obtained after a thinning of the image in
(b). . . . . . . . . . . . . . . . . . . . . . . . . . . . . . . . . 52
2.17 Minutiae detection by cross number, when: (a), cn(p) =2,
the pixel is in a normal ridge line; (b), cn(p) = 1, the pixel is
a ridge ending; (c), cn(p) = 3, the pixel is a ridge bifurcation. 53
2.18 Fingerprint minutiae in run representation: (a), input grey
fingerprint image; (b), ridge ending in horizontal ridge de-
tected by vertical run; (c), ridge bifurcation in vertical ridge
detected by horizontal run; (d), ridge ending in vertical ridge
detected by horizontal run; and (e), ridge bifurcation in hor-
izontal ridge detected by vertical run.(from [SHC06]) . . . . 54
2.19 Examples of false minutiae (black dots).(from [ZT07]) . . . . 55
2.20 Minutiae cylinder code representation associates a local struc-
ture with each minutiae. This structure encodes spatial and
directional relationships between the minutiae and its (fixed-
radius) neighborhood and can be conveniently represented as
a cylinder whose base and height are related to the spatial
and directional information, respectively.(from [CFM10]) . . 63
2.21 Matching score distributions between impostor profile (inter-
class) and genuine user profile (intra-class). If the matching
scores are greater than a preassigned threshold t, then we call
these templates and query templates matched (from [SB11]). 65
vii

2.22 The receiver operating characteristic (ROC) curve of two fin-
gerprint recognition systems. . . . . . . . . . . . . . . . . . . 67
3.2 Plots of power-law transformation with different values of γ. 78
3.3 Plots of typical contrast stretching, where r denotes the input
grey levels (the x -axis), and s denotes the output grey levels
(the y-axis) . . . . . . . . . . . . . . . . . . . . . . . . . . . 79
3.4 Histogram of fingerprint image from Figure 3.1a. . . . . . . . 80
3.5 Plot of equation 3.3 with γ < 1. . . . . . . . . . . . . . . . 82
3.6 Resultant images after being processed by this method: (a),
original image; (b), the result after the segmentation and the
image pre-processing approach with r1 = s1 = 50, r2 = 160
and γ = 1. . . . . . . . . . . . . . . . . . . . . . . . . . . . 83
3.7 Resultant images after being processed by our method by
automated parameter selection. (a) is the original fingerprint
image, and (b) is the resultant image. . . . . . . . . . . . . . 86
3.8 Gabor filtering and binarization of the sample fingerprint im-
age in Figure 3.7b. . . . . . . . . . . . . . . . . . . . . . . . 87
3.9 Gabor filtering and binarization of a noisy and smudged sam-
ple fingerprint after applying our image pre-processing method:
(a), the original image with corrupted fingerprint areas; (b),
the resultant image after applying our image pre-processing
method; (c), Gabor filtering and binarization without the
proposed image pre-processing method; d), binarized image
with our image pre-processing methods. The red squares
show the improved areas by our method. . . . . . . . . . . . 88
viii

3.1 An example of fingerprint image processing results using the
Gabor filtering and binarization technique: (a), original fin-
gerprint image is from FVC 2002 database; (b), the processed
fingerprint after Gabor filtering and binarization. The clar-
ity of the ridge and valley structure is not high in this image,
especially the area inside the red square. . . . . . . . . . . . 94
3.10 Two groups of samples, the left column shows the noisy
original images, the middle column shows the binarized im-
ages without applying our fingerprint image pre-processing
method and the right column shows the resultant images af-
ter our fingerprint image pre-processing method. . . . . . . . 95
4.1 The local ridge orientation of a fingerprint image: (a), the
original image; (b), plot of orientation of (a); and (c): the
result of SPs detection without smoothing of gradient field
and other validation techniques (red circles denote core points
and blue triangles denote delta points). . . . . . . . . . . . . 99
4.2 The orientation map of a: (a), core point; (b), delta point
and (c), normal ridges. (d) is the designed four directions to
calculate the Poincare Index value. . . . . . . . . . . . . . . 100
4.3 Mask generation of Figure 4.1a, and the black lines indicate
the boundary of the mask. . . . . . . . . . . . . . . . . . . . 101
4.4 The orientation field of Figure 4.1a) where the circle indi-
cates the SP areas. (a), the original orientation field; (b),
the smoothed orientation field with θ = 24. . . . . . . . . . 103
ix

4.5 The results of the proposed approach: (a) is the result of
Figure 4.1a ; (b), (c), (d), (e) and (f) are five selected poor
quality images from the FVC 2002 databases. . . . . . . . . 107
4.6 Examples of missed or false detection of SPs. . . . . . . . . 111
4.7 An example of local ridge orientation field transformation
into four local ridge orientation values. The blue dash lines
show the directions of ridges. (a), the original image; (b), the
local ridge orientation field; (c) and (d) are the orientation
map after the orientation value transformation. The values
of orientation lie in the range of [0, π) mapping to the color
from white (0) to black (π).The orientation map after being
segmented into four values. The orientation values of black,
dark grey, light grey and white segments are 0, π/4, π/2 and
3π/4 respectively. . . . . . . . . . . . . . . . . . . . . . . . . 114
4.8 Detected reference points plotted in the (a) original image
and (b) orientation map (marked as a star). . . . . . . . . . 115
4.9 Patterns of a core and delta point in the orientation map. . . 116
4.10 The reference points are classified (note we use a red square
to mark the secondary core point). (a), the marked singular
points in the original image; (b), the marked singular points
in the segmented local ridge orientation map. . . . . . . . . 117
4.11 If the detected SPs are outside the mask, then these SPs are
removed. . . . . . . . . . . . . . . . . . . . . . . . . . . . . . 118
4.12 The example of pairing the reference points: (a), remove the
unreliable SP pairs; (b), detected reference core point. . . . . 120
x

4.13 An example of (a), an arch fingerprint and (b), its orientation
map. . . . . . . . . . . . . . . . . . . . . . . . . . . . . . . . 122
4.14 Two examples of reference point detection for arch type fin-
gerprints. These two fingerprints are a pair of intra-class
fingerprints (from the same finger). . . . . . . . . . . . . . . 123
4.15 Two samples of SP detection: (a) is considered as correctly
detected while (b) is considered as falsely detected. . . . . . 124
4.16 Comparison of results between the Poincare Index based ap-
proach and our approach. The first column is the Poincare In-
dex based approach, and the second column is our approach.
. . . . . . . . . . . . . . . . . . . . . . . . . . . . . . . . . . 126
4.16 Comparison of results between the Poincare Index based ap-
proach and our approach. The first column is Poincare Index
based approach, and the second column is our approach. . . 127
5.1 Designed fingerprint template generation steps. . . . . . . . 138
5.2 Some examples of partial fingerprints in FVC 2002 database
DBa1 that having no delta points. On an average, there is
approximately one fingerprint image having no delta point
in each intraclass group based on the observation (total 100
groups in this database). . . . . . . . . . . . . . . . . . . . . 140
5.3 Comparisons between the minutiae blocks. . . . . . . . . . . 143
xi

5.4 An example of using minutiae interrelationships for finger-
print matching proposed by Kovacs-Vajna et al. [KV00].
Each triangle indicates the interrelationships among three
selected minutiae points. Two similar triangles from a pair
of fingerprint may be a match for the minutiae points com-
posing the triangles. . . . . . . . . . . . . . . . . . . . . . . 146
5.5 Align two fingerprint images using their core points. Though
these two images ((a) and (b)) are aligned by their refer-
ence points, the rotation angles of these two fingerprints are
different as shown in (c). A further alignment needs to be
conducted. . . . . . . . . . . . . . . . . . . . . . . . . . . . . 149
5.6 Pairing the minutiae points after the coarse alignment. . . . 150
5.7 Overlapping areas after alignment. . . . . . . . . . . . . . . 151
5.8 Experimental results of FVC2002 DB1a plotted using ROC
curve of GAR vs. FMR. (GAR means Genuine Acceptance
Rate, GAR = 1-FNMR. . . . . . . . . . . . . . . . . . . . . 152
5.9 The ROC curve of the experimental results of the FVC2002
DB1a database is shown in the figure. The blue curve uses
equation 5.7 to calculate the matching scores and the red
curve uses equation 5.2. The parameter values are: blocksize
for minutiae pairing: 60 x 60; selection of threshold values:
Td = 15 pixels and Tθ = 15 degrees. . . . . . . . . . . . . . . 158
xii

5.10 FVC2002 DB1a results using the above matching score cal-
culation method ROC curve. This curve shows the result
of using the top three minutiae pairs with lowest Hamming
distance value for alignment, then the matching score is cal-
culated afterwards using equation 5.2. The parameter values
are: blocksize for minutiae pairing: 60 x 60; threshold of
distance: Td = 15 pixels and threshold of angle: Tθ = 15
degrees. . . . . . . . . . . . . . . . . . . . . . . . . . . . . . 160
5.11 The ROC curve of FVC2002 DB1a results using the above
matching score calculation method. This curve shows the
result of using the top three minutiae pairs with the lowest
Hamming distance value for alignment, then the matching
score is calculated afterwards. The parameter values are:
blocksize for minutiae pairing: 60*60; blocksize for matching:
60*60; threshold of distance: Td = 15 pixels and threshold of
angle: Tθ = 15 degrees. . . . . . . . . . . . . . . . . . . . . . 162
5.12 Using the average matching score after the alignment using
the five (N=5) most reliable minutiae pairs. The blue and red
curves use equations 5.2 and 5.7 to calculating the matching
score respectively. . . . . . . . . . . . . . . . . . . . . . . . . 164
5.13 (a), flowchart of the matching process of this method. (b),
four global similarity score calculation methods . . . . . . . 165
5.14 The implemented fingerprint matching procedure. . . . . . . 166
5.15 The result comparisons using different block sizes for minu-
tiae pair candidate generation using method M3. FVC2002
DB1a database is used for this experiment. . . . . . . . . . . 169
xiii

5.16 Experimental results performed on FVC2002 DB1a database
using the above four methods. . . . . . . . . . . . . . . . . . 174
5.17 Experimental results performed on FVC2002 DB2a database
using the above four methods. . . . . . . . . . . . . . . . . . 175
5.18 Experimental results performed on FVC2006 DB2a database
using the above four methods. . . . . . . . . . . . . . . . . . 175
5.19 Distribution of matching score of FVC 2002 DB1a dataset
using global similarity calculation method M2. The decid-
ability index of (a) and (b) is 3.13 and 4.46. respectively. . . 178
A.1 Samples of good quality fingerprint images . . . . . . . . . . 190
A.2 Samples of poor quality fingerprint images . . . . . . . . . . 191
xiv

List of Tables
2.1 Comparison of different biometric techniques [PPJ03, JRP04]. 17
2.2 Fingerprint features and their description. . . . . . . . . . . 20
2.3 The advantages and disadvantages of three categories of match-
ing methods . . . . . . . . . . . . . . . . . . . . . . . . . . . 61
2.4 The specifications of the FVC databases used in this thesis.
In the column of image numbers, the first number indicates
the number of fingerprint groups in which the fingerprints are
from the same finger, and the second number indicates the
number of fingerprint images in each group. . . . . . . . . . 69
3.1 Variables for parameters estimation. . . . . . . . . . . . . . . 84
3.2 Estimation of parameters in equation 3.3. . . . . . . . . . . . 85
3.4 Comparisons between other approaches and our proposed ap-
proach . . . . . . . . . . . . . . . . . . . . . . . . . . . . . . 91
3.3 Comparison of the GI results without and with our method
respectively, based on Gabor filtering techniques. . . . . . . 92
4.1 The specifications of FVC 2002 DB1a and DB2a databases . 108
4.2 The results of the approach on databases FVC 2002 DB1a
and DB2a . . . . . . . . . . . . . . . . . . . . . . . . . . . . 109
xv
4.3 Experimental results comparison with other reported Poincare
Index methods. . . . . . . . . . . . . . . . . . . . . . . . . . 110
4.4 The results of the approach on database FVC 2002 DB1a and
DB2a databases . . . . . . . . . . . . . . . . . . . . . . . . . 128
4.5 Comparisons with other approaches . . . . . . . . . . . . . . 129
5.1 A generated minutiae sample template. . . . . . . . . . . . . 141
5.2 Generated minutiae pair candidate table. K is the total num-
ber of minutiae pair candidates. . . . . . . . . . . . . . . . . 144
5.3 Parameters may be used for minutiae validation. The vari-
able K refers to the total number of minutiae pair candidates
as shown in Table 5.1 . . . . . . . . . . . . . . . . . . . . . 154
5.4 Generated validation table. . . . . . . . . . . . . . . . . . . . 156
5.5 Parameter value selections. . . . . . . . . . . . . . . . . . . . 168
5.6 Comparisons with other reported matching results. . . . . . 171
xvi

Chapter 1
Introduction
1.1 Overview
Fingerprints have been used for personal identification since ancient times.
The earliest history records show that fingerprints were used as signatures
in ancient Babylon in the second millennium BC [Ast07]. Even the ancients
had realized the uniqueness of fingerprints. But the discussion of using fin-
gerprints for personal identification was started by Dr. Henry Faulds in
1880 [Bar13], about 3000 years later, after the first use of fingerprints in
human history. In the modern era, the first computer data based auto-
mated fingerprint identification system was developed by Federal Bureau
of Investigation (FBI) in 1980 [Bar13]. For now, fingerprint recognition
systems have become one of the most popular biometric systems used in
both government and civilian applications, including law enforcement, bor-
der control, forensics, security facility access and employment background
checks.
1

Unlike traditional authentication and identification systems, fingerprint
and other biometric recognition techniques rely on physiological character-
istics (who you are) instead of smart card, photo ID (what you have) and/or
passwords (what you know). Using fingerprints or other biometrics as sup-
plements to traditional authentication and identification systems is one of
the solutions to identity fraud. Identity fraud has become a serious social
problem in the last ten years. The Australian Bureau of Statistics reported
that personal identity fraud cost Australia AUD$1.4 billion from 2007 to
October, 2010 [Sta12].
With the increasing demand of fingerprint recognition systems, finger-
print recognition techniques have been developed rapidly since the first
introduction of commercial fingerprint recognition systems in the 1990s
[LL03]. Although current fingerprint techniques are mature and can sat-
isfy people’s ordinary needs of personal identification, the accuracy of this
technique still needs to be improved to a higher level. That is because
the quality of scanned fingerprint images may be influenced by many fac-
tors such as displacement, distortion, and the conditions of fingers. For
example, wet fingers may produce merging of ridges while dry ones may
produce discontinuities of ridges. These inevitable high variations of intra-
class fingerprints (refers to fingerprints from the same finger) cause difficul-
ties in achieving high accuracy of automatic fingerprint recognition systems.
In the Fingerprint Verification Competition 2002 (FVC2002), Maio et al.
[MMC+02] reported that typically, 20% of the database is responsible for
about 80% of the matching errors of intra-class fingerprint matchings in
the FVC2002 database. Another example is the 2004 Madrid train bomb-
ings. In this case, Brandon Mayfield, an American attorney, was wrongfully
2

identified via fingerprints by FBI. However, these fingerprints actually be-
longed to an Algerian national, Ouhnane Daoud. The FBI stated that ”this
identification was based on an image of substandard quality, which was
particularly problematic” and caused the false identification [Ley04]. This
wrong identification costs the FBI US$2 millions as compensation for the
loss of reputation to Brandon Mayfield [SF06]. Therefore, accurate and re-
liable fingerprint recognition techniques are important to avoid or reduce
such matching errors.
To sum up, how to improve the overall performance of fingerprint recog-
nition systems is still a challenging task. The next section introduces the
issues and challenges to minimize the intra-class fingerprint variance and
improve the performance of fingerprint recognition techniques.
1.2 Issues and Challenges
One of the biggest challenges of fingerprint recognition is the high vari-
ance found between intra-class fingerprints. This variance is caused by
several factors, including: (a) displacement or rotation between different
acquisitions; (b) partial overlap, especially in sensors of small area; (c) skin
conditions, due to permanent or temporary factors (cuts, dirt, humidity,
etc.); (d) noise in the sensor (for example, residues from previous acquisi-
tions); and (e) nonlinear distortion due to skin plasticity and differences in
pressure against the sensor [MMJP09]. Fingerprint matching remains as a
challenging pattern recognition problem due to the difficulty in matching
fingerprints affected by one or several of the above mentioned factors.
3

In the literature, much effort has been devoted to the challenge of de-
veloping fingerprint recognition techniques to minimize the intra-class vari-
ances and improve the overall performance. These techniques include: (i)
image enhancement methods; (ii) reliable feature extraction methods, and
(iii) reliable feature matching methods.
The image enhancement techniques could be classified into two sub-
classes, which are image pre-processing techniques and contextual filtering
techniques. The purpose of the above two types of techniques are differ-
ent. The image pre-processing techniques (also named pixel-wise enhance-
ment) aim to improve the contrast of the image and uniformly distribute
the intensity values into selected ranges. These techniques act as an initial
processing stage before a more sophisticated image enhancement algorithm.
There are many pixel-wise enhancement techniques which have been used in
fingerprint recognition systems including histogram equalization [WCT98],
Wiener filtering [GAKD00], normalization [HWJ98], adaptive normalization
[KP02], and a method based on the analysis of finger skin profile [SG06]. An
example of a normalization result is shown in Figure 1.1. On the other hand,
the contextual filtering techniques aim to remove the noise and enhance the
clarity of ridge and valley structures. These techniques include Gabor filter
[HWJ98, LB09, GAKD00, JPLK06], log-Gabor filter [WLHF08], directional
Fourier domain filter [SMM94], directional median filter [WSG04], curved
Gabor filter [Got12b, Got12a] and oriented diffusion filtering techniques
[GS12]. Current research focuses more on contextual filtering techniques,
because they can significantly enhance the fingerprint images. However, in
our study, we found that removing a certain amount of noise (e.g. Gaus-
sian noise and other non-uniform noise) in the image pre-processing stage is
4

able to obtain a better processing result in the subsequent contextual filter-
ing stage. Therefore, designing a fingerprint image pre-processing method
which enables successive sophisticated contextual filtering (e.g. Gabor filter-
ing) to perform with improved results and enhanced feature (e.g. minutiae)
extraction is a challenge in fingerprint recognition.
(a) (b)
Figure 1.1: An example of normalization described in [HWJ98].
For feature extraction methods, the local ridge orientation, minutiae and
singular points are three major features which are important to fingerprint
recognition (see Figure 1.2). Local ridge orientation indicates the direction
of ridge lines. Minutiae points are the local ridge characteristics including
ridge ending and ridge bifurcation as shown in Figure 1.2. The singular
points indicate the global structure of ridge and valley lines. There are
two types which are core and delta points (’U’ shape like and ’Y’ shape
like as shown in Figure 1.2). Among the above features, reliable singular
point detection is a challenge in fingerprint recognition. The performance
of current singular point detection techniques is relatively low with about a
5

Figure 1.2: Features in a fingerprint. Core points and delta points are twotypes of singular point. Ridge bifurcation and ending are two importanttypes of minutiae.
80 92% correct detection rate according to the experimental results reported
in current research (e.g. [WYY11, OWT+08, LML13]). As a consequence,
it becomes the major bottle neck for other fingerprint techniques which rely
on singular points, such as fingerprint classification and reference points
based fingerprint global pre-alignment. In order to improve the singular
point detection accuracy, much research has been done. The most popu-
lar approach is based on the Poincare Index which was first proposed by
Kawagoe and Tojo [KT84]. It is a simple and effective approach to de-
tect the singular points. However, it is well recognized that the accuracy
of this approach highly depends on the quality of fingerprint images. For
low quality fingerprint images, this approach can generate a large num-
ber of spurious singular points [MMJP09]. Several improved approaches
have been proposed to overcome the problem of spurious singular points
6

in recent years [KJ96, WLN07, ZGZ07, BLE09]. Besides Poincare Index
based methods, some other approaches have been designed such as detect-
ing singular points by reliability/coherence [CLMM99, KCH12], a zero-pole
model [SM93][CEMM00] [FLW00] and complex filtering [NB05]. However,
the correct detection rates of singular points is still low, the best result is
92.6% reported by Ravinde et al. [KCH12]. Therefore, designing a reliable
singular point detection method is a challenge in fingerprint recognition.
For fingerprint matching techniques, they could be classified into minu-
tiae based [BDNB06, LXL04, OR04, TB03, SHFD07, CMMS09, CFM10],
correlation based [LELJSM07, KAN08, LTG07] and other non-minutiae
based or hybrid methods [CCK11] in terms of features used for match-
ing. Among these methods, correlation, ridge and other non-minutiae
based methods have better tolerance to image noise than minutiae based
methods. This is because these methods do not need to extract minutiae
which is highly influenced by image quality levels. However, minutiae based
methods obtain better matching results for medium or high quality images
[MMJP09]. On the other hand, fingerprint matching techniques could also
be classified into global pre-alignment and local alignment (also called align-
ment free in some papers) in terms of fingerprint alignment types. Global
pre-alignment methods normally use the singular points, or/and some minu-
tiae points as reference points. The thought of global pre-alignment is that
if two fingerprints are pre-aligned before the matching, then the following
matching stage becomes a simple feature (e.g. minutiae and texture infor-
mation) comparison problem. These methods are mainly used in correlation
and non-minutiae methods (e.g. [YA06]), but also used in some minutiae
based or hybrid methods (e.g. [ZYZ05]). Local alignment or alignment
7

free methods are mostly used in minutiae based matching methods (e.g.
[CFM10, FFCS06]). These methods exploit the local interrelations between
minutiae points and match two fingerprints by the similarities of local in-
terrelations. Moreover, hybrid alignment methods have been researched as
well in order to improve the alignment accuracy (e.g. [JY00]). Regard-
less of which matching techniques used, the ultimate goal is to minimize
the intra-class variance and inter-class similarity (fingerprints of different
fingers may sometimes appear quite similar). Large intra-class variance in
different acquisitions of the same finger (e.g. displacement, rotation, par-
tial overlap, noise non-linear distortion) makes the fingerprint matching a
difficult problem [MMJP09]. Therefore, reliable fingerprint matching which
is accurate and has a high tolerance to noise and feature extraction error is
a challenging problem in fingerprint recognition.
1.3 Motivations and Objectives
The motivation of our research is derived from the raised need of a better
overall performance (matching accuracy) of fingerprint recognition systems.
Cappelli et al. [CMM+06] reported that the average error rate in the 2006
Fingerprint Verification Competition is 4.74%. That means there are about
one false match/non-match error in 20 comparisons. For an attacker (for
example, Marvin), if he tries 20 times using brute force attacks, it is pos-
sible that he can fool the system once on an average. In a scenario of an
airport with daily flow of 100,000 passengers, there are about 4740 passen-
gers who would not be verified by current fingerprint verification systems.
Additionally, in the case of an identification system, if the system database
8

contains 100,000 templates, and there are about 4740 users who are falsely
identified as candidates for each identification. Therefore, the demand for
an accurate fingerprint recognition system is urgent especially when the uses
of fingerprint recognition systems are widely accepted nowadays.
The major objective of our research is to improve the overall performance
of a fingerprint recognition system in terms of matching accuracy. More
specifically, to address the three challenges described in the previous section
are our objectives. These objectives are summarized as:
• Design a fingerprint image pre-processing method which facilitates the
successive contextual filtering enhancement.
• Design a reliable singular point detection method which is able to ob-
tain high correct detection rate of singular points even for low quality
images.
• Design a reliable fingerprint matching method which is accurate and
has a high tolerance to noise and feature extraction errors.
1.4 Contributions
Contributions address three problems in fingerprint recognition to improve
the performance of feature extraction and matching, as well as the overall
performance of a fingerprint recognition system. The major contributions
of this research are listed as below:
Firstly, we have investigated current fingerprint enhancement techniques.
A typical fingerprint enhancement module is composed of an image pre-
processing stage and a contextual filtering stage. Traditionally, image pre-
9

processing (also named pixel-wise enhancement) techniques are used to im-
prove the contrast of an image rather than removing noise. In this study, we
found that removing certain amount of noise in this stage enables obtain-
ing a better processing result in the subsequent contextual filtering stage.
Therefore, we proposed an image pre-processing approach using contrast
stretching and power-law transformation techniques with automatic param-
eter selections to facilitate the successive sophisticated contextual filtering
(e.g. Gabor filtering) for better enhancement results and feature (e.g. minu-
tiae) extraction. The experimental results suggest that this method is able
to significantly remove noise and improve the ridge and valley structure
especially for wet and smudged fingerprint images.
Secondly, we have focused on the studies of feature extraction techniques
especially singular point detection. In order to address this issue, we initially
investigated the popular Poincaree Index based approach. This technique
highly depends on the image quality, and it suffers from the problem of a
large number of spurious singular points. As a consequence, we designed
a rule-based post-proccessing technique to validate and remove spurious
singular points. However, one limitation of Poincaree Index technique is
that it processes data locally while singular points are global features, which
is easier to be influenced by local noise and may cause a number of spurious
singular points. Therefore, we have designed a new singular point detection
method globally over the whole image based on the analysis of local ridge
orientation maps. In addition, this method is able to locate a reference point
for arch type fingerprints. The experimental results show that the correct
detection rate is 94.05% on DB1a and DB2a of Fingerprint Verification
Competition 2002 datasets. The results are better than any other reported
10

methods on the same testing datasets.
Finally, we have investigated the state-of-the-art fingerprint matching
methods, and proposed a new matching metric using minutiae points and
their surrounding texture information. Four global similarity score cal-
culation methods are developed and implemented to evaluate this match-
ing metric. The experimental results suggest that using binarized minu-
tiae blocks as a metric is an alternative way to obtain accurate and re-
liable matching results besides correlation based (grey scale texture in-
formation), minutiae based and other non-minutiae based methods. The
experimental results show that this method achieves overall matching ac-
curacy of 98.24%, 97.87% and 98.19% on the datasets FVC2002 DB1a,
DB2a and FVC2006 DB2a. The experimental results also suggest that it
is superior than most state-of-the-art matching methods (e.g. methods in
[WSOA13, LN06, GYZZ11, WSOA13]) in terms of matching accuracy.
The research activities carried out during the Ph.D., led to publication
of the following scientific papers: [WBGS10, WBS11, WBS12b, WBS12a].
1.5 Organization of Thesis
The rest of the thesis is organized as follows:
• Chapter 2: this chapter will introduce the background of the finger-
print recognition and the challenges to design an accurate fingerprint
recognition system. A fingerprint recognition system consists of many
parts. We will describe each stage of the fingerprint recognition system
in detail. Besides, the evaluation metrics and fingerprint databases
used in the experiments, are also introduced.
11

• Chapter 3: this chapter introduces our image pre-processing method.
Image pre-processing is a stage in fingerprint recognition aiming to
pre-process the image to obtain better clarity and remove noise for
subsequent stages. The proposed method uses power-law transforma-
tion and contrast stretching techniques to process the original image.
The experimental results are also discussed in this chapter.
• Chapter 4: this chapter introduces two methods of singular point de-
tection. The first method is the Poincare Index based singular point
detection. A post-processing method is developed to validate singu-
lar points. Furthermore, in order to overcome the limitations of this
method, another singular point detection method is developed which
is based on the analysis of the local ridge orientation patterns.
• Chapter 5: this chapter will introduce a new metric for matching.
This chapter first stresses on the fingerprint template generation, in
which a new metric named binarized minutiae block is generated.
Then four different global similarity calculation methods are designed
to calculate the final matching score between two fingerprints. A
comparison between the experimental result and other reported results
and a discussion are also provided.
• Chapter 6: this chapter includes the conclusion of this thesis and
future work.
12

Chapter 2
Background of Fingerprint
Recognition
2.1 Fingerprints and Other Biometrics
Biometrics consists of methods for uniquely recognizing human based upon
one or more intrinsic physical or behavioral traits [Wik14a]. Biometrics
techniques include iris recognition, fingerprint recognition, face recognition
and other recognition methods (e.g. voice and handwriting recognition).
Figure 2.1 shows six biometrics used currently which are fingerprint, iris,
voice, deoxyribonucleic acid (DNA), face and palmprint.
Among the biometrics used currently, fingerprint recognition is one of
the most widely used personal identification technique for its efficiency, ef-
fectiveness and economy [MMJP09]. Face, voice and handwriting recog-
nitions have the limitations of low accuracy compared to fingerprint and
iris recognition. Both iris and fingerprint recognitions are favored biomet-
rics because of their high accuracy, but iris is not as widely adopted as
13

fingerprint recognition in daily commercial systems due to the concerns of
deployment difficulties and costs. That is because iris recognition systems
cost much more than fingerprint recognition system in terms of data acqui-
sition equipment prices.
(a) Fingerprint (b) Iris (c) Voice wave
(d) DNA (e) Face geometry (f) Palmprint
Figure 2.1: Samples of different biometrics (images from internet).
Different biometrics techniques may be suitable to different information
systems for security enhancement or/and authentication/identification pur-
poses. However, all biometrics need to fulfill the common requirements
to satisfy the above purposes. Prabhakar et al. [PPJ03] and Jain et al.
[JRP04, MMJP09] have introduced seven biometric characteristics which a
biometric system should satisfy:
14

• Universality: Every person or most people should have this biomet-
ric characteristic. Most biometric characteristics used currently fulfill
this requirement. However, there is a very small chance that some
people are not suitable for one or several types of biometric recogni-
tions such as blind, dumb, people with no fingerprints, etc.
• Distinctiveness: This biometric characteristic should be unique for
any two different individuals. In other words, any two fingerprints
from two people should be different.
• Permanence: This biometric characteristic should be consistent through-
out the life of an individual. Not all biometrics completely fulfill this
requirement. For example, the voice of a person changes as one grows
older. Besides, the voice also changes when a person suffers some kind
of illnesses like cold and flu. Thus voice recognition requires people
to update their voice data frequently to obtain an accurate matching
result.
• Collectability: The biometric characteristic should be able to be
easily collected quantitatively. The cost of collecting and processing
biometric data of different types of biometrics varies. For example,
the cost of using DNA recognition is much higher (reported about
AUD$250-300 per test in Australia in [DNA14]) than using other rec-
ognized biometrics. The cost of fingerprint recognition is relatively
lower compared to biometrics.
• Performance: The biometric system based on this characteristic
should have satisfactory accuracy and running speed. The perfor-
15

mance mainly depends on the complexity and uniqueness of the bio-
metric features.
• Acceptability: Individuals are willing to accept this biometric method
(e.g. collecting fingerprint and iris)in daily life. This involves the
problems of complexities of data acquisition and sensitiveness of the
biometric data. For example, people may prefer fingerprint and face
recognitions to DNA recognition for a computer authentication sys-
tem.
• Circumvention: It refers to the potential of impersonation by other
attackers. An impostor could use fake biometric data to attack bio-
metrics recognition systems. For example, voice can be recorded by
any device (mobile phones, computers, etc.) with a voice recorder.
Besides, 2-D face images, fake fingerprints, fake iris contacts may be
used by an impostor to impersonate other genuine users.
Table 2.1 summarizes the comparisons of different biometrics based on
the characteristics introduced by Prabhakar et al. [PPJ03]. From the table,
we can see that fingerprint satisfies most of the requirements of these char-
acteristics. This is the fundamental reason why fingerprint is more popular
than other biometrics. For example, iris recognition is also one of the widely
used biometric techniques. But Iris implementations cost more than finger-
print implementations (mostly due to the iris image capture devices). Thus
more applications adopt fingerprint recognition techniques. A vivid example
is that fingerprint recognition has been used for authentications in laptops
(e.g. Lenovo Thinkpad series) and mobile devices (e.g. Iphone 5s), but iris
techniques have not been implemented in these or similar systems. Other
16

biometrics also suffer from some disadvantages in practice. Voices could be
easily recorded, and they may change according to the health conditions.
Taking photos of faces is a simple task, and these 2-D face photos could be
used to impersonate genuine users. The cost of DNA identification is much
higher than using other biometrics. Palmprints are good supplements to
fingerprints in a biometric system, but capturing a whole palmprint means
that the size of the capture devices has to be much larger than fingerprint
capture devices. Thus palmprint techniques are not suitable to those bio-
metric systems implemented in small devices. Above all, the fingerprint is
most balanced biometric satisfying all the seven requirements among those
biometrics listed on Table 2.1.
Table 2.1: Comparison of different biometric techniques [PPJ03, JRP04].
Bio
metric
Un
iversa
lity
Distin
ctiven
ess
Perm
an
ence
Perfo
rmance
Acce
pta
bility
Circu
mventio
n
Colle
ctability
Fingerprint High High High High High Low Medium
Iris High High High High High Low High
Voice High Low Low Low High Medium High
DNA High High High High Low Low High
Face High Low Medium Low High Medium Medium
Palmprint Medium High Medium High High Low Medium
17

2.2 Fingerprint Features
In section 1.2, we briefly listed several important fingerprint features which
could be used for fingerprint matching including minutiae and singular
points.
Specifically, the Committee to Define an Extended Fingerprint Feature
Set (CDEFFS)[CDE09] defines three levels of fingerprint features:
• Level 1 features: friction ridge flow and general morphological infor-
mation. Level 1 features include ridge flow, ridge orientation, core
points and delta points. Level 1 features could be used for finger-
print classifications. In this thesis, level 1 features also refer to global
features.
• Level 2 features: individual friction ridge paths and friction ridge
events, e.g., bifurcations, ending. Level-2 features include minutiae
and the interrelationships between minutiae.
• Level 3 features: friction ridge dimensional attributes, e.g., edge shapes,
and pores.
Figure 2.2 shows the examples of level 1, 2 and 3 features. Table 2.2 lists
fingerprint feature types and their descriptions. Traditionally, level 1 fea-
tures could be used for fingerprint classification, and combining with level
2 features could be used for fingerprint matching. Level 3 features have
gained researchers’ interests recently. Normally, level 3 features are used
for manual matching by experts in forensic cases. But now, level 3 features
(e.g. pores) could be also used in automated recognition systems (e.g. in
[JCD07, ZZZL10]) but high resolution images (>= 1000dpi (dot per inch))
18

are required in this case. Some researchers have reported that the average
accuracy of using solely level 3 features for matching is lower than using level
1 and 2 features, which is about 15-20% lower by comparing the results in
[JCD07, ZZZL09]. However, Jain [JCD07] reported that the accuracy could
be improved by 20% if level 3 features are used as supplements to level
1 and 2 features for matching. But the image resolution requirement (at
least 1000 dpi [JCD06]) for using level 3 features is a constraint condition,
because most of the capture devices use 500 dpi as a standard such as FVC
databases and NIST databases [MMC+02].
Figure 2.2: Three levels of fingerprint features. It shows the features ex-tracted from level 1 to 3 respectively. The first one is the orientation mapand singular points, the second one shows two types of minutiae, and thelast one shows level 3 features.(from [Jai11])
19

Table 2.2: Fingerprint features and their description.
Features Description
Local ridge orienta-
tion
The angle that the local ridges formed with
horizontal axis. It is the unoriented direction
of ridges lying in [0, 180) degrees [MMJP09].
Local ridge frequency The number of ridges per unit length orthog-
onal to the local ridge orientation.
Core point A core is located at the focus of the inner-
most recurving ridge line. It is a ’U’ like pat-
tern.
Delta point It’s the point on a friction ridge at or nearest
to the point of divergence of two type ridge
lines. It is a ’Y’ like pattern
Minutiae It refers to local ridge characteristics, Ridge
ending and bifurcation are 2 most important
minutiae types
Pore Sweat pores in the ridges.
Dots, incipient ridges
and ridge edge protru-
sions
Other level 3 features.
20
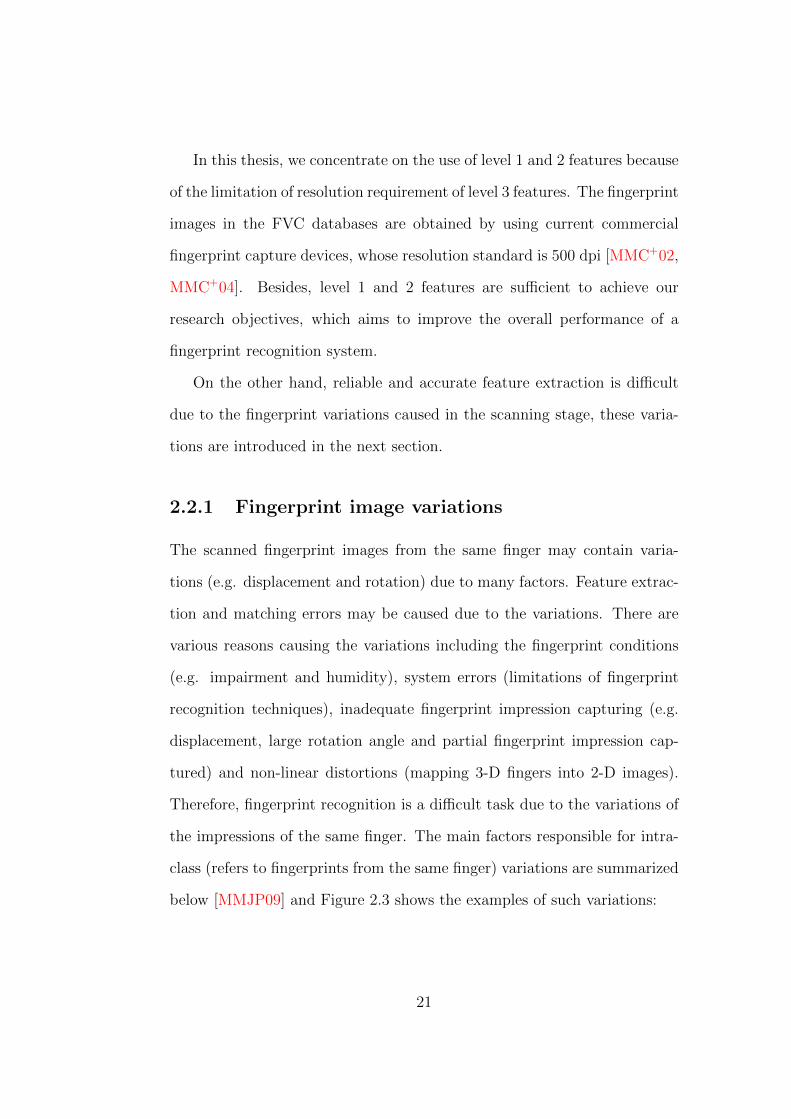
In this thesis, we concentrate on the use of level 1 and 2 features because
of the limitation of resolution requirement of level 3 features. The fingerprint
images in the FVC databases are obtained by using current commercial
fingerprint capture devices, whose resolution standard is 500 dpi [MMC+02,
MMC+04]. Besides, level 1 and 2 features are sufficient to achieve our
research objectives, which aims to improve the overall performance of a
fingerprint recognition system.
On the other hand, reliable and accurate feature extraction is difficult
due to the fingerprint variations caused in the scanning stage, these varia-
tions are introduced in the next section.
2.2.1 Fingerprint image variations
The scanned fingerprint images from the same finger may contain varia-
tions (e.g. displacement and rotation) due to many factors. Feature extrac-
tion and matching errors may be caused due to the variations. There are
various reasons causing the variations including the fingerprint conditions
(e.g. impairment and humidity), system errors (limitations of fingerprint
recognition techniques), inadequate fingerprint impression capturing (e.g.
displacement, large rotation angle and partial fingerprint impression cap-
tured) and non-linear distortions (mapping 3-D fingers into 2-D images).
Therefore, fingerprint recognition is a difficult task due to the variations of
the impressions of the same finger. The main factors responsible for intra-
class (refers to fingerprints from the same finger) variations are summarized
below [MMJP09] and Figure 2.3 shows the examples of such variations:
21

• Displacement: The same finger may be placed in different locations
on a touch sensor during different acquisitions resulting in a transla-
tion of the fingerprint area. A finger displacement of just 2 mm results
in a translation of about 40 pixels in a fingerprint image scanned at a
resolution of 500 dpi.
• Rotation: The same finger may be rotated at different angles with
respect to the sensor surface during different acquisitions.
• Partial overlap: Finger displacement and rotation often cause part
of the fingerprint area to fall outside the sensor, resulting in a smaller
overlap between the foreground areas of the template and the input
fingerprints. This problem is particularly serious for small-area touch
sensors
• Non-linear distortion: The act of mapping of the three-dimensional
shape of a finger onto the two-dimensional surface of the sensor results
in a non-linear distortion in successive acquisitions from the same
finger due to skin plasticity.
• Pressure and skin condition: The ridge structure of a finger would
be accurately captured if ridges of the part of the finger being imaged
were in uniform contact with the sensor surface. However, finger pres-
sure, dryness of the skin, skin disease, sweat, dirt, grease, and humid-
ity in the air all compound the situation, resulting in a non-uniform
contact. As a consequence, the acquired fingerprint images are very
noisy and the noise strongly varies in successive acquisitions of the
same finger depending on the magnitude of the above causes.
22

• Noise: It is mainly introduced by the fingerprint sensing system. For
example, residuals are left over on the glass plate from the previous
fingerprint capture.
• Feature extraction errors: The feature extraction algorithms are
imperfect and often introduce measurement errors. Errors may be
made during any of the feature extraction stages (e.g., estimation of
orientation and frequency images, detection of the number, type, and
position of the singularities, segmentation of the fingerprint area from
the background, etc.).
• Feature matching errors: The feature matching algorithms are
imperfect and introduce measurement errors. These errors may be
caused by the unreliable extracted features and/or unreliability of the
matching algorithms.
In summary, there are three major fingerprint variations: displacement,
rotation and non-linear distortion, which needs to be addressed in an au-
tomated fingerprint recognition system. When one or more of the above
situations happen during the matching process, it may raise the difficulty
of obtaining a satisfactory matching result. During the feature extraction
and matching stages, the influence of the above factors should be minimized
to obtain a reliable and accurate matching result. In the next section, we
will introduce a typical fingerprint recognition system which illustrates how
these fingerprint features are extracted and processed for matching.
23

Figure 2.3: Each row shows two fingerprint images from the same fingerfrom FVC2002 database. Maio et al. [MMJP09] reported that these fingerswere falsely non-matched by most of the algorithms submitted to FVC2002.
24

2.3 Fingerprint Recognition Systems
A fingerprint recognition system refers to a system which is able to verify
whether a pair of fingerprints belongs to the same individual automatically
[MMJP09, Wik14b] . Fingerprint recognition by human experts normally
obtains better results than an automated fingerprint recognition system,
because there are some situations that machines can not handle with (e.g.
extremely poor quality fingerprints obtained from crime scene and some
latent fingerprints) [MMJP09]. However, an automated fingerprint recog-
nition system has the huge advantage of time and cost consumptions with
adequate accuracies for fingerprint images with normal or above levels of
qualities.
Fingerprint recognition systems could be classified into two sub-systems
based on their purposes. These two sub-systems are called automated fin-
gerprint identification system (AFIS) and fingerprint verification system
(AFVS).
An AFIS is able to identify a person’s identity based on the captured
fingerprint(s). In this system, it searches the entire fingerprint database in
order to find out a match. If there is a match, then this person is identified.
Therefore, a fingerprint identification system is able to answer the question
of ”Who is this person?”. But in an AFVS, a person provides his/her iden-
tity (e.g. ID and name) that he/she claims to be, then the system verifies
that the captured fingerprint matches the registered fingerprint template
stored in the database. If there is a match, then this person is recognized
by the system. Therefore, a fingerprint verification system is used to solve
the problem of ”Is this person the one claimed to be?”. Based on the above
25

description, we can see that the major difference between these two systems
is that a fingerprint identification system contains a component for database
searching for one-to-many matching (normally uses fingerprint classification
techniques to speed up the searching time). But a fingerprint verification
system uses one-to-one matching, which only needs to verify whether two
fingerprints are a match or not.
(a) Identification
(b) Verification
Figure 2.4: The flowcharts of fingerprint identification and verification sys-tems (from [SB11]).
Figure 2.4 illustrates the flowcharts of fingerprint identification and ver-
ification systems. From Figure 2.4a, we can see that the query fingerprint
tries to match N templates in an identification system to find a match in
order to identify the user’s identity. And in Figure 2.4b, the user needs
to input his/her name and pin along with the fingerprint to verify his/her
identity. Fingerprint identification systems are normally used by law en-
26

forcement agencies for criminal identifications. But a fingerprint verification
system can be integrated with any authentication systems to improve the
security and reliability of these systems.
From the above figure, we can also see that both AFIS and AFVS have
two components which are feature extraction and feature matching. Per-
formance of these two parts may influence the overall performance of a
fingerprint recognition system. The less feature extraction errors occur, the
more reliable is the extracted features. Extracted features are inputs to the
feature matcher, so that reliable features may reduce the matching errors
of both matching algorithms and the whole system. Therefore, improving
the accuracies of feature extraction and feature matching may improve the
overall accuracy of either a fingerprint verification system or a fingerprint
identification system. From the above analysis, we can see that focusing on
the research of the feature extraction and matching techniques is able to
improve the matching accuracy of a fingerprint identification or verification
system.
Figure 2.5 illustrate a big picture of a fingerprint recognition system.
From the figure, we can see that fingerprint identification systems have an
additional component called fingerprint classification, which is able to deter-
mine the fingerprint types (refers to five types in Figure 2.6). In fingerprint
classification, singular points (core and delta points) are used to determine
the fingerprint types according to the number and location of core and delta
points in a fingerprint image. Besides, the singular points are also used in
fingerprint alignment (used to solve the rotation and displacement problem
in fingerprint recognition) in both minutiae and correlation based (refer to
matching methods using texture information) matching methods. In the
27

feature matching block, there are two major classes of matching techniques
according to the selected features, one of which is minutiae based and the
other is based on patterns other than minutiae (non-minutiae and correla-
tion based). Most fingerprint recognition systems use minutiae based tech-
niques for their high accuracy especially when reliable minutiae can be easily
obtained [MMJP09]. However, the accuracy of minutiae extraction is heav-
ily depended on the quality of fingerprint images, and noise in a fingerprint
image may introduce spurious minutiae points. Therefore, non-minutiae
based fingerprint recognition techniques are popular when the quality of
fingerprint images are low and it is hard to extract accurate minutiae. No
matter which features are used for matching, accurate feature extraction is
essential to a fingerprint recognition system.
Figure 2.5: A big picture of a fingerprint recognition system.
Both feature extraction and feature matching have great impact on the
final matching scores. The purpose of feature extraction is to extract reli-
able features as the input to the matching algorithms. The feature matching
28

section has the function of computing the overall similarity between two en-
rolled fingerprint images. If the similarity between two fingerprints is high,
then these two fingerprints have a high probability of belonging to the same
finger, vice versa. Therefore, reliable and accurate feature extraction and
matching is the overall challenge in any fingerprint recognition system.
(a) Left loop (b) Right loop (c) Whorl
(d) Plain arch (e) Tented arch
Figure 2.6: Different types of fingerprint classified by their global shapes.
2.4 Components in Feature Extraction and
Matching
There are many components in feature extraction and matching parts of a
fingerprint recognition system. A typical fingerprint feature extraction and
29

matching procedure may include the following stages (as shown in Figure
2.7):
• Segmentation. It refers to the separation of fingerprint area (fore-
ground) from the image background. An elegant segmentation tech-
nique should be able to separate the reliable area in a fingerprint image
for further processing.
• Image pre-processing (or called pixel-wise enhancement). It refers to
adjusting the pixel intensity values of a fingerprint image to the desired
intensity values depending on some parameters (e.g. mean intensity
and intensity variance). So that all the fingerprint images has a uni-
form distribution of intensity values in the same range, which will be
used as the input images in the contextual filtering stage. One of the
most popular image pre-processing technique in fingerprint recogni-
tion field is image normalization developed by Hong et al. [HWJ98].
• Local ridge orientation and frequency estimation. Local ridge orien-
tation θ(i, j) at pixel (i, j) refers to the angle that the ridge crosses
through a small neighborhood with horizontal axis where local ridge
frequency at pixel (i, j) refers to the inverse number of ridges per unit
length along a hypothetical segment centred at (i, j) and orthogonal
to the local ridge orientation θ(i, j).
• Contextual filtering. In contextual filtering stage, the filter (e.g. Ga-
bor filter and Log-Gabor filter) characteristics change according to
the local context like local ridge orientation and frequency. It is the
major stage for image enhancement and noise removal. Binarization
30

of fingerprint images could be performed after this stage in order to
facilitate the minutiae extraction.
• Minutiae/feature extraction. The extracted minutiae are used in minu-
tiae based fingerprint recognition systems for matching while the pat-
terns may be used in a pattern based fingerprint recognition system.
Other features like singular points may also be extracted for finger-
print alignment and matching.
• Fingerprint alignment and matching. In this stage, the above feature
information is used to compare the registered fingerprint and query
template to obtain a matching score. Before the matching process,
the two fingerprints may need to be aligned to the same position and
direction.
Figure 2.7: The procedure of feature extraction and matching in a finger-print recognition system.
In the following sections, each stage of a fingerprint recognition system
will be described in detail.
31

2.4.1 Fingerprint image segmentation
Segmentation refers to separating a fingerprint image into foreground and
background. Foreground means the recoverable ridge and valley areas of
a fingerprint image while background means the unrecoverable, non-ridge
and non-valley areas [MMJP09]. After segmentation, a mask is generated to
shield the background. Figure 2.8 shows two samples of segmentation from
Ratha et al.’s [RCJ95] and Chen et al.’s [CTCY04] approaches. Ratha etal’s
segmentation method processes a fingerprint image block by block with a
size of 16 x 16, based on the intensity variance and mean intensity. Thus,
the boundary of the segmentation mask does not exactly fit the boundary
of the fingerprint as show in Figure 2.8a. Chen et al. [CTCY04] trained a
linear classifier to select foreground (ridge and valley areas), then a post-
processing stage is performed to regularize the results. The segmentation
mask of Chen et al.’s method has a smooth boundary that Ratha et al’s
method does not have as shown in Figure 2.8.
Segmentation removes the interferences of non-fingerprint or/and noisy
areas in a fingerprint image. It is important for the accuracy of feature
extraction in the subsequent stages, because features extracted from non-
ridge, non-valley or/and noisy areas are not reliable for the matching.
32

(a) (b)
Figure 2.8: Two segmentation techniques: (a) an example of fingerprintsegmentation by Ratha’s [RCJ95] approach; (b) an example of fingerprintsegmentation by Chen et al.’s [CTCY04] approach;
The fingerprint features that can be used in a fingerprint segmentation
are listed as follows:
• Mean intensity: Mean intensity of a block indicates the grey level of
that block. Because foreground area contains ridges which usually
have lower intensity values than background areas. The calculation
of mean intensity for a window with size of w x w is illustrated in
equation 2.1 [RCJ95, BG02]:
M =1
w2
∑w
I (2.1)
33

where M denotes the mean intensity and I denotes the intensity of
each pixel in the chosen window.
• Intensity variance: Because foreground of a fingerprint image contains
ridges and valleys, and the intensities of ridge and valley are quite
distinctive. Thus the intensity variance of foreground will be higher
than background. The calculation of intensity variance for a window
with size of w x w is illustrated in equation 2.2 [RCJ95, BG02]:
V =1
w2
∑(I−M)2
I (2.2)
where V denotes the intensity variance.
• Coherence: Coherence was first used in fingerprint segmentation by
Bazen and Gerez [BG02] to evaluate how well the gradients are point-
ing in the same direction. Coherence usually is higher in the fore-
ground than background, because the ridges and valleys are contin-
uous and parallel. The coherence is also used to evaluate the reli-
ability of a selected fingerprint area. If the coherence value is low,
then the selected area is probably a noisy or non-ridge and non-valley
area. Thus, it is also used for fingerprint image quality estimation
[CDJ05, ZYHZ05]. The calculation of Coherence is illustrated in equa-
tion 2.3.
Coh =
√(Gxx −Gyy)2 + 4G2
xy
Gxx +Gyy
(2.3)
34

where Coh denotes the coherence value, and Gxx, Gyy, and Gxy are
averaged squared gradient components over a window w, which are
calculated as Gxx =∑w
G2x , Gyy =
∑w
G2y and Gxy =
∑w
GxGy,
respectively. And Gx and Gy are gradient components, which indicate
the gradient values on x-axis and and y-axis, respectively.
• Local ridge orientation patterns. The local ridge orientations in the
foreground should contain a dominated orientation, while background
usually does not have one.
Most segmentation methods use more than one of above features to
calculate the segmentation mask. Much research has been reported for
segmentation of fingerprint images. Those approaches can be classified into
several categories, which are: feature value thresholding based segmentation
approaches [MMKC87, MC89, MM97, XZWG12, FDJ12, ZZYJ13, HWJ98]
and learning-based segmentation approaches [BG02, CTCY04].
Feature value thresholding approaches use global or local thresholding of
features in a fingerprint to separate background and foreground. Mehtre et
al. [MMKC87] separate the fingerprint images by calculating the histogram
of ridge orientation in each 16X16 block. The presence of a significant
peak in a histogram denotes an oriented pattern, whereas a flat or near-
flat histogram is characteristic of an isotropic signal. Maio and Maltoni
[MM97] use the average magnitude of the gradient in each 16X16 block
to separate a fingerprint image. Ratha [RCJ95] uses the intensity vari-
ance in the orthogonal direction to the ridge orientation. The example of
Ratha’s approach is shown in Figure 2.8a. Hu [HYZ+10] performs adaptive
threshholding segmentation after applying the log-Gabor filtering to the im-
35

age, which achieves better result than directly applying the segmentation
method. Fleyeh et. al [FDJ12] and Zhao et. al [ZZYJ13] define several
fuzzy rules to select the thresholds of parameters. Fleyeh et al. claim that
96% of tested fingerprint images from FVC2000 databases are correctly seg-
mented, but the size of test dataset is relatively small since only 100 images
are selected for testing. Zhao et. al admit that their method perform well on
high quality images, but not well on some low quality images. One problem
of feature value thresholding methods is that the segmentation boundary
does not fit the fingerprint boundary which is square like and not smooth as
learning based methods as shown in Figure 2.8a and 2.8b. This is because
a fingerprint image is processed blockwisely in these methods. Wang et al.
[WBGS10] uses a median filter to smooth the boundary of segmentation
to obtain a result similar to learning-based methods as shown in Figure
2.9. This segmentation method is adopted in this research for its simple
implementation, fast running speed but satisfactory experimental results.
36

(a) (b)
Figure 2.9: Two samples of segmentation using the method in [WBGS10].The black line surrounding the fingerprint area indicates the mask boundary.The fingerprint images are from FVC 2002 databases [MMC+02].
Learning-based segmentation approaches usually use linear-classifiers to
select background and foreground [MMJP09]. Bazen and Gerez [BG02]
proposed a pixel-wise method, where gradient coherence, intensity mean,
and intensity variance are computed for each pixel, and a linear classi-
fier associates the pixel with the background or the foreground. Chen et
al. [CTCY04] proposed a linear classifier to select foreground blocks based
on: the block clusters degree, the difference of local block intensity mean
and global image intensity mean, and the block variance. Morphology is
then applied during post-processing to regularize the results and reduce the
number of classification errors. Figure 2.8b shows an example of finger-
print segmentation by Chen et al.’s [CTCY04] approach. Based on Chen
et al’s [CTCY04] work, Yang et al. [YZYY10] designed a K-mean based
37

segmentation method, which does not require the training process. Thus,
this method performs faster than Chen et al.’s method.
There are some other interesting methods developed recently. Instead of
using mean intensity and variance directly, Zhe et al. [XZWG12] uses the
mean shift algorithm to perform the fingerprint segmentation. They define a
new feature based on the mean intensity, variance and coherence. However,
they only provide a comparison of some samples instead of experimental
results on large databases. Another method developed by [BB11] calculates
the fingerprint segmentation mask in the frequency domain. They apply a
filter to the whole image to get its quality map. Then the segmentation
mask is derived from the quality map. They compared their method to co-
herence based, mean intensity based and intensity variance based methods
respectively, and they claimed that the result of their method is the best
among those methods. However, they did not compare their method to hy-
brid segmentation method like the methods based on all of those features.
Moreover, due to the fuzzy characteristic of biometrics (e.g. captured fin-
gerprints will not be exactly the same even from the same finger), it is hard
to obtain an absolute accuracy score for every segmentation technique. All
the experimental results are judged by experts, which may cause errors.
Though fingerprint segmentation is extensively researched, the perfor-
mance of current techniques could be further improved. The challenges
could be summarized as the following points:
• Detect the noise area inside the fingerprint area. Most state-of-the-art
fingerprint segmentation methods are able to separate the fingerprint
and non-fingerprint area quite accurately. However, to separate the
noise area inside the fingerprint is a difficult task. This is because it
38

is hard to evaluate the noise level to determine whether the areas can
be reserved to extract reliable features or not. A quality evaluation
process may be a solution to this problem.
• Accuracy versus efficiency. Msiza et al. [MMNM11] have investi-
gated current segmentation methods, and they found that it is hard
to achieve both the high accuracy and efficiency. A segmentation algo-
rithm with higher accuracy normally is more complex (e.g. a training
process or complex algorithm) and requires more costs of computa-
tion.
• Segmentation for latent fingerprint images. The automatic latent fin-
gerprint recognition is a new research area, however, it will not be
addressed in this thesis. Latent fingerprints refer to the fingerprints
that are not visible immediately by naked eye, like the fingerprints
left in a crime scene. Figure 2.10 shows two examples of latent finger-
prints images. Both images contain lots of useless informations other
than the fingerprints.
(a) (b)
Figure 2.10: Two examples of latent fingerprint images.
39
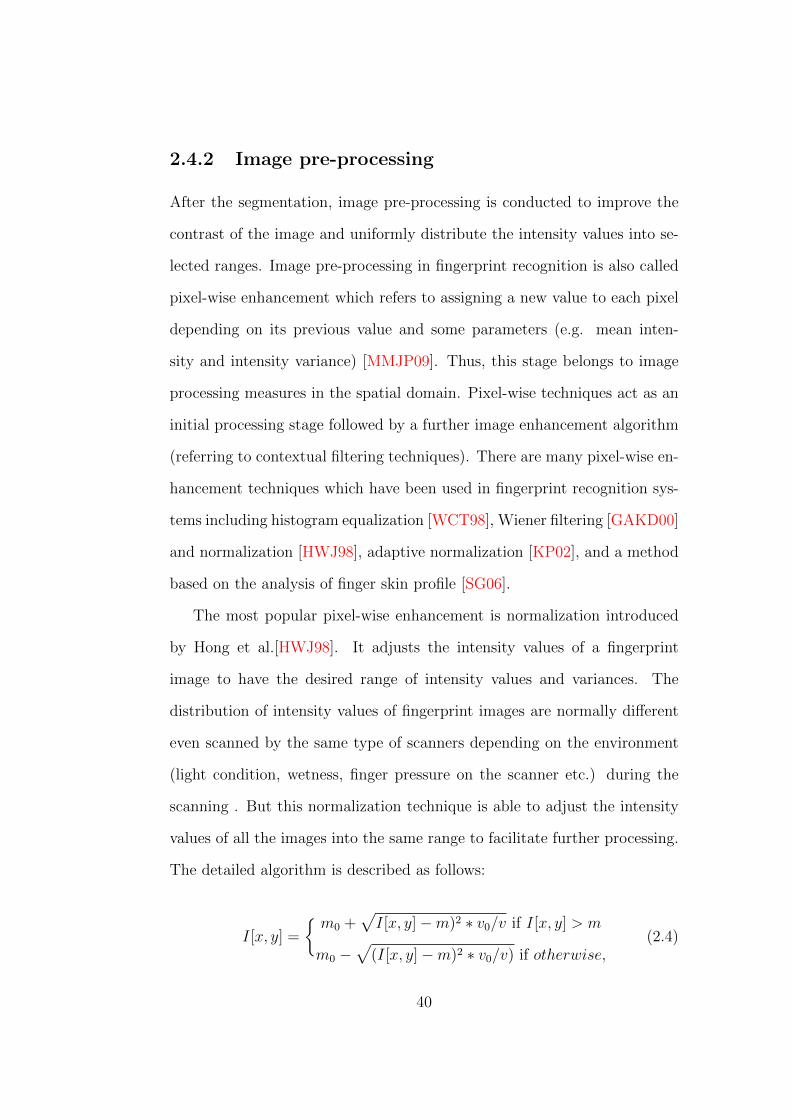
2.4.2 Image pre-processing
After the segmentation, image pre-processing is conducted to improve the
contrast of the image and uniformly distribute the intensity values into se-
lected ranges. Image pre-processing in fingerprint recognition is also called
pixel-wise enhancement which refers to assigning a new value to each pixel
depending on its previous value and some parameters (e.g. mean inten-
sity and intensity variance) [MMJP09]. Thus, this stage belongs to image
processing measures in the spatial domain. Pixel-wise techniques act as an
initial processing stage followed by a further image enhancement algorithm
(referring to contextual filtering techniques). There are many pixel-wise en-
hancement techniques which have been used in fingerprint recognition sys-
tems including histogram equalization [WCT98], Wiener filtering [GAKD00]
and normalization [HWJ98], adaptive normalization [KP02], and a method
based on the analysis of finger skin profile [SG06].
The most popular pixel-wise enhancement is normalization introduced
by Hong et al.[HWJ98]. It adjusts the intensity values of a fingerprint
image to have the desired range of intensity values and variances. The
distribution of intensity values of fingerprint images are normally different
even scanned by the same type of scanners depending on the environment
(light condition, wetness, finger pressure on the scanner etc.) during the
scanning . But this normalization technique is able to adjust the intensity
values of all the images into the same range to facilitate further processing.
The detailed algorithm is described as follows:
I[x, y] =
{m0 +
√I[x, y]−m)2 ∗ v0/v if I[x, y] > m
m0 −√
(I[x, y]−m)2 ∗ v0/v) if otherwise,(2.4)
40

where m and v are the image mean and variance and m0 and v0 are the
desired mean intensity and variance after normalization. Figure 2.11 shows
an example of normalization described in [HWJ98].
(a) (b)
Figure 2.11: An example of normalization described in [HWJ98].
Kim and Park [KP02] improved the above normalization method by di-
viding the image into blocks and calculating the mean intensity and variance
block by block.
The purpose of this stage is to make the distributions of ridge and valley
intensities fall in the different ranges which give the image a better clarity.
The limitation of the above image pre-processing techniques focuses on the
increase of the image contrast rather than removing noise. However, in
our study, we found that removing certain amount of noise (e.g. Gaussian
noise and other nonuniform noise) in this stage is able to obtain a better
processing result in the subsequent contextual filtering stage. Therefore,
designing a fingerprint image pre-processing method which is supportive to
successive contextual filtering (e.g. Gabor filtering), for better enhancement
41

results and feature (e.g. minutiae) extraction is a challenge in fingerprint
recognition.
2.4.3 Ridge orientation and frequency estimation
Local ridge orientation and frequency are two features required in subse-
quent filtering process. Local ridge orientation θ(i, j) at pixel(i, j) refers to
the angle that ridge crosses through a small neighborhood with horizontal
axis. And local ridge frequency at pixel (i, j) refers to the inverse number of
ridges per unit length along a hypothetical segment centred at (i, j) and or-
thogonal to the local ridge orientation θ(i, j) [MMJP09]. Figure 2.12 shows
a demonstrated result of local orientation estimation, where Figure 2.12a is
a fingerprint image and Figure 2.12b is the plot of ridge orientation. Figure
2.13 shows the calculation of local ridge frequency at pixel (xi, yj) [HWJ98].
Local ridge orientation field and ridge frequency can be estimated by the
gradient based method with the following steps which was proposed by Kass
and Witkin [KW87], Hong et al. [HWJ98] and Bazen and Gerez [BG02]:
(i) Divide the input image into w x w size blocks (16 x 16 is an empirical
size used by authors);
(ii) Compute Gx(i, j) and Gy(i, j) which are two gradient components
along x and y direction at pixel (i, j) respectively. They are computed
by convoluting with horizontal and vertical Sobel operator [GW01]
and for each block. Gxx, Gyy, and Gxy are averaged squared gradient
components over a window w. We define:
Gxx =∑w
G2x, (2.5)
42

Gyy =∑w
G2y, (2.6)
Gxy =∑w
GxGy, (2.7)
(iii) The local ridge orientation of point (i, j) is calculated by:
θ(i, j) = π/2 + 1/2 ∗ tan−1(2Gxy/(Gxx −Gyy)) (2.8)
(iv) Construct a 1-D wave by projecting the grey levels of all pixels in each
block along the direction orthogonal to block orientation as shown
in Figure 2.13. Let T (i, j) (T (i, j) = (s1 + s2 + s3 + s4)/4 ) be the
average number of pixels between five consecutive peaks (s1,2,3,4) in the
constructed 1-D wave (see Figure 2.13b), then the frequencyf(i, j) =
1/T (i, j) .
43

(a) (b)
Figure 2.12: The result of local orientation estimation: (a), a fingerprintimage and (b), the plot of ridge orientation.
(a) (b)
Figure 2.13: (a), An oriented window centered at pixel (xi, yj); (b), The x-signature on the right clearly exhibits five peaks; the four distances betweenconsecutive peaks are averaged to determine the local ridge frequency (from[HWJ98])
44
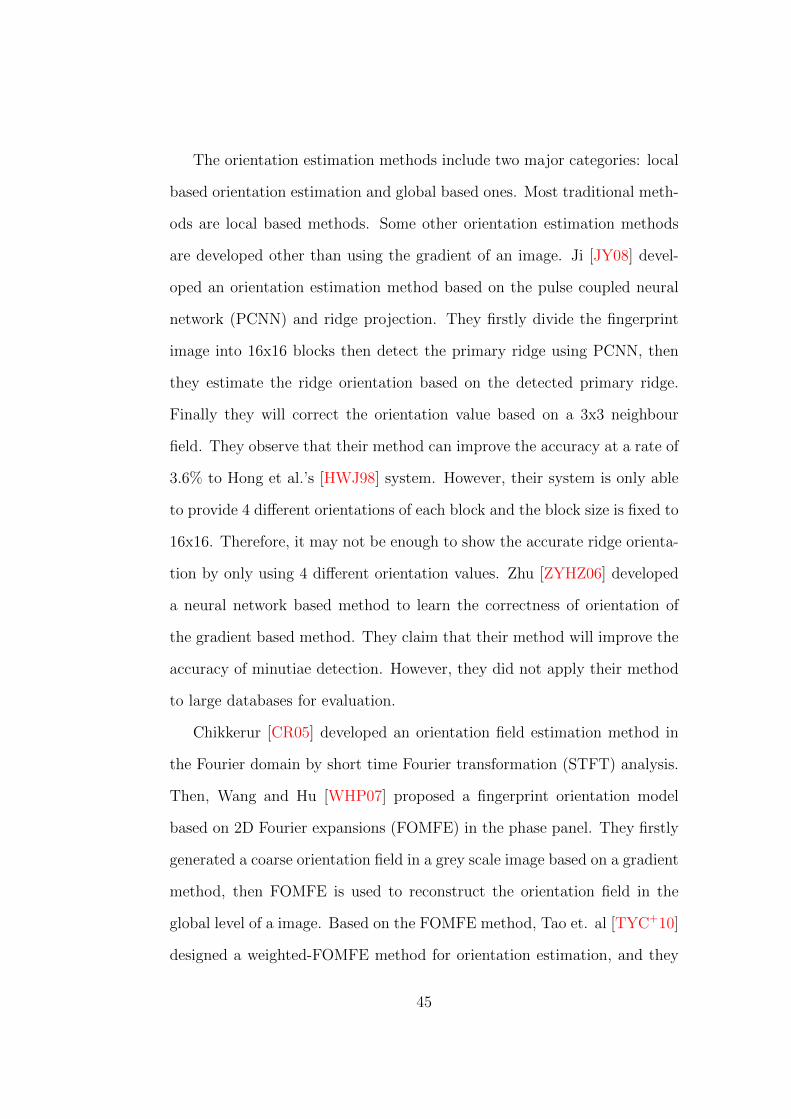
The orientation estimation methods include two major categories: local
based orientation estimation and global based ones. Most traditional meth-
ods are local based methods. Some other orientation estimation methods
are developed other than using the gradient of an image. Ji [JY08] devel-
oped an orientation estimation method based on the pulse coupled neural
network (PCNN) and ridge projection. They firstly divide the fingerprint
image into 16x16 blocks then detect the primary ridge using PCNN, then
they estimate the ridge orientation based on the detected primary ridge.
Finally they will correct the orientation value based on a 3x3 neighbour
field. They observe that their method can improve the accuracy at a rate of
3.6% to Hong et al.’s [HWJ98] system. However, their system is only able
to provide 4 different orientations of each block and the block size is fixed to
16x16. Therefore, it may not be enough to show the accurate ridge orienta-
tion by only using 4 different orientation values. Zhu [ZYHZ06] developed
a neural network based method to learn the correctness of orientation of
the gradient based method. They claim that their method will improve the
accuracy of minutiae detection. However, they did not apply their method
to large databases for evaluation.
Chikkerur [CR05] developed an orientation field estimation method in
the Fourier domain by short time Fourier transformation (STFT) analysis.
Then, Wang and Hu [WHP07] proposed a fingerprint orientation model
based on 2D Fourier expansions (FOMFE) in the phase panel. They firstly
generated a coarse orientation field in a grey scale image based on a gradient
method, then FOMFE is used to reconstruct the orientation field in the
global level of a image. Based on the FOMFE method, Tao et. al [TYC+10]
designed a weighted-FOMFE method for orientation estimation, and they
45

claimed that their method improves about 3.6% of accuracy comparing to
FOMEE method.
In conclusion, although many methods have been proposed in the liter-
ature, it is still an ongoing problem especially for those low quality images.
Local ridge orientation field is one of the input of the contextual filtering
techniques (e.g. Gabor filtering), and it is used to calculate the singular
points of the fingerprints which is important to alignment and fingerprint
classifications.
2.4.4 Contextual filtering
In contextual filtering stage, the filter characteristics change according to
the local context like ridge orientation and frequency [MMJP09]. Contex-
tual filtering is widely used for fingerprint image enhancement. Much re-
search has been reported for contextual filtering. The most popular filtering
technique is Gabor filter, adopted by Hong et al. [HWJ98], Lee and Bhat-
tacharjee [LB09], Greenberg et al. [GAKD00] and Jang et al. [JPLK06].
Besides, some other filters have been designed for contextual filtering such
as log-Gabor filter [WLHF08], directional Fourier domain filter [SMM94],
directional median filter [WSG04], curved Gabor filter [Got12b, Got12a]
and oriented diffusion filtering techniques [GS12].
The 2-demensional Gabor filter is introduced in the following equations.
We adopt it for contextual filtering in our work as it is a well known and ef-
fective context filtering technique. The 2-dimensional Gabor filters have the
properties of both orientation and frequency selectiveness. The equations
46

for 2-D even symmetric Gabor filters are as follows [MMJP09, JRL97]:
G(x, y; θ, f) = exp{−1/2(x2θσ2x
+y2θσ2y
)}cos(2πfxθ) (2.9)
xθ = xsinθ + ycosθ (2.10)
yθ = −xcosθ + ysin (2.11)
where f and θ denote the frequency and orientation of local ridges re-
spectively, whereas σx and σy represent the standard deviation of Gaussian
envelope along x and y axes respectively. Therefore, before using Gabor
filters, two parameters that should be estimated are local ridge orientation
and frequency. The selection of σxand σy determines the performance of
2-D Gabor filters. The larger values chosen for σx and σy may be better for
removing noise, but it may produce some spurious ridges, the smaller values
chosen for σx and σy may not effectively remove noise [MMJP09]. Hong et
al. [HWJ98] suggest 4 is a good choice for both σx and σy by observing
their empirical data. Figure 2.14 shows the graphical representation (lat-
eral view and top view) of the Gabor filter defined by the parameters θ =
135 degrees, f = 1/5, and σx = σy = 3. Figure 2.15 shows an example of
fingerprint image processing results by Gabor filtering.
47

Figure 2.14: Graphical representation (lateral view and top view) of theGabor filter defined by the parameters θ= 135 degrees, f = 1/5, and σx=σy = 3 (from [MMJP09]).
(a) (b) (c)
Figure 2.15: An example of fingerprint image processing results by Gaborfiltering: (a) the original fingerprint image is from FVC 2002 database; (b)the processed fingerprint image after Gabor filtering; and (c) is the binarizedimage. Note the above images are segmented, and σx = σy = 2.
Contextual filtering is the most important image processing stage for fin-
gerprint images in a fingerprint recognition system. It is able to enhance
the fingerprint images for extracting the binarized fingerprint images after-
wards, which can be used to extract minutiae or other important features
in the matching stage. Most of the contextual filtering techniques are able
to fulfil the requirements of fingerprint image enhancement. However, their
48

performance is highly depended on the previous stages especially on the
local ridge orientation estimation and local ridge frequency estimation.
2.4.5 Singular point detection
Singular points could be used for fingerprint alignment (as reference points
to superimpose two fingerprints) and fingerprint classification (to determine
the fingerprint types).
Plenty of research has been reported for singular point detection. The
most popular approach is based on Poincare Index which was first proposed
by Kawagoe and Tojo [KT84]. It is a simple and effective approach to de-
tect the singular points. However, it is well recognized that the accuracy
of this approach highly depends on the quality of fingerprint images. For
low quality fingerprint images, this approach can generate a large number
of spurious singular points [MMJP09]. The spurious singular points may
influence the accuracy of fingerprint alignment and classification. Several
improved approaches have been proposed to overcome the problem of spu-
rious singular points in recent years. Karu and Jain [KJ96] smooth the
orientation field of fingerprints by averaging to reduce the number of de-
tected singular points based on the observation that a fingerprint of an
individual contains same number of cores and deltas. It improves the accu-
racy of singular points detection since most fingerprints do not have more
than 2 core-delta pairs. The problem with this approach is that smoothing
the fingerprint images may cause detected singular points some pixels away
from of original ones as noticed by Wang et al. [WLN07]. In some cases,
over smoothing of the ridge orientation field may cause the miss detection of
genuine singular points, because the detected singular points may shift away
49

from the genuine location. Therefore, Wang et al. [WLN07] investigated the
relationships between singular points and their neighborhoods and establish
a theorem named ”zone Could-be-in” which indicates the areas that may
contain singular points to address the above problem. Zhou et al. [ZGZ07]
proved that a fingerprint should have the same number of cores and deltas,
and they computed the Poincare Index combining with a technique named
Differences of the Orientation values along a Circle (DORIC). They use the
Poincare Index method first to detect the singular points, then the optimal
singular points are selected to minimize the difference between the original
orientation field and the model-based orientation field reconstructed from
the singular points. Bo et al. [BLE09] proposed an approach based on ori-
entation field which can detect regions possibly containing singular point
to improve the efficiency of Poincare Index algorithm. Besides the above
approaches based on Poincare Index, some other approaches like detect-
ing singular points by reliability/coherence [CLMM99] and zero-pole model
[SM93][CEMM00] [FLW00] have been designed. Ravinde et al. [KCH12]
uses the reliability of the local ridge orientation to validate the detected
singular points. Their experimental results achieve 92.6% detection rate of
genuine singular points, however, the false detection rate is 8.4% which is
not counted in the final detection rate. Nilsson and Bigun [NB05] developed
an approach based on complex filtering and 1D- projection. Nilsson and Bi-
gun’s [NB05] approach achieved the best results, which got the performance
having 94% correct fingerprint registration rate. Here the registration rate
refers to the rate of fingerprint images that could be registered using the de-
tected singular points with other techniques. However, their singular point
detection accuracy is about 83% [NB05].
50

Above all, most of current detection methods produce numerous spu-
rious singular points depending on the quality of fingerprint images and
detection techniques used. The limitations of current singular point detec-
tion techniques include: (i), the correct detection rate of current singular
point detection methods are not high (normally around 90%); (ii), vari-
ous image qualities still limit the extraction accuracy. We believe singular
point detection and extraction need to be further investigated since the ac-
curacy of detection is not satisfactory in particular for poor quality images.
The major challenge of singular point detection is how to remove spurious
singular points but retain genuine singular points.
2.4.6 Minutiae extraction
Minutiae is another important feature used for fingerprint matching. The
accuracy of minutiae extraction determines the accuracy of minutiae based
alignment and matching techniques. Normally, minutiae extraction contains
the following steps:
(i) Binarization. It refers to binarizing a grey-level scale fingerprint image
to a binary image. It is normally proposed after the contextual filter-
ing such as in [HWJ98], however, there are some approaches proposed
to process a grey-level image directly. Figure 2.16b shows a binariza-
tion result of figure2.16a by Maio and Maltoni’s approach [MMC+02].
(ii) Thinning operation. Binary images will be further processed by thin-
ning the ridges lines to one pixel width ridge lines, and a skeleton
image may obtain after the process. Figure 2.16c shows a skeleton
image obtained after binarization and thinning of Fig 2.16b.
51
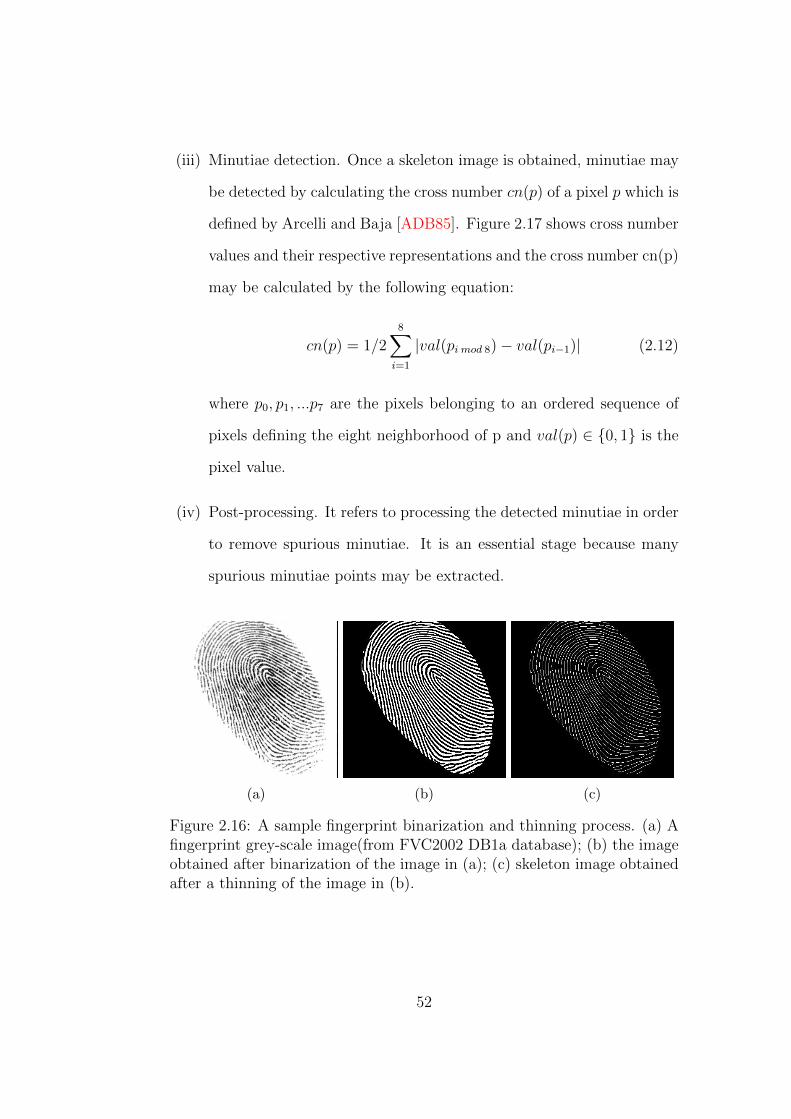
(iii) Minutiae detection. Once a skeleton image is obtained, minutiae may
be detected by calculating the cross number cn(p) of a pixel p which is
defined by Arcelli and Baja [ADB85]. Figure 2.17 shows cross number
values and their respective representations and the cross number cn(p)
may be calculated by the following equation:
cn(p) = 1/28∑i=1
|val(pi mod 8)− val(pi−1)| (2.12)
where p0, p1, ...p7 are the pixels belonging to an ordered sequence of
pixels defining the eight neighborhood of p and val(p) ∈ {0, 1} is the
pixel value.
(iv) Post-processing. It refers to processing the detected minutiae in order
to remove spurious minutiae. It is an essential stage because many
spurious minutiae points may be extracted.
(a) (b) (c)
Figure 2.16: A sample fingerprint binarization and thinning process. (a) Afingerprint grey-scale image(from FVC2002 DB1a database); (b) the imageobtained after binarization of the image in (a); (c) skeleton image obtainedafter a thinning of the image in (b).
52
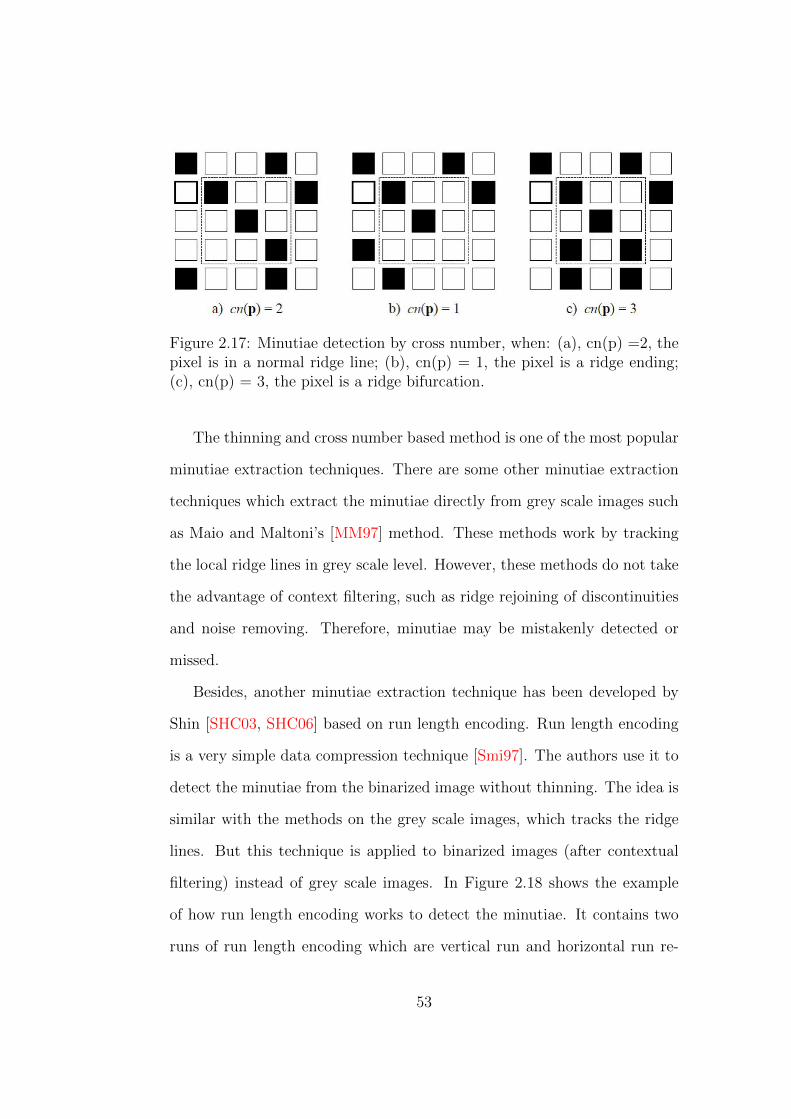
Figure 2.17: Minutiae detection by cross number, when: (a), cn(p) =2, thepixel is in a normal ridge line; (b), cn(p) = 1, the pixel is a ridge ending;(c), cn(p) = 3, the pixel is a ridge bifurcation.
The thinning and cross number based method is one of the most popular
minutiae extraction techniques. There are some other minutiae extraction
techniques which extract the minutiae directly from grey scale images such
as Maio and Maltoni’s [MM97] method. These methods work by tracking
the local ridge lines in grey scale level. However, these methods do not take
the advantage of context filtering, such as ridge rejoining of discontinuities
and noise removing. Therefore, minutiae may be mistakenly detected or
missed.
Besides, another minutiae extraction technique has been developed by
Shin [SHC03, SHC06] based on run length encoding. Run length encoding
is a very simple data compression technique [Smi97]. The authors use it to
detect the minutiae from the binarized image without thinning. The idea is
similar with the methods on the grey scale images, which tracks the ridge
lines. But this technique is applied to binarized images (after contextual
filtering) instead of grey scale images. In Figure 2.18 shows the example
of how run length encoding works to detect the minutiae. It contains two
runs of run length encoding which are vertical run and horizontal run re-
53

spectively for each fingerprint image. The major advantage of this method
is that it preserves the geometric information of the ridge structure. The
thinning based methods cannot preserve this information properly because
the ridge is shrunk to an one-pixel width. Thus the detected minutiae points
may have several pixels’ shifting comparing to the locations of true ground
minutiae points. This problem is well addressed by the above method. This
method is adopted in our research, this is because our matching method
using binarized minutiae blocks which contains texture information and a
minutiae point in the center of a block. Thus the accurate minutiae location
(no position shifting in the traditional thinning based minutiae extraction
methods) is important to our matching method.
Figure 2.18: Fingerprint minutiae in run representation: (a), input greyfingerprint image; (b), ridge ending in horizontal ridge detected by verticalrun; (c), ridge bifurcation in vertical ridge detected by horizontal run; (d),ridge ending in vertical ridge detected by horizontal run; and (e), ridgebifurcation in horizontal ridge detected by vertical run.(from [SHC06])
54

Regardless of which minutiae detection method is used, more or less
spurious minutiae will be detected. Therefore, the more important part of
minutiae extraction is how to remove the spurious minutiae but reserve the
genuine ones. Post-processing is crucial to all minutiae detection methods.
Zhao and Tang [ZT07] introduce several spur minutiae types which usually
appear before the post-processing. Figure 2.19 shows examples of these spur
minutiae. After minutiae extraction, resultant minutiae will directly be used
for alignment or matching. Thus, spur minutiae will decrease the accuracy
of alignment or matching. How to effectively extract reliable minutiae is
still an on-going challenging problem.
Figure 2.19: Examples of false minutiae (black dots).(from [ZT07])
2.4.7 Fingerprint alignment and matching
After fingerprint features are extracted, then comparisons will be performed
between different fingerprint images. Then the alignment problem arises
due to the rotation and displacement of fingerprints during the scanning
stages. Fingerprint alignment is a difficult problem in fingerprint recogni-
55

tion. Matching problem could be simplified if alignment is perfectly con-
ducted between two different fingerprints.
2.4.7.1 Fingerprint alignment
There are two categories of alignment methods which are global alignment
(using level 1 features) and local feature (level 2 feature) based alignment.
Global alignment usually uses some reference points, and singular points
are perfect candidate reference points in this case. Thus, how to extract
reliable and accurate singular points is a challenging problem which needs
to be addressed as well. In local feature based alignment, some local features
are extracted for comparison. Local minutiae structure is the most popular
feature in this case. Both global and local methods have their inherent
advantages and disadvantages.
Though a perfect pre-alignment may greatly improve the efficiency of a
fingerprint recognition system and reduce a complex match algorithm to a
simple minutiae point pairing problem, there are difficulties to realize such
a perfect algorithm. Global pre-alignment methods have two types: i), ab-
solute pre-alignment which pre-align every fingerprint to the fixed rotation
angle and position; and ii), relative pre-alignment which align the query fin-
gerprint template according to the template stored in the database. Most
absolute pre-alignment methods use core position to translate fingerprint
images. However, reliable detection of core point is very difficult due to
the various qualities of fingerprint images [MMJP09]. Furthermore, arch
fingerprints do not contain a core point which restricts this method to be
applied to all fingerprints. A more robust option is to use a relative pre-
alignment approach based on a dynamic selection among different alignment
56

techniques such as by superimposing the singularities, correlating the ori-
entation images and comparing ridge features [YA06].
Due to the time and resource constraints and difficulty of global match-
ing, researchers [WCT98, HM90, FLW00] have developed local minutiae
matching approaches which do not need to consider the global transforma-
tion such as translation and rotation. Local minutiae matching consists of
comparing two fingerprints according to local minutiae structures. These
structures include ridge distance, ridge count between the central minutiae
and the number, distance and angles of minutiae falling inside some regions
[MMJP09]. Because these methods do not require pre-alignment of two
fingerprint images, they are also called alignment free methods (e.g.[WH12,
LYC+10]).
2.4.7.2 Fingerprint matching
A fingerprint matching algorithm compares two given fingerprints and re-
turns either a degree of similarity or a binary decision (matched/non-matched)
[MMJP09]. Most of the matching algorithms are performed on binaraized
images or after minutiae extraction.
Matching fingerprint images is a very difficult problem due to the vari-
ations of the impressions of the same finger as we introduced before. The
aim of matching algorithms is to find the maximum number of matches of
minutiae (or patterns) and get a similarity score between two fingerprint
images and set a threshold to check whether the similarity score exceeds
the threshold.
Fingerprint matching techniques can be coarsely classified into three
families[MMJP09]:
57

• Correlation-based matching (e.g. [LELJSM07, KAN08]): two finger-
print images are aligned and overlapped according to their displace-
ments and rotations, then the correlation between the corresponding
pixels is computed. The correlation between two fingerprint images is
computed on the grey scale images. If the correlation value between
two fingerprints is high, then these two fingerprint is possible a match;
otherwise these two fingerprints may not from the same finger.
• Minutiae based matching (e.g. [JY00, HWJ98, CFM10]): this is the
most popular and widely used technique. It is an analogy of the
fingerprint comparison made by fingerprint examiners. Minutiae are
extracted from the two fingerprints and stored as sets of points (e.g.
(xi, yj; θij)). Minutiae-based matching tries to find the alignment be-
tween the template and the input minutiae feature sets that result
in the maximum number of minutiae pairings [MMJP09]. It can
be classified into two types for minutiae based matching, which are:
global pre-alignment using reference points then for matching, and
local minutiae structure based matching. The local minutiae struc-
ture based matching methods can be further classified into nearest
neighor-based and fixed radius-based matching methods. The nearest
neighor-based methods explores the relationships between the selected
minutiae and a number of its nearest surrounding minutiae, e.g. the
method proposed by Jiang and Yau [JY00]. The drawback of nearest
neighor-based methods is that the tolerance to spurious and missed
minutiae is low [CFM10] (the local minutiae structure may not be
reliable if there is spurious minutiae surrounding the central minu-
58
tiae). Slightly different with nearest neighor-based methods, fixed
radius based methods define a fixed radius R. All the minutiae in the
radius R of the selected minutiae are considered as its neighbors, e.g.
the method proposed by Ratha et al. [RB00]. This matching method
family has better tolerance to spurious and missed minutiae to nearest
neighor-based methods. Because all the surrounding minutiae inside
the radius R contributes to the formed local minutiae structure, a
small number of spurious minutiae inside the radius will not dom-
inate the overall local minutiae structure. However, there are some
new issues introduced in fixed radius based methods. One major issue
is that a sophisticated local matching mechanism is required due to
the increase of the minutiae number inside the radius R. Another issue
is that border errors may occur in these methods [CFM10]. In par-
ticular, a minutiae close to the radius border of the central minutiae
in one fingerprint may be outside the border in another fingerprint,
due to the non-linear distortion or location inaccuracy, and this may
cause a mismatch with that minutiae.
• Non-minutiae based matching (e.g. [ZWZ07, GZY06]): it is suitable
for the situations when the quality of fingerprint images is extremely
low. In this case, some other features (e.g., local orientation and
frequency, ridge shape, texture information) may be extracted more
reliably than minutiae. However, the distinctiveness of these features
is lower than minutiae, which causes that lower matching accuracy
which is not as good as minutiae based methodsfor medium or high
quality fingerprint images. Theoretically, correlation-based matching
59

techniques could be conceived of as a subfamily of non-minutiae fea-
ture based matching techniques [MMJP09].
Table 2.3 illustrates the advantages and disadvantages of the above three
types of matching techniques. Correlation-based matching based techniques
normally require pre-alignment of two fingerprint before the comparison.
This constraint limits the matching performance of partial fingerprints. Be-
sides, the tolerance of non-linear distortion is not as high as minutiae based
techniques [FZ11]. This is because the minutiae is local feature and the non-
linear distortion could be mitigated by setting a tolerance threshold such
as distance and angle differences between minutiae pairs. But the advan-
tage of this matching is that it has high image noise resistance [MMJP09].
Furthermore, this matching tries to get a correlation score between two
whole fingerprint image, which means that the fingerprint global structures
are used for comparison. Thus it increases the reliability of the matching
results since the complete fingerprint image information is used for compar-
ison. For minutiae based matching, it has the disadvantage of low tolerance
to image noise. If the image quality is low, then the minutiae extraction is
not so reliable for matching. Non-minutiae based matching addresses this
issue because other ridge pattern features could be reliably extracted easier
(e.g. ridge patterns and local ridge orientation). Therefore this matching
is suitable to extremely low quality fingerprint images. However, these fea-
tures do not have as high distinctiveness as minutiae. Thus the performance
of this matching is not as high as minutiae based matching in case the image
quality is high [FZ11].
60

Table 2.3: The advantages and disadvantages of three categories of matchingmethods
Techniques Advantages Disadvantages
Correlation
based
Reliable global structure
comparison; high tolerance
to (local) image noise
Require pre-alignment;
computation cost is high;
low tolerance of non-
linear distortion; partial
fingerprint comparison is
an issue.
Minutiae
based
High tolerance to non-linear
distortion; an analogy to ex-
pert based matching; pre-
alignment is nonessential;
fast and low computation
cost; High distinctiveness of
inter-class fingerprint pairs.
Low tolerance to image
noise; highly depends on
the accuracy of minutiae
extraction
Non-minutiae
based (exclud-
ing correlation
based)
Other ridge pattern features
could be reliably extracted
easier (e.g. ridge patterns
and local ridge orientation);
suitable to low quality im-
ages.
Distinctiveness of inter-
class fingerprint pairs is
relatively lower.
2.4.7.3 State of art matching techniques
Fingerprint matching is one of the hottest areas in the research of fingerprint
recognition. Many matching algorithms have been designed and reported
61

with acceptable experimental results. In the following part, we introduce
several current fingerprint matching methods.
Jiang and Yau [JY00] designed a matching method based on both global
and local structures. Because the global minutiae structure shows the
uniqueness of fingerprints, but the local minutiae feature has the advantage
of rotation and translation invariant, they use the local minutiae structure
pair with the highest similarity as a reference point for alignment, then a
global comparison is performed. They claim that their method achieves an
error equivalent rate (EER) (indicates the overall matching error rate) of
0.45% from a total 2260512 matching. However, they did not mention the
database used in their experiments.
Wahby and Ahmad [WSOA13] proposed a multilevel structure technique
which firstly decomposes an image into regions based on global features
and then formulates multilevel features from both global and local features.
Their result shows that this method get average EER of 3.79% of FVC2002
DB1, DB3 and DB4.
Cappelli et al. [CFM10] proposed a minutiae matching method by cylin-
der code, and they claimed that it is one of the most accurate methods up
to now. Figure 2.20 shows the representation of minutiae cylinder code
(MCC) in a fingerprint template. They get an average EER of 0.29% of
on FVC2006 database based on the best minutiae extractor from FVC2006
campaigns. Feng et. al [FZ11] evaluated the performances of several minu-
tiae based matching methods. Their results indicate that the MCC method
is ranked the first in most cases except the fingerprint dataset with the small
common region between two enrolled fingerprint images.
62

Figure 2.20: Minutiae cylinder code representation associates a local struc-ture with each minutiae. This structure encodes spatial and directional rela-tionships between the minutiae and its (fixed-radius) neighborhood and canbe conveniently represented as a cylinder whose base and height are relatedto the spatial and directional information, respectively.(from [CFM10])
Because of the different minutiae/feature extractors and databases used
for above matching methods, it is difficult to compare the performance
of each method at the same bench mark. Recently, the trend of matching
methods is combining different levels of features. Though fingerprint match-
ing has been extensively researched, how to design a reliable and accurate
matching algorithm is still an on-going challenge. In summary, an excellent
matching algorithm should have good tolerance to image noise, non-linear
distortion and feature extraction errors.
2.5 Matching Metrics to Evaluate a Finger-
print Recognition System
There are two types of comparisons between fingerprints in fingerprint recog-
nition. When a pair of fingerprints from the same finger is compared, it is
named as intra-class comparison. If two fingerprints are from different fin-
63

gers, then this type of comparison is named as inter-class comparison. The
purpose of fingerprint recognition techniques is to increase the similarities in
the intra-class comparisons and amplify the dissimilarities in the inter-class
comparisons. If an intra pair of fingerprints is considered as a non-match by
a fingerprint recognition system, then this match is called false non-match
error. If an inter pair of fingerprint is considered as a match, this match is
called false match error.
False non-match rate (FNMR) and false match rate (FMR) are two
main metrics to evaluate the matching accuracy of a fingerprint recognition
system. Figure 2.21 shows the matching score distributions of intra-class
matching (genuine user profile) and inter-class matching (impostor profile).
The difficulty is that the range of matching score produced by two query
individuals, one genuine and one impostor, compared to a registered tem-
plate, are likely to overlap. Hence a threshold t is selected to decide whether
two fingerprints are a match or not. For a given threshold t, if the matching
scores of genuine pairs are smaller than t, then these pairs are considered
to be a false non-match. The FNMR is the percentage of pairs in the gen-
uine distribution whose matching scores are smaller than t. If the matching
scores of impostor pairs are larger than t, then these pairs are false matched
with genuine users. And the FMR is the percentage of pairs in the impostor
distribution whose matching scores are larger than t.
64

Figure 2.21: Matching score distributions between impostor profile (inter-class) and genuine user profile (intra-class). If the matching scores aregreater than a preassigned threshold t, then we call these templates andquery templates matched (from [SB11]).
The metrics for the evaluation of a fingerprint recognition system include
the following [?]:
• False match rate (FMR): It is also named as false acceptance rate
(FAR) in biometrics. It refers to the probability that the system in-
correctly matches the input pattern to an impostor template in the
database. It measures the percent of invalid inputs which are incor-
rectly accepted. In case of similarity scale, if the person is impostor in
real, but the matching score is higher than the threshold, then he is
treated as genuine that increase the FAR and hence the performance
65

also depends upon the selection of threshold value.
• False non-match rate (FNMR): It is also named as false reject
rate (FRR). It refers to the probability that the system fails to detect
a match between the input pattern and a genuine template in the
database. It measures the percent of valid inputs which are incorrectly
rejected.
• Equal error rate (EER):It refers to the rate at which both false
accept and false reject errors are equal (the matching error rate when
FMR = FNMR). The value of the EER can be easily obtained from
the ROC (receiver operating characteristic) curve. The EER is a quick
way to compare the accuracy of matching methods with different ROC
curves. In general, the matching methods with the lowest EER is most
accurate.
• FMR100: the lowest FNMR for FMR <= 1%.
• FMR1000: the lowest FNMR for FMR <= 0.1%.
• ZeroFMR: the lowest FNMR for FMR = 0%.
FMR and FNMR are usually used to indicate the accuracy of a biometric
system. Different systems have different requirement for FMR and FNMR.
For example, in a fingerprint criminal identification system, the police offi-
cer would like to shortlist all possible criminals for that single fingerprint,
then this system needs a sufficient low value of FNMR. Thus, the potential
criminal may not escape from this identification system. In another case, in
a high security authentication system, the FMR should be sufficiently low
so that a masquerader will not be granted access to the system. FMR100,
66
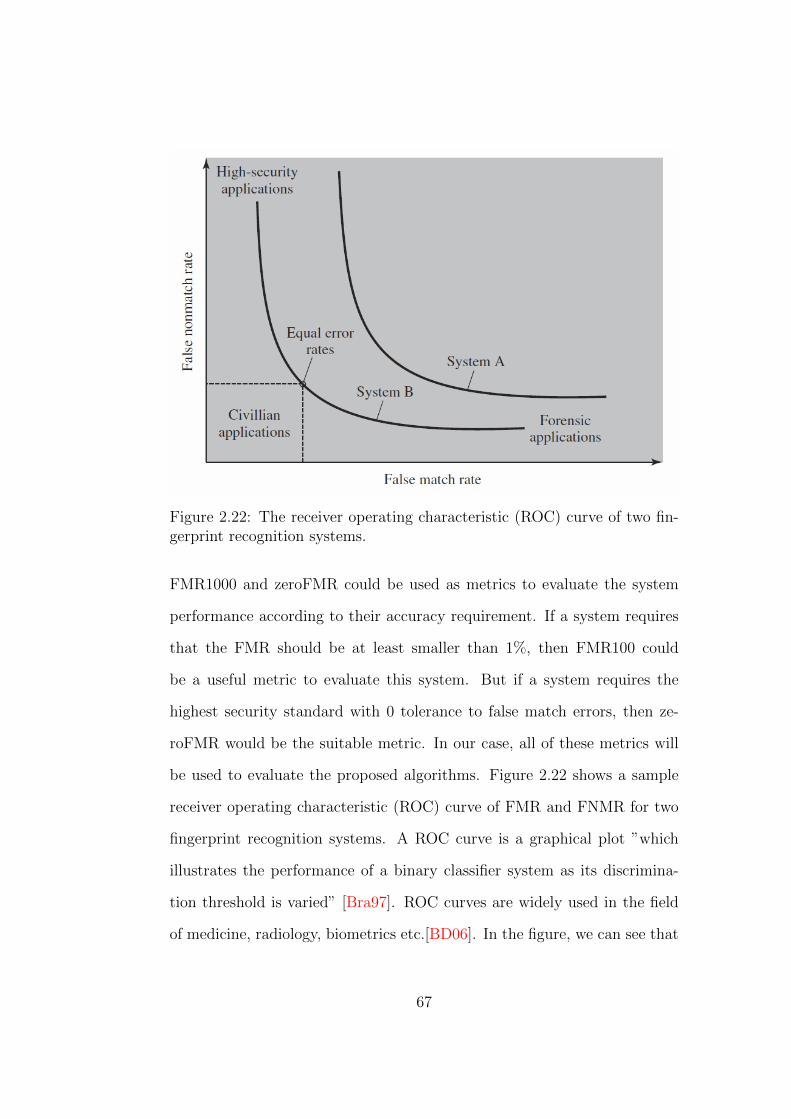
Figure 2.22: The receiver operating characteristic (ROC) curve of two fin-gerprint recognition systems.
FMR1000 and zeroFMR could be used as metrics to evaluate the system
performance according to their accuracy requirement. If a system requires
that the FMR should be at least smaller than 1%, then FMR100 could
be a useful metric to evaluate this system. But if a system requires the
highest security standard with 0 tolerance to false match errors, then ze-
roFMR would be the suitable metric. In our case, all of these metrics will
be used to evaluate the proposed algorithms. Figure 2.22 shows a sample
receiver operating characteristic (ROC) curve of FMR and FNMR for two
fingerprint recognition systems. A ROC curve is a graphical plot ”which
illustrates the performance of a binary classifier system as its discrimina-
tion threshold is varied” [Bra97]. ROC curves are widely used in the field
of medicine, radiology, biometrics etc.[BD06]. In the figure, we can see that
67

high security applications require low FMRs. And forensic applications re-
quire low FNMRs. But EER is the metric to evaluate the overall accuracy,
so a fingerprint with low EER is suitable for civilian applications.
2.6 Databases for Experiments
Fingerprint Verification Competition(FVC) databases [MMC+02, MMC+04,
FOTG07] are used for performance evaluations of designed fingerprint recog-
nition techniques in this thesis. FVC aims to track performance of state-
of-the-art fingerprint matching algorithms. The FVC databases are widely
accepted by researchers currently. Thus it is possible to compare the results
of research in this field across the whole scientific community.
Specifically, in FVC2002 databases, the acquisition conditions were the
same for each database which are: interleaved acquisition of different fingers
to maximize differences in finger placement, no care was taken in assuring
a minimum quality of the fingerprints and the sensors were not periodically
cleaned. During some sessions, individuals were asked to: a) exaggerate dis-
placement or rotation or, b) dry or moisten their fingers [AFF09]. Therefore,
the fingerprint images in these databases contain plenty of variations and
noise, which means that they are specially suitable for the evaluations of
fingerprint recognition algorithms. Table 2.4 shows the specification of the
databases used to evaluate the performance of our algorithms in this thesis.
Some sample fingerprint images with different levels of quality are provided
in Appendix A.
68

Table 2.4: The specifications of the FVC databases used in this thesis. Inthe column of image numbers, the first number indicates the number offingerprint groups in which the fingerprints are from the same finger, andthe second number indicates the number of fingerprint images in each group.
Database Image
numbers
Image size Image
resolution
Sensor
FVC 2002 DB1a 100*8 388*374 500 Optical Sensor
FVC 2002 DB2a 100*8 296*560 569 Optical Sensor
FVC 2002 DB3a 100*8 300*300 500 Capacitive
Sensor
FVC 2002 DB4a 100*8 288*384 500 SFinGe v2.51
[Mal04]
FVC 2006 DB2a 140*12 400*560 569 Optical Sensor
2.7 Conclusion
This chapter explores the literature of all aspects of a fingerprint recogni-
tion system. Firstly, we have described the characteristics of fingerprint as
a biometric, and have discussed the importance of fingerprint recognition.
Secondly, we have introduced the fingerprint features in detail, and the fac-
tors which cause the fingerprint variations during the feature extraction.
Thirdly, components of feature extraction and matching are introduced and
discussed. These components include fingerprint segmentation, local orien-
tation and frequency estimation, contextual filtering, minutiae extraction,
fingerprint alignment and matching. Finally, the databases and commonly
used metrics by researchers for experimental evaluations are also described.
69

In this chapter, we have summarized the existed issues and challenges
in each component of fingerprint feature extraction and matching. Though
every component could be further improved by addressing these issues, our
research focuses on three major challenges which are: (i), designing a fin-
gerprint image pre-processing method which enables successive contextual
filtering (e.g. Gabor filtering) to perform with improved results, and ul-
timately makes possible enhanced feature (e.g. minutiae) extraction; (ii),
designing a reliable singular point detection method with a high correct
detection rate of singular points, so that the detected singular points can
be used as reference points for fingerprint alignment or for fingerprint clas-
sification in a fingerprint identification system; (iii), designing a reliable
fingerprint matching method which is accurate and has a high tolerance to
noise and feature extraction error. How to achieve the above three objec-
tives is the focus of this thesis. This thesis will address each of research
objectives above, and design and develop unique solutions and with exper-
imental results to show how the above major issues have been dealt with.
In the next chapter, we will address the first research objective, which
aims to improve the performance of the image pre-processing stage in fin-
gerprint recognition, and enables successive contextual filtering (e.g. Gabor
filtering) to perform with improved results, and ultimately makes possible
enhanced feature (e.g. minutiae) extraction. A new image pre-processing
method is proposed in order to address the issue that the current fingerprint
image pre-processing techniques only focus on the image contrast enhance-
ment instead of improving the clarity of ridge and valley structures. The
initial purpose of image pre-processing is to uniformly distribute the in-
tensity values into the selected range, and then the resultant images could
70

become the input of the contextual filtering stage. Thus, current image pre-
processing method focus on normalize the image intensities into a selected
intensity range rather than noise reduction and image quality improvement.
In our opinion, image pre-processing could play a more important role in
fingerprint image enhancement, which may improve the performance of sub-
sequent contextual filtering stage, and ultimately to improve the feature
extraction results.
71

Chapter 3
Image Pre-processing for
Image Quality Enhancement
In the previous chapter, we have reviewed the techniques used for finger-
print recognition, and have identified three major research challenges in
fingerprint recognition which need to be addressed in this work, which are:
(i), designing a fingerprint image pre-processing method which enables suc-
cessive contextual filtering (e.g. Gabor filtering) to perform with improved
results, and ultimately makes possible enhanced feature (e.g. minutiae) ex-
traction; (ii), designing a reliable singular point detection method with a
high correct detection rate of singular points, so that the detected singular
points can be used as reference points for fingerprint alignment or for fin-
gerprint classification in a fingerprint identification system; (iii), designing
a reliable fingerprint matching method which is accurate and has a high
tolerance to noise and feature extraction error.
In this chapter, we will address the research challenge with respect to
fingerprint image pre-processing. Image pre-processing aims to pre-process
72

the image to allocate the pixel intensities into the desired range, and then
to obtain a better image contrast [MMJP09]. Image pre-processing is nec-
essary in fingerprint recognition, because the distribution of grey level in-
tensities of fingerprint images may fall in the different ranges (due to the
variations during the fingerprint capturing stage and the differences in fin-
gerprint scanners). And the resultant images of image pre-processing are
the input to the subsequent contextual filtering stage. The major limitation
of current fingerprint image pre-processing techniques (e.g. normalization
[HWJ98] and adaptive normalization [KP02] techniques) is that they only
focus on the image contrast enhancement instead of improving the clarity
of ridge and valley structures. In our opinion, image pre-processing could
play a more important role in fingerprint image enhancement besides the
image contrast improvement, which may improve the performance of sub-
sequent contextual filtering stage, and ultimately to improve the feature
extraction results. This chapter proposes a method which addresses the
above limitation of current image pre-processing techniques. This method
is developed based on the analysis of histograms of fingerprint images from
FVC 2002 databases. All pixels in a fingerprint image could be separated
into three grey level ranges, which are: (i), ridge areas; (ii), valley and
background areas; and (iii), the possible noise area and the edges between
ridge and valleys. The proposed method is able to separate these three
areas automatically, and then three designed equations are applied to these
three intensity ranges, respectively, to improve the clarity of ridge and valley
structures. This method is able to normalize the fingerprint image to a fixed
range of intensities, and to enhance the clarity of ridge/valley structures,
especially for wet and smudged fingerprint images.
73

This chapter is organized as follows: First, an overview of the research
problem is described. Then, the procedure of the proposed method is de-
scribed in detail. Finally, the experimental results are also provided and
discussed to demonstrate the effects of this algorithm.
3.1 Overview
Image pre-processing in fingerprint recognition is also called pixel-wise en-
hancement which refers to assigning a new value to each pixel depending
on its previous value and some parameters (e.g. mean intensity and in-
tensity variance) [MMJP09]. Thus, this stage belongs to image processing
measures in the spatial domain. Pixel-wise techniques act as an initial pro-
cessing stage followed by a further image enhancement algorithm (referring
to contextual filtering techniques).
Recent research in the area of fingerprint pre-processing has been intro-
duced in Section 2.4.2 including one of the most popular image-processing
methods called normalization [HWJ98, KP02, HB12]. However, normaliza-
tion and other current fingerprint image pre-processing methods only aims
to enhance the image contrast instead of noise reduction and image quality
enhancement. The basic reason for not proposing any noise reduction tech-
niques in this stage is because that the subsequent context filtering stage
is able to handle the noise removal task in normal circumstance. However,
in some cases, especially when the fingerprint is scanned in a wet/smudged
condition, solely using the context filtering techniques may not perform
well, as shown in Figure 3.1. This figure shows an example of fingerprint
image processing by Gabor filtering on a wet type fingerprint. Figure 3.1a
74

is a fingerprint image sample from the FVC2002 database DB3a. This
image is noisy between ridge lines. Figure 3.1b is the binarized image af-
ter applying the Gabor filtering technique and the segmentation technique
([HWJ98, WBGS10]). The binarized image contains several spurious is-
lands and incorrect joint points between ridge lines. This is because the
Gabor filtering technique cannot eliminate the influence of noise at this
level. It consequently reduces the accuracy of feature extraction which will
directly influence the matching accuracy. Therefore, some solutions need
to be implemented to address this problem. Current solutions are more
focused on the post-processing of binarized images and minutiae extrac-
tion (see Section 2.4.6). A appropriate post-processing method will signif-
icantly reduce the influence of noise. But if we can reduce the noise level
in the image pre-processing stage, the result may be better than only using
post-processing techniques. Ultimately, it will improve the final fingerprint
matching accuracy, because the feature extraction is more reliable if more
noise is eliminated.
3.2 Proposed algorithm for enhancement of
fingerprint images
In this section, we will first introduce two background techniques, used
in the proposed image pre-processing method, which are power-law trans-
formation and contrast stretching. Power-law transformation and contrast
stretching are image processing techniques used for control image bright-
ness and image contrast, respectively. In this research, the proposed image
75

pre-processing algorithm is designed based on the above two techniques in
order to improve the clarity of fingerprint ridge and valley structure. Gabor
filtering and binarization techniques are also implemented to show the effect
of this image pre-processing method. Because image processing techniques
aim to enhance the image quality and make possible reliable feature (mainly
minutiae) extraction (which normally extracted from binarized images) in
the subsequent minutiae extraction stage, the clarity of the obtained bina-
rized images may determine the accuracy of minutiae extraction, which will
ultimately influence the fingerprint matching accuracy. Therefore, evalua-
tion of obtained binarized fingerprint images which are obtained after the
contextual filtering stage is able to demonstrate the advancement of this
image pre-processing method.
3.2.1 Power-law transformation and contrast stretch-
ing
Power-law transformation and contrast stretching are techniques used in
digital image processing to improve the contrast and brightness of an image
[GW01]. The equation of power-law transformation is as follows [GW01]:
s = crγ (3.1)
where s is the output grey level, r is the input grey level, c and γ are positive
constants used to control the shape of the transformation.
When γ < 1, a narrow range of dark input intensity values map into
a wide range of output values. It means that the output image becomes
brighter than the input image. When γ > 1, the effect of the generated
76

curve is opposite of the curve obtained when γ < 1. Therefore, power-
law transformation controls the brightness of the output image by selecting
different values of γ. Figure 3.2 shows the plots of power-law transformation
with c = 1 and different values of γ. In the proposed approach, power-law
transformation is not applied uniformly to the entire input image but to
parts of the image with a specific range of intensity value. This approach
will be described in next section.
Contrast stretching is a linear function which can increase the contrast of
an image [GW01]. Due to its linear property, this transformation does not
lose data information other than intensity values. Figure 3.3 shows typical
contrast stretching where L is the grey level of an image and is equal to
256, r is the input pixel intensity, s is the output pixel intensity, (r1, s1) and
(r2, s2) are two points that control the shape of the transformation [GW01].
the The following equation is used in contrast stretching:
s =
rs1r1
if r < r1
(s2 − s1)r(r2 − r1)
+(s1 − s2)r1(r2 − r1)
if r1 < r < r2
(L− 1− s2)rL− 1− r2
+(L− 1− s2)(L− 1)
L− 1− r2if r2 < r < L− 1
(3.2)
Because the input intensity in the range of [r1, r2] is mapped to a wider
range [s1, s2], the contrast of an image is improved. However, two pairs of
points (r1, s1) and (r2, s2) have to be moderately selected, and their best
values depend on different images, which make implementation challenging.
Normally, the selection of (r1, s1) and (r2, s2) is based on the observation of
image histograms. Contrast stretching could be used for image normaliza-
tion as well [GW01]. In particular, if we select s1 = 0 and s2 = 255, and r1
77

and r2 as the 5th and 95th percentile in the histogram, respectively (that
is, 5% of the pixel in the histogram will have values lower than r1, and 5%
of the pixels will have values higher than r2), then the image is normalized
after this transformation (that is, 10% of pixels are saturated to prevent
outlying pixels). Contrast stretching and power-law transformation have
been widely used for adjusting the contrast and brightness in digital image
processing [GW01]. Based on them, we develop a new equation to reduce
noise and enhance fingerprint images. The next section illustrates how this
algorithm works.
Figure 3.2: Plots of power-law transformation with different values of γ.
78

Figure 3.3: Plots of typical contrast stretching, where r denotes the inputgrey levels (the x -axis), and s denotes the output grey levels (the y-axis)
3.2.2 Proposed algorithm for fingerprint image en-
hancement
Analysing the histogram of fingerprint images of FVC2002 databases has
led to the proposed algorithm. An image histogram is a graphical repre-
sentation of the tonal distribution in a digital image [GW01]. Thus, a grey
level fingerprint image’s histogram indicates the distribution of grey levels.
Figure 3.4 shows the histogram of Figure 3.1a. We can see that two peaks in
this histogram around grey level 40 and 100 along the x-axis roughly divide
the grey level into three parts. The first part can be regarded as the grey
levels of ridges, and the second part as the grey levels of edges of ridges
and noise, while the last part is the grey levels of the valleys and back-
ground. This is because the intensities of a grey scale fingerprint image can
79

be roughly classified into two parts which are ridge and non-ridge. Normally
noise is darker than background but brighter than ridge lines, which means
it has lower intensity values than the background but has higher intensity
values compared to ridges lines. Though in some cases, like in latent finger-
prints, there are some other non-ridge components like handwriting (seen
in Figure 2.10) other than naturally generated noise existing in fingerprint
images. However, these circumstances are not considered in this work, as
normally these non-fingerprint areas are unreliable and can be separated
from the fingerprint image by segmentation techniques.
Figure 3.4: Histogram of fingerprint image from Figure 3.1a.
Based on the above observation and analysis, we construct a new equa-
80

tion to improve fingerprint images as follows:
s =
rs1r1
if r < r1
(s2 − s1)rγ
(rγ2 − rγ1 )
+s1r
γ2 − s2r
γ1
rγ2 − rγ1
if r1 < r < r2
L− 1 if r2 < r < L− 1
(3.3)
where we apply power-law transformation between (r1, s1) and (r2, s2), and
we set s2 = 255, then the input values bigger than r2 are clipped because
we regard this part as valley and background regions.
The three parts of equation 3.3 are applied to three different ranges of
input grey levels as shown in Figure 3.4. Figure 3.5 shows the plots of
the proposed algorithm with γ < 1. This algorithm is similar to contrast
stretching except that non-linear transformation is applied in the middle
part. That is because contrast stretching can improve the contrast of a
fingerprint image, but it does not change the data information except the
intensity values. Therefore, information about noise is still kept by apply-
ing contrast stretching. By applying power-law transformation, the noise
level can be reduced better than with linear transformation, by selecting γ
according to the noise level. The implementation of our algorithm is shown
in the following steps:
(i) Firstly, a typical contrast stretching is performed in order to distribute
grey levels of an image to [0, 255]. That is because not all fingerprint
images occupy the full grey levels of [0,255] as shown in Figure 3.4.
It is performed by applying equation 3.2 as r1 = min(r), s1 = 0,
r2 = max(r) and s2 = 255. Note 5% of the data is first saturated at
low and high grey levels of the original image in order to remove the
81

interference caused by such a small amount of pixels.
(ii) We then apply the algorithm on the remaining image, block by block,
with a block size of 16x16. The reason we process the image block by
block is that there are different levels of noise even in one fingerprint
image. Therefore, different values of parameters can be selected for
different blocks in order to obtain an improved result. The rules of
parameter estimation are introduced in the next section. Figure 3.6
shows the result of our approach with r1 = s1 = 50, r2 = 160 and
γ = 1. Note that this image is segmented to mask the non-ridge and
non-valley areas.
Figure 3.5: Plot of equation 3.3 with γ < 1.
82
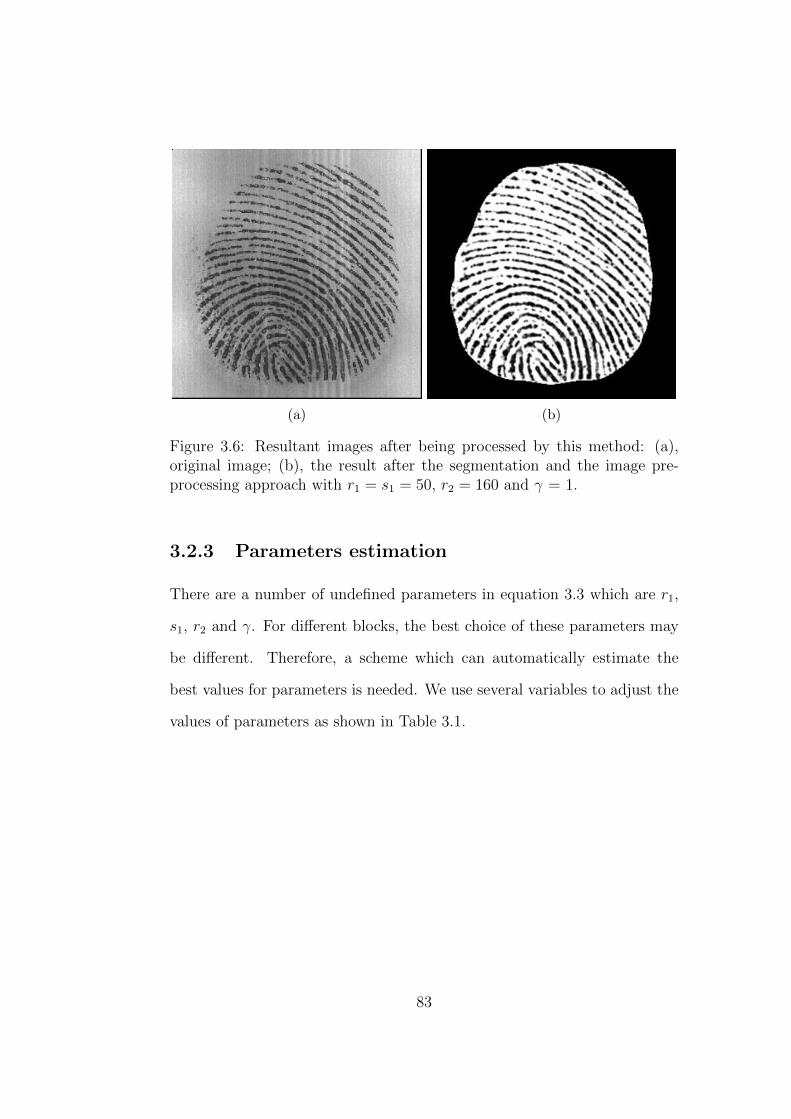
(a) (b)
Figure 3.6: Resultant images after being processed by this method: (a),original image; (b), the result after the segmentation and the image pre-processing approach with r1 = s1 = 50, r2 = 160 and γ = 1.
3.2.3 Parameters estimation
There are a number of undefined parameters in equation 3.3 which are r1,
s1, r2 and γ. For different blocks, the best choice of these parameters may
be different. Therefore, a scheme which can automatically estimate the
best values for parameters is needed. We use several variables to adjust the
values of parameters as shown in Table 3.1.
83
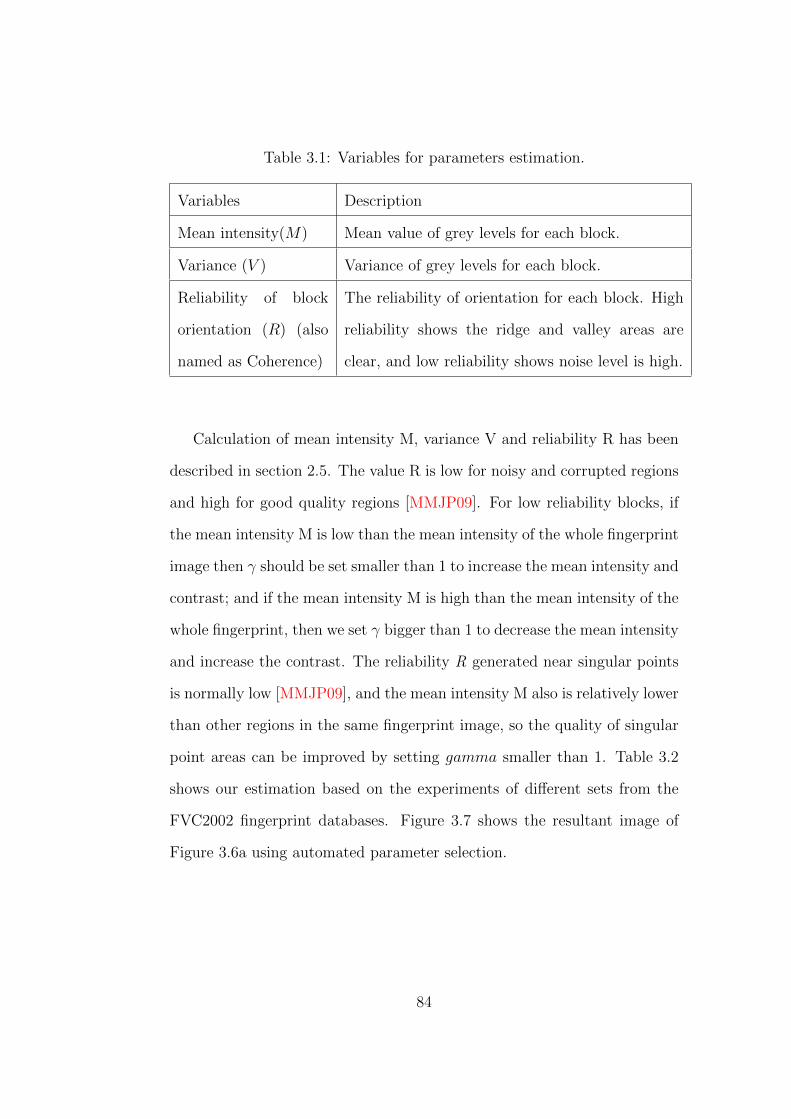
Table 3.1: Variables for parameters estimation.
Variables Description
Mean intensity(M) Mean value of grey levels for each block.
Variance (V ) Variance of grey levels for each block.
Reliability of block
orientation (R) (also
named as Coherence)
The reliability of orientation for each block. High
reliability shows the ridge and valley areas are
clear, and low reliability shows noise level is high.
Calculation of mean intensity M, variance V and reliability R has been
described in section 2.5. The value R is low for noisy and corrupted regions
and high for good quality regions [MMJP09]. For low reliability blocks, if
the mean intensity M is low than the mean intensity of the whole fingerprint
image then γ should be set smaller than 1 to increase the mean intensity and
contrast; and if the mean intensity M is high than the mean intensity of the
whole fingerprint, then we set γ bigger than 1 to decrease the mean intensity
and increase the contrast. The reliability R generated near singular points
is normally low [MMJP09], and the mean intensity M also is relatively lower
than other regions in the same fingerprint image, so the quality of singular
point areas can be improved by setting gamma smaller than 1. Table 3.2
shows our estimation based on the experiments of different sets from the
FVC2002 fingerprint databases. Figure 3.7 shows the resultant image of
Figure 3.6a using automated parameter selection.
84

Table 3.2: Estimation of parameters in equation 3.3.
Parameter Rules of estimation
r2 selectionif M > 200, r2 = M + V ;
else if 150 < M <= 200, r2 = M + V/2;
else if 128 < M <= 150, r2 = M ;
else if M <= 128, r2 = M − V/2;
r1 and s1 selec-
tion
r1 = max(M − V, 25);
s1 = r1;
γ selectionif M >= 200, γ = 1.2;
else if R >= 0.7, γ = 1;
else if R <= 0.5, γ = 0.5;
else if 0.5 < R < 0.7 & M > 150, γ = 1.2;
else if 0.5 < R < 0.7 & 100 <= M <= 150, γ = 0.8;
else if 0.5 < R < 0.7 & M < 100, γ = 0.6;
85

(a) (b)
Figure 3.7: Resultant images after being processed by our method by auto-mated parameter selection. (a) is the original fingerprint image, and (b) isthe resultant image.
3.2.4 Result of Gabor filtering and binarization
We divide the image into 16x16 blocks and calculate the average orientation
and frequency of each block as input to the Gabor filter. Then, a Gabor
filter bank of 60 filters with angle increment of 3 degrees is designed for
image processing. For each block, the block is convoluted with a Gabor
filter with a chosen angle from the designed Gabor filter bank. The details
of Gabor filtering and binarization techniques are described in Section 2.4.4.
Figure 3.8 shows a sample result after applying Gabor filtering technique
to Figure 3.7b.
86

Figure 3.8: Gabor filtering and binarization of the sample fingerprint imagein Figure 3.7b.
Figure 3.9a is a original noisy fingerprint image which is also an intra-
class (from the same finger) fingerprint of the image in Figure 3.7a. Figure
3.9b is the resultant image after applying our method to the original image,
and Figure 3.9d is the resultant image after Gabor filtering and binarization.
By comparing Figure 3.9c and 3.9d, the latter image is much clearer and
has less spurious islands. After applying our method, the binarized noisy
sample image is almost the same as the fine sample image as shown in Figure
3.8. The result shows that much of the noise has been removed and ridges
and valleys are smoother and clearer, so that the detected minutiae will be
more reliable since many spurious minutiae have been removed.
87

(a) A noisy image (b) After image processing
(c) Without the proposed method (d) With the proposed method
Figure 3.9: Gabor filtering and binarization of a noisy and smudged samplefingerprint after applying our image pre-processing method: (a), the orig-inal image with corrupted fingerprint areas; (b), the resultant image afterapplying our image pre-processing method; (c), Gabor filtering and bina-rization without the proposed image pre-processing method; d), binarizedimage with our image pre-processing methods. The red squares show theimproved areas by our method.
88

3.3 Experimental results
Database DB3a of FVC2002 is used to evaluate the result of this ap-
proach. This sub-database contains more wet type fingerprints than any
other databases in the FVC 2002 databases. For good quality fingerprint
images such as in Figure 3.7a, an image quality enhancement is not required.
However, when the noise level is high, our proposed approach can signifi-
cantly reduce the noise level and improve the accuracy of further minutiae
detection as shown in Figure 3.9. More examples are shown in Figure 3.10.
The left column shows the noisy original images, the middle column shows
the binarized images without applying our method and the right column
shows the resultant images after applying our image precessing method.
We can see that our method is able to remove noise significantly on those
wet type and noisy fingerprint images.
We also use a goodness index (GI) [CDJ05] to evaluate the performance
of this proposed approach. The GI is defined by Chen et al. [CDJ05] as
follows:
GI =p
t+a+ b
u(3.4)
where p represents the total number of paired minutiae and t represents
the ground truth minutiae in a given fingerprint image; a and b are the num-
ber of missed and spurious minutiae respectively, and u is the total number
of detected minutiae. GI indicates the minutiae extraction accuracy after
the image processing. If a GI value is high, then it indicate the minutiae
extraction accuracy is high. GI is a expert based method to evaluate the
image quality after the image enhancement [CDJ05]. Hence normally only
a small number of fingerprint samples are selected for evaluation.
89

We calculate GI by applying our fingerprint image pre-processing method
to 20 random selected sample fingerprints in DB3a of FVC2002 containing
both high and poor quality images. Table 3.3 shows the results of GI by com-
paring our proposed method with traditional approaches that use the nor-
malization techniques [HWJ98, KP02]. Thus, GI is adopted by researchers
(e.g. [ZT07, ZGLR01, ZT07, BL10]) to evaluate the performance of finger-
print image processing techniques. From this table, we can see that our
proposed approach followed by Gabor filtering technique can detect minu-
tiae more accurately than the traditional Gabor filter based approaches and
can improve the performance by 9% on average. Especially, our proposed
approach can improve the accuracy of minutiae detection of poor quality
fingerprint images, such as sample 4 and 12 in which the GI is enhanced
by more than 40%. Table 3.4 shows the comparison between our proposed
approach and other approaches. The average GI is 0.69 which is better than
other other reported results in Table 3.4, and it is about 14% improvement
over other methods. However, GI computation is conducted manually by
an expert, that means human errors are inevitable. Furthermore, the sam-
ples selected for experiments are also different in different research (in Table
3.4, which introduces the difficulty to do a comparison. However, several
very poor quality images (refer to Figure 3.10) are used for evaluation for
our method, which indicates that our method is superior than the meth-
ods in Table 3.4. Besides, we also provide the fingerprint matching results
by incorporate this method into a simple fingerprint verification system in
Chapter 5.
The advantages of this image pre-processing method could be summa-
rized as follows:
90

• This method avoids complex computation such as the successive Ga-
bor filtering technique, but utilizes the characteristic of grey level
distribution of ridges and valleys. Different equations apply to the
ridge and valley areas respectively to reduce the noise.
• This method can effectively improve the image quality of wet or
smudged fingerprints (refers to the samples in Figure 3.10)
• This method will retain the important information of ridges and val-
leys of good quality images as shown in Figure 3.8.
• The values of parameters in this method are automatically selected
according to the designed parameter selection scheme. It is suitable
to process fingerprint images scanned by 500dpi (The standard used
in FVC 2002 databases).
Table 3.4: Comparisons between other approaches and our proposed ap-proach
Methods Minimum GI Maximum GI Average GI
Hong et al. [HWJ98] 0.29 0.55 0.39
Zhao and Tang [ZT07] 0.18 0.75 0.50
Simon-Zorita et al. [ZGLR01] 0.33 0.76 0.55
Bhattacharjee and Lee [BL10] 0.31 0.75 0.55
Proposed 0.48 0.84 0.69
91

Table 3.3: Comparison of the GI results without and with our methodrespectively, based on Gabor filtering techniques.
Image No.Goodness Index
Traditional approach based on Proposed approachGabor filtering without our method
1 0.60 0.602 0.65 0.653 0.75 0.674 0.29 0.505 0.72 0.796 0.71 0.717 0.79 0.698 0.56 0.489 0.74 0.7210 0.60 0.7511 0.50 0.6812 0.43 0.8313 0.42 0.6814 0.55 0.8415 0.67 0.7216 0.49 0.5917 0.69 0.7218 0.72 0.7819 0.40 0.7020 0.74 0.72
Average 0.60 0.69
3.4 Conclusion
In this chapter, we have presented a new image pre-processing approach,
which is able to improve the clarity of ridge and valley structures in a fin-
gerprint image. This approach is able to improve the image contrast as well
as to remove noise and unnecessary information, such as valueless ridges,
which often exist on wet/smudged fingerprints. Furthermore, the values
of parameters in this method are automatically selected by the parameter
92

selection scheme, which is designed based on the experimental observation
and analysis on FVC 2002 databases. The experimental results show that
this approach can effectively improve the quality of fingerprint images es-
pecially for wet and smudged fingerprint images. The GI is improved by
9% by using this image pre-proessing method before the contextual filter-
ing stage in our experiment. The experimental results also indicate that
removing adequate noise in image pre-processing stage enables the subse-
quent image processing stage (Gabor filtering) to have a better enhancement
result, which ultimately improves the performance of feature extraction and
matching.
In the next chapter, we will address the second research objective of this
work, which aims to design accurate and reliable singular point detection
techniques. Because most of current detection methods produce numer-
ous spurious singular points depending on the quality of fingerprint images
and detection techniques used. The limitations of current singular point
detection techniques include: (i), the correct detection rate of current sin-
gular point detection methods are not high (normally around 90%); (ii),
various image qualities still limit the extraction accuracy. We believe sin-
gular point detection and extraction need to be further investigated since
the accuracy of detection is not satisfactory in particular for poor quality
images. The major challenge of singular point detection is how to remove
spurious singular points but retain genuine singular points. Therefore, two
different singular point detection methods are proposed in order to address
this challenge in the next chapter.
93

(a) (b)
Figure 3.1: An example of fingerprint image processing results using theGabor filtering and binarization technique: (a), original fingerprint image isfrom FVC 2002 database; (b), the processed fingerprint after Gabor filteringand binarization. The clarity of the ridge and valley structure is not highin this image, especially the area inside the red square.
94

(a) (b) (c)
(d) (e) (f)
Figure 3.10: Two groups of samples, the left column shows the noisy originalimages, the middle column shows the binarized images without applyingour fingerprint image pre-processing method and the right column showsthe resultant images after our fingerprint image pre-processing method.
95

Chapter 4
Reliable Singular Point
Detection
In the previous chapter, we have addressed the issue in fingerprint image pre-
processing stage, and presented a method to improve the image quality. This
image pre-prcessing method is able to improve the image contrast as well
as to remove noise and unnecessary information, such as valueless ridges,
which often exist on wet/smudged fingerprints. The experimental results
show that the Goodness Index (GI) is improved by 9% after applying this
method. In this chapter, we will address the research objective of reliable
singular point (SP) detection.
SP is an important feature in fingerprint recognition. SPs could be used
for fingerprint alignment as reference points to superimpose two fingerprints
as well as for fingerprint classification (to determine the fingerprint types).
Reliable and accurate SP detection is important in some fingerprint match-
ing methods, because these matching methods are based on fingerprint pre-
alignment, which uses SPs as reference points. Furthermore, reliable and
96

accurate SP detection is also important in a fingerprint identification sys-
tem, because most reported fingerprint classification systems use SPs to
identify the fingerprint types (e.g. left loop, right loop, whorl and arch type
fingerprints) [AM09, AG14]. SPs can help in reducing the search time and
space in large databases by classifying the fingerprints into different types
[KJ96, AB12]. An accurate classification algorithm may also play a role
in speeding up the matching process by quickly rejecting different types
of fingerprints. Therefore, SP detection techniques are important to fin-
gerprint recognition, and reliable and accurate SP detection techniques are
able to improve the performance of a fingerprint recognition system. How-
ever, current SP detection techniques suffer the problem that the correct
detection rate of SPs is relatively low, mostly around 90% or even lower
(e.g. [NB05, ZGZ07, LML13]), due to various reasons (e.g. noise, partial
fingerprint and displacement).
In this chapter, two different singular point (SP) detection approaches
have been developed to address this research issue. The first SP detection
approach proposed in this work uses the Poincare Index based method for
SP detection, then a post-processing procedure is designed to remove spu-
rious SPs, in order to increase the correct detection rate. The experimental
results show that it significantly increases the correct detection rate of SPs
compared to the original and other Poincare Index based methods. How-
ever, Poincare Index based techniques have the inherent disadvantages of
containing numerous spurious singular points. This is because the Poincare
Index based techniques try to detect the singular point locally (searching
them from the whole image blockwisely) instead of treating them as global
features. Therefore, we have designed the second method, a new singular
97

point detection method based on the analysis of the local ridge orientation
field. This method detects singular points by analyzing the global structure
of the local ridge orientation field. This method obtains better experimental
results than the designed Poincare Index based method.
This chapter is organized as follows: Firstly, the improved Poincare
Index based approach is described including the experimental results. Fur-
thermore, the new SP detection approach based on analysis of the local
ridge orientation map is introduced. Subsequently, the experimental results
and discussions are provided. The final section is the conclusion of this
chapter.
4.1 A Rule Based Post-processing Method
for Poincare Index Based SP Detection
In this approach, a Poincare Index value calculation is performed on the lo-
cal ridge orientation map to detect the SPs, then the calculation is followed
by two techniques to validate the detected SPs. One validation technique
is based on segmentation which shields the non-ridge/valley areas and the
second is based on smoothing the gradient field to prevent false SPs. Fur-
thermore, a rule based approach is used to post-process the detected SPs.
4.1.1 Poincare Index implementation
Before describing the Poincare Index calculation, local ridge orientation map
needs to be computed, and core/delta points are two forms of convergence of
oriented ridge lines. The local ridge orientation θ(i, j) at pixel (i, j) refers to
98

the angle of which the ridge crosses through a small neighborhood with the
horizontal axis. It is generated by calculating the gradient of the intensity
values of a fingerprint image [KW87, BG02]. The details of the local ridge
orientation calculation has been described in Section 2.4.3. Figure 4.1 shows
the result of local orientation estimation, where Figure 4.1a is a fingerprint
image and Figure 4.1b is the plot of orientation. Figure 4.1c indicates the
detected SPs where red circles and blue triangles refer to the core and delta
points, respectively, using Poincare Index calculation.
(a) (b) (c)
Figure 4.1: The local ridge orientation of a fingerprint image: (a), theoriginal image; (b), plot of orientation of (a); and (c): the result of SPs de-tection without smoothing of gradient field and other validation techniques(red circles denote core points and blue triangles denote delta points).
The calculation of the Poincare Index values is based on the local ridge
orientation of a fingerprint. According to [MMJP09], the Poincare Index
values of a core point, delta point and normal ridges are 1/2,−1/2 and 0,
respectively. Figure 4.2a, 4.2b and 4.2c show the orientation of a core point,
delta point and normal ridges. Let d1,2...8 denote the directions of 8 pixels
anti-clockwise around the pixel (i, j), its Poincare Index value of (i, j) may
99

be computed as:
Poincare(i, j) = 1/2π∑k=1...8
angle(dk, dk+1mod 8) (4.1)
(a) (b) (c) (d)
Figure 4.2: The orientation map of a: (a), core point; (b), delta pointand (c), normal ridges. (d) is the designed four directions to calculate thePoincare Index value.
In implementation, four directions of ridge lines are used to calculate
Poincare Index values as shown in Figure 4.2d. It means that the orientation
of each pixel will be assigned the value of the closest direction. Figure 4.1c
shows the result of SPs detection without any smoothing techniques, in
which red circles and blue triangles denote core points and delta point.
respectively. We can see that the result is far from satisfactory because
many false SPs are detected. According to Zhou et al. [ZGZ07], the Poincare
Index based approach can detect not only all genuine SPs but it will also
detect a number of spurious SPs. Therefore, removing spurious SPs but
retaining genuine SPs is a challenge.
100

4.1.2 Validation and selection of detected SPs
Two techniques are used to remove the spurious SPs: one is segmentation
and the other is a rule based approach. Segmentation can effectively remove
SPs in non-ridge/non-valley areas while a rule based procedure is used to
determine whether a SP should be removed. The rule based post-processing
approach is used to validate the detected SPs, and unreliable SPs will be
discarded.
4.1.2.1 Segmentation
Figure 4.3: Mask generation of Figure 4.1a, and the black lines indicate theboundary of the mask.
Segmentation refers to separating a fingerprint image into foreground and
background, of which foreground refers to the recoverable ridge and val-
ley areas of a fingerprint image while background refers to the unrecover-
able, non-ridge and non-valley areas [MMJP09]. The segmentation tech-
101

niques have been described in Section 2.4.1 using the method in [HWJ98,
WBGS10]. After segmentation, a mask is generated to shield the back-
ground. Figure 4.3 shows the result of segmentation of Figure 4.1a.
4.1.2.2 Post-processing for SPs validation
Because there are numerous spurious SPs detected by the Poincare Index
technique, how to remove these SPs is an issue. Therefore, a rule based
post-processing method is developed to validate the detected SPs in this
work. This post-processing approach is designed by observing the effects of
smoothing the gradient field. A Gaussian filter is used to smooth the gra-
dient field in order to remove the spurious SPs generated by local irregular
gradient presentations (such as SPs caused by image noise). The equation
of the Gaussian filter is shown in Equation 4.2:
g(x, y) = 1/(2πθ2)e−(x2+y2)/(2θ2) (4.2)
where x and y is the distance from the origin in the horizontal axis and
vertical axis, respectively, and θ is the standard deviation of the Gaussian
distribution. The variable θ in the Gaussian filter controls the levels of
smoothness of an image. In the proposed approach, we use the Gaussian
filter to smooth the gradient field of a fingerprint image. It means that the
vertical and horizontal gradient components of the gradient field are convo-
luted with the Gaussian filter. Then the orientation field is computed after
the smoothing. We have tested our approach on the FVC 2002 [MMC+02]
databases and found that when θ = 24, most false SPs are removed. How-
ever, when a big value of θ is chosen, one or two genuine SPs may also be
102

removed mistakenly in some cases. Furthermore, the detected SPs may be
located away from the real SPs by several pixels. Because of the inaccuracy
of the detected position, these SPs cannot be used further for alignment of
fingerprints for a match. Figure 4.4 shows the effect of smoothing and the
circles indicate SP areas. We can see that the most irregular areas in Figure
4.4a are removed in Figure 4.4b. However, the SP areas are slightly away
from their original regions, as is also noted by Wang et al. [WLN07]. It will
cause the detected SPs to be marked at incorrect places.
(a) (b)
Figure 4.4: The orientation field of Figure 4.1a) where the circle indicatesthe SP areas. (a), the original orientation field; (b), the smoothed orienta-tion field with θ = 24.
Therefore, we propose a validation scheme to remove spurious SPs and
relocate the detected SPs based on experimental observation as follows:
(i) Set θ = 5 and k = 1, where k denotes the sequence number of core
and delta data sets, which means the kth smoothing. Choosing θ = 5
103

is an appropriate start value as reported by Bazen and Gerez [BG02],
at which most genuine SPs will be retained.
(ii) Detect SPs using the Poincare Index calculation, and remove any
cores outside the segmentation mask. Next store SPs as: Ck =
{(x1, y1), (x2, y2), ...(xMk, yMk)}, Dk = {(x1, y1), (x2, y2), ...(xNk, yNk)}
where C and D are set of cores and deltas respectively; (xi, yi) is the
position of a core or delta point; M and N are the number of cores
and deltas respectively, and Mk and NK denote the number of cores
and deltas in the kth iteration respectively.
(iii) Set θ = θ + 4, k = k + 1. Repeat the same procedure as in step (ii)
above until θ >= 24.
(iv) If (Nk <= Mk <= 2&Mk = Mk−1&Nk = Nk−1) or θ = 24, then we
choose the last core and delta sets as the final result, else we redo step
(ii).
(v) We get k pairs of core and delta points sets from the above steps which
are C1...Ck and D1...Dk. For data sets C1...Ck, we map the core points
from Ck to C1 in sequence by selecting a pair of core points with the
minimum distance. Take an example, for a point (x, y) in set Ck,
we calculate the distance between (x, y) and all points in Ck−1 using
equation 4.3, then a corresponding point (x′, y′) in Ck−1 is selected
which has the shortest distance to the point (x, y). Next we do the
same step until we find the corresponding point of the point (x, y)
in C1. For the delta point part, the procedure is the same as the
core point part. Finally, the refined positions of validated SPs are
104

obtained.
distance =√
(x2 − x1)2 + (y2 − y1)2 (4.3)
θ = 5 is chosen as the smallest value for SP detection, because if θ < 5
there are too many spurious SPs detected as illustrated by Bazen and Gerez
[BG02]. Then we set the values of θ in the range [5, 24] based on the research
in [BG02] and experimental observation (the θ values are 5, 9, 13, 17, 21,
24 which are selected in step (ii) of the above procedure). The increase
in θ may cause the missing of genuine SPs. Therefore, we chose 4 as the
incremental step of θ until valid SPs are found. So most images do not need
to be smoothed with θ = 24. Furthermore, step (v) defines a simple method
to relocate the accurate position of valid SPs. The above procedure also
defines rules to validate SPs which are:
• Rule 1: cores near mask or border of the image within 5 pixels should
be removed;
• Rule 2: a fingerprint image should not contain more than 2 pairs of
cores and deltas unless 3 or more cores are still detected when θ = 25;
• Rule 3: if a group of cores and deltas are possibly the genuine SPs,
then the subsequent group should have the same number of cores and
deltas.
We only remove core points near the mask or border of an image in
rule 1, because a fingerprint image may not contain a complete fingerprint.
However, core points are normally in the centre of a fingerprint and most of
the core points will not be near the mask or border of an image. Therefore,
core points near the mask or border are highly likely to be spurious points.
105

Rule 2 is defined according to the work of Karu and Jain [KJ96] and Zhou
et al. [ZGZ07]. They found and proved that the number of core and delta
points should be the same in a fingerprint, and most fingerprints will not
have more than 2 pairs of core and delta points. However, if there are 3
or more pairs of core and delta points, as in some special cases, so we set
that if 3 or more cores are found when θ = 24, we keep that result as the
final result. Rule 3 is a constraint, such that detected SPs will be validated
only if results of two subsequent smoothings are the same, which means that
the detected SPs are reliable. We find that a pair of false core and delta
points may be retained only if both rules 1 and 2 are used in some cases.
Rule 3 eliminates this kind of situation. Figure 4.5 shows the result after
segmentation and validation of Figure 4.1a also shows some more sample
detections for poor quality images selected from the FVC 2002 database.
106

(a) (b) (c)
(d) (e) (f)
Figure 4.5: The results of the proposed approach: (a) is the result of Figure4.1a ; (b), (c), (d), (e) and (f) are five selected poor quality images fromthe FVC 2002 databases.
4.1.3 Experimental Results
The FVC2002 [MMC+02] DB1a and DB2a databases have a total 1600
images to test this approach. FVC (Fingerprint Verification Competition) is
an international competition to evaluate fingerprint recognition techniques,
and its databases contain various quality fingerprint images [MMC+02].
Table 4.1 shows the specifications of these databases.
107

Table 4.1: The specifications of FVC 2002 DB1a and DB2a databases
Database Sensor type Image size Image
numbers
Image reso-
lution
FVC2002
DB1a
Optical Sensor 388x374 800 500
FVC2002
DB2a
Optical Sensor 296x560 800 569
The experiment is conducted by checking the detected core points and
delta points with human experts. The SPs are marked by human experts
and initially considered as genuine SPs, then the experiment results are com-
pared to those marked points to calculate the detection rate. If a core/delta
point is in the range of 16 pixels (which is a threshold adopted by various
researchers, e.g. [ZWZ06]) to a correct core/delta point, we consider this
point is correct, otherwise it is a false one. If a genuine core/delta point
is not detected, we call this point a missed one. The plain arch type of
fingerprints do not contain SPs. Therefore, if there are no SPs detected in
an arch fingerprint image, then we say that this image is correctly detected
as an arch fingerprint.
Table 4.2 shows the experimental results of our approach. From Table
4.2, we can see that the total error rate of core and delta point detection is
10.52%. And average 91.50% of the fingerprint images are detected without
false/missed SPs by our approach. Table 4.3 shows the comparison of exper-
imental results with other Poincare Index based methods, we can see that
our method is better than these reported results. In this table, Bazen and
108

Gerez’s [BG02] approach uses the Poincare Index approach without post-
processing, so the results show the normal possible error rate of Poincare
Index based approaches. However, the miss rate of our approach is close
to their approach. We have analyzed our results and found that we remove
the SPs close to the border of the mask using rule 1. Therefore, some SPs
near border of the mask are removed, but these points are considered as
genuine ones as they could be easily determined by experts.
Table 4.2: The results of the approach on databases FVC 2002 DB1a andDB2a
Database Miss rate False rate Total error
rate
Correct image
rate
FVC2002
DB1
4.79% 1.67% 6.46% 92.25%
FVC2002
DB2
10.82% 3.75% 14.57% 90.75%
Average 7.81% 2.71% 10.52% 91.50%
109
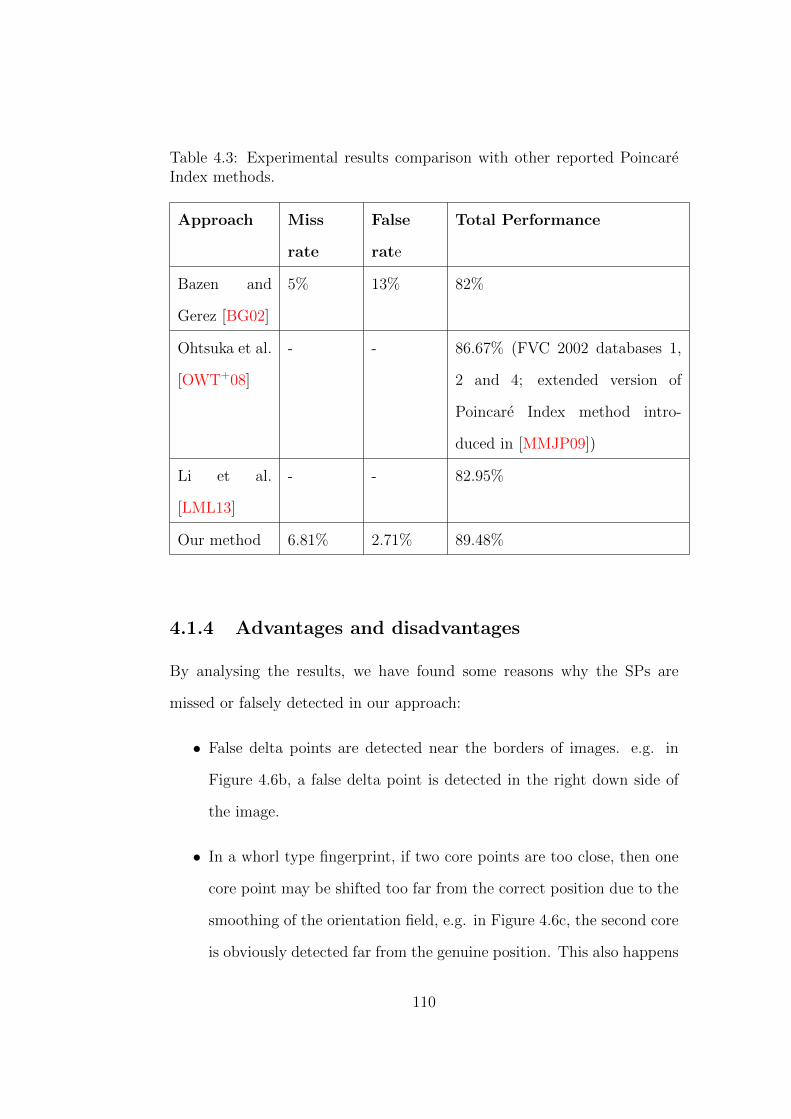
Table 4.3: Experimental results comparison with other reported PoincareIndex methods.
Approach Miss
rate
False
rate
Total Performance
Bazen and
Gerez [BG02]
5% 13% 82%
Ohtsuka et al.
[OWT+08]
- - 86.67% (FVC 2002 databases 1,
2 and 4; extended version of
Poincare Index method intro-
duced in [MMJP09])
Li et al.
[LML13]
- - 82.95%
Our method 6.81% 2.71% 89.48%
4.1.4 Advantages and disadvantages
By analysing the results, we have found some reasons why the SPs are
missed or falsely detected in our approach:
• False delta points are detected near the borders of images. e.g. in
Figure 4.6b, a false delta point is detected in the right down side of
the image.
• In a whorl type fingerprint, if two core points are too close, then one
core point may be shifted too far from the correct position due to the
smoothing of the orientation field, e.g. in Figure 4.6c, the second core
is obviously detected far from the genuine position. This also happens
110

in the situation if a fingerprint has more than two genuine cores.
• If the quality of a fingerprint is poor, then the detected position is not
very accurate. However, in this case, the detected core/delta positions
are normally not far from the correct position, so they can still be used
for fingerprint classification.
(a) (b)
(c)
Figure 4.6: Examples of missed or false detection of SPs.
One of the reasons that causes the above miss/false detection is that
the Poincare Index calculation processes an image block by block (or pixel
111

by pixel) which ignores the global structure of ridge/valley lines. In order
to solve the above existing problem in Poincare Index methods, a new SP
detection method based on the analysis of the overall local ridge orientation
map is introduced in the next section.
4.2 A Method for SP Detection Based on
Local Ridge Orientation
In this section, a new SP detection approach is developed based on ana-
lyzing the pattern in the fingerprint local ridge orientation map in order to
address the problems encountered with the Poincare Index based methods.
Furthermore, this approach is also able to locate a reference point for arch
types of fingerprints or even partial fingerprints.
In the following section, the detailed reference point detection approach
is described first. Next we shall introduce the reference point detection for
arch type fingerprint images. This will be followed by a method to detect
reference points for partial fingerprints. Finally, experimental results and
analysis are provided to confirm the accuracy of detection of reference point
using this proposed method.
4.2.1 The proposed approach for SP detection
As we mentioned before, a SP is a global feature of a fingerprint. It could
be a core or delta point. Both core and delta points are formed due to
the direction changes of ridge lines. Therefore, the local ridge orientation
surrounding a core or delta point changes in the orientation map as shown
112
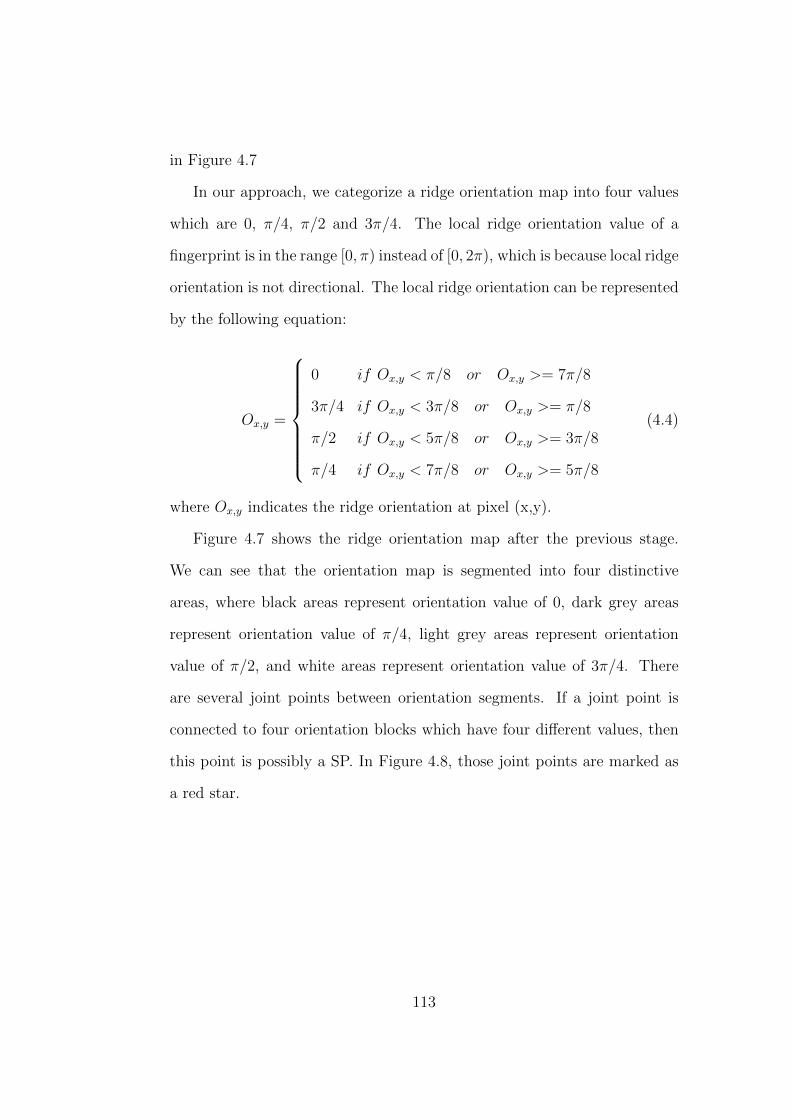
in Figure 4.7
In our approach, we categorize a ridge orientation map into four values
which are 0, π/4, π/2 and 3π/4. The local ridge orientation value of a
fingerprint is in the range [0, π) instead of [0, 2π), which is because local ridge
orientation is not directional. The local ridge orientation can be represented
by the following equation:
Ox,y =
0 if Ox,y < π/8 or Ox,y >= 7π/8
3π/4 if Ox,y < 3π/8 or Ox,y >= π/8
π/2 if Ox,y < 5π/8 or Ox,y >= 3π/8
π/4 if Ox,y < 7π/8 or Ox,y >= 5π/8
(4.4)
where Ox,y indicates the ridge orientation at pixel (x,y).
Figure 4.7 shows the ridge orientation map after the previous stage.
We can see that the orientation map is segmented into four distinctive
areas, where black areas represent orientation value of 0, dark grey areas
represent orientation value of π/4, light grey areas represent orientation
value of π/2, and white areas represent orientation value of 3π/4. There
are several joint points between orientation segments. If a joint point is
connected to four orientation blocks which have four different values, then
this point is possibly a SP. In Figure 4.8, those joint points are marked as
a red star.
113

(a) (b)
(c) (d)
Figure 4.7: An example of local ridge orientation field transformation intofour local ridge orientation values. The blue dash lines show the directionsof ridges. (a), the original image; (b), the local ridge orientation field; (c)and (d) are the orientation map after the orientation value transformation.The values of orientation lie in the range of [0, π) mapping to the color fromwhite (0) to black (π).The orientation map after being segmented into fourvalues. The orientation values of black, dark grey, light grey and whitesegments are 0, π/4, π/2 and 3π/4 respectively.
Here we divide the orientation values into only four values instead of
eight or more values. This is due to the following reasons: Firstly, four
values are enough to observe the changes of the orientation in the SPs areas.
Secondly, eight or more values cannot eliminate sufficient noise, especially in
114

some poor quality fingerprint images, which may produce a small number of
small size of unreliable orientation segments. Finally, using only four values
will make the orientation segments have sufficient size, which is easier for
SP validation which is introduced in the next part.
(a) (b)
Figure 4.8: Detected reference points plotted in the (a) original image and(b) orientation map (marked as a star).
4.2.1.1 Recognize the SP types
If we want to use these detected SPs as reference points for fingerprint
classification, then we have to correctly recognize SP types either as core or
delta.
Figure 4.9 shows the surrounding area of a core point and delta point
in the orientation map. We can see that: a core point has a feature that
it’s surrounding orientation values increase from 0 to 3π/4 anticlockwise;
while a delta point has its surrounding orientation values increase from 0
to 3π/4 clockwise. This idea is similar to Poincare Index. Thus, we define
a SP type by following rules in our approach.
115

1. If four orientation blocks surrounding a SP are placed in an order of
0 → π/4 → π/2 → 3π/4 in the anticlockwise direction, then this
point is a core point (see Figure 4.9a).
2. If the joint 0 value orientation segment is below the detected core
point, then this core point is the secondary core point in a whorl type
fingerprint.
3. If four orientation blocks surrounding a SP are placed in an order of
3π/4→ π/2→ π/4→ 0 in the clockwise direction, then this point is
a delta point (see Figure 4.9b).
(a) A typical core point atthe centre
(b) A typical delta point atthe centre
Figure 4.9: Patterns of a core and delta point in the orientation map.
116

(a) (b)
Figure 4.10: The reference points are classified (note we use a red squareto mark the secondary core point). (a), the marked singular points in theoriginal image; (b), the marked singular points in the segmented local ridgeorientation map.
Figure 4.10 shows the image after SP classification. We use red circles,
red squares, and blue triangles to indicate the main core points, the sec-
ondary core points and delta points respectively. Because whorl type has
two core points, here we use the term ”main” and ”secondary” to distin-
guish between them. The core point with its ridge loop direction pointing
to the top is considered the main core point while the one with its ridge
direction pointing to the bottom is considered the secondary core point.
4.2.1.2 Validation of detected SPs
Not all joint points are genuine SPs. Some of them are formed due to noise
(as seen in Figure 4.10). In this case, it is necessary to remove those false
SPs. One possible method is segmentation. Segmentation of fingerprint
images is used to remove singular points outside the mask boundary. After
segmentation, a mask is generated to shield the background. The detail of
117

the segmentation algorithm can be seen in [WBGS10]. Figure 4.11 shows
the result of the segmentation. It can effectively remove false SPs outside
the mask boundary. Figure 4.11a shows the segmentation boundary of a
fingerprint image. Figure 4.11b illustrates that a core point is discarded
because it is outside of the mask.
(a) (b)
Figure 4.11: If the detected SPs are outside the mask, then these SPs areremoved.
4.2.1.3 Validation of SPs based on patterns of orientation seg-
ments
After segmentation, the rest of the SPs need to be further investigated.
Based on the analysis of the pattern of the orientation segments, a validation
scheme is designed as follows:
1. Pairing the core and delta points: Divide the singular points into two
groups: paired and non-paired. The criterion of pairing is to check
whether two SPs are connected by any orientation partition excluding
the 0 value segments. This is because 0 value segments are normally
118

on the top of a core point, thus it is not a valid pair if a core point
and a delta point is connected by a 0 value segment.
2. For paired SPs: A fingerprint image should only contain one core point
excluding the secondary core points in a whorl type fingerprint. If
there are more than two cores detected, we will only keep the most re-
liable core point and its relevant delta point pair. The other core/delta
pairs are removed. The reliability of a core/delta is decided by the
sizes of its connected orientation segments and their distances. For
example, the Euclidean distance between a spurious pair of core point
and delta point is relatively closer than a genuine pair of core and
delta point (see Figure 4.12a). Besides, for a spurious pair core and
delta point, there may be one or more joint segments whose area is
small as shown in Figure 4.12a. Though in several rare cases, there
are more than three genuine core and delta pairs in some fingerprints.
However, our method only chooses the two most reliable core and
delta pairs.
3. For non-paired SPs: If a SP is not close to the boundary of the mask
(let us say 25 pixels), then it should be connected to at least three
large size orientation segments (here we set the size of the segments
as 625 pixels based on experimental observation of 500 dpi fingerprint
images). Otherwise it is possibly generated by noise. In the case a SP
being close to the boundary of a mask, then it should be connected
to at least two large size orientation segments.
119

4. Additional rule: Delta points should be below all core points, and
core points should be above all delta points. This assumes that the
fingerprint images are not placed in a up-down direction.
Step 1 is the pairing step which is an essential part of the validation
part. Normally for a complete fingerprint, the number of core points and
delta points are the same [MMJP09]. Based on our observation, if there are
some spurious singular points detected in a fingerprint, these points contain
the same number of core and delta points. Therefore, we make the following
assumption:
Among the detected SPs, if the fingerprint is complete (non-partial) and
naturally produced (non-artificial), then in a loop type fingerprint, any core
point has one and only one corresponding delta point to make them a match,
and in a whorl type fingerprint, any core point has one or two corresponding
delta points to make them a match (both core points may be a match with
either delta point in a whorl type fingerprint). Based on this assumption,
(a) (b)
Figure 4.12: The example of pairing the reference points: (a), remove theunreliable SP pairs; (b), detected reference core point.
120

we could remove false pairs of SPs. False pairs of SPs are determined by
the smallest size of their connected orientation segments and their distance
as defined in step 2. For non-paired singular points, because the orientation
values surrounding a genuine SP are changing smoothly, genuine SPs are
usually connected to those orientation segments with sufficient size, which
is defined in step 3. The major aim of step 4 is to remove spurious SPs
from non-fingerprint areas as in some cases a fingerprint image may contain
the impression of other parts of a finger. Figure 4.12 shows the image after
singular point paring. We use red circles, red squares, and blue triangles
indicate the main core points, the secondary core points and delta points
respectively.
4.2.1.4 Reference point detection for arch fingerprints
In some cases, a fingerprint image does not have a core nor delta point.
There are two kinds of these fingerprint images: one is arch type fingerprints,
and the other is partial fingerprints. Figure 4.13 shows an arch fingerprint
image.
121

(a) (b)
Figure 4.13: An example of (a), an arch fingerprint and (b), its orientationmap.
An arch type fingerprint has no loop of ridge lines as shown in Figure
4.13a, so there is no joint point of four different orientation segments in its
orientation map . However, because of no loop or delta, the major orien-
tation segments are placed in a sequence of π/4, 0, and 3π/4 as shown in
Figure 4.13b. Therefore, we simply find two points which have the shortest
distance between the major π/4 orientation and 3π/4 orientation segments
as indicated as red line in Figure 4.13b). Then we choose the middle point
of this line as a reference point. Arch type fingerprints do not have joint
points between different orientation segments and there are only three ma-
jor orientation segments with different orientation values instead of four in
other types of fingerprints as shown in Figure 4.13b. To find a point which
is located in the middle orientation segment and closest to the other two
orientation segments could be a reference point. For an intra-class group
of arch type fingerprints, the locations of detected reference points are very
close to each other because the distributions of orientation segments are
122

similar. Figure 4.14 shows an example of reference points detection for two
arch type fingerprints from an intra-class group. We can see the locations
of two detected reference points which are close to each other.
(a) (b)
Figure 4.14: Two examples of reference point detection for arch type fin-gerprints. These two fingerprints are a pair of intra-class fingerprints (fromthe same finger).
4.2.2 Experimental Results
FVC 2002 [MMC+02] databases are used once again for evaluation of this
singular point detection method as these databases contain a wide rang of
fingerprint images with different levels of quality.
We use the FVC 2002 databases DB1a and DB2a to evaluate our ap-
proach. Each of these databases has 800 fingerprints, so the total number of
fingerprints is 1600 (refer to the Table 4.1). Because SPs are global features,
it is hard to find the exact position of a SP. Therefore, we define that if a
detected SP is inside the defined SP area (an area centered at the location
of the genuine singular point with a selected radius R), then we consider
it is correctly detected. The SP area radius R is not formally defined in
123

fingerprint recognition, a distance within 10 - 20 pixels to the genuine SP lo-
cation is accepted in the literature. For example, Li et al. [LML13] choose
±14 pixels as the radius of SP area, but Weng et al. [WYY11] choose
±20 pixels as the radius of SP area. In our case, we consider some small
pixel(±16) shifts of SPs as acceptable. Figure 4.15b is an example of false
detection of the core point, because its position is shifted from its true po-
sition by more than 16 pixels. In this case, even though it still works for
fingerprint classification or coarse alignment, we still regard it as falsely
detected. Furthermore, since our aim of reference point detection is for
alignment and classification, the consistency of detected positions of SPs is
the most important concern. For example, in Figure 4.15a, the core point
should be located on the ”inner most loop” [MMJP09] of a ridge, but the
detected core point is located between the second and third inner most loop
of ridges. However, we still consider it as correctly detected, since all other
intra-class fingerprints have the same detected position and it is still within
the distance of ±16 pixels of the genuine core point area.
(a) (b)
Figure 4.15: Two samples of SP detection: (a) is considered as correctlydetected while (b) is considered as falsely detected.
124

We have already given an example in Figure 4.12, where a false pair
of core and delta points are removed by our approach. Figure 4.16 shows
some more examples of comparisons between our improved Poincare Index
based approach introduced in Section 4.1 and this approach. The first
column is the results of SP detection by Poincare Index approach, and the
second column shows the results using our approach. We can see that those
images with false SPs in the first column are correctly detected in the second
column.
Table 4.4 shows the experimental results on the FVC 2002 databases
DB1a and DB2a. The second column shows the miss detection rate of SPs,
which refers to the percentage of SPs that is not detected, the third column
shows the false detection rate of SPs which refers to the percentage of SPs
that are falsely detected; the fourth column is the overall correct rate of SP
detection; and the last column shows the percentage of fingerprint images
without miss/false detected SPs. From the table, we can see the average
miss rate is higher than the average false detection rate. One major reason
is the segmentation errors where some SPs (especially delta points) are
outside or close to the boundary of masks. Among the falsely detected SPs,
some points are a little far away from the true positions like the core point
in Figure 4.15a. That is because the orientation maps are not accurate
enough due to noise. We have also examined the fingerprint with missed
or falsely detected SPs. Most of these images have at least another SP
correctly detected, which can be used for coarse alignment in the next stage.
However, there may still be some fingerprint images which have no correctly
detected SPs. We need to further investigate those images in order to
reduce or remove the influence on alignment or classification in the future.
125

(a) Poincare Index based ap-proach in this column
(b) Our approach in this column
(c) (d)
(e) (f)
Figure 4.16: Comparison of results between the Poincare Index based ap-proach and our approach. The first column is the Poincare Index basedapproach, and the second column is our approach.
126
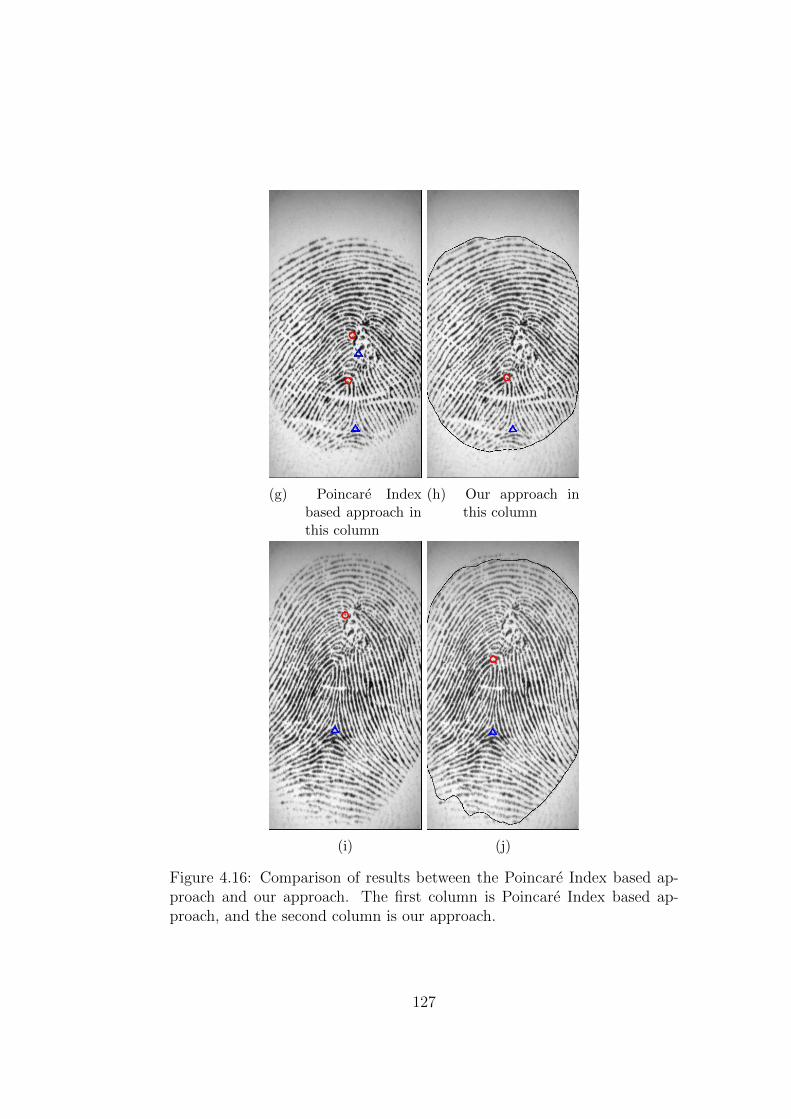
(g) Poincare Indexbased approach inthis column
(h) Our approach inthis column
(i) (j)
Figure 4.16: Comparison of results between the Poincare Index based ap-proach and our approach. The first column is Poincare Index based ap-proach, and the second column is our approach.
127
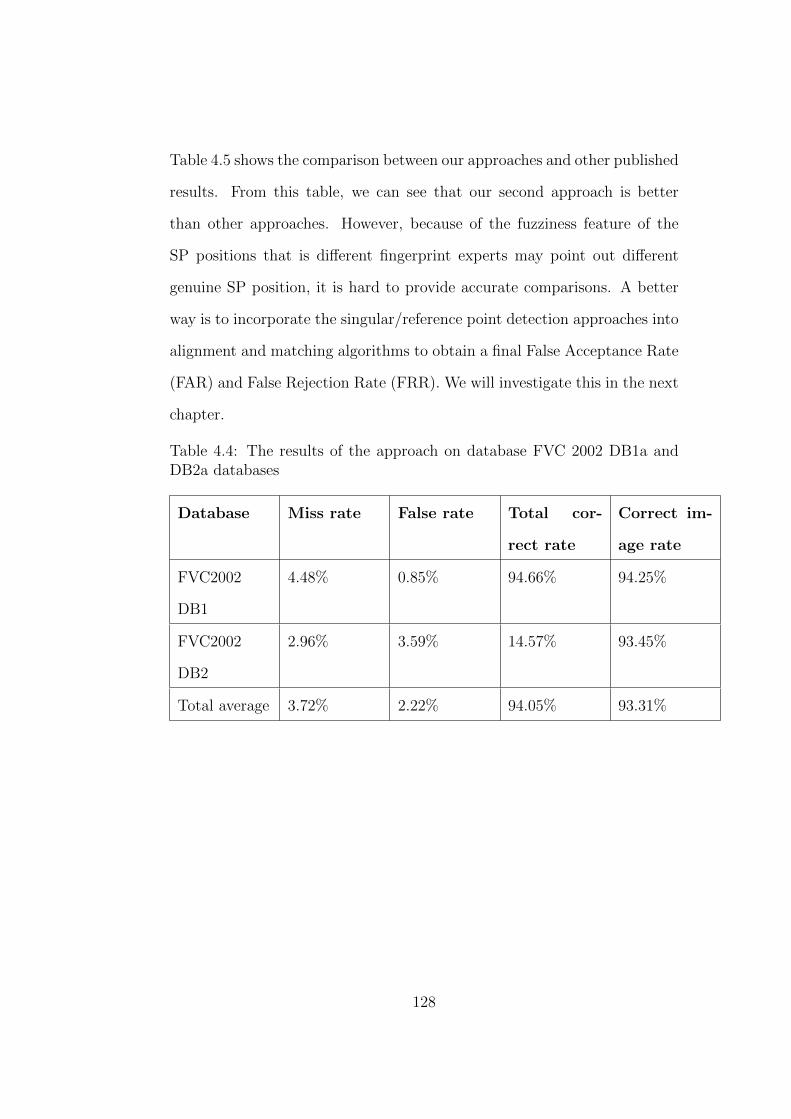
Table 4.5 shows the comparison between our approaches and other published
results. From this table, we can see that our second approach is better
than other approaches. However, because of the fuzziness feature of the
SP positions that is different fingerprint experts may point out different
genuine SP position, it is hard to provide accurate comparisons. A better
way is to incorporate the singular/reference point detection approaches into
alignment and matching algorithms to obtain a final False Acceptance Rate
(FAR) and False Rejection Rate (FRR). We will investigate this in the next
chapter.
Table 4.4: The results of the approach on database FVC 2002 DB1a andDB2a databases
Database Miss rate False rate Total cor-
rect rate
Correct im-
age rate
FVC2002
DB1
4.48% 0.85% 94.66% 94.25%
FVC2002
DB2
2.96% 3.59% 14.57% 93.45%
Total average 3.72% 2.22% 94.05% 93.31%
128

Table 4.5: Comparisons with other approaches
Approaches Miss SP False SP Total correct rate
Bazen and Gerez
[BG02]
5% 13% 82%
Nilsson and Bigun
[NB05]
- - 83%
Zhou et al.
[ZGZ07]
14.6% 4.8% 81.6%
Zheng et al.
[ZWZ06]
7.8% 4.9% 87.3%
Ohtsuka et al.
[OWT+08]
- - 92.15% (FVC 2002
databases 1 and 2)
Weng et al.
[WYY11]
7.03% in total 92.97% (FVC 2002
databases 1 and 2)
Ravinder et al.
[KCH12]
- - 92.6% (FVC 2002
databases 1 and 2, 3 and
4)
Li et al. [LML13] - - 82.95%
Proposed Poincare
Index approach
7.81% 2.71% 89.48% (FVC 2002
databases 1 and 2)
Second proposed
approach
3.72% 2.22% 94.05% (FVC 2002
databases 1 and 2)
129

4.3 Conclusion
In this chapter, we have presented two SP detection methods, which are able
to obtain high correct detection rate of SPs. The first approach develops a
rule based validation scheme after the Poincare Index calculation. The ex-
perimental results show that this approach obtain better results than other
reported Poincare Index based approaches. The overall correct detection
rate of SPs achieves 89.48% on the FVC 2002 DB1a and DB2a databases,
which is about 3% improvement or more over other reported Poincare In-
dex based approaches. Furthermore, in order to address the limitations of
Poincare Index based approaches, a new SP detection method is developed
afterwards. This approach is based on the analysis of the patterns of a
fingerprint’s local ridge orientation field. The experimental results show
that this method obtains 94.05% correct detection rate of SP detection
and 93.31% of fingerprints are without missed/falsely detected SPs which is
better than the previous Poincare Index based approach and other report
results tested on the same databases. Furthermore, we extended this ap-
proach to arch type fingerprints. Thus, it is possible to locate a reference
point for an arch fingerprint which can be used for fingerprint alignment
or/and fingerprint classification.
The next chapter will address the third research objective of this work
which aims to design an accurate and reliable fingerprint matching method.
Because our overall research objective is to improve the overall matching
accuracy of an automatic fingerprint recognition system, a reliable and ac-
curate matching method or metric needs to be designed to achieve this ob-
jective. Though fingerprint matching has been extensively researched, how
130

to design a reliable and accurate matching algorithm is still an on-going
challenge. An excellent matching algorithm should have good tolerance to
image noise, non-linear distortion and feature extraction errors. In order
to address this challenge, a new fingerprint matching metric named bina-
rized minutiae block is proposed for fingerprint matching. Furthermore,
four fingerprint global similarity calculation methods are designed based on
this matching metric to evaluate its reliability and accuracy for fingerprint
matching.
131

Chapter 5
Fingerprint Matching Using
Binarized Minutiae Blocks
In Chapter 3 and 4, we have taken many steps to improve the performance of
fingerprint feature extraction including fingerprint image quality enhance-
ment and reliable singular point (SP) detection. The experimental results
show that: (i), our image processing method improves the image quality by
9%, in terms of Goodness Index (GI), which is a metric used to evaluate
the image quality of fingerprint images; and (ii), our second singular point
detection method obtains 94.05% correct detection rate of singular points,
which is better than other report results tested on the same databases. After
fingerprint feature extraction, fingerprint matching is performed to obtain
the final matching score to determine whether a pair of fingerprints match
or not. Both the feature extraction and matching stages contribute to the
final matching accuracy of a fingerprint recognition system. Thus, a reliable
and accurate fingerprint matching method could significantly improve the
overall performance of a fingerprint recognition system.
132

In this chapter, we aim to design a fingerprint matching method which
is accurate and has a high tolerance to non-linear distortion and feature
extraction errors. Fingerprint matching is one of the most important pro-
cess in a fingerprint recognition system, because it may determine the final
matching accuracy of this system. Fingerprint matching is a stage after
the feature extraction in fingerprint recognition. The features (e.g. SPs
and minutiae information) extracted in the previous stages are input infor-
mation to a fingerprint matching algorithm. The accuracy of a fingerprint
matching method may be influenced by two factors: the reliability and ac-
curacy of input features; and the techniques used for the matching method
itself (e.g. tolerance to non-linear distortion and the ability to address the
displacement problem of fingerprint matching). Since the reliability of in-
put feature is out of the scope to fingerprint matching, how to improve the
accuracy and reliability of fingerprint matching method is an issue to be
dealt with in fingerprint recognition.
In order to address this challenge, a new matching metric is designed for
fingerprint matching, and is named a ”binarized minutiae block” (BMB).
It is a binarized fingerprint image block with a minutiae point in the cen-
ter. Besides, all BMBs are normalized to make all the minutiae has the
same direction for fast and easy local minutiae similarity calculation. Un-
like minutiae based, correlation based or other non-minutiae based meth-
ods, BMB utilizes both minutiae and texture information for matching.
Thus, the BMB method has the advantages of minutiae based and cor-
relation based (which compares grey level texture information) methods.
The main advantage of this BMB metric are: (i), more information has
been taken into consideration in fingerprint matching compared to other
133

minutiae based (no texture information) and correlation based (no minu-
tiae information) matching methods, which increases the reliability of local
minutiae similarity. (ii), the calculation of local minutiae similarity is based
on the comparison of BMBs using the Hamming distance [Ham50] calcula-
tion, which is a simple XOR operation that could be implemented in one
CPU cycle. (iii), high tolerance to missing and spurious minutiae. Minutiae
is not the only information in a BMB, and this metric is not a local minu-
tiae structure based method. Missed and spurious minutiae only influence
the BMB generation, and spurious minutiae is not probable to obtain low
hamming distance values during the comparison of BMBs (the lower ham-
ming distance indicates the higher BMB similarity, vice versa). (iv), high
tolerance to non-linear distortion. Unlike correlation based methods, only
the surrounding texture information of minutiae points is used for matching
rather than using the texture information of a whole fingerprint. Thus, the
tolerance to non-linear distortion of this method is as high as other minu-
tiae based methods, which are much higher than correlation based methods
(non-linear distortion may cause shifts of ridges and valleys on some areas of
a fingerprint image, which could not be well addressed in correlation based
methods because they takes the whole image for comparison). Furthermore,
four global similarity calculation methods are proposed to obtain the final
matching scores and evaluate the designed matching metric, BMB.
The rest of the chapter is organized as follows: First, the process of
fingerprint template generation based on binarized minutiae blocks is de-
scribed. Then, how to generate the local minutiae similarity is introduced.
Subsequently, four global similarity score calculation methods are described,
Finally, experimental results are provided, and a comparison with the ex-
134

perimental results of other reported matching methods is analyzed and dis-
cussed.
5.1 Fingerprint Matching based on the Bi-
narized Minutiae Blocks
In this section, we first introduce template generation using binarized minu-
tiae blocks which are used to calculate the local similarity of minutiae pairs.
Next the global matching similarity methods, which aim to obtain the final
matching score between two fingerprint templates, are illustrated in detail.
Finally, experimental results and discussions are discussed in detail.
5.1.1 Generating fingerprint template
In this matching method, the texture information (binarized ridge and val-
ley flows) is used for fingerprint matching. Texture information has been
used in correlation based methods for fingerprint matching (grey level tex-
ture information) [LELJSM07, KAN08]. The advantage of using texture
information for fingerprint matching is that the texture information is the
raw information of a fingerprint containing not only minutiae information
but also other information such as structure of ridge and valley [MMJP09],
thus makes the comparison more reliable than using only minutiae. How-
ever, using texture information for fingerprint comparison has some issues
[MMJP09], which are: (i), non-linear distortion makes impressions of the
same finger significantly different in terms of global structure. Because a
3-D finger is mapped to a 2-D image, the global structure of a fingerprint
135

may be different from another fingerprint of the same finger (e.g. shifts of
some ridges). Therefore, global correlation based methods may fail if the
non-linear distortion of a fingerprint is high. (ii), skin condition and finger
pressure cause image brightness, contrast, and ridge thickness to vary signif-
icantly across different impressions. The above issues are well addressed by
using the BMB method. A BMB contains a binarized block of local texture
information, which is used for local pattern comparison instead of global
texture information comparison. Furthermore, the BMB method does not
have concerns over variations of image brightness, contrast, and ridge thick-
ness, because the texture information has been enhanced and binarized by
the image processing stage.
For fingerprint template generation, the generated fingerprint template
contains not only minutiae information (location and direction) , but also
the texture information surrounding the minutiae points. A minutiae point
with its surrounding texture information is designed as a matching metric
for fingerprint matching, which is named binarized minutiae block (BMB)
in this work. The process of fingerprint template generation is shown as
follows:
(i) For each minutiae, put a window with size w x w centred at the
location of a minutiae point on the binary image. This step is shown
in Figure 5.1a and 5.1b, in which a window is selected for a minutiae
point.
(ii) Rotate the minutiae window to set the minutiae direction angle at a
selected angle value. In this work, the minutiae direction is set to 0
degrees. The purpose of this step is to normalize the minutiae blocks
136

so that all the minutiae points have the same direction to facilitate
the local similarity calculation. This step is shown in Figure 5.1c, in
which the selected minutiae window is rotated according to the angle
θ of the minutiae point.
(iii) Obtain the minutiae blocks with the size of s x s, where s is the
length of the block. After this step, all minutiae blocks have the same
size and same direction, then similarity between any two minutiae
blocks could be simply compared using exclusive or (XOR) operations
(see the equation 5.1). This step is shown in Figure 5.1d, in which a
binarized minutiae block (BMB) is generated for the selected minutiae
point. For each minutiae point in the binarized fingerprint image, a
corresponding BMB will be generated.
Figure 5.1 shows an example of the designed minutiae template gener-
ation. Figure 5.1a is a sample binarized fingerprint image from FVC2002
database DB1a, and the red circles and rectangles indicate the detected
ridge bifurcations and ridge endings respectively. For each minutiae de-
tected in the image, a window with size of w x w is located at that minutiae.
Figure 5.1b shows the chosen window centered at the selected minutiae for
a window size of 100 x 100 pixels. Then the selected window is rotated
according to the minutiae angle anticlockwise to make the new minutiae
angle to the expected angle value. Figure 5.1c shows the minutiae block is
rotated in the window to make the minutiae angle equals to 0 degrees af-
ter rotation, and the red rectangle is the selected minutiae template block.
Finally a smaller block with a size of s x s is obtained from the rotated
window. Figure 5.1d shows the obtained BMB with size of 60 x 60 pixels.
137

(a) A binarized image with detected minutiae. A minutiae is selected for BMBgeneration, which is centered at the window. The window length w equals 100pixels.
(b) A minutiae win-dow centred at theselected minutiaewith window size100 x 100 pixels.
(c) Minutiae windowis rotated to makethe minutiae angleto 0. Then a blockwith length of s isselected.
(d) The BMB ofthe selectedminutiae withblock size 60x 60 pixels.
Figure 5.1: Designed fingerprint template generation steps.
For each detected minutiae, the minutiae template could be generated
by the above procedure. Normally when the window length w =√
2 ∗ s, it
can fulfil the requirements of the minutiae template block generation. Note
the size of minutiae template blocks may influence the matching results.
138

If the size of a BMB increases, then more texture information is included
in the BMB for comparison. Thus, the comparison result of a minutiae
pair would be more reliable. However, due to the non-linear distortion
introduced during the image capturing stage, the dissimilarity between two
BMBs will increase when the size of the BMB increase, which may make
the dissimilarity values not so distinguish between a genuine minutiae pair
and a false minutiae pair when the size of the BMB is too large (the terms
genuine and false minutiae pair used here mean that two minutiae points are
a match or not, respectively, from a pair of intraclass fingerprint images). It
means that the tolerance to non-linear distortion will be reduced when the
size of the BMB increases. The detailed analysis of the block size influence is
described in the experimental evaluation section (Section 5.2.3.1). Because
our method not only uses minutiae information but also the core points,
the positions of core points are contained in the template. But delta points
are not included in the templates. The major reason is that delta points
are located at the edge of fingerprints, and are missed in most cases of
partial fingerprints. In the case of a fingerprint being incomplete after the
scanning stage, the delta points may be missed in the scanned images.
For example, numerous fingerprint images in FVC databases have no delta
points. Figure 5.2 shows four examples of partial fingerprint from FVC
2002 database DB1a, and these partial fingerprints do not contain a delta
point. On an average, there is approximately one fingerprint image having
no delta point in each intraclass group based on the observation (total 100
intra groups in this database, and each group has 8 fingerprint images).
Table 5.1 shows a sample fingerprint template generated by our method.
The angle of a minutiae point is the direction of the ridges, so the angle
139
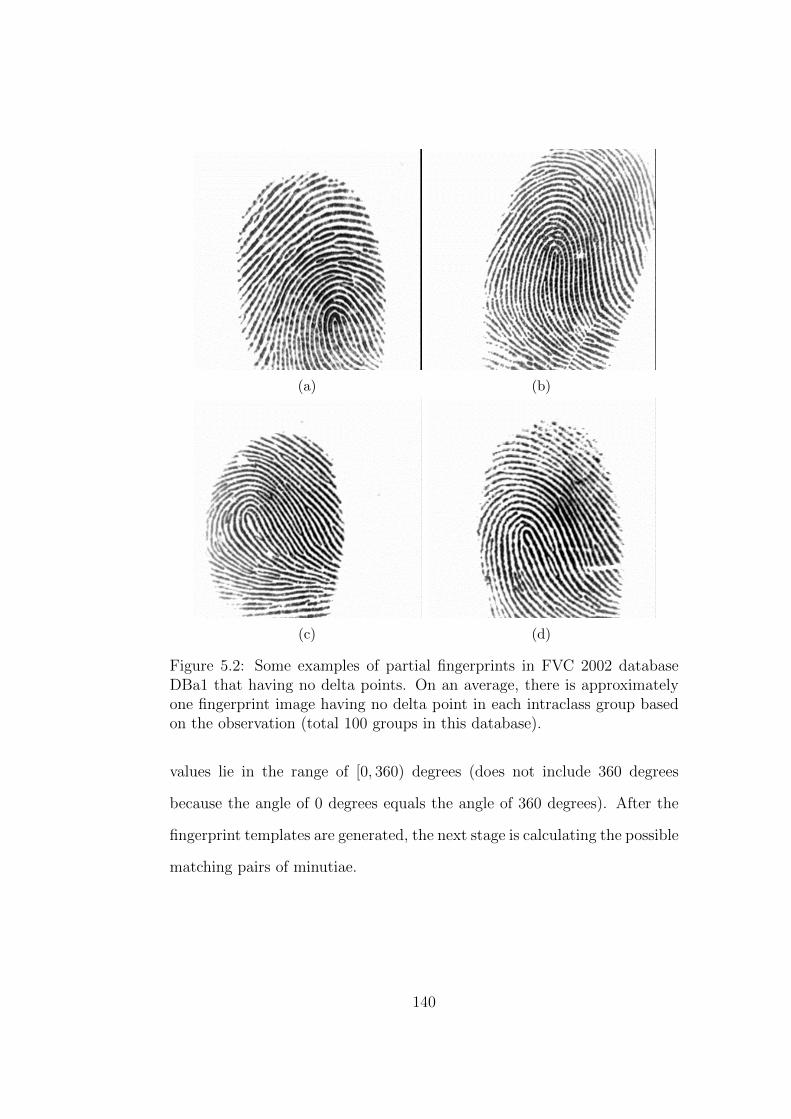
(a) (b)
(c) (d)
Figure 5.2: Some examples of partial fingerprints in FVC 2002 databaseDBa1 that having no delta points. On an average, there is approximatelyone fingerprint image having no delta point in each intraclass group basedon the observation (total 100 groups in this database).
values lie in the range of [0, 360) degrees (does not include 360 degrees
because the angle of 0 degrees equals the angle of 360 degrees). After the
fingerprint templates are generated, the next stage is calculating the possible
matching pairs of minutiae.
140

Table 5.1: A generated minutiae sample template.
Minutiae No. Position Angle Minutiae blocks
1 (x1, y1) θ1 BMB1
2 (x2, y2) θ2 BMB2
...
...
...
...
n (xn, yn) θn BMBn
core point (xc, yc) θc BMBc
5.1.2 Local Minutiae Similarity Calculation
The minutiae only based methods normally compute the similarity of local
minutiae structure (nearest neighbor and fixed radius based methods, see
Section 2.4.7.2) as the local minutiae similarity, such as triangular methods
[KV00]. In our case, because the texture information is preserved, pairing
minutiae by calculating the similarities of texture information between them
is much simplified. Hamming distance (HD) is used to calculate the simi-
larity score. HD [Ham50] measures the minimum number of substitutions
required to change one string into the other, or the number of errors that
transform one string into the other. It has been used in iris recognition for
dissimilarity calculation [Dau04, HAD06]. Here we use it to measure the
dissimilarity of two binary blocks. Because the blocks for comparison are
binarized which consists of 0 and 1, the Hamming distance (HD) can be
simply calculated by equation 5.1.
HD = ||blockx ⊕ blocky||/Size of a block (5.1)
141

For each BMB in the registered template (template A), it is compared
with the BMBs in the query template (template B). Then a HD value is
obtained from each comparison using equation 5.1. The HD values indicate
the local dissimilarities between each minutiae pair candidate. The local
similarity can be easily calculated as 1−HD. The minutiae pairs with the
top three smallest HD values are reserved as the minutiae pair candidates,
but these HD values need to fulfill the condition that HD <= THD. THD is
a decision threshold to decide whether a minutiae pair is probable a genuine
pair or not. That means a minutiae pair candidate will be removed from the
table while its HD value v is larger than a selected threshold THD, because
the HD value is too large to be considered as a valid pair in this case. The
reason why at most three possible minutiae pairs are reserved is that a gen-
uine minutiae pair may not always have the smallest HD values (e.g. due
to noise or/and non-linear distortion) based on experimental observation.
This situation normally happens in noisy fingerprint comparisons and/or if
the minutiae block size is too small or too large. By performing this strat-
egy, the possibility of obtaining genuine minutiae pairs will be increased.
Daugman [Dau04] reported that a HD threshold between 0.28 and 0.35 is
an appropriate decision criterion in iris template comparisons. In this work,
the HD threshold is selected as THD = 0.35, which is an appropriate value
based on the experimental observation. Figure 5.3 shows the process of
generation of minutiae pair candidates. Each minutiae block in template A
is compared to each minutiae block in template B, then the valid minutiae
pairs with HD <= THD is stored in the minutiae pair candidate table for
further processing as shown in Table 5.2. The variable ∆Angle (∆θi) is cal-
culated by the equation ∆θi = θi− θ′i (i ∈ 1...m) where θi and θ′i are angles
142

of minutiae points (xi, yi) and (x′i, y′i) in the ith minutiae pair candidate
from Table 5.2. This step is also called local similarity calculation, because
a minutiae point is a local feature in a fingerprint and the HD value indicate
the dissimilarity score between a minutiae pair. After the local similarity
calculation, the global similarity calculation (the final matching score) could
be performed.
Figure 5.3: Comparisons between the minutiae blocks.
143

Table 5.2: Generated minutiae pair candidate table. K is the total numberof minutiae pair candidates.
Pair No. HD value ∆Angle Template A Template B
1 v1 ∆θ1 (x1, y1) (x′1, y′1)
2 v2 ∆θ2 (x2, y2) (x′2, y′2)
...
...
...
...
...
K vK ∆θK (xK , yK) (x′K , y′K)
5.1.3 Global similarity calculation
Global similarity in fingerprint recognition refers to the overall matching
similarity between two fingerprint images. Global similarity is calculated
based on the local minutiae similarities in minutiae based matching meth-
ods. In this work, the local minutiae dissimilarities are based on the HD
values between each minutiae pair in Table 5.2. Thus, the local similarity
of a pair of minutiae points equals 1 - HD value. There are several ways to
calculate the global similarity between two enrolled fingerprint images.
The traditional fingerprint minutiae based methods use the percentage
of matched minutiae as the global matching score. Equation 5.2 of the
matching score calculation for minutiae based methods [MMJP09] is as
follows.
MS = n2p/(n1 ∗ n2) (5.2)
where MS denotes the matching score, np is the number of paired minu-
tiae and n1 and n2 are the total number of minutiae of template A and B
respectively.
144

However, Liu et al. [LCG+11] argued that using the product of the to-
tal number of minutiae from two templates as the denominator in equation
5.2 cannot reflect the reasonable matching score in the case of partial over-
lapping of two enrolled fingerprint images. Therefore, they modified the
matching score calculation as follows:
MS = n2p/(n1 overlapped ∗ n2 overlapped) (5.3)
where n1 overlapped and n2 overlapped) refer to the number of minutiae in the
overlapping area of two enrolled templates respectively.
Liu et al. [LCG+11] have found that using equation 5.3 obtains better
results than using equation 5.2 in their experiments especially for partial
fingerprints. However, if the values of both the numbers n1 overlapped and
n2 overlapped are small, then this matching score calculation will be unreliable.
For example, np = n1 overlapped = n2 overlapped = 3, then the matching score
equals 1, which is unreasonable. But equation 5.2 does not have this issue,
because the total number of minutiae are usually large even for partial
fingerprints.
Some other matching methods explore the interrelationships (local minu-
tiae structure) of minutiae points (e.g. [KV00, TB03, GYZZ11]). The in-
terrelationships of minutiae points refer to the directional difference and
distance between each two minutiae points. In particular, if there is a gen-
uine minutiae pair (mi,m′i) and (mj,m
′j), then there are some constant
relationships between them. For example, the distance between mi and mj
should equal the distance between m′i and m′j. Besides, the minutiae angle
difference between mi and mj should also equal the ridge angle difference
145

Figure 5.4: An example of using minutiae interrelationships for fingerprintmatching proposed by Kovacs-Vajna et al. [KV00]. Each triangle indicatesthe interrelationships among three selected minutiae points. Two similartriangles from a pair of fingerprint may be a match for the minutiae pointscomposing the triangles.
between m′i and m′j. Figure 5.4 shows an example of using interrelation-
ships of minutiae points for fingerprint matching, which is also named local
triangular matching [KV00]. In this method, minutiae points are connected
by lines to form a graph, which consists of small triangles. Each triangle
indicates the interrelationships among three selected minutiae points. By
comparing the produced triangles between two fingerprints, it is able to
obtain a matching similarity.
Cappelli et al. [CFM10] use local similarity sorting and relaxation tech-
niques to calculate the global matching similarities. They designed several
global matching similarity calculation methods based on these techniques.
The first method they developed is named local similarity sorting (LSS).
This method sorts the minutiae pairs by their local similarities then the top
146

np pairs of minutiae are selected to calculate an average matching score.
This method allows duplicate minutiae points in the top np minutiae pairs.
It means a minutiae point in template A may map to multiple numbers
of minutiae in template B. Another method is named local similarity as-
signment (LSA), in which duplicate minutiae points are not allowed in
minutiae pairs. In this case, minutiae points have one to one mapping
relationships. Furthermore, the authors have tried to apply the relaxation
techniques [RHZ76, FFCS06] to both the LSS and LSA methods. The basis
of relaxation techniques are to iteratively modify the local similarities based
on the compatibility among minutiae relationships. In particular, given a
pair of minutiae a and b, if the global relationships among a and some other
minutiae in template A are compatible with the global relationships among
b and the corresponding minutiae in template B, then the local similarity
between a and b is strengthened, otherwise it is weakened [CFM10]. In
brief, relaxation techniques explore the interrelationships among minutiae
points in a fingerprint template, then the weight of a minutiae pair is itera-
tive modified according to the interrelationships with other minutiae pairs.
In the authors’ experiments, the LSA with relaxation techniques achieve
the best experimental results with respect to the metric of EER.
In this section, we introduce four methods to calculate the global match-
ing score. The first one uses core points as reference points for pre-alignment
then followed by using BMB for a further alignment and matching. The pre-
alignment is performed by superimposing two fingerprint images based on
the positions of a pair of core points. The second one uses the minutiae
interrelationships for validation of minutiae pair candidates. Then the val-
idated minutiae pairs are used for matching. The third method uses the N
147

number of most reliable minutiae pairs as reference point pairs for finger-
print alignment (the value of N is decided by experimental observations) .
Then the highest matching score among those alignments is chosen as the
final matching score. Besides, we find that using the average value of the
matching score from each alignment obtains better results than just choos-
ing the highest matching score which will be discussed in Section 5.1.4.3.
5.1.3.1 Pre-alignment by SP before the matching
Pre-alignment aims to obtain a superimposed image between two fingerprint
images. This method is also introduced in the published paper [WBS12b].
This pre-alignment consists of two steps: 1), a coarse alignment by core
points; 2), a refined alignment by pairing the minutiae based on the HD
values of the binarized minutiae blocks.
In this pre-alignment, only core points are used as reference points. This
is because delta points are often missed in partial fingerprints. This situa-
tion is caused by the fact that a core point is normally in the center of a
fingerprint, but a delta point is normally on the edge of a fingerprint.
148
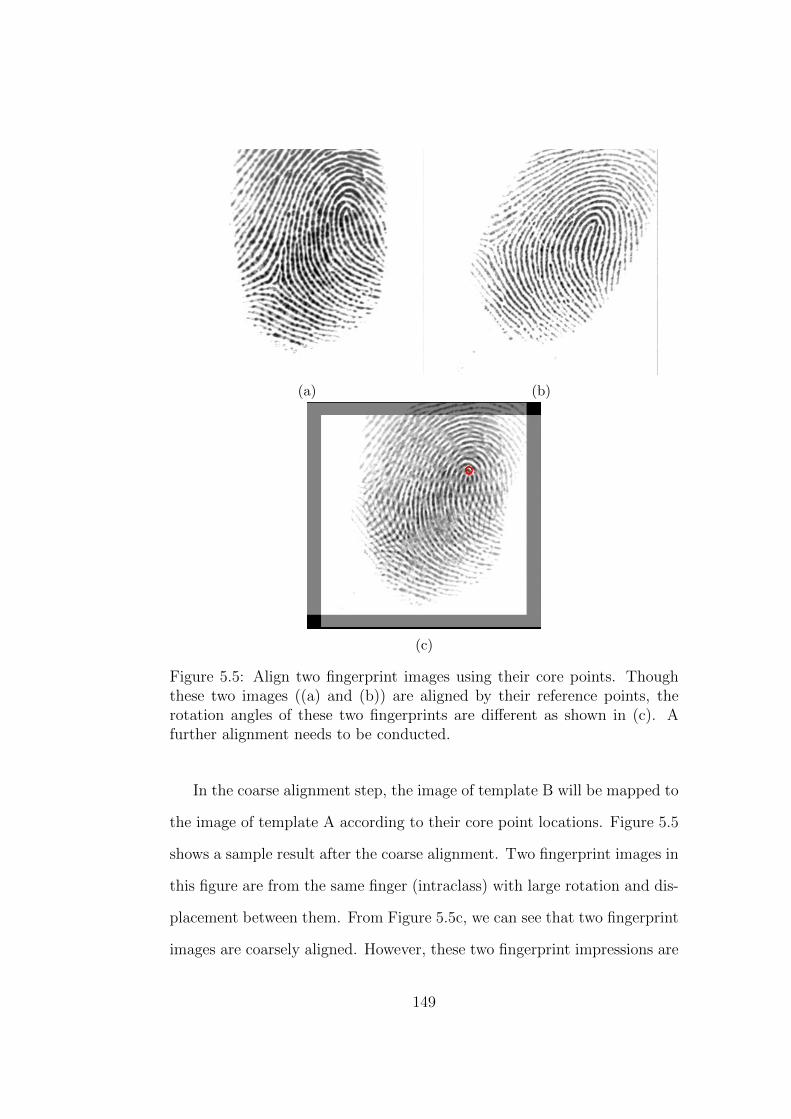
(a) (b)
(c)
Figure 5.5: Align two fingerprint images using their core points. Thoughthese two images ((a) and (b)) are aligned by their reference points, therotation angles of these two fingerprints are different as shown in (c). Afurther alignment needs to be conducted.
In the coarse alignment step, the image of template B will be mapped to
the image of template A according to their core point locations. Figure 5.5
shows a sample result after the coarse alignment. Two fingerprint images in
this figure are from the same finger (intraclass) with large rotation and dis-
placement between them. From Figure 5.5c, we can see that two fingerprint
images are coarsely aligned. However, these two fingerprint impressions are
149

not placed in the same directions, so some rotations have to be done in the
next stage.
(a) (b)
Figure 5.6: Pairing the minutiae points after the coarse alignment.
After the coarse alignment, a refined alignment is performed based on
the minutiae point information. Assume the positions of core points are
denoted as CA:(xa, ya) and CB:(xb, yb) from template A and B respectively.
Then the shifting amount of positions is δx = xa − xb, δy = ya − yb. Thus
the new minutiae points set MB of template B could be represented as M ′B
= {(x1 + δx, y1 + δy), (x2 + δx, y2 + δy),...,(xn + δx, yn + δy)} where n is
the total number of minutiae points in template B. Then for each minutiae
point in template A, several candidate minutiae points could be selected
from template B as minutiae pairs. Figure 5.6 shows an example of minutiae
pair selections. For a minutiae point mi in template A, the minutiae points
in template B within the radius of a threshold Tr will be listed as the possible
minutiae pairs. Tr is a threshold to decide the size of the radius to search the
corresponding minutiae pair in template B for each minutiae in template A
150

as shown in Figure 5.6. This selection is based on the assumption that the
fingerprint rotation difference should not exceeds 60 degrees, which is based
on the observation of FVC 2002 and 2006 databases. If the minutiae pair
with the smallest HD, and the HD value is smaller that a threshold THD,
then this minutiae pair will be selected as the final minutiae pair for rotation
and matching. The threshold THD is used to reject the unreliable minutiae
pairs. Then we can obtain an average angle difference of these minutiae
pairs which could be used for alignment. Finally we rotate the image B
by that average rotation angle (this rotation is not compulsory because the
final matching score could be calculated based on the paired minutiae as
we will introduce below). Figure 5.7 shows a superimposed image after the
alignment of the images in Figure 5.6.
Figure 5.7: Overlapping areas after alignment.
151

Figure 5.8: Experimental results of FVC2002 DB1a plotted using ROCcurve of GAR vs. FMR. (GAR means Genuine Acceptance Rate, GAR =1-FNMR.
After the minutiae pairing, an overall matching score could be calculated
by the equation 5.2. Figure 5.8 shows the receiver operating characteristic
(ROC) curve of experiment results of our method. A ROC curve is a graphi-
cal plot ”which illustrates the performance of a binary classifier system as its
discrimination threshold is varied” [Bra97]. ROC curves are widely used in
the field of medicine, radiology, biometrics etc. [BD06]. From Figure 5.8, we
can see that the equal error rate (EER) of our method is 2.47% for FVC2002
DB1a. EER means the error rate when FMR = FNMR. It indicates the
overall performance of a biometric recognition system. The comparison of
the matching results with other matching methods is illustrated in Section
5.2.4. For easy comparisons with the other matching method designed in
152

the following sections, we denote this method as M1.
5.1.3.2 Minutiae pair validation by exploring the minutiae inter-
relationships
Another global similarity calculation method is based on exploring the inter-
relationships (include position and direction relationship) among minutiae
points. This method uses these minutiae interrelationships to validate the
minutiae pairs. Minutiae pairs in Table 5.2 are possible genuine pairs, but
the table also contains false pairs. An appropriate minutiae pair validation
stage can remove those false pairs. Therefore, validations of minutiae in-
terrelationship are applied to the minutiae pair candidate table. Usually,
the angle difference and distance between each two minutiae may be used
for validation. Several parameters are defined to evaluate the similarities
between minutiae pairs. Table 5.3 shows the parameters and their descrip-
tions. These parameters are generated as per description in Table 5.1. The
distance between two minutiae points is calculated by equation 5.4, and the
angle between minutiae point (xi, yi) and another minutiae point (xj, yj) is
calculated by the equation 5.5. The values of angle α lie in the range of
[0, 360) degrees (or [0, 2π)).
153

Table 5.3: Parameters may be used for minutiae validation. The variableK refers to the total number of minutiae pair candidates as shown in Table5.1
Parameter Description
di,j Distance between each two minutiae from the same tem-
plate according to Table 5.1. i, j ∈ {1...K}.
∆θi Angle difference of a minutiae pair candidate. It also in-
dicates the possible rotation angle between two enrolled
fingerprint images. ∆θi = θ′i − θi, (i = 1...K). It is
shown in column ∆Angle of Table 5.1
αi,j Angle from one minutiae point to another minutiae
point. Two minutiae points are from the same template.
The angle α calculation refers to equation 5.5
di,j =√
(xi − xj)2 + (yi − yj)2 (i, j = 1...K) (5.4)
αi,j =
atan(−(yi − yj)/(xi − xj)) if xi >= xj and yi >= yj
atan(−(yi − yj)/(xi − xj)) + π/2 if xi < xj (i, j = 1...K)
π − atan(−(yi − yj)/(xi − xj)) if xi > xj and yi < yj
(5.5)
5.1.3.2.1 Minutiae pair validation by distance and angle
One possible method to validate the minutiae pair candidates in Table 5.1
is using the position and direction relationships between each two minutiae
pair candidates. Because genuine minutiae pairs are unique (relative posi-
154

tions and angles), the distances and angle difference between two minutiae
points from the same template are constant, if they are from two genuine
minutiae pairs. For example, if two genuine minutiae pairs contain minu-
tiae points: (Mi,M′i) and (Mj,M
′j) respectively, then we have the distance
di,j = di′,j′ and direction angle αi,j = αi′,j′ . Due to non-linear distortions
and noise, the distances and direction angles may not be exactly the same
in reality. Two thresholds Td and Tθ need to be assigned to allow for the
tolerance in distortions of distances and direction angles respectively (Td
and Tθ are determined by experiment observation, which is introduced in
Section 5.2.3). Table 5.4 shows the validation table to determine whether
a minutiae pair is valid or not. In this table, i and j refer to the number
(No.) of the minutiae pair candidates as shown in Table 5.2 , which means
ith and jth rows’ minutiae pairs. The variable ∆di,j indicates the distance
difference between di,jand di′,j′ . In theory, ∆di,j should equal 0, if both ith
and jth minutiae pairs are genuine. Because of distortions, this value may
have a small range of deviation in the case of genuine pairs. Therefore,
one condition to validate the minutiae pairs could be to set a threshold as:
|∆d| <= Td, which also is shown in equation 5.6. ∆Angle β is the difference
in ∆θi and ∆θj. Because ∆θ indicates the rotation angle between two fin-
gerprint images, this value should be constant in theory if any minutiae pair
candidate is genuine, and ∆θi should be equal to ∆θj. In practice, this value
may have a small variation due to the non-linear distortions of fingerprint
images. Here we get one condition to validate the minutiae pair which is:
|βi,j| = |∆θi −∆θj| <= Tθ, which is also shown in equation 5.6. αi,j is the
direction angle oriented from one minutiae point mi to another minutiae
point mj. In theory, the difference of αi,j and α′i,j equals the rotation angle
155

of images if both ith and jth minutiae pairs are genuine. If we define the
ground true rotation angle as Rθ, then the condition |β′−Rθ| <= Tθ should
be fulfilled. However, it is not possible to obtain the value of Rθ unless two
fingerprints have been correctly aligned already. But because ∆θ is also a
variable to indicate the rotation angle between two fingerprints, Rθ should
be equal to ∆θi and ∆θj in theory, if both ith and jth minutiae pairs are
genuine minutiae pairs. Therefore, the condition of |β′ − Rθ| <= Tθ could
be replaced as |β′i,j −∆θi| <= Tθ and |β′i,j −∆θj| <= Tθ in practical for the
validation of ith and jth minutiae pairs.
Table 5.4: Generated validation table.
Minutiae
pair
No.
∆Distance
∆d
∆Angle′
β′
∆ Angle
β
Minutiae
from Tem-
plate A
Minutiae
from
Template
B
Valid
ation
1 2 d1,2−d1′,2′ α1,2 −
α1′,2′
∆θ1−∆θ2 (x1, y1),
(x′1, y′1)
(x2, y2),
(x′2, y′2)
V1,2
...
...
...
...
...
...
...
...
i j di,j − di′,j′ αi,j−αi′,j′ ∆θi−∆θj (xi, yi),
(x′i, y′i)
(xj, yj),
(x′j, y′j)
Vi,j
...
...
...
...
...
...
...
...
m−
1
m dm−1,m −
dm−1′,m′
αm−1,m −
αm−1′,m′
∆θm−1 −
∆θm
(xm−1, ym−1),
(x′m−1, y′m−1)
(xm, ym),
(x′m, y′m)
Vm,m−1
156
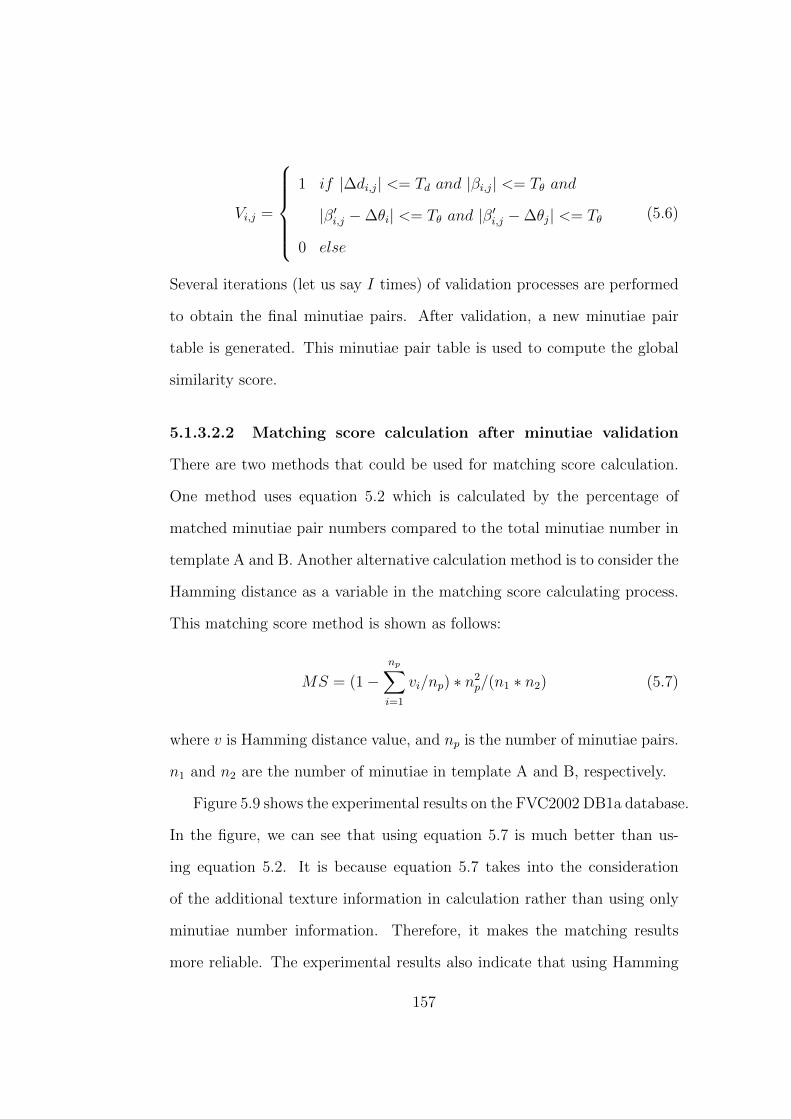
Vi,j =
1 if |∆di,j| <= Td and |βi,j| <= Tθ and
|β′i,j −∆θi| <= Tθ and |β′i,j −∆θj| <= Tθ
0 else
(5.6)
Several iterations (let us say I times) of validation processes are performed
to obtain the final minutiae pairs. After validation, a new minutiae pair
table is generated. This minutiae pair table is used to compute the global
similarity score.
5.1.3.2.2 Matching score calculation after minutiae validation
There are two methods that could be used for matching score calculation.
One method uses equation 5.2 which is calculated by the percentage of
matched minutiae pair numbers compared to the total minutiae number in
template A and B. Another alternative calculation method is to consider the
Hamming distance as a variable in the matching score calculating process.
This matching score method is shown as follows:
MS = (1−np∑i=1
vi/np) ∗ n2p/(n1 ∗ n2) (5.7)
where v is Hamming distance value, and np is the number of minutiae pairs.
n1 and n2 are the number of minutiae in template A and B, respectively.
Figure 5.9 shows the experimental results on the FVC2002 DB1a database.
In the figure, we can see that using equation 5.7 is much better than us-
ing equation 5.2. It is because equation 5.7 takes into the consideration
of the additional texture information in calculation rather than using only
minutiae number information. Therefore, it makes the matching results
more reliable. The experimental results also indicate that using Hamming
157

distance to calculate the matching score increases the accuracy of a fin-
gerprint recognition system as compared to the traditional matching score
calculation method (equation 5.2).
Figure 5.9: The ROC curve of the experimental results of the FVC2002DB1a database is shown in the figure. The blue curve uses equation 5.7to calculate the matching scores and the red curve uses equation 5.2. Theparameter values are: blocksize for minutiae pairing: 60 x 60; selection ofthreshold values: Td = 15 pixels and Tθ = 15 degrees.
5.1.4 Use the reliable minutiae pairs for alignment
before matching
Another matching score calculation method is to use a reliable pair of minu-
tiae points as a pair of reference points for fingerprint alignment. Then the
matching score is calculated based on the alignment. This method is intro-
158

duced in the following sections.
5.1.4.1 Matching score calculation: based on matched minutiae
number
Because the Hamming distance indicates the dissimilarity between two bi-
narized blocks, the lower the HD value is, the higher possibility that a pair
of minutiae points is genuine. These minutiae pairs with low HD values
may be taken as reference points for alignment.
Alignment based on one minutiae pair can be conducted by setting the
minutiae point (xr, yr) in the first template as a reference point. Based
on this reference point, adequate rotation and shifting are performed to its
paired minutiae point (x′r, y′r) in the second template to make two points
overlapped ((x′r, y′r) −→ (xr, yr) ). Finally, all other minutiae points in the
second template are rotated and shifted by the same amount. The equations
5.8 and 5.9 show the shifting and rotating for a minutiae point (x′i, y′i) in
template B. After alignment, if the differences of distance and angle for two
minutiae points are in the range of [0, Td] and [0, Tθ], respectively, then these
two minutiae are picked up as a pair. Then the equation 5.2 (the traditional
matching score calculation method introduced in Section 5.1.3) is used to
calculate the matching score.
x′i = x′i + xr − x′r
y′i = y′i + yr − y′r(5.8)
where (x′i, y′i) is a minutiae point in template B, and (xr, yr) and (x′r, y
′r) are
a pair of reference points.
159

(x′i, y′i) = [x′i, y
′i] ∗
cos(∆θr) sin(∆θr);
−sin(∆θr) cos(∆θr)
(5.9)
where ∆θr is the rotation angle between two reference points.
Figure 5.10: FVC2002 DB1a results using the above matching score calcula-tion method ROC curve. This curve shows the result of using the top threeminutiae pairs with lowest Hamming distance value for alignment, then thematching score is calculated afterwards using equation 5.2. The parametervalues are: blocksize for minutiae pairing: 60 x 60; threshold of distance:Td = 15 pixels and threshold of angle: Tθ = 15 degrees.
Figure 5.10 shows the result of using the top three minutiae pairs with
lowest Hamming distance values for alignment. Then the final matching
score chooses the highest matching score among three comparisons. The
matching score calculation uses the equation 5.2.
160

5.1.4.2 Matching score calculation: based on matched minutiae
number and block similarity
Alternatively, Hamming distance is another way to evaluate the matching
similarity. Equation 5.10 shows the calculation of the matching score by
using the Hamming distance and paired minutiae numbers. Figure 5.11
shows the ROC curve of FVC2002 DB1a results using the equation 5.7 to
calculate the matching scores. Compared to Figure 5.10, the performance
of using minutiae blocks is much better than using the traditional matching
score calculation method in equation 5.2.
MS = (1− (
np∑i=1
vi)/np) ∗ n2p/(n1 ∗ n2) (5.10)
where v denotes the Hamming distance value, np is the number of paired
minutiae, and n1 and n2 are the number of minutiae from two enrolled
templates respectively.
Figure 5.11 shows the ROC curve of the results of FVC2002 DB1a using
the above matching method. The selected parameter values are the same as
Figure 5.10. Comparing Figure 5.10 and 5.11, we can see using Hamming
distance to calculate the matching score is superior to the method using
minutiae numbers for calculation. The EER is improved from 2.66% to
2.05%, which means the overall accuracy is increased. Besides, ZeroFMR is
improved from 27.14% to 7.00%. ZeroFMR is a metric to indicate whether
a biometric recognition system is suitable for high security applications
[SB11]. The decrease of ZeroFMR indicates that using HD for the match-
ing score calculation is more suitable than using the traditional minutiae
number based matching score calculation for high security applications.
161

Figure 5.11: The ROC curve of FVC2002 DB1a results using the abovematching score calculation method. This curve shows the result of usingthe top three minutiae pairs with the lowest Hamming distance value foralignment, then the matching score is calculated afterwards. The parametervalues are: blocksize for minutiae pairing: 60*60; blocksize for matching:60*60; threshold of distance: Td = 15 pixels and threshold of angle: Tθ = 15degrees.
The advantage of choosing the highest matching score as the final match-
ing score is that only one genuine minutiae pair is needed among the N
most reliable minutiae pairs to obtain a high matching score for intra-class
matching. This method is denoted as M3 for the purpose of comparisons of
experimental results.
162

5.1.4.3 Using average matching score of N times’ alignments
The previous global similarity calculation method uses N most reliable
minutiae pairs for alignment, then the alignment with the highest match-
ing score is chosen as the final one. This matching method is reasonable,
because for a pair of intra-class fingerprint templates, it is highly likely to
have one or more genuine minutiae pairs among minutiae pairs with the
lowest HD values. For example, Cappelli et al. [CFM10] use the average
matching score of the top n (they choose 10) most similar minutiae cylinder
pairs as the final matching score.
Alternatively, we try to use the average matching score of each alignment
by using the top N most similar minutiae pairs. Figure 5.12 shows the
ROC curves of matching results using the average matching score instead
of choosing the highest matching score. The EER values are improved in
both cases of using equation 5.2 and 5.7 for matching score calculations.
The ZeroFMR and FMR1000 of the minutiae pair number based (equation
5.2 ) method are significantly improved, which are from 27.14% to 6.54%
and 6.79% to 4.5 % respectively. In the case of the Hamming distance
based method (equation 5.7), though the ZeroFMR and FMR100 is slightly
increased, the EER is significantly decreased from 2.05% to 1.76%. This
method is denoted as M4 for the purpose of comparisons of experimental
results. The difference between M4 and M3 is that M3 only needs one
genuine minutiae pair in the N pairs of minutiae used as reference points to
obtain a high matching score, but M4 needs the majority of the N pairs of
minutiae to be genuine ones to obtain a high matching score. Therefore, M4
eliminates the cases in which some inter-class matching is falsely considered
163

as matched fingerprints due to the occasionally high matching score by
one pair of reference points. Based on the experimental observation, we
found that most of these occasional cases happen when both the register
template and query template only have a small number of minutiae (e.g.
partial fingerprint). Therefore, using the average matching score of N times
alignment is more reliable than choosing the highest matching score among
N times alignment.
Figure 5.12: Using the average matching score after the alignment usingthe five (N=5) most reliable minutiae pairs. The blue and red curves useequations 5.2 and 5.7 to calculating the matching score respectively.
In summary, these four global similarity calculation methods are based
on the new metric BMB. The accuracy of the fingerprint matching score is
highly depended on the reliability of the new metric BMB. The BMB utilizes
the texture information surrounding the minutiae points as well as minutiae
164

information. Thus, more information has been taken into consideration in
fingerprint matching compared to other minutiae based (no texture informa-
tion) and correlation based (no minutiae information) matching methods.
Figure 5.13 shows the procedure of the matching process of using BMB
for matching. The next section will examine these four global similarity
calculation methods by conducting experiments on FVC databases. The
experimental results may also indicate the reliability and accuracy of using
the new matching metric BMB.
(a)
(b)
Figure 5.13: (a), flowchart of the matching process of this method. (b), fourglobal similarity score calculation methods
165

5.2 Experiments
This section introduces the experiments conducted to evaluate the proposed
matching methods. The fingerprint matching system is first designed and
implemented. Then the experimental environment and matching protocols
are introduced. Subsequently, the optimized parameters’ values are selected
for this matching method.
5.2.1 Fingerprint matching procedure
A typical fingerprint verification procedure has been introduced in Chapter
1. The matching procedure we designed for experiments has used the al-
gorithms we designed in previous chapters including image pre-processing
and core point detection. Besides, it also uses other fingerprint recognition
techniques to compose a simple fingerprint verification system, including
local ridge orientation and frequency estimation, contextual filtering (Ga-
bor filtering) technique and run-lenth minutiae detection techniques. The
following flowchart shows the matching process:
Figure 5.14: The implemented fingerprint matching procedure.
166

5.2.2 Experimental environment and matching proto-
cols
All the fingerprint recognition techniques are implemented in the Matlab
R2013a platform running on a computer with an Intel CPU of core duo 3.33
GHz.
FVC 2002 DB1a, DB2a and FVC2006 DB2a are used to evaluate the
designed matching metric. The image acquisition conditions were the same
for each database, which are: interleaved acquisition of different fingers to
maximize differences in finger placement, no care was taken in assuring a
minimum quality of the fingerprints and the sensors were not periodically
cleaned. During some sessions, individuals were asked to: a) exaggerate dis-
placement or rotation or, b) dry or moisten their fingers [AFF09]. Therefore,
the fingerprint images in these databases contain plenty of variations and
noise, which means that they are specially suitable for the evaluations of
fingerprint recognition algorithms.
The matching protocol uses the FVC standard. For FVC2002 databases,
one database contains 100 groups of fingerprint images. Each group has
eight fingerprint impressions from the same finger. There are C28∗100 = 2800
comparisons for intra-class matching. And for inter-class matching, the first
image of each group is used for matching. The total number of inter-class
matching is C2100 = 4950 . Besides the FVC2002 databases, FVC2006 DB2a
is also used for experiments. This database contains 140*12 images. Thus
the total number of comparisons for intra and inter-class is C212 ∗140 = 9240
and C2140 = 9730 respectively.
167

5.2.3 Parameter selections
There are four parameters used in our matching methods. Table 5.5 shows
the parameter value selections. The selected values are based on the exper-
imental observation and analysis of FVC2002 DB1a.
Table 5.5: Parameter value selections.
Parameters Value Descriptions
Tr 60 Threshold of the radius of a minutiae point
for the selection of minutiae pairs in the first
global similarity calculation method.
THD 0.35 Threshold of the Hamming distance for the
selection of minutiae pairs in the first global
similarity calculation method.
Td 15 Threshold of the difference of spatial dis-
tances used in equation 5.6.
Tθ 15 Threshold of the difference directions be-
tween any two minutiae points or core point
and a minutiae point.
I 5 Times of iterations to validate the minutiae
pairs.
N 5 Numbers of minutiae pairs selected for align-
ment.
s 60 Length of chosen minutiae blocks for minu-
tiae pair generation and matching score cal-
culations. The size of the blocks is s x s.
168
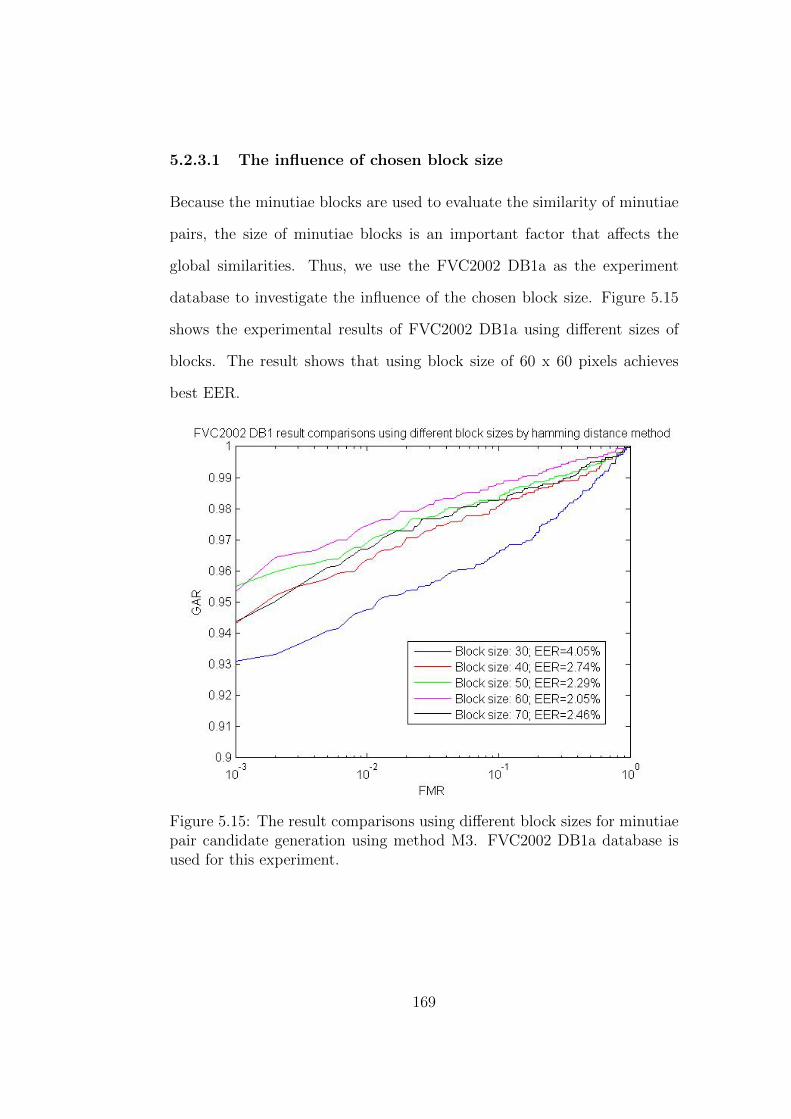
5.2.3.1 The influence of chosen block size
Because the minutiae blocks are used to evaluate the similarity of minutiae
pairs, the size of minutiae blocks is an important factor that affects the
global similarities. Thus, we use the FVC2002 DB1a as the experiment
database to investigate the influence of the chosen block size. Figure 5.15
shows the experimental results of FVC2002 DB1a using different sizes of
blocks. The result shows that using block size of 60 x 60 pixels achieves
best EER.
Figure 5.15: The result comparisons using different block sizes for minutiaepair candidate generation using method M3. FVC2002 DB1a database isused for this experiment.
169

5.2.4 Experimental results and comparisons
We uses FVC2002 DB1a, DB2a and FVC2006 DB2a as the testing databases.
EER is the major metric to evaluate the overall performance in this ex-
periment. The experiments include intra-class and inter-class tests. The
intra-class test is used to examine the match rate of a pair of fingerprint
templates from the same finger. The inter-class test is used to examine the
non-match rate of a pair fingerprint templates from different fingers. False
non-match rate (FNMR) is a metric to measure the intra-class test (FNMR
= 1 - GAR, GAR means Genuine Acceptance rate), while false match rate
(FMR) is to measure the inter-class test. Table 5.6 shows the experimental
results of our methods as well as other reported matching methods using
ROC curves of GAR vs. FMR.
170
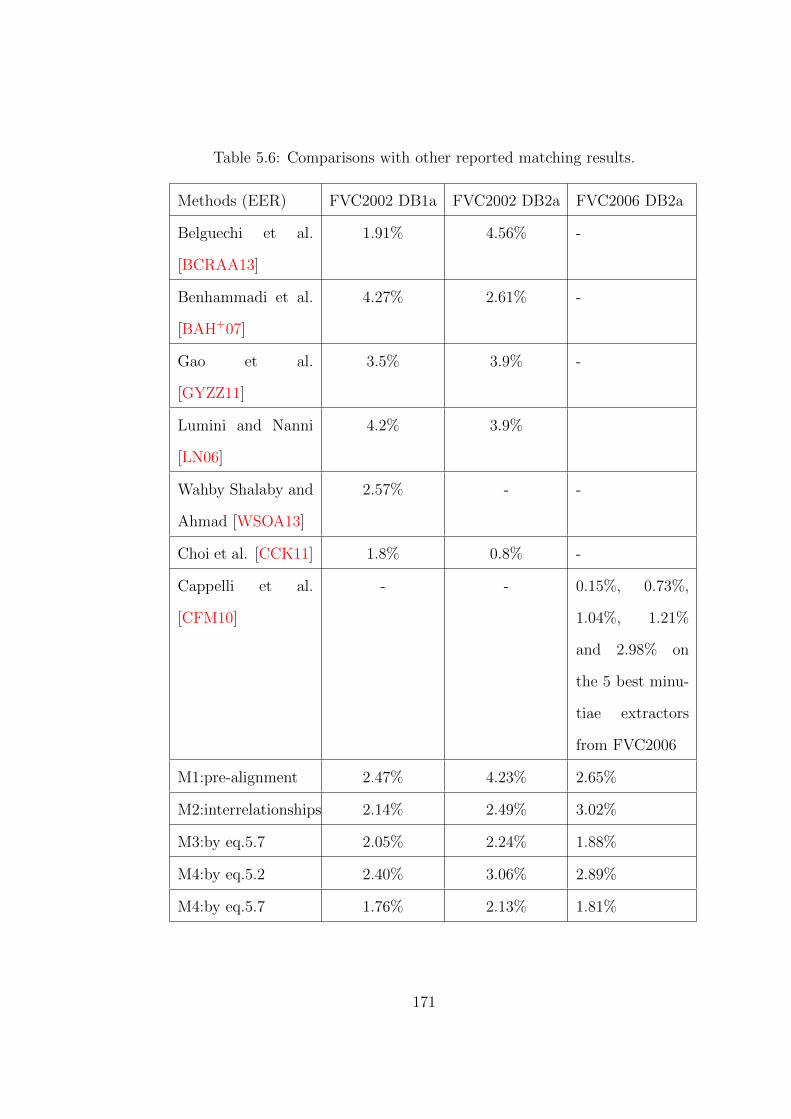
Table 5.6: Comparisons with other reported matching results.
Methods (EER) FVC2002 DB1a FVC2002 DB2a FVC2006 DB2a
Belguechi et al.
[BCRAA13]
1.91% 4.56% -
Benhammadi et al.
[BAH+07]
4.27% 2.61% -
Gao et al.
[GYZZ11]
3.5% 3.9% -
Lumini and Nanni
[LN06]
4.2% 3.9%
Wahby Shalaby and
Ahmad [WSOA13]
2.57% - -
Choi et al. [CCK11] 1.8% 0.8% -
Cappelli et al.
[CFM10]
- - 0.15%, 0.73%,
1.04%, 1.21%
and 2.98% on
the 5 best minu-
tiae extractors
from FVC2006
M1:pre-alignment 2.47% 4.23% 2.65%
M2:interrelationships 2.14% 2.49% 3.02%
M3:by eq.5.7 2.05% 2.24% 1.88%
M4:by eq.5.2 2.40% 3.06% 2.89%
M4:by eq.5.7 1.76% 2.13% 1.81%
171

where M1: Proposed pre-alignment based method; M2: Proposed minu-
tiae block matching method with minutiae pair validation using minutiae
interrelationships; M3: Using N minutiae pairs with the lowest Hamming
distance for fingerprint alignment before matching. The final matching score
selects the highest matching score among the N alignments. The matching
calculation uses equation 5.7; M4: Using N minutiae pairs with lowest Ham-
ming distance for fingerprint alignment before matching, the final matching
score is the average score of N times alignment.
From Table 5.6, we can see that our methods obtains better exper-
imental result than most of the state-of-the-art matching methods (e.g.
[BCRAA13, BAH+07, GYZZ11, LN06]). Feng et. al [FZ11] has reported
that the minutiae cylinder code (MCC) method developed by Cappelli et
al. [CFM10] is one of the best matching methods so far in their investiga-
tion. Cappelli et al. [CFM10] reported that their method achieves 0.15%,
0.73%, 1.04%, 1.21% and 2.98% using the five best minutiae extractors in
the FVC2006 campaign respectively. Among these five minutiae extractors,
four are from commercial developers and one is anonymous developer. Our
methods M1, M3 and M4 in the Table obtain 2.65%, 1.88% and 1.81%
respectively, which are better than the result using the fifth best extrac-
tor from FVC2006 with MCC. Besides, the method M4 using equation 5.7
obtains 1.76% on FVC2002 DB1a which is the best in the table. Figure
5.16, 5.17 and 5.18 shows the results of our methods on FVC2002 DB1a,
FVC2002 DB2a and FVC2006 DB2a respectively. From the figures, we
can see that M2 which uses minutiae interrelationships are not performed
as well as M3 and M4 which uses Hamming distance and top N minutiae
pairs’ alignment. But it is better than the core based method (M1) and top
172

N minutiae pairs’ alignment without using Hamming distance (M3). Be-
sides, by comparing the experimental results using the equations 5.2 and 5.7
in method M4, we can see that using Hamming distance as a parameter to
calculate the matching score obtains better matching results than only using
the paired minutiae number percentage as the matching score. The aver-
age matching accuracy is improved by 46% when using Hamming distance
for the matching score calculation. This is because texture information
surrounding minutiae points have contributed to the final matching score
calculations. Briefly, the experimental results suggest that the binarized
minutiae block is an alternative reliable feature for fingerprint matching.
In the efficiency aspect, the running speed of our methods are on average
less than 1, 0.6, 0.5, 0.2 and 0.5 seconds per matching on the MATLAB
2013a platform, respectively, for method M1, M2, M3 by equation 5.7, M4
by equation 5.2 and M4 by equation 5.7. The processing time for template
generation and minutiae pair calculation (in Section 5.1.1 and 5.1.2) is on
an average less than 0.1 and 0.4 seconds per processing. The fastest method
is M3 and M4 using equation 5.2 which does not require Hamming distance
comparisons. The second fastest is M3 and M4 using equation 5.7 followed
by M2. Because M2 validates the minutiae iteratively by using the minutiae
interrelationships, it is not as fast as M3 and M4. The slowest method is
using the pre-alignment method, however, this running time contains the
alignment and matching stages.
Anyway, the matching accuracy is not only based on the matching algo-
rithms but also on the feature extractors. Good feature extractors normally
include a procedure of quality analysis on the extracted features, which has
not been implemented in our system. For example, Cappelli et al.’s results
173
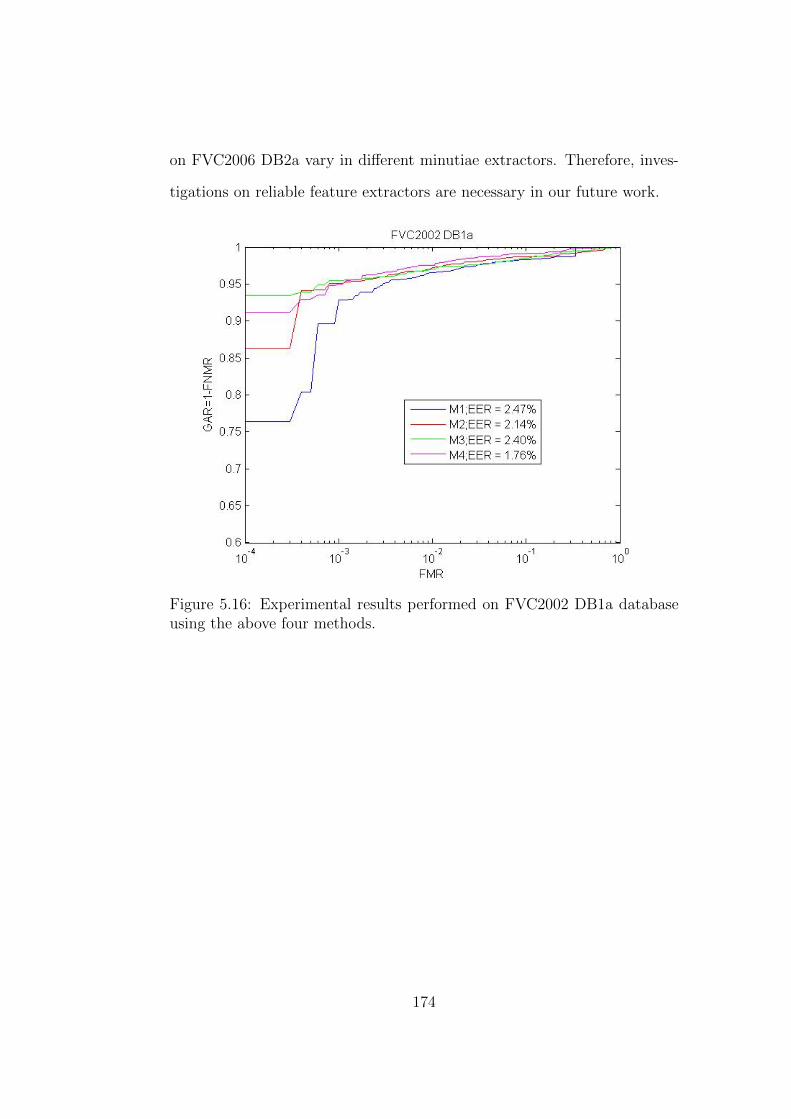
on FVC2006 DB2a vary in different minutiae extractors. Therefore, inves-
tigations on reliable feature extractors are necessary in our future work.
Figure 5.16: Experimental results performed on FVC2002 DB1a databaseusing the above four methods.
174
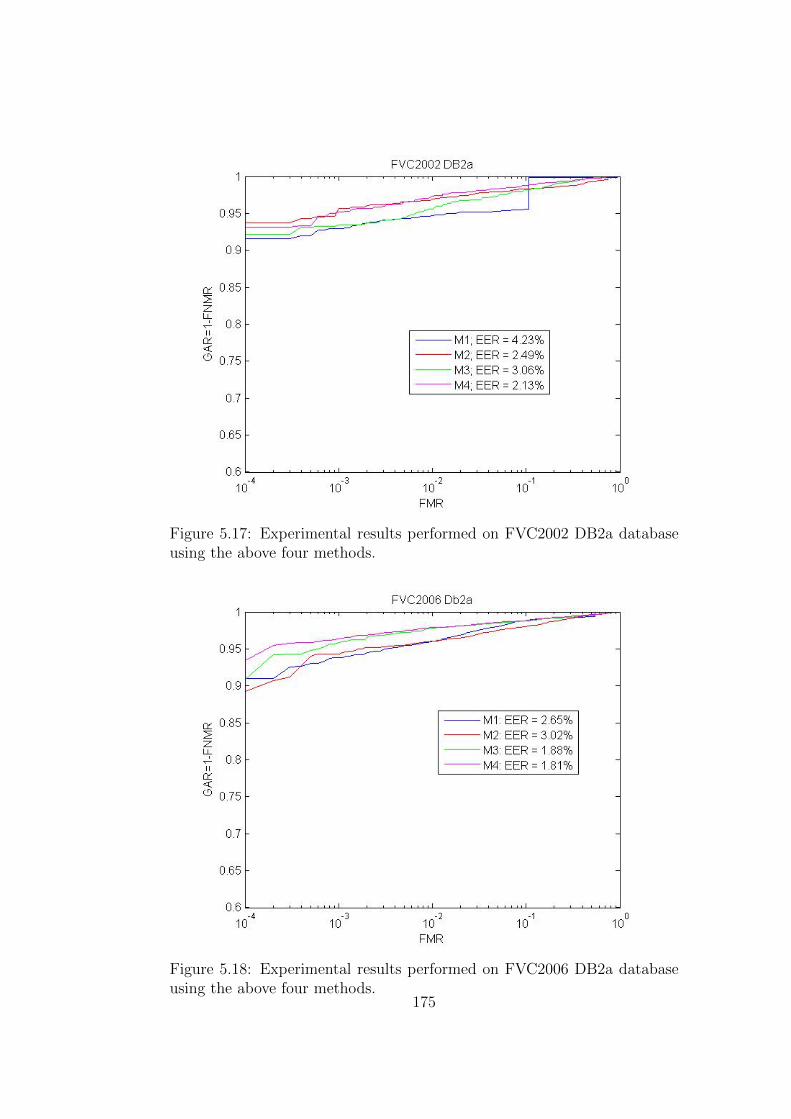
Figure 5.17: Experimental results performed on FVC2002 DB2a databaseusing the above four methods.
Figure 5.18: Experimental results performed on FVC2006 DB2a databaseusing the above four methods.
175

5.2.4.1 Analysis of decidability index of using BMB
The decidability index d′ is one measure of how well the two distributions
(distributions of intra-class and inter-class matching scores) are separated.
[Dau04]. The matching errors are caused due to the overlap of the dis-
tributions of inter-class and intra-class matching scores. It has been used
for performance evaluation for biometric technologies. If their two means
are µ1 and µ2, and their standard deviations (std) are δ1 and δ2, then the
decidability index d′ is defined as:
d′ =|µ1 − µ2|√δ21 + δ22
(5.11)
The decidability index d′ evaluate the how different between intra-class
and inter-class matching scores. If the decidability index d′ is low, then the
distributions of intra-class and inter-class matching scores may close to each
other and cause more overlaps. In particular, given a matching score, the
decidability index indicates the confidence level that we can determine it be-
longs to an inter-class comparison or an intra-class comparison. Therefore,
it indicates the reliability of the recognition technologies as well.
Very limited research has been done for using decidability index to eval-
uate the fingerprint recognition techniques, the only research work could
be found by the author is Park et al.’s work [PLP03], which uses decid-
ability index to evaluate their matching method. Compared to the Jain et
al.’s [JPHP00] method, the decidability index of their matching method is
increased from 2.67 to 2.85. In our perception, one major reason that de-
cidability index is not popular in fingerprint recognition is that decidability
index is relatively low for fingerprint recognition compared to iris recogni-
176

tion (the decidability index is in the range of 7 to 14 for iris [Dau04]), and
the decidability index may not distinguish among different matching tech-
niques. Besides, the matching accuracy is the major concern in fingerprint
recognition, thus improving the matching accuracy is more important to
increase the decidability index.
In this work, we use the decidability index to evaluate the reliability of
BMB by comparing the obtained decidability index between the matching
score calculation methods using HD (equation 5.7) and traditional minu-
tiae based calculation (5.2). Figure 5.19 shows the distributions of matching
scores for inter-class and intra-class comparisons for FVC 2002 DB1a us-
ing matching method M2 (the ROC curve of the matching results is shown
in Figure 5.9). Figure 5.19a shows the matching score distributions using
equation 5.2, which is based on the percentage of paired minutiae num-
bers for matching score calculation. Figure 5.19b shows the matching score
distribution using equation 5.7, which incorporates the HD into the final
matching score calculation. The decidability index of Figure 5.19a and
5.19b is d′ = 3.13 and d′ = 4.46, respectively. We can see that using HD
in the final matching score calculation (equation 5.7) obtains much higher
decidability index than the traditional matching score calculation method
(equation 5.2). Therefore, using HD for matching is a more reliable way
than traditional minutiae based matching score calculation, which also in-
dicates that BMB is a reliable metric for fingerprint matching.
177

(a) Using equation 5.2 for matching score calculation, which does not use HD.
(b) Using equation 5.7 for matching score calculation, which incorporates HD inthe matching score calculation.
Figure 5.19: Distribution of matching score of FVC 2002 DB1a datasetusing global similarity calculation method M2. The decidability index of(a) and (b) is 3.13 and 4.46. respectively.
In conclusion, the advantages of this matching approach could be sum-
marized as follows:
• The metric BMB not only contains minutiae information (location and
direction), but also the texture information. Thus, more information
has been taken into consideration in fingerprint matching compared to
other minutiae based (no texture information) and correlation based
(no minutiae information) matching methods.
178

• The local similarity calculation of a minutiae pair is straightforward,
which is based on the HD value between two BMBs. HD uses XOR
operation which is fast and can be performed in one CPU cycle.
• High tolerance to missing and spurious minutiae. In M3 and M4, only
one and N genuine minutiae pair are needed to obtain a high match-
ing score, respectively. Besides, spurious minutiae is not probable to
obtain low HD values during the comparison of BMBs. Thus, the
problem of missing and spurious minutiae is well addressed.
• High tolerance to non-linear distortion. Unlike correlation based meth-
ods, only surrounding texture information of minutiae points is used
for matching rather than using the texture information of a whole fin-
gerprint. Thus, the tolerance to non-linear distortion of this method
is as high as other minutiae based methods, which are much higher
than correlation based methods.
• The reliability of BMB is high as shown in the experimental results
(the matching results and the decidability index). The matching re-
sults are better than most reported matching methods. BMB is able
to reduce the possibility that a pair of inter-class fingerprints is falsely
matched as a pair of intra-class fingerprints, because the comparisons
of BMBs between a pair of inter-class fingerprints could not obtain
low HD values as intra-class fingerprints do.
179
5.3 Conclusions
In this chapter, we have proposed a new matching metric named binarized
minutiae block (BMB) for fingerprint matching. Furthermore, four differ-
ent global similarity calculation methods have been proposed to evaluate
this new metric. The first method is based on pre-alignment using core
points as reference points and binarized minutiae blocks (denoted as M1).
The coarse alignment uses the detected reference points to shift the query
fingerprint image. Then a refined alignment stage is performed uses the
binarized minutiae blocks. The matching results of this method is better
than many other reported methods shown in Table 5.6. The second one
(denoted as M2) explores the interrelationships between minutiae points.
The third one (denoted as M3) uses the top N minutiae pairs with the low-
est Hamming distance for fingerprint alignment. Then N matching scores
are calculated using minutiae based calculation equation 5.7. The highest
matching score is selected as the final matching score. The last one (denoted
as M4) is similar with the third one, but it uses the average matching score
of N times of alignments. The results show that all the above methods
have achieved decent overall accuracies (EER) comparing to other reported
matching methods. The last method obtains the best results compared with
the other three methods. The experimental results of M4 show that this
method achieves overall matching accuracy of 98.24%, 97.87% and 98.19%
on the datasets FVC2002 DB1a, DB2a and FVC2006 DB2a. Besides, our
designed fingerprint matching system using M3 and M4 matching methods
obtain better results than the system using the fifth best minutiae extractor
in the FVC2006 campaign and MCC [CFM10] matching method. The ex-
180

perimental results also suggest that it is superior than most state-of-the-art
matching methods (e.g. methods in [WSOA13, LN06, GYZZ11, WSOA13])
in terms of matching accuracy.
In conclusion, this chapter addresses our third research objective which
aims to design a reliable and accurate fingerprint matching method. The
next chapter is the conclusion of the whole thesis and possible future work.
181
Chapter 6
Conclusion
In this thesis, extensive research has been conducted to investigate carious
techniques of fingerprint recognition to improve the matching accuracy of a
fingerprint recognition system. In particular, the main focus of this research
has been in the areas of image pre-processing, singular point detection,
fingerprint matching. Experimental results are provided for each designed
methods as well as the comparisons with other reported results have been
presented. Furthermore, a simple fingerprint recognition system is designed
using the developed methods to evaluate the overall matching accuracy.
The result shows that our system is superior to most of recent fingerprint
recognition systems with respect to overall matching accuracy.
In the following sections, the research contributions and future work are
summarized.
182

6.1 Research Contributions
In this thesis, a remarkable effort has been done to improve the matching
accuracy and to design a reliable fingerprint recognition system. The major
research contributions are summarized as follows:
• A fingerprint image pre-processing method, which is able to improve
the clarity of ridge and valley structures in a fingerprint image. This
proposed image pre-processing algorithm is designed based on the con-
trast stretching and power law transformation techniques, which are
able to improve the contrast and brightness of an image, respectively.
This method is an alternative choice for fingerprint image normaliza-
tion. Besides, it is able to improve the image contrast as well as to
remove noise and unnecessary information, such as valueless ridges,
which often exist on wet/smudged fingerprints. The experimental re-
sult shows that the goodness index (GI) is higher when this method is
applied than using other image pre-processing methods. The GI value
is improved by around 14% than other reported methods. The exper-
imental results also indicate that removing adequate noise in image
pre-processing stage enables the subsequent image processing stage
(Gabor filtering) to have a better enhancement result, which ulti-
mately improves the performance of feature extraction and matching.
This method contributes to the feature extraction part of a fingerprint
recognition system.
• A post-processing method for Poincare Index based singular point
detection approach. The singular point detection techniques are use-
ful for fingerprint alignment and classification which are important
183

components in a fingerprint identification system. This method uses
Poincare Index technique to detect the singular points. In order to
address the problem of spurious singular points, singular point val-
idation rules are developed and applied to remove spurious singular
points. The genuine detection rate of singular points on FVC 2002
databases is 89.42% which is superior to other Poincare Index based
methods.
• A singular point detection method based on the analysis of fingerprint
local ridge orientation field. This method initially separates the local
ridge orientation map into four segments according to their orienta-
tion values. Then a singular point detection method with designed
rules are used to validate and select possible genuine singular points.
The result shows that the genuine detection rate of singular points on
FVC 2002 databases is 94.05% which is higher than other reported
methods. Furthermore, we extended this approach to arch type fin-
gerprints. Thus, it is possible to locate a reference point for an arch
fingerprint which can be used for fingerprint alignment or/and finger-
print classification to enhance the speed of fingerprint identification.
• A new matching metric named binarized minutiae blocks (BMB) is
proposed for fingerprint matching. This new matching metric a bina-
rized fingerprint image block with a minutiae point in the center. In
this method, the binazried minutiae blocks are aligned to make the
central minutiae at a fixed direction (make the minutiae angles at 0
degrees in our case). Then the local minutiae similarity is simply gen-
erated by comparing the Hamming distances of these minutiae blocks.
184

Besides, four different global similarity score calculation methods are
designed to calculate the final matching score and evaluate this pro-
posed matching metric. The first method uses pre-alignment using
SPs as reference points. The second method uses minutiae interrela-
tionships to validate the minutiae pairs, then the matching score is
computed by using Hamming distance and number of matched minu-
tiae pairs. The second one explores the interrelationships between
minutiae points to validate the minutiae pair candidates. The third
one uses the top N minutiae pairs with the lowest Hamming distance
for fingerprint alignment. Then the matching score is calculated by
selecting the highest matching score among the N times alignments.
The last one is similar with third one, but it select the average match-
ing score of N . The results shows that all the above methods achieve
high overall accuracies (EER) comparing to other reported methods.
The last method obtains the best result comparing the other three
methods, which achieves EER of 1.76%, 2.13% and 1.81% on the
datasets FVC2002 DB1a, DB2a and FVC2006 DB2a. Besides, our de-
signed fingerprint matching system using the last two matching score
calculation methods is able to obtain better results than the system
using the fifth best minutiae extractor in FVC2006 campaign with
minutiae clinder code (MCC) [CFM10] matching method. As a con-
sequence, the results suggest that using binarized minutiae blocks is
an alternative way to obtain accurate and reliable matching results
other than correlation based (grey scale texture information), minu-
tiae based and other non-minutiae based methods. The experimental
results also indicate that the designed fingerprint matching system is
185

superior to most of the state-of-the-art fingerprint recognition systems.
This new matching metric is contributed to fingerprint matching part
of a fingerprint recognition system.
6.2 Future works
Future work includes investigating current fingerprint feature quality anal-
ysis techniques in order to improve the feature extraction reliability of our
system, template protection, fingerprint authentication system design and
implementation. The future work could be summarized as follows:
• Fingerprint feature quality analysis. Fingerprint quality analysis is
able to remove unreliable features (e.g. minutiae, ridges etc.). The
feature extractor implemented in our matching system is not as good
as other state-of-the-art methods especially on the contextual filter-
ing and minutiae extractor parts. Implementing new techniques may
improve the overall performance of this fingerprint matching system.
• Fingerprint template protection. This is an important aspect in a fin-
gerprint recognition system which is used to prevent compromises of
fingerprint templates. Choosing and/or designing suitable template
protection techniques for our designed fingerprint templates are nec-
essary.
• Fingerprint authentication system design and implementation. We
have implemented the core parts of a fingerprint authentication sys-
tem. However, there are still some work should be done such as design
of the authentication protocols and database protection techniques.
186

• Automated latent fingerprint recognition. Latent fingerprint recogni-
tion is a new area in fingerprint recognition. Latent fingerprints refer
to the fingerprints that are not visible immediately by the naked eye,
like the fingerprints left in a crime scene. There are a large amount of
non-relevant information and noise in latent fingerprints, which make
the automated latent fingerprint recognition extremely difficult. De-
signing reliable latent fingerprint recognition techniques is a challenge
which needs to be addressed in the future.
In conclusion, this research has developed several fingerprint recognition
techniques to improve the overall matching accuracy of a fingerprint recog-
nition system. The designed fingerprint matching system achieves superior
performance compared to most of the state-of-the-art fingerprint matching
systems. However, there are some future work remained in order to further
improve the overall matching accuracy of a fingerprint verification system
including the implementation of the state-of-the-art feature extraction tech-
niques and designing of fingerprint template protection techniques.
187

Appendices
188

Appendix A
Some Samples of Fingerprint
Images in FVC databases
This appendix lists some samples of fingerprint images of different levels
of quality from FVC databases. During the fingerprint capturing stage,
individuals were asked to: a) exaggerate displacement or rotation or, b) dry
or moisten their fingers [AFF09]. Therefore, the fingerprint images in FVC
databases contain plenty of variations and noise, which means that they are
specially suitable for the evaluations of fingerprint recognition algorithms.
189

(a) (b)
(c) (d)
Figure A.1: Samples of good quality fingerprint images
190

(a) (b)
(c) (d)
Figure A.2: Samples of poor quality fingerprint images
191

Bibliography
[AB12] Ali Ismail Awad and Kensuke Baba. Singular point detection
for efficient fingerprint classification. International Journal of
New Computer Architectures & their Applications, 2(1):1–7,
2012.
[ADB85] Carlo Arcelli and Gabriella Sanniti Di Baja. A width-
independent fast thinning algorithm. IEEE Trans. Pattern
Anal. Mach. Intell., 7(4):463–474, April 1985.
[AFF09] Fernando Alonso-Fernandez and Julian Fierrez. Fingerprint
databases and evaluation. In StanZ. Li and Anil Jain, edi-
tors, Encyclopedia of Biometrics, pages 452–458. Springer US,
2009.
[AG14] Ahmed Abbood Alaa and Sulong Ghazali. Fingerprint classi-
fication techniques: A review. International Journal of Com-
puter Science, 11(1):111–122, January 2014.
[AM09] F. Ahmad and D. Mohamad. A review on fingerprint classifi-
cation techniques. In 2009 International Conference onCom-
puter Technology and Development, ICCTD ’09, volume 2,
pages 411–415, Nov 2009.
192
[Ast07] Paul Astrom. The study of ancient fingerprints. Journal of
Ancient Fingerprints, 1(1):2–3, 2007.
[BAH+07] F. Benhammadi, M. N. Amirouche, H. Hentous, K. Bey Begh-
dad, and M. Aissani. Fingerprint matching from minutiae
texture maps. Pattern Recogn., 40(1):189–197, January 2007.
[Bar13] Jeffery G. Barnes. Fingerprint Source Book. CreateSpace
Independent Publishing Platform, 1st edition, 2013.
[BB11] S. Bodo and T.M. Buzug. Fingerprint segmentation and
quality map using a combined frequency model. In 2011
IEEE Instrumentation and Measurement Technology Confer-
ence (I2MTC),, pages 1–5, 2011.
[BCRAA13] R. Belguechi, E. Cherrier, C. Rosenberger, and S. Ait-Aoudia.
Operational bio-hash to preserve privacy of fingerprint minu-
tiae templates. IET Biometrics, 2(2):76–84, June 2013.
[BD06] Christopher D. Brown and Herbert T. Davis. Receiver oper-
ating characteristics curves and related decision measures: A
tutorial. Chemometrics and Intelligent Laboratory Systems,
80(1):24 – 38, 2006.
[BDNB06] Arijit Bishnu, Sandip Das, Subhas C. Nandy, and Bhargab B.
Bhattacharya. Simple algorithms for partial point set pattern
matching under rigid motion. Pattern Recogn., 39(9):1662–
1671, September 2006.
193

[BG02] Asker M. Bazen and Sabih H. Gerez. Systematic methods for
the computation of the directional fields and singular points
of fingerprints. IEEE Trans. Pattern Anal. Mach. Intell.,
24(7):905–919, July 2002.
[BL10] Nandita Bhattacharjee and Chien Eao Lee. Fingerprint im-
age processing and fuzzy vault implementation. J. Mob. Mul-
timed., 6(4):314–338, December 2010.
[BLE09] Jin Bo, Ying Yu Long, and Chen Dan Er. A novel finger-
print singular point detection algorithm. In Proceedings of
the 3rd WSEAS international conference on Computer engi-
neering and applications, CEA’09, pages 97–100, 2009.
[Bra97] Andrew P. Bradley. The use of the area under the {ROC}
curve in the evaluation of machine learning algorithms. Pat-
tern Recognition, 30(7):1145 – 1159, 1997.
[CCK11] Heeseung Choi, Kyoungtaek Choi, and Jaihie Kim. Finger-
print matching incorporating ridge features with minutiae.
Information Forensics and Security, IEEE Transactions on,
6(2):338–345, June 2011.
[CDE09] CDEFFS. Data format for the interchange of ex-
tended fingerprint and palmprint features, work-
ing draft version 0.4. Accessed on June, 2014
http://fingerprint.nist.gov/STANDARD/cdeffs/Docs/
CDEFFS_DraftStd_v04_2009-06-12.pdf, June 2009.
194

[CDJ05] Yi Chen, Sarat C. Dass, and Anil K. Jain. Fingerprint quality
indices for predicting authentication performance. In Proceed-
ings of the 5th international conference on Audio- and Video-
Based Biometric Person Authentication, AVBPA’05, pages
160–170, 2005.
[CEMM00] R. Cappelli, A. Erol, D. Maio, and D. Maltoni. Synthetic
fingerprint-image generation. In Proceedings of the 15th Inter-
national Conference on Pattern Recognition, pages 471–474,
2000.
[CFM10] R. Cappelli, M. Ferrara, and D. Maltoni. Minutia cylinder-
code: A new representation and matching technique for fin-
gerprint recognition. IEEE Transactions on Pattern Analysis
and Machine Intelligence, 32(12):2128–2141, Dec 2010.
[CLMM99] R. Cappelli, A. Lumini, D. Maio, and D. Maltoni. Finger-
print classification by directional image partitioning. IEEE
Transactions on Pattern Analysis and Machine Intelligence,
21(5):402–421, 1999.
[CMM+06] Raffaele Cappelli, Dario Maio, Davide Maltoni, James L.
Wayman, and Anil K. Jain. Performance evaluation of finger-
print verification systems. IEEE Trans. Pattern Anal. Mach.
Intell., 28(1):3–18, 2006.
[CMMS09] Guo Cao, Yuan Mei, Zhihong Mao, and Quan-Sen Sun. Fin-
gerprint matching using local alignment based on multiple
195

pairs of reference minutiae. Journal of Electronic Imaging,
18(4):043002–7, 2009.
[CR05] S. Chikkerur and N. Ratha. Impact of singular point detec-
tion on fingerprint matching performance. In Fourth IEEE
Workshop on Automatic Identification Advanced Technolo-
gies, pages 207–212, Oct 2005.
[CTCY04] Xinjian Chen, Jie Tian, Jiangang Cheng, and Xin Yang.
Segmentation of fingerprint images using linear classifier.
EURASIP J. Appl. Signal Process., 2004:480–494, January
2004.
[Dau04] J. Daugman. How iris recognition works. Circuits and Sys-
tems for Video Technology, IEEE Transactions on, 14(1):21–
30, Jan 2004.
[DNA14] How much does paternity test cost. http:
//www.homednadirect.com.au/dna-news/
how-much-does-paternity-test-cost.html, accessed
on May, 2014.
[FDJ12] H. Fleyeh, E. Davami, and D. Jomaa. Segmentation of finger-
print images based on bi-level processing using fuzzy rules. In
2012 Annual Meeting of the North American Fuzzy Informa-
tion Processing Society (NAFIPS), pages 1–6, Aug 2012.
[FFCS06] Yansong Feng, Jufu Feng, Xiaoguang Chen, and Zhen Song.
A novel fingerprint matching scheme based on local structure
196
compatibility. In 18th International Conference on Pattern
Recognition (ICPR2006), volume 4, pages 374–377, 2006.
[FLW00] Kuo Chin Fan, Cheng Wen Liu, and Yuan Kai Wang. A ran-
domized approach with geometric constraints to fingerprint
verification. Pattern Recognition, 33(11):1793 – 1803, 2000.
[FOTG07] Julian Fierrezaguilar, Javier Ortegagarcia, Doroteo Torre-
toledano, and Joaquin Gonzalezrodriguez. Biosec baseline cor-
pus: A multimodal biometric database. Pattern Recognition,
40(4):1389–1392, 2007.
[FZ11] Jianjiang Feng and Jie Zhou. A performance evaluation of
fingerprint minutia descriptors. In 2011 International Con-
ference on Hand-Based Biometrics (ICHB), pages 1–6, Nov
2011.
[GAKD00] S. Greenberg, M. Aladjem, D. Kogan, and I. Dimitrov. Fin-
gerprint image enhancement using filtering techniques. In
Proceedings of the 15th International Conference on Pattern
Recognition, volume 3, pages 322–325, 2000.
[Got12a] C. Gottschlich. Curved-region-based ridge frequency estima-
tion and curved gabor filters for fingerprint image enhance-
ment. IEEE Transactions onImage Processing, 21(4):2220–
2227, April 2012.
[Got12b] Carsten Gottschlich. Curved gabor filters for fingerprint im-
age enhancement. IEEE Transactions on Image Processing,
21(4):2220–2227, 2012.
197

[GS12] C. Gottschlich and C. B. Schonlieb. Oriented diffusion filtering
for enhancing low-quality fingerprint images. IET Biometrics,
1(2):105–113, June 2012.
[GW01] Rafael C. Gonzalez and Richard E. Woods. Digital Image
Processing. Addison-Wesley Longman Publishing Co., Inc.,
Boston, MA, USA, 2nd edition, 2001.
[GYZZ11] Zhifan Gao, Xinge You, Long Zhou, and Wu Zeng. A novel
matching technique for fingerprint recognition by graphical
structures. In 2011 International Conference on Wavelet
Analysis and Pattern Recognition (ICWAPR), pages 77–82,
2011.
[GZY06] Jinwei Gu, Jie Zhou, and Chunyu Yang. Fingerprint recog-
nition by combining global structure and local cues. IEEE
Transactions on Image Processing, 15(7):1952–1964, July
2006.
[HAD06] Feng Hao, Ross Anderson, and John Daugman. Combin-
ing crypto with biometrics effectively. IEEE Trans. Comput.,
55(9):1081–1088, September 2006.
[Ham50] R. W. Hamming. Error Detecting and Error Correcting Codes.
Bell System Techincal Journal, 29(2):147–160, 1950.
[HB12] Jianchun He and Jinjun Bao. Normalization of fingerprint
image using the local feature. In 2012 International Con-
ference on Computer Science Service System (CSSS), pages
1643–1646, Aug 2012.
198
[HM90] Andrew K. Hrechak and James A. McHugh. Automated fin-
gerprint recognition using structural matching. Pattern Recog-
nition, 23(8):893 – 904, 1990.
[HWJ98] L. Hong, Yifei Wan, and A. Jain. Fingerprint image en-
hancement: algorithm and performance evaluation. IEEE
Transactions on Pattern Analysis and Machine Intelligence,
20(8):777–789, 1998.
[HYZ+10] Chunfeng Hu, Jianping Yin, En Zhu, Hui Chen, and Yong Li.
A composite fingerprint segmentation based on log-gabor filter
and orientation reliability. In 17th IEEE International Con-
ference on Image Processing (ICIP), pages 3097–3100, 2010.
[Jai11] Anil K. Jain. Automatic fingerprint matching using extended
feature set. Accessed on June, 2014: https://www.ncjrs.
gov/pdffiles1/nij/grants/235577.pdf, 2011.
[JCD06] A. Jain, Yi Chen, and M. Demirkus. Pores and ridges: Fin-
gerprint matching using level 3 features. In 18th International
Conference on Pattern Recognition (ICPR 2006), volume 4,
pages 477–480, 2006.
[JCD07] Anil K. Jain, Yi Chen, and Meltem Demirkus. Pores and
ridges: High-resolution fingerprint matching using level 3 fea-
tures. IEEE Transactions on Pattern Analysis and Machine
Intelligence, 29(1):15–27, 2007.
199

[JPHP00] A. K. Jain, S. Prabhakar, L. Hong, and S. Pankanti.
Filterbank-based fingerprint matching. Trans. Img. Proc.,
9(5):846–859, May 2000.
[JPLK06] Wonchurl Jang, Deoksoo Park, Dongjae Lee, and Sung-jae
Kim. Fingerprint image enhancement based on a half gabor
filter. In Proceedings of the 2006 international conference on
Advances in Biometrics, ICB’06, pages 258–264, Berlin, Hei-
delberg, 2006. Springer-Verlag.
[JRL97] Anil K. Jain, Nalini K. Ratha, and Sridhar Lakshmanan. Ob-
ject detection using gabor filters. Pattern Recognition, 30:295–
309, 1997.
[JRP04] Anil K. Jain, Arun Ross, and Salil Prabhakar. An introduc-
tion to biometric recognition. IEEE Trans. on Circuits and
Systems for Video Technology, 14:4–20, 2004.
[JY00] Xudong Jiang and Wei-Yun Yau. Fingerprint minutiae match-
ing based on the local and global structures. In Proceedings
of the 15th International Conference on Pattern Recognition,
volume 2, pages 1038–1041, 2000.
[JY08] Luping Ji and Zhang Yi. Fingerprint orientation field estima-
tion using ridge projection. Pattern Recognition, 41(5):1491 –
1503, 2008.
[KAN08] D.K. Karna, S. Agarwal, and Shankar Nikam. Normalized
cross-correlation based fingerprint matching. In Fifth Inter-
200
national Conference on Computer Graphics, Imaging and Vi-
sualisation, pages 229–232, Aug 2008.
[KCH12] Ravinder Kumar, Pravin Chandra, and M. Hanmandlu. Fin-
gerprint singular point detection using orientation field relia-
bility. Advanced Materials Research, 403:4499–4506, 2012.
[KJ96] Kalle Karu and Anil K. Jain. Fingerprint classification. Pat-
tern Recognition, 29(3):389–404, 1996.
[KP02] Byung-Gyu Kim and Dong-Jo Park. Adaptive image normal-
isation based on block processing for enhancement of finger-
print image. Electronics Letters, 38(14):696–698, 2002.
[KT84] Masahiro Kawagoe and Akio Tojo. Fingerprint pattern clas-
sification. Pattern Recogn., 17(3):295–303, June 1984.
[KV00] Z.M. Kovacs-Vajna. A fingerprint verification system based
on triangular matching and dynamic time warping. IEEE
Transactions on Pattern Analysis and Machine Intelligence,
22(11):1266–1276, Nov 2000.
[KW87] Michael Kass and Andrew Witkin. Analyzing oriented pat-
terns. Computer Vision, Graphics, and Image Processing,
37(3):362 – 385, 1987.
[LB09] Chien Eao Lee and Nandita Bhattacharjee. Fingerprint im-
age processing and minutiae extraction for fuzzy vault. In
Proceedings of the 7th International Conference on Advances
201

in Mobile Computing and Multimedia, MoMM ’09, pages 36–
43, New York, NY, USA, 2009.
[LCG+11] Chongjin Liu, Jia Cao, Xin Gao, Xiang Fu, and Jufu Feng. A
novel fingerprint matching algorithm using minutiae phase dif-
ference feature. In Image Processing (ICIP), 2011 18th IEEE
International Conference on, pages 3201–3204, Sept 2011.
[LELJSM07] Almudena Lindoso, Luis Entrena, Judith Liu Jimenez, and
Enrique San Millan. Correlation-based fingerprint matching
with orientation field alignment. In Seong-Whan Lee and
StanZ. Li, editors, Advances in Biometrics, volume 4642 of
Lecture Notes in Computer Science, pages 713–721. Springer
Berlin Heidelberg, 2007.
[Ley04] John Leyden. FBI apology for madrid bomb fingerprint fiasco-
’substandard’ digital prints led to oregon lawyer. accessed on
June, 2014: http://www.theregister.co.uk/2004/05/26/
fbi_madrid_blunder/, May 2004.
[LL03] K. Lee Lerner and Brenda Wilmoth Lerner. Encyclopedia of
Espionage, Intelligence, and Security. 2003.
[LML13] Yue Li, M. Mandal, and Cheng Lu. Singular point detection
based on orientation filed regularization and poincare index
in fingerprint images. In 2013 IEEE International Conference
on Acoustics, Speech and Signal Processing (ICASSP), pages
1439–1443, May 2013.
202

[LN06] Alessandra Lumini and Loris Nanni. Two-class fingerprint
matcher. Pattern Recognition, 39(4):714 – 716, 2006.
[LTG07] Jiang Li, S. Tulyakov, and V. Govindaraju. Verifying fin-
gerprint match by local correlation methods. In the First
IEEE International Conference on Biometrics: Theory, Ap-
plications, and Systems, pages 1–5, Sept 2007.
[LXL04] Chaoqiang Liu, Tao Xia, and Hui Li. A hierarchical
hough transform for fingerprint matching. In David Zhang
and AnilK. Jain, editors, Biometric Authentication, volume
3072 of Lecture Notes in Computer Science, pages 373–379.
Springer Berlin Heidelberg, 2004.
[LYC+10] Peng Li, Xin Yang, Kai Cao, Xunqiang Tao, Ruifang Wang,
and Jie Tian. An alignment-free fingerprint cryptosystem
based on fuzzy vault scheme. Journal of Network and Com-
puter Applications, 33(3):207 – 220, 2010.
[Mal04] Davide Maltoni. Generation of synthetic fingerprint im-
age databases. In Nalini Ratha and Ruud Bolle, editors,
Automatic Fingerprint Recognition Systems, pages 361–384.
Springer New York, 2004.
[MC89] B.M. Mehtre and B. Chatterjee. Segmentation of fingerprint
images a composite method. Pattern Recognition, 22(4):381
– 385, 1989.
203

[MM97] D. Maio and D. Maltoni. Direct gray-scale minutiae detection
in fingerprints. IEEE Transactions on Pattern Analysis and
Machine Intelligence, 19(1):27–40, 1997.
[MMC+02] D. Maio, D. Maltoni, R. Cappelli, J.L. Wayman, and A. K.
Jain. Fvc2002: Second fingerprint verification competition. In
In Proceedings of 16th International Conference on Pattern
Recognition (ICPR2002), Quebec City, pages 811–814, 2002.
[MMC+04] Dario Maio, Davide Maltoni, Raffaele Cappelli, JimL. Way-
man, and AnilK. Jain. Fvc2004: Third fingerprint verification
competition. Lecture Notes in Computer Science, 3072:1–7,
2004.
[MMJP09] Davide Maltoni, Dario Maio, Anil K. Jain, and Sail Parb-
hakar. Handbook of fingerprint recognition. Springer, New
York, 2009.
[MMKC87] B. M. Mehtre, N. N. Murthy, S. Kapoor, and B. Chatterjee.
Segmentation of fingerprint images using the directional im-
age. Pattern Recogn., 20(4):429–435, July 1987.
[MMNM11] Ishmael S. Msiza, Mmamolatelo E. Mathekga, Fulufhelo V.
Nelwamondo, and Tshilidzi Marwala. Fingerprint segmenta-
tion: An investigation of various techniques and a parameter
study of a variance-based method. International Journal of
Innovative Computing, Information and Control, 7(9):5313 –
5326, 2011.
204

[NB05] Kenneth Nilsson and Josef Bigun. Registration of finger-
prints by complex filtering and by 1d projections of orien-
tation images. In Proceedings of the 5th International Confer-
ence on Audio- and Video-Based Biometric Person Authenti-
cation, AVBPA’05, pages 171–183, Berlin, Heidelberg, 2005.
Springer-Verlag.
[OR04] Choonsuk Oh and Young Kee Ryu. Study on the center of
rotation method based on minimum spanning tree matching
algorithm for fingerprint recognition. Optical Engineering,
43(4):822–829, 2004.
[OWT+08] T. Ohtsuka, D. Watanabe, D. Tomizawa, Y. Hasegawa, and
H. Aoki. Reliable detection of core and delta in fingerprints
by using singular candidate method. In 2008 IEEE Computer
Society Conference on Computer Vision and Pattern Recog-
nition Workshops, pages 1–6, June 2008.
[PLP03] Chul-Hyun Park, Joon-Jae Lee, and Kil-Houm Park. Finger-
print matching based on directional image feature in polar co-
ordinate system. In Nicolai Petkov and MichelA. Westenberg,
editors, Computer Analysis of Images and Patterns, volume
2756 of Lecture Notes in Computer Science, pages 293–300.
Springer Berlin Heidelberg, 2003.
[PPJ03] Salil Prabhakar, Sharath Pankanti, and Anil K. Jain. Biomet-
ric recognition: Security and privacy concerns. IEEE Security
and Privacy, 1(2):33–42, March 2003.
205

[RB00] Nalini Is. Ratha and Ruud M. Bolle. Robust fingerprint au-
thentication using local structure similarity. In In Workshop
on applications of Computer Vision, pages 29–34, 2000.
[RCJ95] Nalini K. Ratha, Shaoyun Chen, and Anil K. Jain. Adaptive
flow orientation-based feature extraction in fingerprint images.
Pattern Recognition, 28(11):1657 – 1672, 1995.
[RHZ76] Azriel Rosenfeld, Robert A. Hummel, and S.W. Zucker. Scene
labeling by relaxation operations. IEEE Transactions on Sys-
tems, Man and Cybernetics, 6(6):420–433, June 1976.
[SB11] Willian Stalls and Lawrie Browns. Computer Security: Prin-
ciples and Practice, Chapter 3, User Authentication:92-97. 2
edition, Prentice Hall, 2011.
[SF06] Henry Schuster and Terry Frieden. Lawyer wrongly ar-
rested in bombings: ’we lived in 1984’. accessed on
June, 2014: http://edition.cnn.com/2006/LAW/11/29/
mayfield.suit/index.html?eref=rss_law, Nov 2006.
[SG06] Zhixin Shi and V. Govindaraju. Fingerprint image enhance-
ment based on skin profile approximation. In the 18th Inter-
national Conference on Pattern Recognition, volume 3, pages
714–717, 2006.
[SHC03] Jung-Hwan Shin, Hui-Yeoun Hwang, and Sung Chien. Minu-
tiae extraction from fingerprint images using run-length code.
In Ning Zhong, ZbigniewW. Ra, Shusaku Tsumoto, and
Einoshin Suzuki, editors, Foundations of Intelligent Systems,
206

volume 2871 of Lecture Notes in Computer Science, pages
577–584. Springer Berlin Heidelberg, 2003.
[SHC06] Jung-Hwan Shin, Hui-Yeoun Hwang, and Sung-Il Chien. De-
tecting fingerprint minutiae by run length encoding scheme.
Pattern Recognition, 39(6):1140 – 1154, 2006.
[SHFD07] Weiguo Sheng, G. Howells, Michael Fairhurst, and F. Deravi.
A memetic fingerprint matching algorithm. IEEE Transac-
tions on Information Forensics and Security, 2(3):402–412,
2007.
[SM93] B.G. Sherlock and D.M. Monro. A model for interpreting
fingerprint topology. Pattern Recognition, 26(7):1047 – 1055,
1993.
[Smi97] Steven W. Smith. The Scientist & Engineer’s Guide to Digital
Signal Processing. California Technical Pub, 1997.
[SMM94] B. G. Sherlock, D.M. Monro, and K. Millard. Fingerprint
enhancement by directional fourier filtering. IEE Proceedings:
Vision, Image and Signal Processing, 141(2):87–94, Apr,1994.
[Sta12] Australian Bureau Statistics. Personal fraud costs aus-
tralians $1.4 billion. Accessed on June, 2014: http:
//www.abs.gov.au/ausstats/[email protected]/latestProducts/
4528.0Media%20Release12010-2011/, April 2012.
207

[TB03] Xuejun Tan and Bir Bhanu. A robust two step approach
for fingerprint identification. Pattern Recognition Letters,
24(13):2127 – 2134, 2003.
[TYC+10] Xunqiang Tao, Xin Yang, Kai Cao, Ruifang Wang, Peng Li,
and Jie Tian. Estimation of fingerprint orientation field by
weighted 2d fourier expansion model. In the 20th Interna-
tional Conference on Pattern Recognition, pages 1253–1256,
Aug 2010.
[WBGS10] Li Wang, Nandita Bhattacharjee, Gopal Gupta, and Bala
Srinivasan. Adaptive approach to fingerprint image enhance-
ment. In Proceedings of the 8th International Conference on
Advances in Mobile Computing and Multimedia, MoMM ’10,
pages 42–49, New York, NY, USA, 2010. ACM.
[WBS11] Li Wang, Nandita Bhattacharjee, and Bala Srinivasan. A
novel technique for singular point detection based on poincare
index. In Proceedings of the 9th International Conference on
Advances in Mobile Computing and Multimedia, MoMM ’11,
pages 12–18, New York, NY, USA, 2011. ACM.
[WBS12a] Li Wang, N. Bhattacharjee, and B. Srinivasan. Fingerprint
reference point detection based on local ridge orientation pat-
terns of fingerprints. In Neural Networks (IJCNN), The 2012
International Joint Conference on, pages 1–8, June 2012.
[WBS12b] Li Wang, Nandita Bhattacharjee, and Bala Srinivasan. A
method for fingerprint alignment and matching. In Proceed-
208
ings of the 10th International Conference on Advances in Mo-
bile Computing and Multimedia, MoMM ’12, pages 297–301,
New York, NY, USA, 2012. ACM.
[WCT98] A. Wahab, S. H. Chin, and E.C. Tan. Novel approach to
automated fingerprint recognition. IEE Proceedings: Vision,
Image and Signal Processing, 145(3):160–166, 1998.
[WH12] Song Wang and Jiankun Hu. Alignment-free cancelable fin-
gerprint template design: A densely infinite-to-one mapping
(ditom) approach. Pattern Recognition, 45(12):4129 – 4137,
2012.
[WHP07] Yi Wang, Jiankun Hu, and Damien Phillips. A fingerprint ori-
entation model based on 2d fourier expansion (fomfe) and its
application to singular-point detection and fingerprint index-
ing. IEEE Trans. Pattern Anal. Mach. Intell., 29(4):573–585,
April 2007.
[Wik14a] Wikipedia. Biometrics. accessed on June, 2014: http://en.
wikipedia.org/wiki/Biometrics, 2014.
[Wik14b] Wikipedia. Fingerprint recognition. http://en.wikipedia.
org/wiki/Fingerprint_recognition, accessed on: June,
2014.
[WLHF08] Wei Wang, Jianwei Li, Feifei Huang, and Hailiang Feng.
Design and implementation of log-gabor filter in fingerprint
image enhancement. Pattern Recogn. Lett., 29(3):301–308,
February 2008.
209

[WLN07] Xuchu Wang, Jianwei Li, and Yanmin Niu. Definition and
extraction of stable points from fingerprint images. Pattern
Recognition, 40(6):1804 – 1815, 2007.
[WSG04] Chaohong Wu, Zhixin Shi, and Venu Govindaraju. Finger-
print image enhancement method using directional median
filter, in biometric technology for human identification. In
Proceedings of the SPIE, 2004.
[WSOA13] M. A. Wahby Shalaby and M. Omair Ahmad. A multilevel
structural technique for fingerprint representation and match-
ing. Signal Process., 93(1):56–69, January 2013.
[WYY11] Dawei Weng, Yilong Yin, and Dong Yang. Singular points de-
tection based on multi-resolution in fingerprint images. Neu-
rocomputing, 74(17):3376 – 3388, 2011.
[XZWG12] Zhe Xue, Tong Zhao, Min Wu, and Tiande Guo. A novel
segmentation algorithm of fingerprint images based on mean
shift. In De-Shuang Huang, Phalguni Gupta, Xiang Zhang,
and Prashan Premaratne, editors, Emerging Intelligent Com-
puting Technology and Applications, volume 304 of Communi-
cations in Computer and Information Science, pages 203–211.
Springer Berlin Heidelberg, 2012.
[YA06] Neil Yager and Adnan Amin. Dynamic registration selection
for fingerprint verification. Pattern Recognition, 39(11):2141
– 2148, 2006.
210

[YZYY10] Gongping Yang, Guang-Tong Zhou, Yilong Yin, and Xiukun
Yang. K-means based fingerprint segmentation with sensor in-
teroperability. EURASIP J. Adv. Signal Process, 2010(54):1–
12, February 2010.
[ZGLR01] D. Simon Zorita, J. Ortega Garcia, S. Cruz Llanas, and
J. Gonzalez Rodriguez. Minutiae extraction scheme for finger-
print recognition systems. In 2001 International Conference
on Image Processing, volume 3, pages 254–257, 2001.
[ZGZ07] Jie Zhou, Jinwei Gu, and David Zhang. Singular points anal-
ysis in fingerprints based on topological structure and orienta-
tion field. In Proceedings of the 2007 international conference
on Advances in Biometrics, ICB’07, pages 261–270, Berlin,
Heidelberg, 2007. Springer-Verlag.
[ZT07] Feng Zhao and Xiaoou Tang. Preprocessing and postprocess-
ing for skeleton-based fingerprint minutiae extraction. Pattern
Recognition, 40(4):1270 – 1281, 2007.
[ZWZ06] Xiaolong Zheng, Yangsheng Wang, and Xuying Zhao. A detec-
tion algorithm of singular points in fingerprint images combin-
ing curvature and orientation field. Lecture Notes in Control
and Information Sciences, 345:593–599, 2006.
[ZWZ07] Xiaolong Zheng, Yangsheng Wang, and Xuying Zhao. A ro-
bust matching method for distorted fingerprints. In IEEE In-
ternational Conference on Image Processing, volume 2, pages
377–380, Sept 2007.
211

[ZYHZ05] En Zhu, Jianping Yin, Chunfeng Hu, and Guomin Zhang.
Quality estimation of fingerprint image based on neural net-
work. In Lipo Wang, Ke Chen, and YewSoon Ong, editors, Ad-
vances in Natural Computation, volume 3611 of Lecture Notes
in Computer Science, pages 65–70. Springer Berlin Heidel-
berg, 2005.
[ZYHZ06] En Zhu, Jianping Yin, Chunfeng Hu, and Guomin Zhang. A
systematic method for fingerprint ridge orientation estimation
and image segmentation. Pattern Recognition, 39(8):1452 –
1472, 2006.
[ZYZ05] En Zhu, Jianping Yin, and Guomin Zhang. Fingerprint
matching based on global alignment of multiple reference
minutiae. Pattern Recognition, 38(10):1685 – 1694, 2005.
[ZZYJ13] Weizhou Zhao, Hui Zhang, Baozhen Yang, and Huili Jing.
Fingerprint segmentation based on pixel feature and fuzzy
theory. The International Journal of Computer Science and
Applications, 2:569–572, May 2013.
[ZZZL09] Qijun Zhao, Lei Zhang, David Zhang, and Nan Luo. Direct
pore matching for fingerprint recognition. In Proceedings of
the 3rd International Conference on Advances in Biometrics,
ICB ’09, pages 597–606, Berlin, Heidelberg, 2009. Springer-
Verlag.
212

[ZZZL10] Qijun Zhao, David Zhang, Lei Zhang, and Nan Luo. High
resolution partial fingerprint alignment using pore-valley de-
scriptors. Pattern Recogn., 43(3):1050–1061, March 2010.
213