performance analysis of 250 mw lignite fired circulating ... · pdf fileperformance analysis...
TRANSCRIPT

International Journal of Engineering Studies.
ISSN 0975-6469 Volume 8, Number 1 (2016), pp. 73-92
© Research India Publications
http://www.ripublication.com
Performance Analysis of 250 MW Lignite Fired
Circulating Fluidized Bed Combustion Boiler
S. Bharath Subramaniam*
Assistant Professor, Department of Mechanical Engineering,
SRM University, Kattankulathur, Tamilnadu, India.
E-mail: [email protected]
Abstract
The traditional grate fuel firing systems have got their own limitations and are
techno-economically unviable to meet the challenges of the future. Fluidized
bed combustion has emerged as a viable alternative and has significant
advantages over conventional firing system and offers multiple benefits which
include compact boiler design, fuel flexibility, and higher combustion
efficiency and reduced emission of noxious pollutants such as SOx and NOx.
Lignite particles of 300 microns size were used for analysis for a 250 MW
Circulating Fluidized bed Combustion (CFBC) boiler. The fluid bed
temperature was taken in the range of 800-950 degree centigrade. The
proximate and ultimate analysis data were obtained. Based on the heat loss or
indirect method the boiler efficiency was estimated and maximum heat loss
was due to moisture content in the fuel.. The simulation results show that
particle size plays a major role in the performance of CFBC boiler.
Keywords: Fluidized bed combustion, proximate and ultimate analysis, CFBC
1. INTRODUCTION
A gas solid fluidized bed is obtained by passing gas upwards through a bed of
particles supported on a distributor. When the velocity exceeds the minimum
fluidization velocity the fluid solid assembly behaves like a liquid. Pressure increases
linearly with the distance below the surface. The lighter objects float and the denser
objects sink and wave motion is observed. The pressure drop over a fluidized bed is
much smaller. The gas bubbles continually moves the solids around shearing it and
exposing it to the gas.

74 S. Bharath Subramaniam
The behavior of most gas solid fluidized beds is dominated by the rising gas voids
conveniently termed bubbles which characterize these systems. In analyzing the
behavior of bubbling fluidized beds it is essential to distinguish between the bubble or
lean phase i.e. the gas voids containing virtually no bed particles and the particulate
phase also known as dense phase consists of particles fluidized by interstitial gas.
A bubbling bed can be defined as a bed in which the bubble phase is dispersed and the
particulate phase is continuous. The rising bubbles cause motion of the particulate
phase which is the main source of solids mixing in bubbling beds. This particle
motion in turn causes temperature uniformity and high combustor to surface heat
transfer coefficients. The Pressure drop of fluidized bed as compared to fixed bed is
small. The fluidized bed includes particles of mean sizes ranging from 15 microns to
6 mm, bed diameter ranging from 0.1 to 13 m and gas velocities from 0.01 m/s to 10
m/s.
Fig.1 Regimes of fluidization
2. LITERATURE REVIEW
Geldart (1973) measured the transition velocity between the flow regimes and the
particle entrainment rate. The entrainment rate is found to increase with the gas
velocity and static bed height. Experiments were conducted for large scale
combustors.
Wen et al (1967) analysed the gas/particle heat transfer involving conduction and
convection. Uniform temperature was maintained in the bed. The change in
temperature of the particle was measured as it came in equilibrium with the bed.
Radiant heat transfer was considered small.
Botterill et al (1967) studied the wall heat transfer coefficient in a circulating fluidized
bed which is due to conduction of particles falling along the walls. Heat transfer
coefficient is larger for smaller walls. Heat transfer is related with the bed dynamics.
Levenspiel et al (1954) predicted the overall heat transfer coefficient from expressions
involving modified Nusselt and Reynolds number. Simple expressions for gas film
thickness were derived.

Performance Analysis of 250 MW Lignite Fired Circulating Fluidized Bed 75
3. METHODOLOGY
From a detailed study of the literature and based on the inference from each study the
methodology of the energy analysis was formulated. The operational parameters were
identified to study the operational behaviour of the thermal system. Based on the data
collection combustion, hydrodynamic and heat transfer analysis were carried out from
which the overall efficiency of the boiler was found out. Simulation was performed
using the ANSYS FLUENT software.
3.1 Flow diagram in a boiler
A boiler is a thermal system in which water is heated to obtain superheated steam
which in turn is used to generate power by driving the turbo generator. The hot flue
gases are left to the atmosphere via the stack. The combustion process in a boiler can
be represented in the form of energy flow diagram. This shows graphically how the
heat energy in the fuel is utilized well and the losses that can occur.
Fig 2. Flow diagram in a boiler
Combustion refers to the rapid oxidation of the fuel accompanied by generation of
large amount of heat energy. Complete combustion is achieved by supply of adequate
amount of air. The objective is to release all the energy present in the fuel which is
achieved by controlling the temperature, turbulence and time.
3.2 Data collection
Table 1. Fuel specification and operational parameters
SL.
NO DATA DESCRIPTION
1 Fuel Lignite
2 Gross calorific value (Kcal / kg) 2650
3 Combustor type Circulating Fluidized Bed
4
Ambient temperature (0C)
32
5 Main steam temperature (0 C) 540
6 Main steam pressure (bar) 172
7 Main steam flow (tonnes/ hour) 845
BOILER
BOILER
air + fuel
water
flue gas
steam
76 S. Bharath Subramaniam
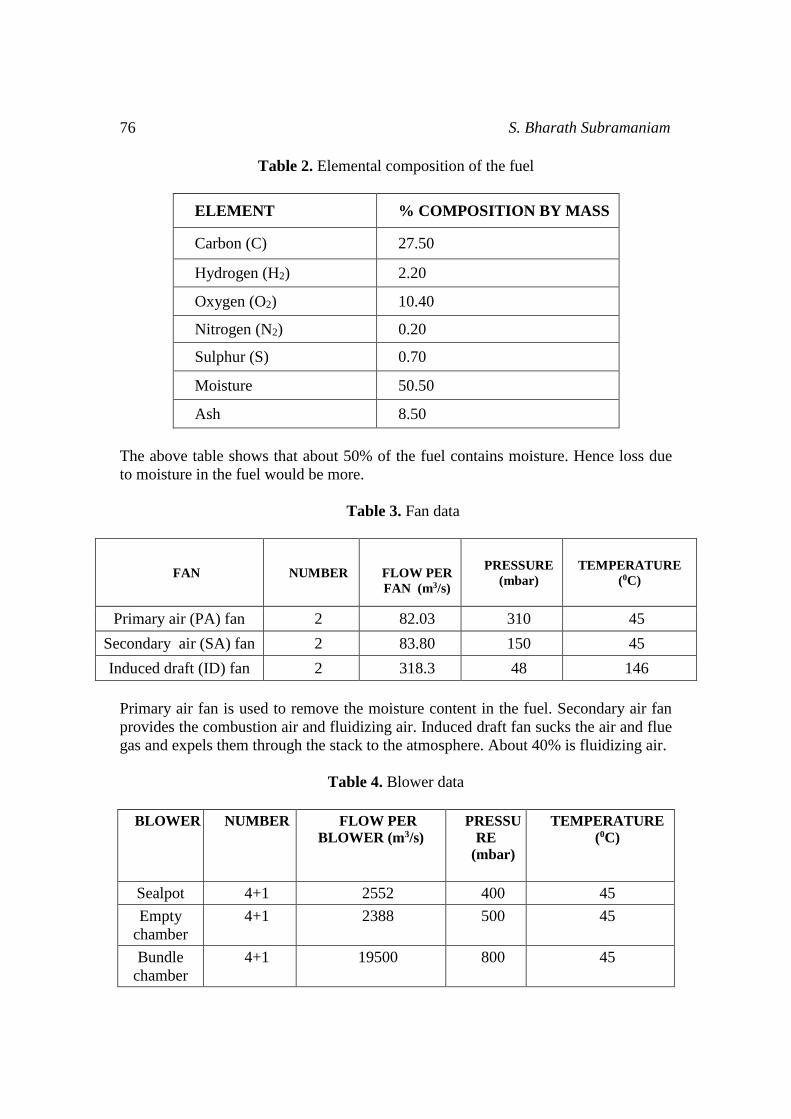
Table 2. Elemental composition of the fuel
ELEMENT % COMPOSITION BY MASS
Carbon (C) 27.50
Hydrogen (H2) 2.20
Oxygen (O2) 10.40
Nitrogen (N2) 0.20
Sulphur (S) 0.70
Moisture 50.50
Ash 8.50
The above table shows that about 50% of the fuel contains moisture. Hence loss due
to moisture in the fuel would be more.
Table 3. Fan data
FAN NUMBER
FLOW PER
FAN (m3/s)
PRESSURE
(mbar)
TEMPERATURE
(0C)
Primary air (PA) fan 2 82.03 310 45
Secondary air (SA) fan 2 83.80 150 45
Induced draft (ID) fan 2 318.3 48 146
Primary air fan is used to remove the moisture content in the fuel. Secondary air fan
provides the combustion air and fluidizing air. Induced draft fan sucks the air and flue
gas and expels them through the stack to the atmosphere. About 40% is fluidizing air.
Table 4. Blower data
BLOWER NUMBER FLOW PER
BLOWER (m3/s)
PRESSU
RE
(mbar)
TEMPERATURE
(0C)
Sealpot 4+1 2552 400 45
Empty
chamber
4+1 2388 500 45
Bundle
chamber
4+1 19500 800 45

Performance Analysis of 250 MW Lignite Fired Circulating Fluidized Bed 77
Exit
chamber
1+1 6500 250 45
Seal and
purge
1+1 5062 950 45
Ash cooler 2 6215 350 45
There are five types of blower namely Sealpot, Empty chamber, Bundle chamber,
Exit chamber, Seal and purge, Ash cooler blower. The data corresponding to each
blower is shown. Blowers are meant for intermediate pressure applications.
4. PERFORMANCE ANALYSIS
Efficiency of a thermal system reduces with time due to improper operation and
maintenance, incomplete combustion and heat transfer. A heat balance helps to
identify the avoidable and unavoidable losses and do the corrective action. Hence
performance assessment is a prerequisite for energy conservation whose objective is
to improve the energy efficiency.
4.1. The heat loss method
Heat losses that occur in a boiler can be controlled so that system efficiency is
increased. Losses are unavoidable but energy can be recovered in the form of heat by
use of suitable technology. The efficiency is arrived by subtracting all the heat losses
from hundred. The various heat loses that occur in a boiler are heat loss due to dry
flue gas, moisture in fuel, evaporation of water, moisture in air, incomplete
combustion, radiation and convection losses (R & C losses).
𝜂 = 100 − ∑ 𝐿𝑜𝑠𝑠𝑒𝑠 + ∑𝑐𝑟𝑒𝑑𝑖𝑡𝑠 (1)
4.2. Air requirement
The total airflow is a combination of combustion air and infiltration air. Combustion
air is used to burn the fuel which includes secondary air and primary air. Leakage of
air into the boiler is known as infiltration. Theoretical air requirement can be obtained
from the stoichiometric calculations.
𝑚𝑡ℎ𝑒𝑜𝑟𝑖𝑡𝑖𝑐𝑎𝑙 𝑎𝑖𝑟 =100
23(
8
3(27.5) + 8 (2.2 −
10.4
8) + 0.7) =
353
100= 3.53 𝑘𝑔 (2)
4.3. Excess air It is supplied to ensure complete combustion by proper mixing of air and fuel.
Combustion efficiency is improved by supplying air in excess. It increases the heat
losses but minimizes the CO formation. It is measured from the oxygen in the flue gas
leaving the stack. Atmospheric air contains 21% of O2 by volume. It has a great effect
on the performance of boiler.
𝐸𝐴 = %𝑂2 𝑖𝑛 𝑓𝑙𝑢𝑒 𝑔𝑎𝑠
21 − % 𝑂2 𝑖𝑛 𝑓𝑙𝑢𝑒 𝑔𝑎𝑠=
4.2
21 − 4.2= 25%
(3)

78 S. Bharath Subramaniam
4.4. Actual air Actual air is a product of theoretical air and excess air factor. 𝑚𝑎𝑐𝑡𝑢𝑎𝑙 𝑎𝑖𝑟 = (1 + 0.25) 3.53 = 4.41 kg 𝑚𝑓𝑙𝑢𝑒 𝑔𝑎𝑠 = 4.41 + 1 = 5.41 𝑘𝑔 (4)
4.5. Dry flue gas loss
The flue gases contain dry as well as wet products of combustion. Loss due to wet
products of combustion is calculated separately. Heat energy in the flue gas should be
recovered by the use of suitable waste heat recovery systems.
𝑄𝑓𝑙𝑢𝑒 𝑔𝑎𝑠 =5.36 𝑋 0.23 𝑋 (140 − 32)
2650 = 5% (5)
4.6. Loss due to moisture in the fuel
𝑄𝑚𝑜𝑖𝑠𝑡𝑢𝑟𝑒 𝑖𝑛 𝑓𝑢𝑒𝑙 = 0.5050 𝑋 (584 + 0.45 (140 − 32))
2650 = 12% (6)
4.7. Loss due to evaporation of water
𝑄𝑒𝑣𝑎𝑝𝑜𝑟𝑎𝑡𝑖𝑜𝑛 𝑜𝑓 𝐻2𝑂 =9 𝑋 0.022 (584 + 0.45 (140 − 32)
2650= 4.7% (7)
4.8. Loss due to moisture in the air
𝑄𝑚𝑜𝑖𝑠𝑡𝑢𝑟𝑒 𝑖𝑛 𝑎𝑖𝑟 =4.36 𝑋 0.01 𝑋 0.45 𝑋 (140 − 32)
2650= 0.08% (8)
4.9. Loss due to incomplete combustion
𝑄𝑖𝑛𝑐𝑜𝑚𝑝𝑙𝑒𝑡𝑒 𝑐𝑜𝑚𝑏𝑢𝑠𝑡𝑖𝑜𝑛 =0.1 𝑋 0.2750
0.1 + 19 𝑋
5744
2650 = 0.31% (9)
4.10. Radiation and convection losses
Radiation effect is considered small compared to conventional boilers. It is mainly
governed by Stefan Boltzmann law. Radiation and convection losses are assumed to
be 0.5%.
4.11. Sulphation credit
This represents the heat gain because of the exothermic nature of the reaction.
𝐻𝑒𝑎𝑡 𝑔𝑎𝑖𝑛 =4 𝑋 0.7 𝑋 15141 𝑋 100%
11092= 3.82% (10)
4.12. Forced draft (FD) fan credit
FD fan minimizes some of the pressure drops in the combustor by providing the
required quantity of air. This credit for 250 MW boiler is assumed to be 1%.
η =100 - ( 5 + 12 + 4.7 + 0.08 + 0.31 + 0.5 ) + 3.82+1 = 82.23% (11)

Performance Analysis of 250 MW Lignite Fired Circulating Fluidized Bed 79
Fig.3 Heat losses and efficiency of CFBC boiler
In this special type of boiler there are heat credits apart from heat losses. Heat credits
include Sulphation credit and forced draft fan credit. When the calcined limestone
(CaO) reacts with Sulphur di oxide (produced from Sulphur in coal), Calcium
sulphate (CaSO4) is formed according to the reaction
SO2 + CaO + ½ O2 CaSO4 + 15141 kJ/kg
The above reaction is exothermic in nature. So there is gain of heat to the furnace
which results in better heat transfer characteristics and improvement in efficiency.
5%
12%0.08%
4.70% 0.31%
0.50%
3.82%
1.00%
82.2300%
Heat losses and credits in CFBC boiler
dry flue gas
moisture in the fuel
moisture in the air
evaporation of water
incomplete combustion
radiation and convection
sulphation credit
FD Fan credit
ƞ (efficiency)

80 S. Bharath Subramaniam
5. RESULTS AND DISCUSSIONS
Fig. 4. Heat release rate vs. Fuel oil flow
Fig 5. Oxygen concentration vs. Boiler efficiency
0
500
1000
1500
2000
2500
3000
3500
4000
4500
0 5 10 15 20 25 30 35 40 45
Fuel
oil
flo
w (
kg/h
r)
Heat release rate (Mcal/hr)
HEAT RELEASE RATE
70
72.5
75
77.5
80
82.5
85
0 2 4 6 8 10 12
Bo
iler
eff
icie
ncy
(%
)
O2 concentration (%)
O2 CONCENTRATION VS. BOILER EFFICIENCY
Performance Analysis of 250 MW Lignite Fired Circulating Fluidized Bed 81
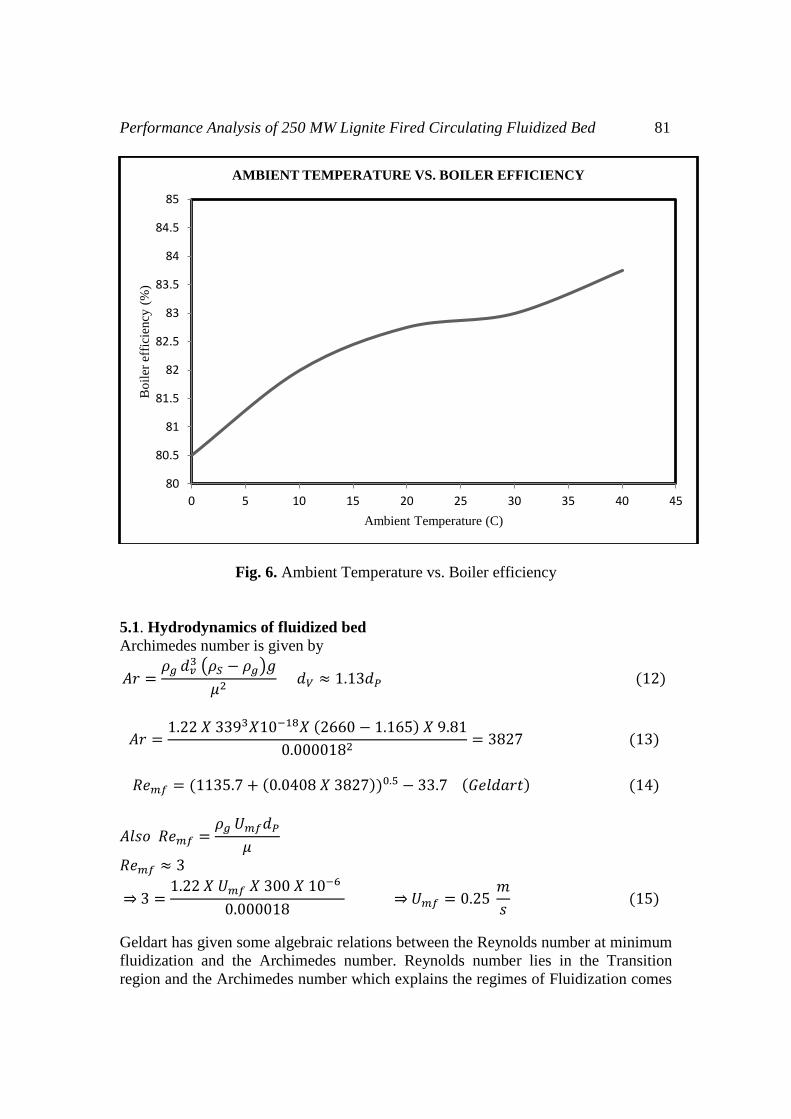
Fig. 6. Ambient Temperature vs. Boiler efficiency
5.1. Hydrodynamics of fluidized bed
Archimedes number is given by
𝐴𝑟 =𝜌𝑔 𝑑𝑣
3 (𝜌𝑆 − 𝜌𝑔)𝑔
𝜇2 𝑑𝑉 ≈ 1.13𝑑𝑃 (12)
𝐴𝑟 =1.22 𝑋 3393𝑋10−18𝑋 (2660 − 1.165) 𝑋 9.81
0.0000182= 3827 (13)
𝑅𝑒𝑚𝑓 = (1135.7 + (0.0408 𝑋 3827))0.5 − 33.7 (𝐺𝑒𝑙𝑑𝑎𝑟𝑡) (14)
𝐴𝑙𝑠𝑜 𝑅𝑒𝑚𝑓 =𝜌𝑔 𝑈𝑚𝑓𝑑𝑃
𝜇
𝑅𝑒𝑚𝑓 ≈ 3
⇒ 3 =1.22 𝑋 𝑈𝑚𝑓 𝑋 300 𝑋 10−6
0.000018 ⇒ 𝑈𝑚𝑓 = 0.25
𝑚
𝑠 (15)
Geldart has given some algebraic relations between the Reynolds number at minimum
fluidization and the Archimedes number. Reynolds number lies in the Transition
region and the Archimedes number which explains the regimes of Fluidization comes
80
80.5
81
81.5
82
82.5
83
83.5
84
84.5
85
0 5 10 15 20 25 30 35 40 45
Bo
iler
eff
icie
ncy
(%
)
Ambient Temperature (C)
AMBIENT TEMPERATURE VS. BOILER EFFICIENCY

82 S. Bharath Subramaniam
to 3827. Minimum fluidization velocity has magnitude of 0.25 m/s. The algebraic
relation between Reynolds number and Archimedes number can be used only for
particles greater than 100 microns. Since the particle size is of order of 300 microns
the relation holds good. To be more precise the equation can be used for Group B and
Group D solids.
5.2. Pressure drop
Pressure drop per unit height of the bed is given by the formula
∆𝑃
𝐻= (𝜌𝑝 − 𝜌𝑔)𝑔 = 26.083 𝐾𝑃𝑎 (16)
Fig.7. Primary air flow vs. Nozzle Pressure drop
It can be observed that the nozzle pressure drop increases with increase in Primary air
flow rate. The minimum fluidization velocity decreases as the pressure increases.
Minimum fluidization velocity is defined as the velocity at which the particles just get
lifted up. With a further increase in velocity intense mixing (turbulence) occurs. As
the velocity increases further the particles begin to move up the combustor and get
entrained or elutriated.
0
5
10
15
20
25
30
35
40
0 100 200 300 400 500 600 700
No
zzle
dP
(m
ba
r)
Primary air flow (tonnes/hour)
NOZZLE PRESSURE DROP
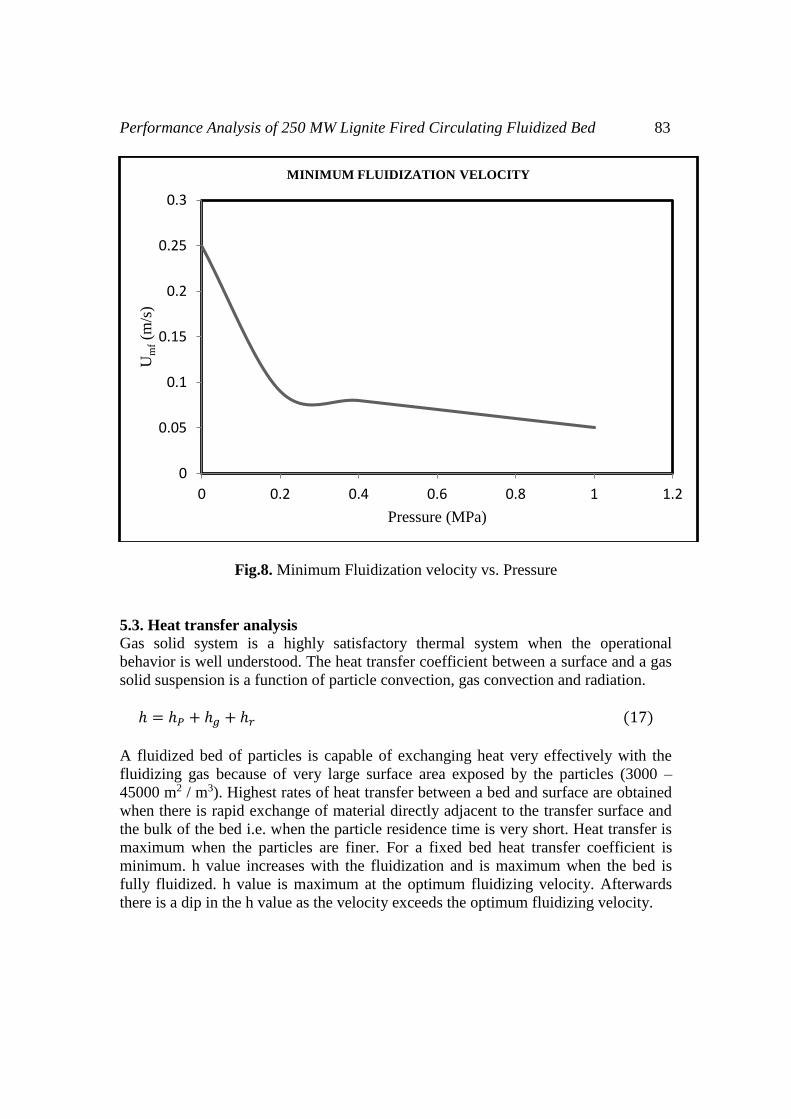
Performance Analysis of 250 MW Lignite Fired Circulating Fluidized Bed 83
Fig.8. Minimum Fluidization velocity vs. Pressure
5.3. Heat transfer analysis
Gas solid system is a highly satisfactory thermal system when the operational
behavior is well understood. The heat transfer coefficient between a surface and a gas
solid suspension is a function of particle convection, gas convection and radiation.
ℎ = ℎ𝑃 + ℎ𝑔 + ℎ𝑟 (17)
A fluidized bed of particles is capable of exchanging heat very effectively with the
fluidizing gas because of very large surface area exposed by the particles (3000 –
45000 m2 / m3). Highest rates of heat transfer between a bed and surface are obtained
when there is rapid exchange of material directly adjacent to the transfer surface and
the bulk of the bed i.e. when the particle residence time is very short. Heat transfer is
maximum when the particles are finer. For a fixed bed heat transfer coefficient is
minimum. h value increases with the fluidization and is maximum when the bed is
fully fluidized. h value is maximum at the optimum fluidizing velocity. Afterwards
there is a dip in the h value as the velocity exceeds the optimum fluidizing velocity.
0
0.05
0.1
0.15
0.2
0.25
0.3
0 0.2 0.4 0.6 0.8 1 1.2
Um
f(m
/s)
Pressure (MPa)
MINIMUM FLUIDIZATION VELOCITY

84 S. Bharath Subramaniam
Fig.9. Heat transfer coefficient vs. diameter of the particles
5.4. Flue gas analysis
Flue gas carry enormous amount of heat which can be utilized to improve the
performance of boiler. Oxides of Sulphur and nitrogen should be monitored and
controlled. No Flue gas desulphurization and Flue gas denitrification plant is required
for CFBC combustors as Sulphur is very well captured at the bottom of the combustor
using limestone. This shows CFBC is an environment friendly technology.
Table 5. Flue gas composition
Gas % by volume
N2 62.5
CO2 11.5
H2O 21.9
O2 4.2
5.5 Simulation of fluidized beds
Simulation was performed using the FLUENT software and results were obtained for
expansion of the bed. A set of conservation equations are solved including one
equation for each phase using the kinetic theory of granular flow or other empirical
0
100
200
300
400
500
600
700
800
900
1000
0 200 400 600 800 1000 1200 1400 1600 1800 2000
Hea
ttr
ansf
er c
oef
fici
ent
(W
/m2K
)
Diameter of the particles (microns)
HEAT TRANSFER COEFFICIENT PLOT

Performance Analysis of 250 MW Lignite Fired Circulating Fluidized Bed 85
relation. The Eulerian model gives a set of equations as it solves continuity and
momentum conservation equations for each phase. Pressure and momentum exchange
coefficients couple the set of equations. The kinetic theory is used to introduce the
properties of granular flows. With computational fluid dynamics (CFD) it is possible
to get a detailed view of the flow behavior of the fluidized beds.
The FLUENT CFD code has extensive interactivity, so that we can make changes to
the analysis at any time during the process. This saves time and enables to refine
designs more efficiently. Graphical user interface (GUI) is intuitive, which helps to
shorten the learning curve and make the modeling process faster. The numerical
solution of Navier–Stokes equations in CFD codes usually implies a discretization
method: it means that derivatives in partial differential equations are approximated by
algebraic expressions which can be alternatively obtained by means of the finite-
difference or the finite-element method. Finite volume method is implemented in
FLUENT.
Fig.10. Initial condition of the fluid bed U < Umf
At the initial condition the volume fraction of the solids is taken as 0.4 when U <
Umf. The fluidizing medium just percolates the void spaces between the stationary
particles. With the increase in flow rate particles move apart, vibrate and the bed
expands which is shown subsequently. At higher velocities, a point is reached where
all the particles are just suspended by the upward flowing gas. The bed is said to be in
incipient stage. Steady circulation of solids is maintained for a stable condition of the
bed and the bed is known as circulating fluidized bed. The pant leg is filled with 40%

86 S. Bharath Subramaniam
of solids upto 12 m height level. Solids include Lignite particles and Limestone. The
air distributor nozzle provides the necessary air for Fluidization.
Coarser particles are easier to fluidize but difficult to entrain. They have inertia and
particle dynamics is governed by the law of gravity. The above contour is for 300
microns. These particles do not bubble in the combustor and easily get entrained.
They do not exhibit instabilities in the bed. On the other hand coarser particles
because of voids between them exhibit much instabilities in the bed. They are
subjected to channeling etc. Finer particles exhibit better dynamic characteristics
because of more amount of intermolecular force or bond between them. Mixing is
better for them and hence combustion is better.
Fig.11 Condition of the fluid bed after expansion, U > Umf
The air supplied is mainly divided into Primary air, Secondary air and Fluidizing air.
Of this fluidizing air forms about 40% of the total air supplied. The velocity of the
fluidizing air is in the range of 5 -7 m/s. Primary air is meant for drying of lignite
particles i.e. removal of moisture. Secondary air is meant for combustion and
fluidizing air is meant for suspension of solids

Performance Analysis of 250 MW Lignite Fired Circulating Fluidized Bed 87
Fig 12. Contour of velocity distribution of air (m/s)
The difference between the solids velocity and the air velocity is known as slip
velocity. Slip velocity is obtained as 3 – 5 m/s. As the solid particles are fluidized by
passing air or other medium they exhibit fluid like behavior. With an increase in flow
rate of the fluids, particles move apart and a few vibrate. This is called the expanded
bed. At higher velocities a point is reached where all the particles are suspended by
the upward flowing gas or liquid. The frictional force between the particle and the
fluid just counterbalances the weight of the particle. The Particles are in a suspended
state. With a further increase in air velocity the particles gets lifted up as the buoyancy
force becomes dominant than the gravitational pull. The bed is said to be in a
fluidized state. With further increase in air velocity the particle gets entrained from
the combustor. It then enters the cyclone, then reaches the seal pot via the down
comer and then is returned back to the combustor.

88 S. Bharath Subramaniam
Fig.13 Contour of Temperature distribution of solids (K)
One of the main advantage of the fluidized bed is that is the uniformity of temperature
(800 – 950 degree C) which leads to uniform thermal strain throughout the combustor.
Fluidized bed is metallurgically stable. Erosion of walls of the combustor due to ash
clinkering is not a major issue since the temperature is well below the ash fusion
temperature. The life of the combustor is more as it is subjected to uniform thermal
stress.
The Temperature at bottom portion of the combustor and top portion of the combustor
vary. This is due to firing takes place from the bottom of the combustor. Bottom
portion of the combustor is at a temperature of 850 – 900 C while top portion of the
combustor is at a temperature of 800 – 850 C. But the thermal conditions in the bed
are more or less uniform in nature.
5.6. Discussions and inferences
Coarser particles are easier to fluidize but difficult to entrain. They have inertia and
particle dynamics is governed by the law of gravity. These particles bubble in the
combustor and very few particles get entrained. They exhibit large amount of
instabilities in the bed. Finer particles are easier to entrain but difficult to fluidize, the
reason behind being the intermolecular force between the molecules. They are densely
packed. Hence in order to fluidize the particles large amount of air has to be supplied
with the help of blowers and fans. Hence auxiliary power consumption is slightly
more in the case of fluidized bed boilers. This can be minimized if the particles are

Performance Analysis of 250 MW Lignite Fired Circulating Fluidized Bed 89
properly sized i.e. the particles should neither be too coarser nor too finer. Particle
size has a great role to play in the hydrodynamics of the gas solid system.
CONCLUSION
From the energy loss method of boiler performance assessment it is concluded that
efficiency of the boiler based on GCV is 82.23%. The reduction in the overall
efficiency is mainly due to the presence of excess moisture (50.50%) in the fuel. The
efficiency can still be increased by use of high quality coal with less moisture content
and with higher calorific value. The efficiency can increased upto 85 - 90% by
employing supercritical technologies which will have to be investigated in the future.
The bed pressure drop is a strong function of solids inventory in the system.
Heat transfer characteristics are better for finer particles. But from hydrodynamics
point finer particles are difficult to fluidize as the molecules are closely packed.
Hence a little compromise should be made in selecting the particle size in such a way
that it is not too finer nor too coarser. When this condition is met heat and mass
transfer is maximum and results in better efficiency due to favorable hydrodynamic
condition and better heat and mass transfer characteristics. The heat transfer
coefficient is maximum at the bottom of the bed where the bulk density of solids is
maximum.
CFD simulation of the hydrodynamics of the 2 phase fluidized bed has been carried
out by employing the Eulerian approach. Hydrodynamic variables like velocity
distribution, volume fraction of the solids (VOF), pressure drop, bed expansion and
bed voidage were studied. The magnitude of velocity was found to be more away
from the wall. The smaller particles gain more velocity than the larger particles in the
fluidized bed. Heat transfer coefficient agrees with the experimental value with a
reasonably good accuracy
NOMENCLATURE
Ar Archimedes number
CD Particle drag coefficient
CP Specific heat [kJ / kg K]
dP Diameter of the particle [m]
FB Buoyancy force [N]
FD Drag force [N]
FG Gravity force [N]
g Acceleration due to gravity [9.81 m / s2]
h Heat transfer coefficient [W / m2 K]
hg Gas heat transfer coefficient [W / m2 K]
90 S. Bharath Subramaniam
hp Particle heat transfer coefficient [W / m2 K]
hr Radiative heat transfer coefficient [W / m2 K]
hw Wall heat transfer coefficient [W / m2 K]
Hb Bed height [m]
HF Humidity factor
k Thermal conductivity of the gas [W / mK]
mactual air Mass of the actual air [kg]
mb Mass of the bed (fixed or fluidized) [kg]
mflue Mass of the flue gas [kg]
mp Mass of the particle [kg]
mtheoritical air Mass of the theoretical air [kg]
M Moisture content
ΔP Pressure drop [kPa]
Qbottom ash Heat loss due to bottom ash [kJ]
Qfly ash Heat loss due to fly ash [kJ]
Qincomplete combustion Heat loss due to incomplete combustion [kJ]
Qmoisture in air Heat loss due to moisture in the air [kJ]
Qmoisture in fuel Heat loss due to moisture in the fuel [kJ]
Qevaporation of H2O Heat loss due to evaporation of water [kJ]
Qflue gas Heat loss due to flue gas [kJ]
Re Reynolds number
Remf Reynolds number at the minimum fluidization
Tambient Ambient temperature [K]
Tflue Temperature of the flue gas [k]
uP Velocity of the particle [m / s]
Umf Minimum fluidization velocity [m / s]
Uopt Optimum velocity of fluidization [m / s]
VP Volume of the particle [m3]

Performance Analysis of 250 MW Lignite Fired Circulating Fluidized Bed 91
LIST OF SYMBOLS
ΦP Sphericity of the particles
ρb Bulk density of solids [kg / m3]
ρf Density of the fluid [kg / m3]
ρp Particle density [kg / m3]
ε Voidage of the particles
εmf Voidage of the particles at the minimum fluidization
μf Dynamic viscosity of the fluid [ Ns / m2]
η Efficiency of the boiler [%]
LIST OF ABBREVIATIONS
AAS Actual air supplied
CFBC Circulating fluidized bed combustion
CFD Computational fluid dynamics
GCV Gross calorific value
EA Excess air
FBHE Fluidized bed heat exchanger
VOF Volume fraction
REFERENCES
[1] Basu P, Subbarao D, 1985, “Heat transfer in circulating fluidized beds”,
Circulating fluidized bed technology P 281 - 287, Pergamon press
[2] Berruti F, Chaouki J, Godfroy L, Pugsley TS, Patience GS, 1995. “The
hydrodynamics of circulating fluidized Beds”. Journal of Chemical
Engineering; 73:579.
[3] Botterill J.S.M, 1975 “Fluid bed heat transfer”, Academic Press.
[4] Cheremisinoff AP, PN Cheremisinoff, 1984 “Hydrodynamics of Gas-Solids
Fluidization”. London: Gulf. Publication..
[5] Eskin N, A. Gungor, 2001 “Thermodynamic analysis of heat transfer to the
immersed surfaces in a circulating fluidized bed”. Proceedings of Efficiency,
Costs, Optimization, Simulation and Environmental Impact of Energy
Systems, Istanbul, Turkey, vol. 1, P. 249-256.
[6] Geldart.D, 1986, “Gas fluidization technology”, John Wiley and Sons, .

92 S. Bharath Subramaniam
[7] Geldart.D and Abrahamsen A.R, 1986, “Powder Technology”
[8] Huilin L, Rushan B, Lidan Y, Guangbuo Z, Xiu T, 1998, “Numerical
Computation of a circulating fluidized bed combustor”. International Journal
of Energy; 22:1351.
[9] Lee YY, Hyppaueu, 1989 T. “A coal combustion model for circulating
fluidized boilers”. International Conference on FBC, P 753-764.
[10] Levenspiel O, Kunii D., 1991, “Fluidization engineering”, Butterworth &
Heinemann.
[11] Mori S, C.Y. Wen, 1975, “Estimation of bubble diameter in gaseous fluidized
beds”, AICHE Journal 21 P 109-117.
[12] Tsuo Y P, D. Gidaspow, 1990 “Computation of flow patterns in circulating
fluidized beds”, AICHE Journal 36 P 885-896.
[13] Wang. W, Y. Li, 2001, “Hydrodynamics simulation of fluidization by using a
modified kinetic theory”, Industrial and Engineering Chemical Research.