performance analysis with tau, perfdmf and perfexplorer
TRANSCRIPT

Scalable, Automated Parallel Performance Analysis with
TAU, PerfDMF and PerfExplorerKevin A. Huck, Allen D. Malony,Sameer Shende, Alan Morris
khuck, malony, sameer, [email protected]://www.cs.uoregon.edu/research/tau
University of OregonDepartment of Computer and Information Science
Performance Research LaboratoryP • R • L
Performance Research Lab

ParCo 2007, RWTH Aachen / Forschungszentrum Jülich September 5, 2007
Performance Research Lab
• Prof. Allen D. Malony• Sameer Shende• Alan Morris• Wyatt Spear• Scott Biersdorf• Aroon Nataraj• Kevin A. Huck• http://www.cs.uoregon.edu/research/tau/
P • R • LPerformance Research Lab
2

ParCo 2007, RWTH Aachen / Forschungszentrum Jülich September 5, 2007
Overview
• TAU Introduction (brief)
• PerfDMF Introduction
• PerfExplorer Introduction
• PerfExplorer Ongoing Analysis Examples
• Summary
3

ParCo 2007, RWTH Aachen / Forschungszentrum Jülich September 5, 2007
TAU Performance System• Tuning and Analysis Utilities (15+ year project effort)• Performance system framework for HPC systems• Integrated, scalable, flexible and parallel
• Targets a general complex system computation model• Entities: nodes / contexts / threads• Multi-level: system / software / parallelism• Measurement and analysis abstraction
• Integraged toolkit for performance problem solving• Instrumentation, measurement, analysis and visualization• Portable performance profiling and tracing utility• Performance data management and data mining
• Partners: Forshungszentrum Jülich, LLNL, ANL, LANL4

ParCo 2007, RWTH Aachen / Forschungszentrum Jülich September 5, 2007
PerfDMF• Performance Data Management Framework• Originally designed to address critical TAU requirements• Broader goal is to provide an open, flexible framework
to support common data management tasks• Extensible toolkit to promote integration and reuse
across available performance tools• Supported profile formats:TAU, CUBE, Dynaprof, HPCToolkit (Rice), HPC Toolkit (IBM), gprof, mpiP, psrun (PerfSuite), OpenSpeedShop (in development), application
• Supported DBMS:PostgreSQL, MySQL, Oracle, DB2, Derby/Cloudscape
5

ParCo 2007, RWTH Aachen / Forschungszentrum Jülich September 5, 2007
PerfDMF Architecture
6
RDBMS
PerfDMF Query & Analysis Toolkit
ParaProf l
XML
Profiles
metadata
PostgreSQL, MySQL,DB2, Oracle, Derby
... l PerfExplorer
Display & Analysis Tools
ProfilesProfiles
ExportersParsers / Importers
TAU, CUBE, Dynaprof,mpiP, HPCToolkit,IBM HPC Toolkit,Dynaprof, psrun
Formatted
Profiles

ParCo 2007, RWTH Aachen / Forschungszentrum Jülich September 5, 2007
Recent PerfDMF Development• Integration of XML metadata for each profile• Common profile attributes• Thread / process specific profile attributes• Automatic collection of runtime information• Any other data the user wants to collect can be added• build information• job submission information
• Two methods for acquiring metadata:• TAU_METADATA() call from application• Optional XML file added when saving profile to
PerfDMF• TAU Metadata XML schema is simple, easy to generate
from scripting tools (no XML libraries required)7

ParCo 2007, RWTH Aachen / Forschungszentrum Jülich September 5, 2007
PerfExplorer
• Performance knowledge discovery framework• Data mining analysis applied to parallel performance data• comparisons, clustering, correlation, dimension
reduction, ...• Uses the existing TAU infrastructure• TAU & other performance profiles, PerfDMF
• Technology Integration• Java API and toolkit for portability• R-project / Omegahat statistical analysis• Weka data mining package• JFreeChart for visualization, output (EPS, SVG, PNG)
8

ParCo 2007, RWTH Aachen / Forschungszentrum Jülich September 5, 2007
PerfExplorer Design
9
Scripting InterfaceGUI
PerfExplorer Component Interfaces
Analysis Components Data Components
R Weka
PerfDMFAnalysis
Results
Expert
Rules
Metadata
ProvenanceData Mining Inference Engine
Performance
Data

ParCo 2007, RWTH Aachen / Forschungszentrum Jülich September 5, 2007
PerfExplorer Analysis Methods• Data summaries, distributions, scatterplots• Clustering• k-means• hierarchical
• Correlation analysis• Dimension reduction• PCA• Random Linear Projection• Threshholds
• Comparative analysis• Data management views
10

ParCo 2007, RWTH Aachen / Forschungszentrum Jülich September 5, 2007
Relative Comparisons
• Total execution time
• Timesteps per second
• Relative efficiency / speedup for total / per event
• Group fraction of total
• Runtime breakdown
• Phase comparisons
11Data: GYRO on various machines

ParCo 2007, RWTH Aachen / Forschungszentrum Jülich September 5, 2007
Distribution Visualization
12
Observation ofmulti-modal distributions
(clusters)
Indicates min, Q1, mean, median, Q3, max, outliers
} Visualizes Intra-Quartile Range (median 50%)
Data: FLASH on BG/L (LLNL)

ParCo 2007, RWTH Aachen / Forschungszentrum Jülich September 5, 2007
Cluster Analysis
13 Data: Frost (LLNL), 256 threads
ParCo 2007, RWTH Aachen / Forschungszentrum Jülich September 5, 2007
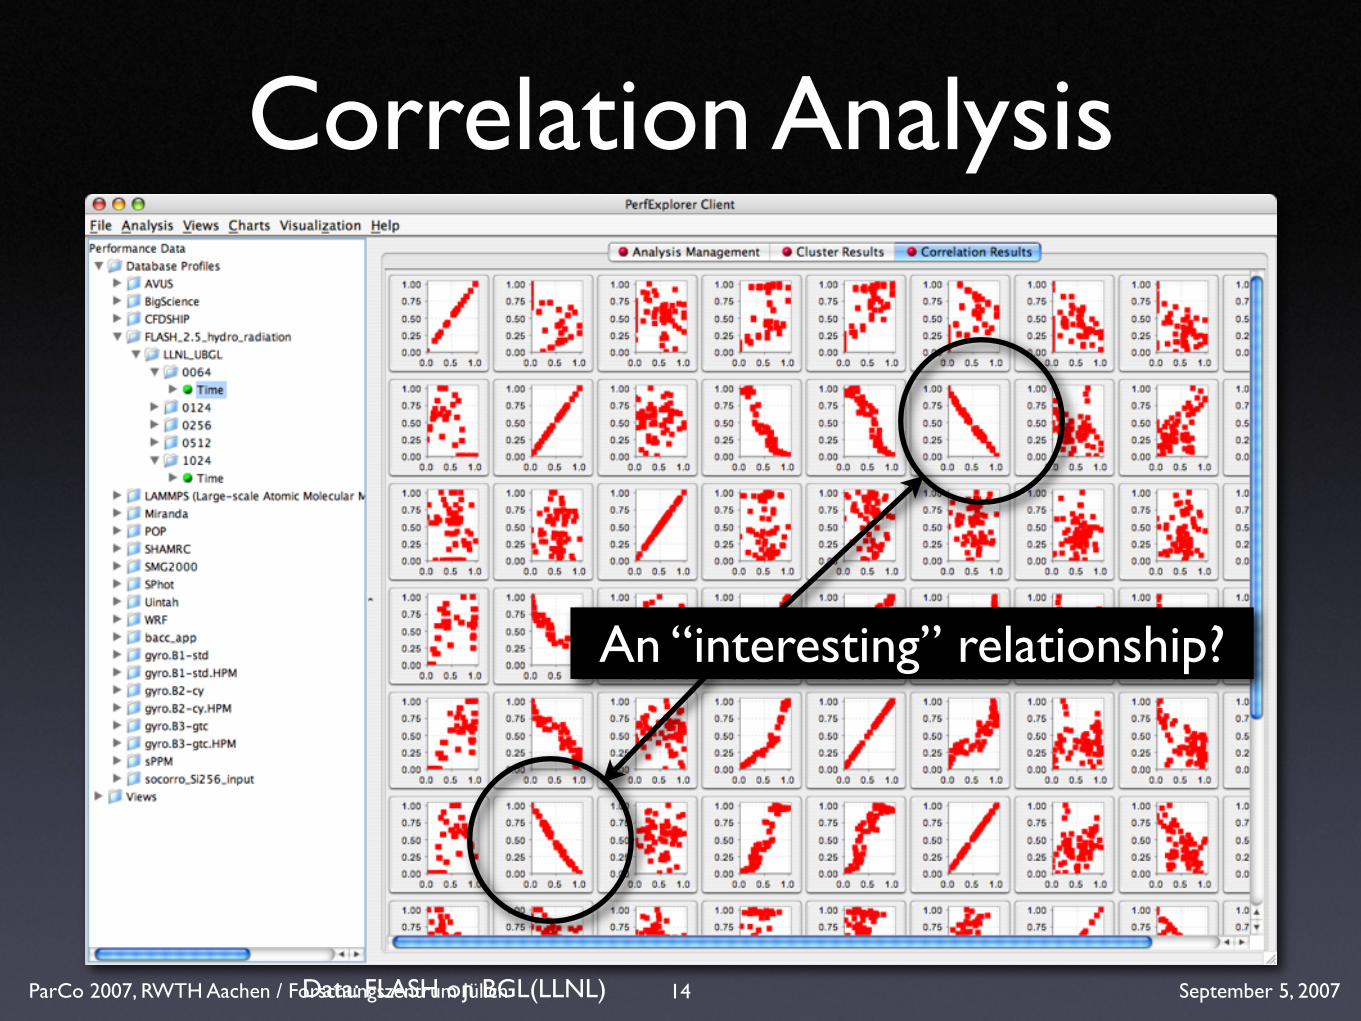
Correlation Analysis
14
An “interesting” relationship?
Data: FLASH on BGL(LLNL)

ParCo 2007, RWTH Aachen / Forschungszentrum Jülich September 5, 2007
4-D Visualization
15
4 “significant” events are selected
clusters andcorrelations are visible
Data: FLASH on BG/L (LLNL)

ParCo 2007, RWTH Aachen / Forschungszentrum Jülich September 5, 2007
New PerfExplorer Features:
• Additional sophisticated metadata support
• Scripting using Jython*
• Inference engine to “infer” causes of performance phenomena from expert rules
• Redesigned component-based analysis
• Persistence of intermediate results
• Provenance
16
* or any other scripting language

ParCo 2007, RWTH Aachen / Forschungszentrum Jülich September 5, 2007
Example: Regression Testing
17 code: FLASH

ParCo 2007, RWTH Aachen / Forschungszentrum Jülich September 5, 2007
Example: Parametric Study
18 code: GTC

ParCo 2007, RWTH Aachen / Forschungszentrum Jülich September 5, 2007
PerfExplorer Example: S3D• Compressible Navier-Stokes solver
coupled with an integrator for detailed chemistry (CHEMKIN-compatible)
• Models turbulent reacting flow in combustion science
• MPI-based parallel computing implementation
• http://www.scidac.gov/BES/BES_TSTC/reports/TSTC2003Annual.html
19
Figure: Two-dimensional DNS of a turbulent methane-air flame using detailed chemistry, GRI-Mech 3.0.Source: http://www.scidac.gov/BES/
BES_TSTC/reports/TSTC2003Annual.html

ParCo 2007, RWTH Aachen / Forschungszentrum Jülich September 5, 2007
S3D Scaling: Efficiency
20
Up to 47% loss of efficiencybaseline: serial execution

ParCo 2007, RWTH Aachen / Forschungszentrum Jülich September 5, 2007
S3D Scaling: Parallel Efficiency
21
up to 30% loss of efficiency(baseline: 8 processors)

ParCo 2007, RWTH Aachen / Forschungszentrum Jülich September 5, 2007
S3D Scaling: Correlation
22
MPI_Wait

ParCo 2007, RWTH Aachen / Forschungszentrum Jülich September 5, 2007
S3D on Hybrid XT3/XT4Most nodes are waiting on a few “slower” nodes...
ranks 0-113
ranks 3200-3313
6400 processes total23

ParCo 2007, RWTH Aachen / Forschungszentrum Jülich September 5, 2007
Cluster explanation...Metadata identifies node names
•Ranks 0-113 lie on processors 3406-3551
•Ranks 3200-3313 are also on 3406-3551
•3406-3551 are on the XT3 partition
•XT3 has slower DDR-400 memory (5986 MB/s)
•XT3 has a slower SS1 (1109 MB/s) interconnect
•XT4 partition has faster DDR2-667 memory modules (7147 MB/s) and faster Seastar2 (SS2) (2022 MB/s) interconnect
•Running on XT4 yields 12% improvement
• If XT3/XT4, load balancing will be required
24

ParCo 2007, RWTH Aachen / Forschungszentrum Jülich September 5, 2007
S3D: “Improved” Result
25
MPI_Wait390 sec.
104 sec.

ParCo 2007, RWTH Aachen / Forschungszentrum Jülich September 5, 2007
PerfExplorer example: GTC
• GTC: Gyrokinetic Toroidal Code
• Particle-in-cell physics simulation
• CHARGEI: particles apply their charge to the grid cells
• PUSHI: cells update particle locations
• MPI-based parallel implementation
26
Figure: The (turbulent) electrostatic potential from a GYRO simulation of plasma microturbulence in the DIII-
D tokamak.Source: http://www.scidac.gov/FES/
FES_PMP/reports/PMP2004Annual.html

ParCo 2007, RWTH Aachen / Forschungszentrum Jülich September 5, 2007
GTC: Dynamic Phases
27
~6 sec.~7 sec.
L2 hit rate
L1 hit rate
MFLOPS
?{
Source: GTC on Cray XT4
.92
.86
.994
.989
1120
979

ParCo 2007, RWTH Aachen / Forschungszentrum Jülich September 5, 2007
GTC: Iteration i => PUSHI
28
“sawtooth” caused by diagnostic step every fourth iteration
L2 hit rate
L1 hit rate
MFLOPS
.95
.87
.994.988
17001450
Source: GTC on Cray XT4

ParCo 2007, RWTH Aachen / Forschungszentrum Jülich September 5, 2007
GTC: Iteration i => CHARGEI
29
L2 hit rate
L1 hit rate
MFLOPS
“sawtooth” gone
.95
.88
.994.988
710
600
Source: GTC on Cray XT4

ParCo 2007, RWTH Aachen / Forschungszentrum Jülich September 5, 2007
GTC: after 5,000 Iterations
30
it only continues to get worse...
Source: GTC on BG/L
Text
?

ParCo 2007, RWTH Aachen / Forschungszentrum Jülich September 5, 2007
GTC Phases: Summary• CHARGEI, PUSHI events have good spatial locality of
particles, but bad temporal locality for cells
• After 100 iterations, each iteration on Cray XT3/XT4 takes ~1 second longer (~12%)
• Full simulation runs for 10,000 timesteps (potential improvement of 2+ hours from 20 hour execution)
• PUSH event calls a diagnostic routine every X timesteps (input variable)
• Analysis is ongoing...31

ParCo 2007, RWTH Aachen / Forschungszentrum Jülich September 5, 2007
Conclusion• TAU:• Portable, configurable, complete instrumentation
and measurement of parallel profiles and traces • PerfDMF:• Profile management, query and analysis API• Supports most commonly used profile formats (if
not, we can add it)• PerfExplorer:• Robust profile parametric study support• In-depth analysis of large scale profiles
32

ParCo 2007, RWTH Aachen / Forschungszentrum Jülich September 5, 2007
Acknowledgments
• US Department of Energy (DOE)• Office of Science
• MICS, Argonne National Lab• ASC/NNSA
• University of Utah ASC/NNSA Level 1• ASC/NNSA, Lawrence Livermore National Lab
• US Department of Defense (DoD)• NSF Software and Tools for High-End Computing• Forschungszentrum Jülich• TU Dresden• Los Alamos National Laboratory• ParaTools, Inc.• SciDAC, PERI, ORNL, NERSC, RENCI
33