performance and business outlook - clp group · performance and business outlook. ... to a section...
TRANSCRIPT

How have we performed against our strategy? What opportunities and challenges will influence our
future performance?
PERFORMANCE ANDBUSINESS OUTLOOK

ere we offer an integrated and wide-rangingview of CLP’s financial, operational, environmental
and social performances in the five markets where we operate


Financial Performance
Hong Kong Financial Performance at a Glance
2015 2014 Increase / (Decrease)
HK$M HK$M HK$M %
Revenue 38,937 35,623 3,314 9.3
Total earnings 8,370 9,943 (1,573) (15.8)
Operating earnings 8,271 7,745 526 6.8
Electricity business 8,276 7,777 499 6.4
Other businesses (5) (32) 27 84.4
EBITDAF 16,549 18,337 (1,788) (9.8)
Fixed assets 100,508 97,372 3,136 3.2
Total assets 120,087 118,754 1,333 1.1
Bank loans and other borrowings 40,976 40,644 332 0.8
Total liabilities 77,616 77,537 79 0.1
Capital investments 7,614 8,164 (550) (6.7)
Operating earnings from our Hong Kong electricity business were HK$8,276 million, a 6.4% increase from HK$7,777 million in
2014. This was mainly due to higher permitted return on a higher level of average net fixed assets and share of additional 30% of
CAPCO’s full-year earnings following its acquisition in May 2014.
8,276
7,777
+257
+323
-81
0 7,0006,000 9,0008,000
2014 Operating earnings
Others
2015 Operating earnings
Increased ownership in CAPCO
Increase in net return on higher average net fixed assets
Operating Earnings of Hong Kong Electricity Business (HK$M)
Operational PerformanceOne of our most important objectives is to serve our customers
in Hong Kong with a safe, reliable and clean electricity supply
at a reasonable cost. We again achieved this in 2015.
Electricity Sales and TariffsIn 2015, local sales of electricity were 33,033 gigawatt hours
(GWh), representing a slight increase of 0.3% over 2014.
A breakdown of the changes during the period by sector is
shown in the table on the right.
Local Sales
Increase / (Decrease)
Residential (222GWh) (2.3%)
Commercial 110GWh 0.8%
Infrastructure & Public Services 220GWh 2.6%
Manufacturing (0GWh) (0.0%)
As Percentage of Total Local Sales
40%
5%
27%Residential
Commercial
Infrastructure & Public Services
Manufacturing
28%
Note:Figures include rounding adjustments.
43CLP Holdings 2015 Annual Report

Hong Kong
Residential Tariff Comparison with Other Cities
Residential Tariff
HK cents / kWh (as of January 2016)
Source: Web Search
Notes:1 Comparison based on average monthly domestic
consumption of 275kWh.2 Tariff and exchange rate at January 2016.
Kuala Lumpur
TaipeiVancouverShanghaiShenzhenJakartaSeoulM
iami
CLP Pow
er Hong Kong
SingaporeW
ashington, D.C
.H
oustonH
elsinkiM
acauSan FranciscoM
anilaParis
Am
sterdamLuxem
bourgLisbonW
ellingtonTokyoBrusselsSydneyLondonN
ew York
Madrid
Berlin
Rome
020406080
100120140160180200220240260280300
Compared with 2014, sales to the Residential sector recorded
a decrease of 2.3%, mainly due to a lower heating load in the
first quarter, followed by a lower cooling and dehumidifying
load in the third quarter. This partially offset the increase in
sales in the Commercial as well as the Infrastructure and Public
Services sectors.
Sales to the Mainland amounted to 1,187GWh, a decrease of
3.2% from 2014, mainly attributed to a decline in electricity
sales to Guangdong Power Grid Co., Ltd. in 2015.
Total electricity sales, including local sales and sales to the
Mainland, increased by 0.2% to 34,220GWh.
CLP is very aware of the impact of tariff adjustments on
people’s livelihood and business, and we place great emphasis
on managing costs. Thanks to the significant fall in fuel prices in
2015 and our efforts to control costs, we were able to reduce
the Average Total Tariff by 0.9% from January 2016, despite
the need to use significantly more gas to generate electricity
to meet the Government’s stringent environmental targets.
A special one-off fuel rebate totalling HK$1,264 million was
made to our customers from August 2015. If fuel prices remain
stable in the coming year, we are confident that our tariff
in 2017 can be maintained at the 2016 level despite stricter
emissions caps and increasing natural gas usage in 2017.
Investment and ReliabilityDuring the year, we continued to make investments to enhance
the reliability and security of our supply system amidst new
demand growth arising from infrastructure development.
CLP invested HK$7.6 billion in generation, transmission and
distribution networks, as well as in customer services and
supporting facilities. This included the commissioning of three
new substations to support the development of Hong Kong’s
expanding road and railway networks, the Government’s
Harbour Area Treatment Scheme, and to meet demand from
population growth in northwestern New Territories.
In 2015, we achieved a historic low level of 1.32 minutes
of unplanned power interruptions per customer per year as
we continued to deliver highly reliable electricity supply to
our customers. Between 2013 and 2015, on average a CLP
customer experienced 1.51 minutes of unplanned power
interruptions per year, compared to 17-28 minutes in New
York, Sydney and London (between 2012 and 2014).
Unplanned customer minutes lost per year
Reliability Levels in Hong Kong, New York, Sydney, London and Singapore
1.5
0.528
Singapore CLP PowerHong Kong
Sydney(CBD)
New York London
1717
Notes:
1 2013 – 2015 average for CLP Power Hong Kong.
2 2012 – 2014 average for all other cities (the latest available data).
3 Singapore’s power supply network is mostly underground, and is less
exposed to the influence of weather and other external interferences than
overhead lines.
More Reliable Less Reliable
44 CLP Holdings 2015 Annual Report

Over the years, the SoC has provided power companies a stable environment allowing them to support Hong Kong’s economic development and to serve customers with electricity of world-class reliability at reasonable cost and in an environmentally-friendly manner.
The SoC has proven to be the most preferred regulatory model for Hong Kong because it has delivered outstanding results for our customers. The public’s response to the Government’s consultation on the future development of the electricity market last year attested to this conclusion. Hong Kong should not move to emulate other regulatory models that have not been proven to work properly in the interests of our customers. We should continue with the current model, and refine it as appropriate to meet society’s aspirations.
Is Hong Kong’s SoC Agreement still the most preferred regulatory model for the electricity industry, and why?
Mr Evan Li Director, Regional Head of Power, Utilities, Renewables and Environment (PURE), Asia-PacificGlobal Research The Hongkong and Shanghai Banking Corporation Limited
Paul PoonManaging Director CLP Power Hong Kong
More Q&As
good progress and submitted a Development Plan to the
Government at the end of 2015, followed by an environmental
impact assessment study report in February 2016.
However, gas supply for our new power station will be a key
issue. This was brought into sharp perspective when damage
to a section of the 9,000-km Second West-East Gas Pipeline
from a landslide in Shenzhen on 20 December 2015 led to
temporary suspension of natural gas supplies to Hong Kong
from this source. CLP immediately activated its contingency
arrangements and ensured that the electricity supply to our
customers was uninterrupted. Whilst permanent gas supply
is expected to resume shortly, our contingency actions
underscore the importance of ensuring that CLP, and Hong
Kong as a whole, has access to multiple supplies of natural gas.
To do this, we continue to pursue new sources of gas supply
as stipulated under the Memorandum of Understanding
(MOU) on energy cooperation signed between the Hong Kong
Government and the Central People’s Government in 2008.
As our gas source from the Yacheng gas fields in South China
Sea is depleting and reaching the end of its life cycle, we have
entered into a bridging agreement to purchase gas from the
nearby small Wenchang gas field to supplement our supply
needs in the medium term. Wenchang gas can be supplied
to CLP through the same pipeline as Yacheng, providing a
cost-effective solution. Based on our long-term gas demand
Regulatory AffairsIn November 2015, the Hong Kong Government announced
the key findings of the public consultation on the future
development of the electricity market. The majority of
respondents recognised the effectiveness of the Scheme
of Control (SoC) Agreement and supported the current
contractual arrangements which they felt had met the four
energy policy objectives of safety, reliability, reasonable tariffs
and environmental protection. Respondents also generally
agreed that the SoC Agreement has enabled electricity providers
to provide customers with a reliable and safe electricity supply,
which is considered to be of great importance. For the future,
respondents wanted more emphasis on promoting renewable
energy and energy conservation. We welcome the consultation
results and we have commenced discussions with the
Government on the new SoC Agreement.
Gas SupplyCLP has been actively engaging with key stakeholders on the
proposal to build a new Combined Cycle Gas Turbine (CCGT)
at Black Point Power Station to support the Government’s
policy of increasing the share of gas in the Hong Kong’s
fuel mix for power generation to around 50% in 2020. The
new CCGT unit would adopt a technology that produces
a comparatively higher efficiency and better emissions
performance than our existing generation units. We are making
45CLP Holdings 2015 Annual Report

Hong Kong
Benefits of Smart MetersOperational benefits:
Power companies can improve
operational efficiency through
automating day-to-day
processes. Supply reliability
can also be improved through
automated fault location,
which in turn reduces duration
of service disruption.
Customer benefits:
Customers can achieve saving
by adjusting their consumption
habits as they learn more about
their electricity usage and are
provided with more options.
Societal benefits:
Public safety can be
improved since power
companies are more
informed about system
status, reducing the risks of
fire hazards and incidents.
and future fuel mix requirements, we are also commencing
engagement with potential suppliers for additional gas
requirements for 2020 and beyond.
In addition, to increase the diversity of gas supplies and
broaden our access to liquefied natural gas (LNG), we are
continuing to evaluate the feasibility of developing a Floating
Storage and Regasification Unit – a ship-based LNG import
terminal located offshore to store and regasify LNG to supply
end users – in Hong Kong. Such a facility would enable our city
to have access to a range of competitive LNG supplies directly
from the international market and help minimise supply risks.
CustomersCustomers are at the heart of our operations. In 2015,
we continued to look for ways and invest in technologies
to provide a greener and smarter electricity supply to our
customers, enhance customer experience, and promote the
smarter use of energy.
Although Hong Kong lacks available land supply and the
best renewable energy resources, we continue to support
renewable energy development such as the Government’s
Sludge Treatment Facility. We also welcome the installation
of distributed renewable energy facilities. Currently, over
200 renewable energy systems are connected to CLP’s grid.
Throughout 2015, we improved customer support and
streamlined the application process to encourage adoption of
these facilities.
We support green motoring and were the first to set up
charging stations across Hong Kong offering a variety of
chargers for different models of electric vehicles. We have
now established more than 140 charging points providing
standard, semi-quick and quick charging services, including
the first multi-standard quick charger in the city. We have
extended our free charging services until the end of 2016 and
introduced a new service in 2015 to facilitate the installation of
private chargers by our customers in residential or commercial
buildings.
Our efforts in promoting energy efficiency and conservation
continued in 2015 as more programmes were rolled out to
help our customers identify energy saving opportunities and
better manage their electricity usage. During the year, we
submitted the encouraging findings of myEnergy, a smart
meter pilot programme for residential and small-to-medium
commercial customers, to the Government. CLP is working
with the Government to explore greater use of smart meters in
the future.
46 CLP Holdings 2015 Annual Report

Our Demand Response programmes enable our commercial
and industrial customers to save electricity by meeting their
pre-agreed load reduction targets during demand peaks.
• Green Studio Green Studio, Hong Kong’s first 3D environmental
education mobile studio, has been in service since 2009.
It received over 13,000 visitors in 2015 and will reach its
100,000th visitor milestone in 2016.
• CLP Junior Green Engineer Programme 2015 Through field trips, talks and interactive workshops,
primary four to six students who joined the CLP Junior
Green Engineer Programme in the summer learned about
science, environmental protection and the engineering
profession. In 2015, the programme received over 1,000
applications.
• Green Elites Campus Accreditation Programme We engaged with more than 8,000 students and teachers
of primary schools under Po Leung Kuk through the Green
Elites Campus Accreditation Programme. Together with
Friends of the Earth (HK) and Green Power, we provided
them with educational tools and daily tips to encourage
them to practise green living. In addition, over 22,000
primary school students enrolled as Green Elites through
our Green Elites Portal to learn more about green living.
• Eco Building Fund The Eco Building Fund helped fund energy efficiency
improvement projects in common areas of residential
buildings. By the end of 2015, 36 applications involving
HK$16 million had been approved.
• GREENPLUS Award 2015 The Award encouraged business customers to practise
energy efficiency and conservation.
• Green Building Symposium The Green Building Symposium held in November 2015
provided a platform for our business customers and
professionals in the building industry to share ideas and
experiences.
• Eco Home Tour – Smart Living • Smart Use of Energy The new Eco Home Tour showcased an ingenious
selection of home energy saving technology and devices
from around the world to introduce low carbon living and
energy saving tips to visitors. The customer service centre
in Tai Po was refurnished as an Eco Home to provide
green living tips to customers.
Awareness Building Campaign
Energy Efficiency Education
Demand Side Management
PromotingEnergy Efficiency and Conservation
In 2015, we also successfully conducted the first-of-its-kind “Power Your Love” programme, encouraging more than 200,000 of
our residential customers to save energy and transfer the electricity they saved to people in need. When the programme ended in
July 2015, 9.5 million kWh of electricity was saved. As a result, CLP donated HK$6 million from a shareholders’ fund, together with
some HK$60,000 of public donation, to help pay for the electricity bills of about 20,000 underprivileged residential households.
Other examples of our energy efficiency and conservation initiatives can be found below:
47CLP Holdings 2015 Annual Report
Hong Kong
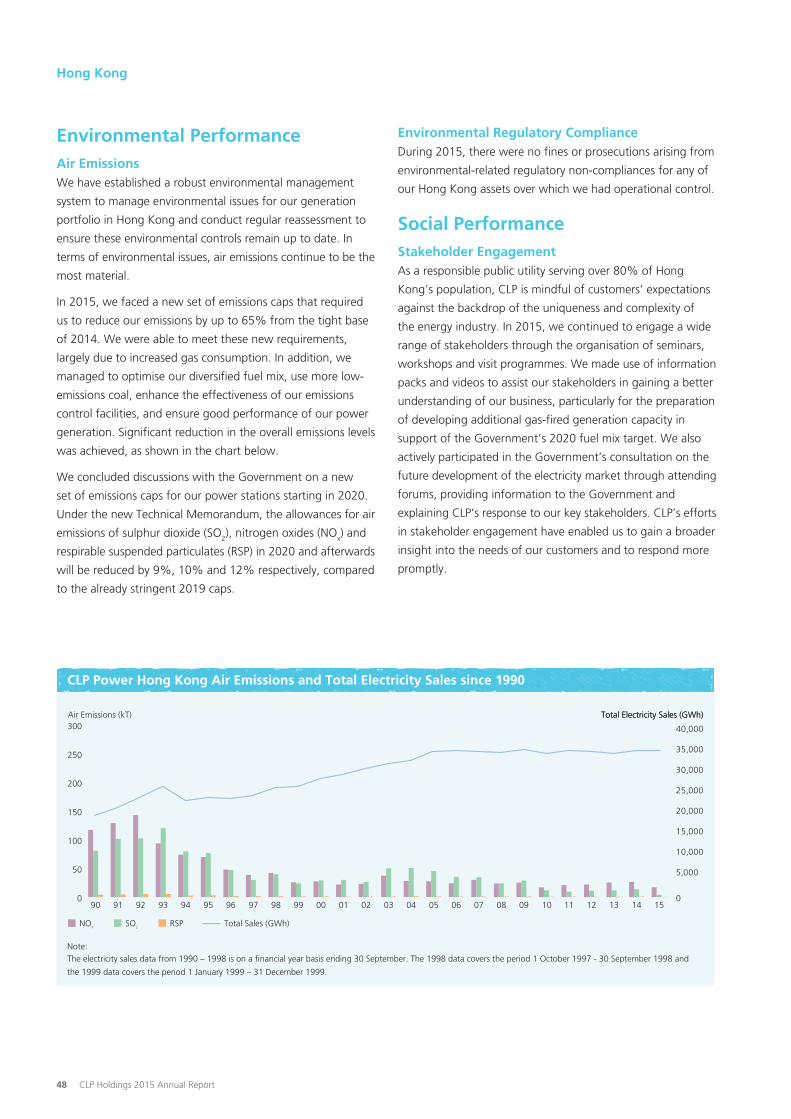
Note:The electricity sales data from 1990 – 1998 is on a financial year basis ending 30 September. The 1998 data covers the period 1 October 1997 - 30 September 1998 and
the 1999 data covers the period 1 January 1999 – 31 December 1999.
NOX SO2 RSP Total Sales (GWh)
Air Emissions (kT) Total Electricity Sales (GWh)
0
50
100
150
200
250
300
CLP Power Hong Kong Air Emissions and Total Electricity Sales since 1990
0
5,000
10,000
15,000
20,000
25,000
30,000
35,000
40,000
Total Electricity Sales (GWh)
1514131211100908070605040302010099989796959493929190
Environmental PerformanceAir EmissionsWe have established a robust environmental management
system to manage environmental issues for our generation
portfolio in Hong Kong and conduct regular reassessment to
ensure these environmental controls remain up to date. In
terms of environmental issues, air emissions continue to be the
most material.
In 2015, we faced a new set of emissions caps that required
us to reduce our emissions by up to 65% from the tight base
of 2014. We were able to meet these new requirements,
largely due to increased gas consumption. In addition, we
managed to optimise our diversified fuel mix, use more low-
emissions coal, enhance the effectiveness of our emissions
control facilities, and ensure good performance of our power
generation. Significant reduction in the overall emissions levels
was achieved, as shown in the chart below.
We concluded discussions with the Government on a new
set of emissions caps for our power stations starting in 2020.
Under the new Technical Memorandum, the allowances for air
emissions of sulphur dioxide (SO2), nitrogen oxides (NOx) and
respirable suspended particulates (RSP) in 2020 and afterwards
will be reduced by 9%, 10% and 12% respectively, compared
to the already stringent 2019 caps.
Environmental Regulatory ComplianceDuring 2015, there were no fines or prosecutions arising from
environmental-related regulatory non-compliances for any of
our Hong Kong assets over which we had operational control.
Social PerformanceStakeholder EngagementAs a responsible public utility serving over 80% of Hong
Kong’s population, CLP is mindful of customers’ expectations
against the backdrop of the uniqueness and complexity of
the energy industry. In 2015, we continued to engage a wide
range of stakeholders through the organisation of seminars,
workshops and visit programmes. We made use of information
packs and videos to assist our stakeholders in gaining a better
understanding of our business, particularly for the preparation
of developing additional gas-fired generation capacity in
support of the Government’s 2020 fuel mix target. We also
actively participated in the Government’s consultation on the
future development of the electricity market through attending
forums, providing information to the Government and
explaining CLP’s response to our key stakeholders. CLP’s efforts
in stakeholder engagement have enabled us to gain a broader
insight into the needs of our customers and to respond more
promptly.
48 CLP Holdings 2015 Annual Report

Community InitiativesThe success of our business is closely aligned with the well-
being of the community we serve. In Hong Kong, our
community initiatives focus on three areas: the environment,
youth and education, and community well-being. We work
closely with local non-governmental organisations and
community groups to identify evolving needs in society and
devise programmes that will bring an enduring impact. These
collective efforts have brought fruitful outcomes in 2015.
During the year, we initiated and supported 392 community
projects in Hong Kong. Some of the key projects are
highlighted below:
OutlookAs discussed in the Chairman’s Statement and CEO’s Strategic
Review, the Paris Agreement has laid down a clear direction
and objectives for global cooperation to tackle climate change.
To this end, the Hong Kong Government has pledged to take
forward-looking mitigation measures. One of its first actions
is setting up an inter-departmental committee to steer and
coordinate the implementation work on this front. As Hong
Kong’s largest power company, we look forward to this
opportunity and will work closely with the Government to help
Hong Kong achieve a greener future.
CLP Volunteering
• More than 1,000 CLP volunteers contributed over
9,800 hours of their free time in serving the
community.
• CLP received the Corporate Award of the Hong
Kong Volunteer Award and the Grand Caring
Award (Enterprise Group) of the Corporate Social
Responsibility Recognition Scheme organised by the
Federation of Hong Kong Industries.
COMMUNITY
Devising Sustainable Programmes for the Community
VOLUNTEERING
Elderly Yum Cha
About 30,000 elderly people were
treated to dim sum breakfasts. The event was
supported by district council members, catering
associations, NGOs and local community
groups.
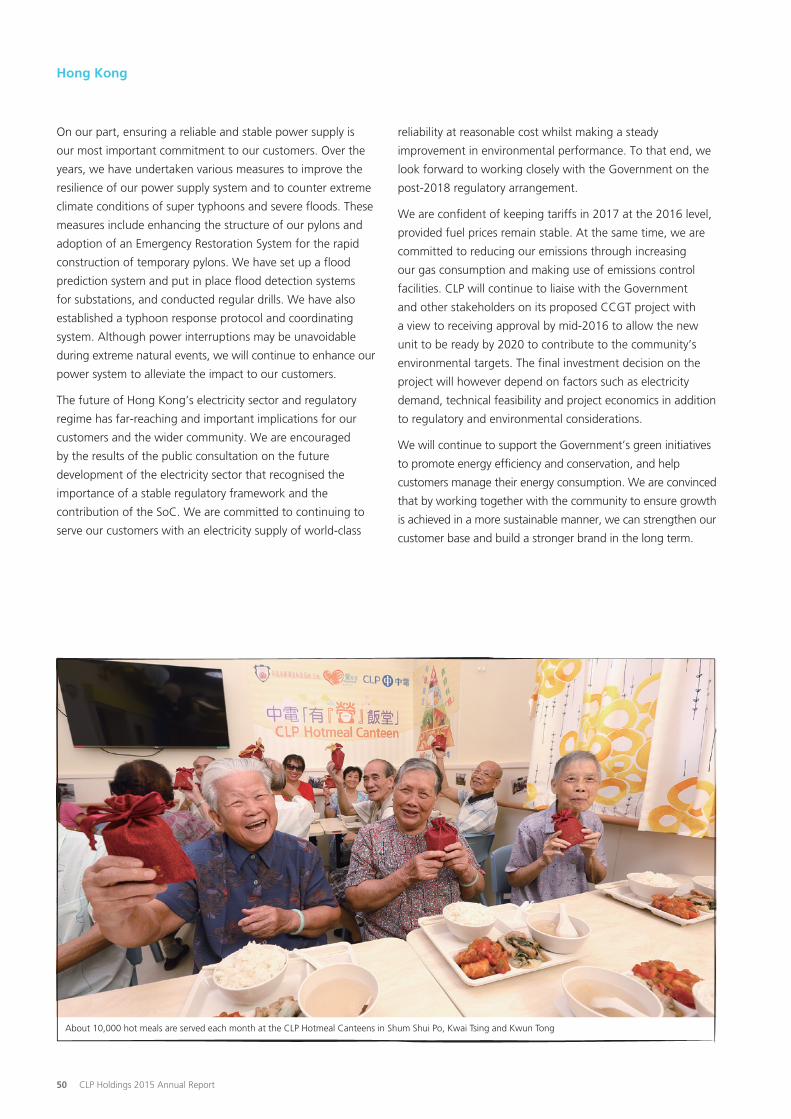
CLP Hotmeal Canteens
About 10,000 hot meals a month were
provided to the needy in Sham Shui Po, Kwai
Tsing and Kwun Tong areas.
One School One Engineer Pilot Programme
Over 2,700 secondary school students learned
about energy and the engineering profession through
the programme.
EDUCATION
Sharing the Festive Joy
CLP volunteers celebrated with over 800
elderly people on three festive holidays.
49CLP Holdings 2015 Annual Report
Hong Kong
On our part, ensuring a reliable and stable power supply is
our most important commitment to our customers. Over the
years, we have undertaken various measures to improve the
resilience of our power supply system and to counter extreme
climate conditions of super typhoons and severe floods. These
measures include enhancing the structure of our pylons and
adoption of an Emergency Restoration System for the rapid
construction of temporary pylons. We have set up a flood
prediction system and put in place flood detection systems
for substations, and conducted regular drills. We have also
established a typhoon response protocol and coordinating
system. Although power interruptions may be unavoidable
during extreme natural events, we will continue to enhance our
power system to alleviate the impact to our customers.
The future of Hong Kong’s electricity sector and regulatory
regime has far-reaching and important implications for our
customers and the wider community. We are encouraged
by the results of the public consultation on the future
development of the electricity sector that recognised the
importance of a stable regulatory framework and the
contribution of the SoC. We are committed to continuing to
serve our customers with an electricity supply of world-class
reliability at reasonable cost whilst making a steady
improvement in environmental performance. To that end, we
look forward to working closely with the Government on the
post-2018 regulatory arrangement.
We are confident of keeping tariffs in 2017 at the 2016 level,
provided fuel prices remain stable. At the same time, we are
committed to reducing our emissions through increasing
our gas consumption and making use of emissions control
facilities. CLP will continue to liaise with the Government
and other stakeholders on its proposed CCGT project with
a view to receiving approval by mid-2016 to allow the new
unit to be ready by 2020 to contribute to the community’s
environmental targets. The final investment decision on the
project will however depend on factors such as electricity
demand, technical feasibility and project economics in addition
to regulatory and environmental considerations.
We will continue to support the Government’s green initiatives
to promote energy efficiency and conservation, and help
customers manage their energy consumption. We are convinced
that by working together with the community to ensure growth
is achieved in a more sustainable manner, we can strengthen our
customer base and build a stronger brand in the long term.
About 10,000 hot meals are served each month at the CLP Hotmeal Canteens in Shum Shui Po, Kwai Tsing and Kwun Tong
50 CLP Holdings 2015 Annual Report


Mainland China
Financial Performance
Mainland China Financial Performance at a Glance
2015 2014 IncreaseHK$M HK$M HK$M %
Revenue 937 909 28 3.1
Total earnings 1,885 1,458 427 29.3
Operating earnings 2,128 1,616 512 31.7
Power projects in Mainland China 1,977 1,579 398 25.2
PSDC and Hong Kong Branch Line 151 37 114 308.1
EBITDAF 2,705 2,188 517 23.6
Fixed assets 6,473 5,364 1,109 20.7
Total assets 26,653 25,917 736 2.8
Bank loans and other borrowings 4,402 3,516 886 25.2
Total liabilities 7,265 6,610 655 9.9
Capital investments 2,568 2,357 211 9.0
Operating earnings from Mainland China were up by 25.2% to HK$1,977 million in 2015, as compared to HK$1,579 million in
2014. The main contributions were as follows:
• Earnings from our 25% stake in the Daya Bay Nuclear Power Station rose by 11.6% as a result of the strong operational
performance.
• Earnings from coal-fired projects improved mainly due to lower coal prices and the resumption of sharing of earnings from
CSEC Guohua (HK$316 million) after the lapse of Share Transfer Agreement at 31 December 2014, partly offset by lower
contribution from Fangchenggang Power Station due to fewer units sold and reduction in tariff.
• Contributions from solar projects increased mainly attributable to Xicun I and Sihong projects, which were commissioned in late
2014 and early 2015 respectively. In addition, earnings from wind projects remained stable. On the other hand, earnings from
hydro projects (in particular Huaiji Hydro) were lower due to lower water levels.
In view of the cessation of operation of Beijing Yire Power Station in March 2015, an impairment provision of HK$243 million has
been made.
0
+316
-94
+93
-20
+70
+33
1,977
1,579
Operating Earnings of Power Projects in Mainland China (HK$M)
1,400 1,600 1,800 2,000 2,200
Earnings of CSEC Guohua after resumption of joint control
Other coal-fired projects – mainly due to lower generation of Fangchenggang and lower tariff, partially offset by low coal pricesWind & Solar – more wind resources and contributionsfrom newly commissioned Xicun and Sihong Solar
Hydro – low water level at Huaiji
Nuclear – strong operational performance
Exchange difference and others
2014 Operating earnings
2015 Operating earnings
52 CLP Holdings 2015 Annual Report

Operational PerformanceIn 2015, we continued to expand our generation portfolio
concentrating on renewable energy and high efficiency coal-
powered developments. This was despite a slowdown in overall
electricity demand growth to 0.5% from 3.8% in 2014.
Underlining our commitment to developing renewable energy
in Mainland China as a key growth market, 2015 saw the
addition of 90MW of solar energy (Sihong and Xicun II) to our
portfolio.
Performance of our solar projects was satisfactory. Xicun I,
which was commissioned in December 2014, performed above
our expectations due to better solar resources and higher
plant efficiency. The success of Xicun I has helped CLP secure
an additional capacity quota from the Yunnan Provincial
Government to develop Phase II, adding a further 42MW of
capacity. The second phase, of which the construction was
completed in four months, was commissioned in November
2015.
Elsewhere, Jinchang reported higher sales after participating
in a direct electricity sales scheme. Sihong reported solid
performance after commencing operation in February 2015
with solar resources close to original expectations.
In 2015, operational performance of our wind projects was on
par with last year. Oversupply led to grid curtailment and lower
demand growth affected our projects in northeast China.
In the meantime, Xundian (49.5MW) commenced commercial
operation in January 2016, whilst the construction of Sandu
I, CLP Laizhou I and Laiwu II (198MW combined) continues.
We have also obtained approval from Guizhou Energy
Administration for the development of Sandu II (99MW).
On hydro, Jiangbian reported higher generation and more
sales through direct contracts when compared to the previous
year. It also received the Project Completion Acceptance
approval in September 2015 from the National Development
and Reform Commission fulfilling the national requirements
of design, construction and operation. Jiangbian is the
second hydropower project in the Mainland to achieve such
qualification.
Dali Yang_er continued to suffer from lower rainfall resulting in
reduced generation. Huaiji also generated less electricity due to
lower rainfall in the region and lower reservoir water levels over
the first half of 2015.
On the safety aspect, Fangchenggang, Jiangbian Hydro and
Qian’an Wind achieved at the same time a platinum five-star
rating from National Occupational Safety Association (NOSA)
in 2015. It is the second consecutive year that Jiangbian Hydro
and Qian’an Wind achieved such rating.
In July 2015, we shared CLP’s work safety management
experience and practices with Guangxi Work Safety Committee
in Fangchenggang to enhance work safety management across
various government departments and enterprises.
The giant blade of a wind turbine is on its way to the Sandu Wind Farm in Guizhou
53CLP Holdings 2015 Annual Report

Mainland China
During the year, we continued to benefit from the fall in
international and domestic coal prices. The decline in coal
prices helped offset the reduction of on-grid tariff rates which
took effect in April 2015. Fangchenggang Power Station
suffered from increased hydro generation in Guangxi and
more subdued electricity demand, which resulted in lower
dispatch. Meanwhile, the construction of Fangchenggang II is
progressing on schedule. In March 2015, Beijing Yire Power
Station ceased operation in support of Beijing Government’s
effort to combat air pollution although the coal-fired power
station remained in full compliance with regulatory emissions
requirements. We were allowed to transfer Yire’s allocated
generation quota to other power plants under CSEC Guohua in
which CLP holds a 30% equity stake.
2015 marked the 30th anniversary of CLP’s partnership
with China General Nuclear Power Corporation (CGNPC) in
Guangdong Daya Bay Nuclear Power Station (GNPS). During
the year, GNPS continued to operate smoothly, achieving
an utilisation rate of 89.5%, compared to 87.8% in 2014.
It also completed an extensive planned maintenance outage
during the year as required by the National Nuclear Safety
Administration every 10 years. GNPS maintained an excellent
safety record and its performance compared favourably vis-a-
vis indices promulgated by the World Association of Nuclear
Operators. A “Below-Scale” Licensing Operational Event (also
known as a Level 0 event under the International Nuclear and
Radiological Event Scale) occurred in October 2015. This event
had no safety implications and caused no reduction to the
supply of electricity to customers.
Environmental PerformanceAir EmissionsFangchenggang is currently our only fossil-fuel based power
station under CLP’s operational control in Mainland China. Its
air emissions in 2015 were lower than 2014 due to low dispatch
levels. In 2013, the Central People’s Government issued emissions
control enhancement requirements for coal-fired power stations
for 2014-2020. Guangxi was originally not within the scope of
these new requirements, but had since been included. In order to
ensure Fangchenggang I and II meet these requirements within
the required time frame, CLP has been working to enhance the
environmental mitigation measures of both plants, including
upgrading Fangchenggang I’s desulphurisation, denitrification
and dust emission equipment, to meet the higher air emissions
standard imposed by the Chinese Government.
Environmental Regulatory ComplianceIn 2015, there were no fines or prosecutions arising from
environmental-related regulatory non-compliances for our
assets in Mainland China in which we have operational control.
We are constructing a number of power stations in Mainland
China including Fangchenggang II and several wind and
solar projects. Over 2015, we continued to monitor the
environmental performance of our construction sites through
regular measurements, site supervision, and on-site audits by
both CLP internal staff and independent parties. None of these
sites experienced any regulatory environmental compliance
issues throughout the year.
Wind Projects – Performance
Installed Capacity Generation Utilisation
(MW) (GWh) (%)2015 20141 2015 20141
Wholly-owned
Qian’an I and II 99.0 159.0 172.5 18.0 19.9
Penglai I 48.0 96.8 89.3 23.0 21.2
Laiwu I 49.5 67.6 68.3 15.6 n / a2
Minority-owned
21 projects 936.9 1,676.4 1,647.5 20.4 20.1
CGN Wind JV
CGN Wind Portfolio3 1,794.0 2,979.3 3,138.3 19.0 20.0
Notes:
1 Based on electricity sent-out.2 n / a (not applicable): projects that had not been commissioned for a full year’s operation.3 Utilisation applies to projects with full-year operation in the JV.
54 CLP Holdings 2015 Annual Report

Solar Projects – Performance
Installed Capacity Generation Availability Utilisation Operating Hours
(MW)1 (GWh) (%) (%) (Hours)
2015 2014 2015 2014 2015 2014 2015 2014
Jinchang 85 130 101 100 100 17 14 1,529 1,182
Sihong2,3 93 128 n/a n/a n/a n/a n/a n/a n/a
Xicun I2,4 42 90 n/a 100 n/a 24 n/a 2,134 n/a
Xicun II2,5 42 n/a n/a n/a n/a n/a n/a n/a n/a
Notes:1. Alternate Current (AC) capacity is used to align with the calculation method for other power plants under CLP portfolio.2. n/a (not applicable): projects that had not been commissioned for a full year’s operation.3. The project entered commercial operation in February 2015.4. The project entered commercial operation in December 2014.5. The project entered commercial operation in November 2015.
Hydro Projects – Performance
Installed Capacity Generation Availability Utilisation Operating Hours
(MW) (GWh) (%) (%) (Hours)
2015 2014 2015 2014 2015 2014 2015 2014
Dali Yang_er 50 124 140 86 84 28 32 2,494 2,816
Huaiji1 129 397 439 92 88 35 39 3,085 3,462
Jiangbian 330 1,277 1,151 89 87 44 40 3,869 3,487
Note:
1 A 1MW expansion to one of the hydropower stations was completed in 2015, bringing total installed capacity from 128MW to 129MW.
Thermal Projects – Performance
Installed Capacity Generation Availability Utilisation Operating Hours
(MW) (GWh) (%) (%) (Hours)2015 2014 2015 2014 2015 2014 2015 2014
Majority-owned
Fangchenggang 1,260 3,133 4,812 89 82 28 44 2,486 3,819
Minority-owned
Shiheng I & II 1,260 6,607 6,577 94 95 60 60 5,244 5,220
Heze II 600 3,305 3,318 94 90 63 63 5,508 5,530
Liaocheng I 1,200 6,627 6,643 96 92 63 63 5,523 5,536
Panshan 1,060 5,410 6,263 95 92 58 69 5,104 6,050
Sanhe I and II 1,300 6,489 7,183 93 95 57 63 4,991 5,525
Suizhong I and II1 3,760 14,903 14,455 94 96 46 46 4,009 4,015
Yire2 400 560 2,183 100 94 16 62 1,401 5,458
Zhungeer II and III 1,320 6,384 7,660 99 95 55 66 4,837 5,803
Shenmu 220 950 1,237 94 95 49 64 4,318 5,623
Notes:
1 Retrofit of Units I and II of Suizhong Power Station completed in 2015, which increased total installed capacity from 3,600MW to 3,760MW.2 In accordance with the notice served by the Beijing municipal government, Beijing Yire Power Station ceased operation on 20 March 2015. The closure comes
as part of the government’s efforts to combat air pollution by reducing coal-fired generation in Beijing, despite the fact that the power station complies fully with the regulatory emissions requirements.
55CLP Holdings 2015 Annual Report

CLP Volunteering
• CLP volunteers contributed over
700 hours of their free time to
help organise charity events, and
visit schools and elderly homes.
• Volunteers participated in tree
planting activities near our power
plants and nearby villages.
Engaging the Communities We Serve through Employee Volunteerism
Community Infrastucture
• Over 1,100 villagers benefited from improved
village roads and drainage sponsored by Sandu
Wind Farm in Guizhou.
• CLP sponsored daily living necessities for 300
residents in Nanning, Guangxi.
COMMUNITY VOLUNTEERING EDUCATION
Eradication of Poverty
Donated RMB70,000 to the governments
of Yunnan and Sichuan on Poverty Eradication Day.
Improving the Learning Environment
• CLP donated over 60 computers to a secondary school in Sandu, Guizhou, enabling its
1,300 students to restart their computer classes.
• We sponsored three schools in Jiangbian, Sichuan to upgrade their facilities and funded two
school libraries in Fangchenggang, benefiting about 1,200 students.
• Some 230 students from nine schools in three provinces benefited from our Support-a-
student Programme, which is supported by CLP colleagues’ donations and our company’s
one-to-one matching funds.
• Through the CLP Young Power Programme, 95 students from nine secondary schools in
Nanning, Guangxi learned more about low carbon energy and energy conservation.
Mainland China
Social PerformanceStakeholder EngagementWe place importance on creating positive relationships with
stakeholders through understanding and addressing their
expectations. As one of the largest foreign investors in the
Mainland’s power industry, we continued to maintain close
contacts with our stakeholders, including but not limited to
the Mainland Chinese Government and local authorities, to
facilitate their understanding of our business, operations and
development direction. In 2015, various meetings were held to
engage key stakeholders from the National Development and
Reform Commission, the National Energy Administration, Hong
Kong and Macao Affairs Office, State Grid Corporation, China
Southern Power Grid, CGNPC and provincial governments
of Yunnan, Shandong, Sichuan, Guizhou, Guangdong and
Guangxi. In particular, we have arranged visits to our power
stations for Guangxi Party Secretary Peng Qinghua and
Guangxi Vice-chairman Chen Gang.
56 CLP Holdings 2015 Annual Report

Community InitiativesOur community initiatives are designed to complement and
build upon measures undertaken by the local communities,
non-governmental organisations and government services.
These activities reinforce our relationships with the
communities in which our assets are located. In 2015,
focusing on our key areas of youth education and community
well-being, we launched a range of initiatives to support
underprivileged individuals in local communities, as shown on
page 56.
OutlookMainland China’s transition from an export-led, high growth
model to a low carbon economy that emphasises sustainability
and the services sector poses challenges to conventional
power generators. We expect Fangchenggang’s performance
to remain under pressure in the near term. To help boost
generation, we are exploring new sales channels such as direct
sales contracts. More importantly, our three focus regions
of Shandong, southwest China and the cross border area
neighbouring Hong Kong are still amongst the fastest growing
areas in the country. We remain confident of the long-term
demand growth in these areas.
Meanwhile, we see more opportunities in the non-carbon
and renewable fronts. CLP is focused on the development of
renewables and high-efficiency coal projects and is therefore
well-positioned to capitalise on these opportunities. We are
encouraged by the Mainland government’s green and air
quality policies that provide strong impetus to investors such as
CLP to make selective investments in the country.
We note that government subsidies on renewables will come
down over time, and there is very keen competition in securing
new renewable projects. This presents a key challenge to all
developers including CLP and we will take proactive actions. On
the other hand, technology advancement is expected to drive
down costs creating opportunities for new projects. Hence we
will focus on developing wholly- or majority-owned wind and
solar projects in the country. These include the expansion of
existing projects in Shandong, Guizhou and Yunnan, and new
opportunities that we are exploring in eastern and southwest
China. In 2016, we target to commission CLP Laizhou I Wind
(49.5MW) and Laiwu II Wind (49.5MW) and start construction of
Sandu II Wind (99MW). We also plan to expand our solar portfolio
and currently have a number of projects in the pipeline.
China’s 13th Five-Year Plan, which begins in 2016, has
reaffirmed nuclear power as a primary source for non-fossil
energy power generation in the long term. Drawing on
our expertise in nuclear energy, we will continue to explore
opportunities in the area. The electricity sector reform may
also bring potential opportunities for CLP in areas such as
distribution and retail.
China pledges in its 13th Five-Year Plan (2016–2020) to embrace a “green” development model. What impact will it have on CLP’s investment strategy in China?
Mr Zhang LeiChief Executive Officer Envision Energy Limited
Chan Siu HungManaging Director – China
More Q&As
We fully support the reform as outlined in the 13th Five-Year Plan. Mainland China is also a primary growth market where we will focus on renewable energy. As such, we will build on our past success and pursue more renewable projects in the future. Despite recent tariff cuts and growing competition, our solar projects remain robust thanks to our effective cost control and strategic selection of project regions. Besides, we will continue to explore opportunities in China’s expansion of its nuclear capacity.
57CLP Holdings 2015 Annual Report


Financial Performance
India Financial Performance at a Glance
2015 2014 Increase / (Decrease)
HK$M HK$M HK$M %
Revenue 5,104 4,821 283 5.9
Total earnings 612 270 342 126.7
Operating earnings 612 270 342 126.7
EBITDAF 1,985 1,934 51 2.6
Fixed assets 11,542 11,259 283 2.5
Total assets 16,777 16,635 142 0.9
Bank loans and other borrowings 8,835 8,656 179 2.1
Total liabilities 9,590 9,783 (193) (2.0)
Capital investments 1,396 461 935 202.8
The performance of our India business has improved with operating earnings increased from HK$270 million in 2014 to HK$612
million in 2015. The increase was mainly attributable to the reversal of provision for dividend distribution tax, the turnaround of
Jhajjar’s performance from a loss in 2014 to a profit of HK$146 million in 2015 and the progress on litigation at Jhajjar, partly offset
by an adjustment in operation and maintenance expenses of wind projects.
.
+173
+150
+90
-81
+10
612
270
0 100 200 400300 700600500
India Earnings (HK$M)
Others
2014 Earnings
2015 Earnings
Higher earnings from Jhajjar mainly due to lower interest and deferred tax expenses
Reversal of provision for dividend distribution tax
Jhajjar’s progress on litigation
Adjustment in operation and maintenance expenses of wind projects
Performance of our flagship Jhajjar coal-fired power plant
improved in 2015 with plant availability exceeding 82%. This
was due to an increase in domestic coal supply and our efforts
to strengthen operations. Shortage in domestic coal has been
a challenge for us until last year. The increase in domestic
fuel supply has also significantly reduced our dependence on
imported coal. For the current Indian fiscal year ending 31
March 2016, we expect availability to remain over the 80%
contractual target level.
We have engaged with the domestic fuel supplier and put
systems in place to resolve fuel quality issues. The Indian
Government has also introduced initiatives to ensure better
Operational PerformanceOur operations in India continued their positive momentum in
2015. Even though the demand for power declined compared
with previous years, we were able to report good performance
in both conventional and renewable energy projects, and
achieved new financial milestones. At the same time, the Indian
Government has identified the power sector as a key area for
sustainable growth, resulting in new opportunities especially
in the field of renewable energy. We are well positioned to
take advantage of these positive industry conditions and look
forward to the continuing growth of our business in India.
59CLP Holdings 2015 Annual Report

India
quality of coal. Over time, these initiatives and efforts are
expected to produce positive results.
Utilisation at the gas-fired Paguthan plant more than doubled
from around 5% in 2014 to over 11% in 2015, largely
due to CLP India winning two rounds of auctions by the
Federal Government for subsidised imported gas. The supply
commenced in June 2015 and will continue until March 2016,
translating into lower costs for our customers and higher
dispatches. To ensure a steady supply, we plan to participate in
the next round of bidding for the 2016-2017 fiscal year.
On the renewable energy front, we commissioned more
than190MW of new wind capacity in 2015 after three wind
farms (Chandgarh in Madhya Pradesh, and Bhakrani and
Tejuva in Rajasthan) became fully operational. Having resolved
land acquisition issues, construction of Yermala wind farm
(149MW) in Maharashtra has now started. Commissioning of
the first 30MW is expected by April 2016.
However, wind power generation did decline in 2015, owing
to multiple factors. First, wind speed was low and it was the
second consecutive year that India experienced a low monsoon
season. In addition, there has been power curtailment in
Tamil Nadu and Rajasthan. Load restriction constraints were
imposed on Theni wind farm in Tamil Nadu and generation of
our wind farms in Sipla, Bhakrani and Tejuva in Rajasthan was
affected due to unusual gusty winds. Their loss in generation
was, however, partly made up by the early commissioning of
Chandgarh as well as contractual protections.
Thermal Projects – Performance
Installed Capacity
(MW)Generation
(GWh)Availability
(%)Utilisation
(%)Operating Hours
(Hours)
2015 2014 2015 2014 2015 2014 2015 2014
Jhajjar 1,320.0 5,764.2 6,256.5 82.4 80.0 49.9 54.1 Unit-1
6,144.2
Unit-2
6,103.1
Unit-1
5,745.6
Unit-2
6,986.7
Paguthan 655.0 637.9 278.1 97.4 89.8 11.1 4.8 3,244.0 1,557.0
Wind Projects – Performance
Installed Capacity(MW)
Commissioned / To be Commissioned (MW)
Forecast FullCommissioning Date
Utilisation(%)
2015 2014
Andhra Lake 106.4 106.4 – 21.8 22.2
Bhakrani 102.4 102.4 – 16.6 n / a1
Chandgarh 92.0 92.0 – 20.4 n / a1
Harapanahalli 39.6 39.6 – 25.0 27.2
Jath 60.0 60.0 – 22.3 n / a1
Khandke 50.4 50.4 – 22.7 21.9
Mahidad 50.4 50.4 – 25.4 n / a1
Samana I 50.4 50.4 – 23.0 20.5
Samana II 50.4 50.4 – 25.0 22.2
Saundatti 72.0 72.0 – 20.9 21.8
Sipla 50.4 50.4 – 19.2 22.9
Tejuva 100.8 100.8 – 20.1 n / a1
Theni I 49.5 49.5 – 15.5 21.4
Theni II 49.5 49.5 – 15.0 20.7
Yermala 148.8 0.0 / 148.8 Dec 2017 – n / a1
Total 1,073.0 924.2 / 148.8
Note:1 n/a (not applicable): projects that had not been commissioned for a full year’s operation.
60 CLP Holdings 2015 Annual Report

In 2015, we achieved a new milestone in financing with the
issuance of bonds in the local market for the first time. In April,
we issued the first asset-specific corporate bond in the Indian
power sector and raised Rs.4.76 billion (HK$591 million) to
refinance debts for Jhajjar. This was followed in September
where we issued the first green bond by a power company in
South Asia and Southeast Asia, and raising Rs.6 billion (about
HK$700 million) for the development of wind projects in India.
The proceeds from these bonds will be used for funding the
capital expenditure of the renewable projects.
Environmental PerformanceAir EmissionsAir (SO2, NOx and Particulate) emissions levels for both
Jhajjar and Paguthan remained relatively low in 2015 due
to low dispatch. However, since Paguthan increased power
generation because of an improvement in fuel supply, overall
net emissions levels were higher than that of 2014. We have
previously reported particulates emissions issues at Jhajjar.
Plant operational issues have now largely been resolved,
resulting in a significant reduction in overall particulates
emissions.
Environmental Regulatory ComplianceDuring 2015, there were no fines or prosecutions arising from
environmental-related regulatory non-compliances for any of
our India assets in which we had operational control.
Social PerformanceStakeholder EngagementWhen building relationships with key stakeholders, CLP India
works to achieve mutual trust with respect and integrity. This
applies to all Government departments, elected bodies of
neighbouring villages and community programme partners.
From time to time, we engage State and Federal Government
agencies responsible for policy decisions on areas affecting our
business, and make joint representations on key issues with
leading industry associations.
Medical care is one of the four focus areas of CLP India’s community initiatives
61CLP Holdings 2015 Annual Report

COMMUNITY EDUCATION
Improving the Quality of Life for the Communities We Serve
PERSONAL DEVELOPMENT
Youth & Education
• CLP volunteers ran supplementary
evening classes for 400 children in
10 villages to reduce non-schooling
and drop-outs.
• We supported the government’s School
Enrolment Scheme.
• Through the Educational Support
Scheme, we provided financial and
mentoring support for 100 students.
• Computer literacy classes were
conducted for 50 young people and
students to enhance their employability.
• We sponsored vocational training for
tribal young people.
Women Empowerment
• An awareness session was held for 200
mothers and their daughters in Jhajjar
to encourage them to join the Indian
Government’s “Save Girl Child, Educate Girl
Child” programme.
• Over 250 village women received cloth
stitching training in Jhajjar.
Community Infrastructure
• Over 3,000 villagers in Paguthan
benefited from improved public facilities
such as children’s park and bus stands.
• CLP funded a feasibility study on solid waste
management and the water scheme in
local villages.
Health Care
• About 6,000 villagers in Bharuch District
in Paguthan benefited from the non-subvented
health care projects funded by CLP India.
• Under the Pulse Polio Programme, we provided
vaccinations for 3,000 young children.
• Our signature Mobile Health Van medical outreach
programme in Jhajjar continued to provide free
treatment and consultation for over 25,000
villagers nearby.
Promoting Sports
• CLP sponsored the Mumbai Marathon 2016
and URJA Cricket Cup 2015.
• We supported 200 mentally-challenged
children in Bharuch to participate in the district
level Olympics.
India
Community InitiativesCLP India believes in being an active participant in the social
and economic development of the communities in which we
operate. Our initiatives reflect the needs and expectations
of the local communities. In 2015, we actively participated
in a wide range of community initiatives, focusing primarily
on the areas of health care, youth education, community
infrastructure support and the empowerment of women. Some
of our notable initiatives are highlighted below:
62 CLP Holdings 2015 Annual Report

What is CLP’s vision towards youth empowerment in India? What opportunities does your company see as to how SEWA Rural can collaborate with CLP towards realisation of such a vision?
We believe in being an active participant in the social and economic development of the communities in which we operate, whilst meeting the interests of all stakeholders. To achieve this objective, one of our focus areas is education and skill training for the youth in the communities.
We believe it is important to support the youth with guidance and mentoring. Hence our employees and their spouses have volunteered to counsel young boys and girls from the communities who are keen on pursuing higher education.
We value the work done by SEWA Rural in this area and appreciate the head way you have made. We hope to continue working closely with SEWA Rural to facilitate the youth in India with the required knowledge and tools.
Mr Bankim ShethTrusteeSEWA Rural
Rajiv MishraManaging Director – India
OutlookIndia is one of our key growth markets and we see significant
opportunities in the country. The potential demand for
electricity is large as electricity consumption per capita is
significantly lower than that in the developed world. However,
state-owned distribution companies (DISCOMS) are suffering
from serious losses in their transmission and distribution
businesses. Their depressed financial status has an adverse
impact on dispatch and the healthy growth of the power
sector. It is therefore vital for DISCOMS to regain their financial
health so that the power sector can pick up momentum again.
The Federal Government has announced a new scheme to
revive the financial and operating health of DISCOMS but this
will need the support of the state governments to make a
positive impact.
Going forward, we will continue our discussion with relevant
agencies to explore the possibility of building a new coal-
fired plant after 2018 on the existing site of Paguthan
using imported coal. We are also evaluating an expansion
of the existing Harapanahalli wind farm in Karnataka. Final
investment decisions for these projects will depend upon
commercial feasibility.
Solar power generation has witnessed tremendous growth in
India with over 5,000MW of generation capacity awarded over
the last year alone. Although the low tariff for solar projects
has been a challenge, it represents a potential area for CLP to
expand into and we will continue to explore viable projects
in this field. At the same time, we will continue to assess
opportunities in electricity transmission projects should they
arise.
More Q&As
63CLP Holdings 2015 Annual Report


Financial Performance
Southeast Asia and Taiwan Financial Performance at a Glance
2015 2014 Increase / (Decrease)
HK$M HK$M HK$M %
Revenue 9 8 1 12.5
Total earnings 312 297 15 5.1
Operating earnings 312 297 15 5.1
EBITDAF 310 294 16 5.4
Total assets 1,780 1,793 (13) (0.7)
Total liabilities 3 3 – –
Capital investments / (repayment) 10 (178) 188 n / a
Operating earnings from our investments in Southeast Asia and Taiwan in 2015 increased to HK$312 million, compared with
HK$297 million in 2014. Operational performance at Ho-Ping and Lopburi solar project remained stable. Ho-Ping’s earnings
increased mainly due to lower coal prices, partly offset by lower generation and lower tariff.
2015 Earnings
Lower generation and tariff at Ho-Ping
Lower exchange rate and others
Lower coal prices at Ho-Ping
2014 Earnings
Southeast Asia and Taiwan Earnings (HK$M)
0 300200 400
312
297
+64
-14
-35
Operational PerformanceThroughout 2015, Ho-Ping in Taiwan and our Lopburi solar
project in Thailand continued to perform strongly. Significant
progress was also made in the development of our two coal-
fired projects in Vietnam – Vung Ang II and Vinh Tan III.
Buoyed by low coal prices, and notwithstanding temporary
suspension of operations due to strong typhoons in August
and September 2015, Ho-Ping recorded another year of strong
financial performance.
Ho-Ping continues to defend against an unjustified claim of
NT$5,266 million (CLP’s share: HK$249 million) by Taiwan
Power Company (Taipower) relating to alleged losses by
Taipower over tariffs prior to December 2012.
At Lopburi, reliable operation and high solar irradiance
contributed to the solar plant’s good financial results.
Work continues on the development of the Vung Ang II
and Vinh Tan III coal-fired projects in Vietnam. Contracts
for equipment supply and construction, and for the supply
and transportation of coal, are largely settled, securing key
linkages for construction and long-term importation of fuel.
Negotiations for the key concession agreement and power
purchase agreement (PPA) are in their final stages.
Meanwhile, the Vinh Tan III project received a significant
boost in November when the project company signed a
Memorandum of Understanding (MOU) with China’s leading
policy bank, China Development Bank, as part of the proposed
lending group for the prospective development of the project.
The signing of the MOU was witnessed by Xi Jinping, the
President and General Secretary of the Communist Party of
China, and Nguyen Phu Trong, the General Secretary of the
Communist Party of Vietnam.
65CLP Holdings 2015 Annual Report

Southeast Asia and Taiwan
Environmental PerformanceIn 2013, the Taipei High Administrative Court (THAC) ruled
in favour of Ho-Ping regarding a penalty of NT$442 million
(CLP’s share: HK$18 million after tax) imposed by the Hualien
County Government (HCG) for Ho-Ping’s exceedance of its coal
consumption limit in 2009 and 2010. The HCG subsequently
appealed and the THAC was instructed to re-examine the case.
In December 2015, the THAC ruled in favour of the HCG but
marginally reduced the penalty to NT$436 million (CLP’s share:
HK$18 million after tax). Ho-Ping has appealed against the
verdict.
Social PerformanceIn Thailand, Natural Energy Development Co., Ltd. (NED)
continued to support stakeholder engagement programmes
and initiatives, focusing on youth and education and
conservation of traditional culture. Its GreeNEDucation Centre
has served as an important platform in raising awareness
about renewable energy in the community. Additionally, NED
participated in the Innovation Expo to promote home solar
energy system and renewable energy knowledge.
In Taiwan, Ho-Ping’s community initiatives continued to focus
on health, environment and cultural development. Throughout
Executive Director & CFO Geert Peeters signs a Memorandum of Understanding with China Development Bank for the Vinh Tan III project in Vietnam
2015, Ho-Ping supported numerous sports events and cultural
activities, as well as a broad range of community events
including beach cleaning and blood donation. Through these
efforts, Ho-Ping successfully engaged with key stakeholders in
Hualien and Yilan counties.
OutlookLooking ahead, our strategy in Southeast Asia and Taiwan is to
focus on our existing operations in Ho-Ping and Lopburi, and
the development of Vung Ang II and Vinh Tan III.
With the support of its shareholders including CLP, Ho-Ping will
strive to maintain good operational and safety performance,
and contribute quality earnings to shareholders. Lopburi will
focus on reliable and safe operation.
We are confident that we can contribute to Vietnam’s
economic growth by supplying the country with electricity that
is reliable and competitively-priced. We are focusing on the
advancement of our negotiations to allow the Vung Ang II and
Vinh Tan III projects to proceed to a final investment decision.
In addition to managing our existing assets and development
projects, we continue to monitor opportunities in the
Southeast Asia and Taiwan markets, particularly where long-
term PPAs are still available.
66 CLP Holdings 2015 Annual Report


Australia
Financial Performance
Australia Financial Performance at a Glance
2015 2014 Increase / (Decrease)
HK$M HK$M HK$M %
Revenue 35,707 50,895 (15,188) (29.8)
Total earnings 5,117 (125) 5,242 n/a
Operating earnings 836 756 80 10.6
EBITDAF 10,318 1,231 9,087 738.2
Fixed assets 9,139 13,982 (4,843) (34.6)
Total assets 36,551 50,302 (13,751) (27.3)
Bank loans and other borrowings 964 14,619 (13,655) (93.4)
Total liabilities 8,021 24,555 (16,534) (67.3)
Capital investments 825 1,764 (939) (53.2)
EnergyAustralia’s operating earnings increased by 10.6% from HK$756 million to HK$836 million in 2015 despite a 16.9%
decrease in the Australian dollar exchange rate during the year. The rise in earnings was attributable to lower operating costs
as a result of the successful completion of migration of customers and the consequent termination of the Transition Services
Agreement, lower bad debts, staff and amortisation expenses. Finance costs also reduced resulting from lower interest rates and a
lower average loan balance. A higher contribution from retail business due to improved gross margin and favourable weather was
offset by lower commercial and industrial volumes and lower exchange rate. On the other hand, contribution from wholesale was
negatively impacted by the repeal of carbon tax and its compensation.
In December 2015, the Group completed the sale of Iona Gas Plant with proceeds of A$1,780 million (HK$9,991 million) and
recorded a gain of A$1,180 million (HK$6,619 million). The proceeds were used to prepay external debt and terminate associated
hedging derivatives leading to a total cost of HK$858 million. In addition, impairment and onerous provisions for generation assets
(HK$1,480 million) have been made in view of the oversupplied wholesale electricity market in Australia.
Australia Earnings before Items Affecting Comparability (HK$M)
2014 Operating earnings
2015 Operating earnings
Operating Earnings of Australia (HK$M)
+216
+1,063
+640
-1,839
836
756
Lower interest expense due to lower average loan balance and lower interest rate after refinancing during 2015
Lower electricity gross margin due to removal of carbon compensation and lower exchange rate, despite higher gas margin
Cessation of payments under Transition Services Agreement after termination in 2014
Lower bad debt expense, staff cost and amortisation of capitalised customer acquisition costs and others
0 400 800 1,200 1,600 2,000 2,400 2,800
Operational PerformanceIn 2015, EnergyAustralia set a solid platform enabling us to
become a leading, low-cost energy retailer and restore value to
the business.
A new executive management team with proven experience
in energy, retail and business transformation was appointed
and successfully restructured EnergyAustralia around its new
strategy. The work refreshed and sharpened the business
focus in key areas, in particular enhancing customer service,
expanding its offer of next-generation products, reducing
operational costs across the enterprise and making generation
assets more reliable and efficient.
Whilst much work remains to be done, and external retail and
wholesale energy markets remain challenging, good progress
was made in critical areas during 2015.
68 CLP Holdings 2015 Annual Report

RetailEnergyAustralia ended the year with a modest net increase in
mass market customer accounts to 2.62 million, or a market
share of 21.5% in the states in which we operate (New South
Wales (NSW), Victoria, South Australia and Queensland).
The growth was the result of enhanced brand awareness,
a focus on customer retention and new third-party sales
channels. During the year, customer complaints made to
the Ombudsman fell to a monthly average of 56 per 10,000
customers in 2015 from 298 in 2013. This represents one of
the most satisfying achievements for EnergyAustralia in 2015.
Additionally, EnergyAustralia reduced its bad debt expense
and successfully overhauled the telephony system in contact
centres. The launch of a new major marketing campaign and
improved analytical capacity allowed the business to target
offers and campaigns at specific segments of the market.
Renewed focus on customer retention reduced customer
losses, or “churn”, which remains lower than the industry
average. For example, EnergyAustralia’s churn rate in NSW
and Victoria was 14% and 20% respectively, against 16% and
24% in the broader market.
Midway through 2015 a new business function dedicated
to identifying and developing next-generation products and
services was established, whilst across the year online sales
exceeded plan.
On costs, the successful integration of all mass market
customer accounts onto a single billing platform in late
2014 continued to support refinement of EnergyAustralia’s
processes, making them simpler, more efficient and more
reliable. The integration, together with the termination of the
Transition Services Agreement with the NSW Government,
has contributed significant savings. In total, EnergyAustralia
delivered A$100 million in savings (compared with a 2013
baseline) one year ahead of the 2016 target to which
EnergyAustralia had committed.
In the fourth quarter of 2015, EnergyAustralia announced
the difficult decision to close a call centre and relocate
some services to the Philippines. The closure, scheduled for
September 2016, will give EnergyAustralia additional flexibility
to scale its operations, increase options for extending contact
hours and reduce exposure to expensive Australian capital city
real estate.
WholesaleDuring the year, EnergyAustralia improved the efficiency of
key assets. Yallourn Power Station in Victoria completed a five-
year maintenance programme on time and on budget. The
latest component of the work delivered a 2.7% improvement
in generation efficiency at the plant’s second generating unit.
Overall the programme will allow Yallourn to produce power
for 100,000 extra homes from the same amount of coal.
Elsewhere in the generation portfolio, Mount Piper Power
Station in NSW operated at reduced output due to uncertainty
about coal supply. The outlook became clearer in October
when the Springvale mine, the main source of supply for
Mount Piper, received development approval from the relevant
authorities.
In November 2015, EnergyAustralia complemented its
operational improvements with the sale of the Iona Gas
Plant in Victoria for A$1,780 million (HK$9,991 million). The
transaction sets a solid financial foundation for the business,
freeing funds for new projects, service enhancements and
repaying loans extended by CLP Group and third-party debts.
In addition to generating capital from the sale, EnergyAustralia
entered into an agreement through which it has secured long-
term access to gas storage services at the plant at competitive
prices.
Externally, electricity market conditions improved but remain
challenging. The trend since 2010 of declining demand in the
National Electricity Market (NEM) abated in 2015. Overall,
demand increased by 1.0% compared with 2014, mainly due
to the electricity needs of three large liquefied natural gas
projects in Queensland. In contrast, demand in Victoria and
South Australia was lower in 2015 compared to the year before
whilst in NSW it was broadly the same.
Whilst demand was lower in aggregate across the southern
states of Australia, there was greater volatility. State capitals
Sydney and Melbourne experienced their hottest weather in
the July-to-December period of the last 20 years, whilst for
Adelaide it was the second-warmest second half in the past
two decades. These factors, together with concerns about the
El Nino weather pattern and lower hydroelectric generation,
led to higher average electricity spot prices across the southern
states compared with 2014.
Despite signs of short-term improvement, the wholesale
electricity market remains significantly oversupplied with prices
well below the level required to provide adequate long-term
returns on generation investments. That has been reflected
in announcements of plans to shut down power stations,
particularly in southern states, following EnergyAustralia’s
closure of Wallerawang Power Station in NSW.
Detailed analysis of the economic prospects of
EnergyAustralia’s generation assets indicates a return to more
sustainable wholesale prices will take longer than previously
anticipated, resulting in a decision to impair and make
provisions for some of those assets totalling A$261 million
(HK$1,480 million).
69CLP Holdings 2015 Annual Report

Australia
neither a licence exceedance nor non-compliance case, and no
penalty was imposed.
Yallourn
EnergyAustralia was fined A$7,584 by the Environment
Protection Authority Victoria for the Yallourn Power Station
breaching the Environment Protection Act 1970. The incident
in February 2015 involved a discharge of ash slurry into the
Morwell River. Around 8,600 kilolitres of salt water entered
into the river after a welded point joint failed, causing the
pipeline to rupture. The spill was diluted by river flows,
minimising its impact on the environment. To prevent
repeat incidents, EnergyAustralia has introduced process
improvements including upgrades to alarms to automatically
shut down ash line pumps and alert site staff to ruptures,
installing CCTV cameras in high-risk areas and requiring
hydraulic testing of new pipework prior to commissioning.
Tallawarra
Dead fish were found near a water inlet. Water samples showed
that dissolved oxygen content in the water was below the
statutory limit. Tallawarra Power Station has developed and
implemented a plan to minimise the risk of any impact as a result
of activating the Main Cooling Water and Attemperation pumps.
Mount Piper
At Mount Piper, cooling water was discharged into Neubecks
Creek in November 2015 when a drain valve was left open on a
cooling water conduit that was being refilled during an outage.
Approximately 250 to 750 kilolitres of water flowed down a
To support the development of renewable energy projects
and secure a supply of large-scale generation certificates
to meet the requirements of the federal government’s
Renewable Energy Target scheme, EnergyAustralia has signed
four PPAs with new wind farm developments. Under these
PPAs, EnergyAustralia buys output from the Mortons Lane,
Taralga, Boco Rock and Gullen Range wind farms. These four
wind farms have all been commissioned and have started
commercial operations, with Taralga the most recent to come
online, in June 2015.
Environmental PerformanceAir EmissionsThe air emissions levels of our Australian fossil fuel power
stations were at intensity levels similar to that in previous
years, but the net amount was affected by specific situations
at individual power plants. Mount Piper was affected by
coal supply issues and had therefore been operating at low
dispatch, resulting in lower overall net emissions.
Environmental Regulatory ComplianceAs at 31 December 2015, there was one environmental non-
compliance case resulting in fines at Yallourn Power Station
and a penalty infringement notice. There was also one case of
licence limit exceedance at Tallawarra Power Station.
We also report below an environmental incident at Mount
Piper Power Station which the local authority requested a
formal incident report. However, the incident constituted
CEO Richard Lancaster (second right) and Independent Non-executive Director of EnergyAustralia Christine O’Reilly (second left) visit Mount Piper Power Station in New South Wales
70 CLP Holdings 2015 Annual Report

Thermal Projects – Performance
Installed Capacity Generation Availability1 Utilisation1 Operating Hours2
(MW) (GWh) (%) (%) (Hours)2015 2014 2015 2014 2015 2014 2015 2014
Hallett 203 31 30 87 93 2 2 3,135 2,925
Tallawarra 420 2,539 2,480 91 82 69 67 7,662 6,193
Yallourn 1,480 11,172 10,697 85 83 86 83 30,335 29,944
Mount Piper 1,400 5,523 8,270 87 89 45 67 12,275 15,521
Wilga Park3 16 – – – – – – – –
Ecogen 966 240 311 83 68 3 4 981 1,052
Notes:
1 In this table and elsewhere, “availability” is the extent to which a generating unit is made available by its operator for generation to the grid system, whereas “utilisation” is the extent to which the unit actually generates as compared to its rated capacity applied over the period in question. Since historical rated capacity is used in the calculation and may not reflect recent increases in generation efficiencies, it is possible to achieve utilisation greater than 100%.
2 Reflects the total hours in operation by all units at the station in the year.3 Wilga Park is not used for commercial purposes by EnergyAustralia. It is used to burn waste gas from the Narrabri coal seam gas exploration project (of which
EnergyAustralia has a 20% equity stake) which is in negligible quantities.
storm water drain, and into Neubecks Creek. An assessment
found there was no material harm to the environment. We
have advised the Environment Protection Authority and will
submit a formal incident report.
Social PerformanceStakeholder EngagementEnergyAustralia recognises the importance of engaging
with external stakeholders so that it is transparent in how
it conducts its business and is able to identify issues of
importance to stakeholders for consideration in business
planning. EnergyAustralia stakeholders include customers,
employees, governments, regulators, local communities,
non-government organisations, consumer advocacy groups,
suppliers, the media and business partners.
Engagement in 2015 included community liaison group
meetings and site visits, tendering submissions on government
policy reviews, presentations as keynote speakers at industry
Generating Capacity under Contract to EnergyAustralia
Installed Capacity
(MW)
Net Generation(at node)
(GWh)2015 2014
Boco Rock 113 298 21
Gullen Range 166 428 –
Mortons Lane 20 63 62
Taralga 107 143 –
Waterloo 111 269 304
Wind Projects – Performance
Installed Capacity
(MW)
Generation atFarm Gate
(GWh)Availability
(%)Utilisation
(%)2015 2014 2015 2014 2015 2014
Cathedral Rocks 66 171 180 89 92 30 31
71CLP Holdings 2015 Annual Report

Goals to End Hunger Campaign
EnergyAustralia donated A$25,000 in a joint campaign
with Port Adelaide Football Club and Foodbank South
Australia to provide 58,950 meals for the needy.
Youth & Education
EnergyAustralia sponsored
A$65,000 to
support 23 indigenous
students to complete their
schooling.
Arts & Culture
In addition to photography
award, EnergyAustralia also
sponsored dancing events,
which attracted young
performers from across
the wider Gippsland and
Latrobe Valley area.
Creating Shared Value for the Communities We Serve
Partnership with Swim Australia
As part of EnergyAustralia’s continuing partnership
with Swim Australia to promote swimming safety,
the SwimSAFER Week provided the public with
valuable information on safety skills in and around
water through more than 400 swimming schools.
COMMUNITY EDUCATION ARTS & CULTURE
Waterloo Wind Farm Community Fund
Through the Waterloo Wind Farm Community Fund,
four organisations received A$20,000 in
sponsorship to support local conservation, community
groups, school programmes and improvement to
local amenities.
Australia
forums and active participation in policy committees of relevant
industry associations.
In July 2015, EnergyAustralia conducted research to
better understand stakeholder expectations of its role and
responsibilities in supporting customers struggling to pay
energy bills. This involved surveying customers in addition
to a variety of stakeholders such as regulators, government
agencies, customer advocacy support services and social
services providers. Through this work stakeholders were able to
appreciate changes EnergyAustralia is making to better support
customers. The exercise enabled EnergyAustralia to identify
areas for improvement in its hardship programme. This will be
a priority area for stakeholder engagement during 2016.
Community InitiativesEnergyAustralia works closely with the local communities in
which it operates with the aim of building a reputation as a
trusted local operator. Consistent with this approach, in 2015
EnergyAustralia formed a dedicated Social Enterprise team. The
team focuses on community engagement, arts & culture, local
community infrastructure enhancement works and sporting
sponsorships. Some of the highlights of our works in 2015 are
listed below:
72 CLP Holdings 2015 Annual Report

The Aboriginal AFL Academy, supported by EnergyAustralia through its sponsorship of the Port Adelaide Football Club, focuses on educational success for its Aboriginal students whilst teaching them football and leadership skills. How does this align with EnergyAustralia’s values?
Our involvement reflects the importance EnergyAustralia places on a fair and inclusive society, including for indigenous Australians. EnergyAustralia is developing a Reconciliation Action Plan which sets out actions we will take to improve indigenous engagement and participation in our business.
At EnergyAustralia, we are all about leading change, just as the Aboriginal AFL Academy, which is the first of its type in the Australian Football League. Another example is that both EnergyAustralia and the Academy share a common value of treating people equally, and with fairness and respect.
Mr Keith ThomasChief Executive Officer Port Adelaide Football Club
Catherine TannaManaging Director – EnergyAustralia
More Q&As
OutlookAt the 21st Conference of the Parties (COP21) to the United
Nations Framework Convention on Climate Change, the
Australian Government committed to reduce Australia’s
emissions to between 26 and 28 per cent on 2005 levels by
2030. The Australian Government’s policy of “Direct Action”
– funding projects to reduce emissions – remains its primary
mechanism to meet the target, with a review of Australia’s
emission reduction policies flagged for 2017-18.
EnergyAustralia is well placed to contribute to Australia’s
emission reduction goals. Since 2008 the business has
reduced the emissions intensity of its generation portfolio by
more than 20%. Additionally, EnergyAustralia is pursuing a
range of initiatives to further reduce emissions. These include
maximising the efficiency of its generating assets and investing
in renewable energy. Government policies will play a key role
in driving innovation and lowering emissions from Australia’s
electricity sector and EnergyAustralia remains committed to
working with authorities and other stakeholders to achieve
these goals.
We anticipate wholesale market conditions will remain
challenging. EnergyAustralia maintains that industry-led and
government-supported action is needed to resolve market
over-supply issues and to make a step change in the aggregate
emissions across the NEM.
At the same time, EnergyAustralia is managing its emissions
by improving the efficiency of its power stations so that
they produce more energy from the same amount of fuel.
Additionally, EnergyAustralia invests in and supports the
development of large-scale renewables (underpinning
A$1 billion of investment in wind projects to date), and assists
its customers to manage their energy use according to their
budgets.
EnergyAustralia intends to build on the progress it made in
2015 by continuing to focus on its transformation, in particular
measures which enhance customer service, improve efficiency
and reduce costs.
73CLP Holdings 2015 Annual Report