performance and capability of a road departure crash warning system bruce wilson, ph.d. and jonathan...
TRANSCRIPT

Performance and Performance and Capability of a Road Capability of a Road
Departure Crash Warning Departure Crash Warning SystemSystem
Bruce Wilson, Ph.D. and Jonathan Koopmann
Advanced Vehicle Safety Technology Division
Volpe National Transportation Systems Center
Cambridge, MA

2RDCW Performance and Capability, Bruce Wilson and Jonathan Koopmann
The Problem
• 1,200,000 annual Road-Departure Crashes in US = 3,300 per day = 137 per hour
• Severe collisions - collide with fixed objects or rollover
• 19 percent of collisions, 43 percent of fatalitiesStep Towards Solution
• Field Operational Test (FOT) of a Road Departure Crash Warning System (RDCW)
• Subjects - 78 Participants– Male, female– Younger (20-30), Middle-aged (40-50), Older (60-70)

3RDCW Performance and Capability, Bruce Wilson and Jonathan Koopmann
Road Departure Crash Warning System (Device)
• Two subsystems– Lateral-Drift Warning (LDW)– Curve-Speed Warning (CSW)
• LDW monitors:– lane position, lateral speed– Available Maneuvering Room (AMR)– alerts when vehicle likely to depart lane or road
• CSW monitors:– speed, upcoming curvature– alerts when vehicle approaching upcoming curve too fast

4RDCW Performance and Capability, Bruce Wilson and Jonathan Koopmann
Project Participants

5RDCW Performance and Capability, Bruce Wilson and Jonathan Koopmann
Data Sources and Analyses
Objective System Characterization Test FOT Objective Data FOT Subjective Data
Availability and Accuracy
Analysis of system availability for lighting and road conditions
Analysis of lighting and road availability
Comparison between RDCW and independent measurement system
LDW Alert Logic
Imminent alert TTC analysis for various lateral drift scenarios
Timing of auditory and haptic warnings
Alert need analysis for different lateral drift conditions
True and false positive rates by conditions
Necessity of warnings, adverse weather performance
CSW Alert Logic
Imminent alert TTC analysis for various curve approach scenarios
Timing of auditory and haptic warnings
Alert need analysis under different curvature conditions
Necessity of warnings, adverse weather performance
DVI
Distinguish information in all lighting conditions, hear warnings while driving, recognize warning direction; discern seat vibration and direction

6RDCW Performance and Capability, Bruce Wilson and Jonathan Koopmann
RDCW Characterization: Method
• Independent Measurement System (NIST-developed, “ground truth”)
• 1,300 km of public road driving• Series of maneuvers• Analyzed:
– Availability– Measurement accuracy– Alert timing– False positives, false negatives– Survey responses
7RDCW Performance and Capability, Bruce Wilson and Jonathan Koopmann
System Availability and Accuracy
• Availability – RDCW able to issue an alert• Accuracy – how accurately RDCW
estimates lateral speed, road edge, lane markings, solid objects
• “Ground truth” – independent measurement system (IMS) provided second set of reference measurements

8RDCW Performance and Capability, Bruce Wilson and Jonathan Koopmann
FOT LDW Availability by Road Type
Road Type Left only Right only Left and Right
None
UnknownVDT (km) 100 100 800 800
Row Percent 5% 3% 47% 45%
Freeway VDT (km) 1,300 1,500 43,400 10,600
Row Percent 2% 3% 76% 19%
Non-Freeway VDT (km) 4,700 3,600 22,900 32,400
Row Percent 7% 6% 36% 51%Average Row Percent 5% 4% 55% 36%

9RDCW Performance and Capability, Bruce Wilson and Jonathan Koopmann
FOT LDW Availability by Lighting and Atmosphere
Lighting Left only Right only Left and Right
None
Day, dry VDT (km) 4,300 4,200 50,700 32,100
Row Percent 5% 5% 56% 35%
Day, wetVDT (km) 200 300 2,500 2,500
Row Percent 4% 5% 46% 46%
Dark, dryVDT (km) 1,400 700 13,800 7,700
Row Percent 6% 3% 58% 32%
Dark, wetVDT (km) 0 0 100 1,600
Row Percent 1% 0% 4% 95%Average Row Percent 5% 4% 55% 36%

10RDCW Performance and Capability, Bruce Wilson and Jonathan Koopmann
FOT CSW Availability by Road Type
Road Type Available Unavailable
UnknownVDT (km) 1,600 400
Row Percent 79% 21%
FreewayVDT (km) 56,300 800
Row Percent 99% 1%
Non-FreewayVDT (km) 64,400 4,100
Row Percent 94% 6%
Average Row Percent 96% 4%

11RDCW Performance and Capability, Bruce Wilson and Jonathan Koopmann
Test Measurement Overview
• Characterization test data collected on public roads
• RDCW sensors supplemented with NIST-developed Independent Measurement System (IMS)– four cameras, differential GPS
• Key performance measures– Available maneuvering room, Time to collision– LDW alert need and timing, Time to curvature point of
interest– Required deceleration, CSW alert timing and need

12RDCW Performance and Capability, Bruce Wilson and Jonathan Koopmann
AMR and TTC Comparison
-2.1
0.0
1.4
-2.5
-2
-1.5
-1
-0.5
0
0.5
1
1.5
2
2.5
< 1 1 to 2 >2
Actual AMR (meters)
Act
ual
TT
C -
LD
W T
TC
(se
con
ds)
-0.7
0.3
1.3
-1.5
-1
-0.5
0
0.5
1
1.5
< 1 1 to 2 > 2
Actual AMR (meters)
Act
ual
AM
R -
Est
imat
ed A
MR
(m
eter
s)

13RDCW Performance and Capability, Bruce Wilson and Jonathan Koopmann
Lateral Drift Alerts
• For shoulders less than 1 meter wide, the RDCW overestimated the width by 0.7 meters
• For shoulders more than 2 meters wide, the RDCW underestimated the width by 1.3 meters
• RDCW shoulder-width estimation errors contributed to:– 1 in 8 false-negative alerts (alert needed but not issued)– 1 in 3 false-positive alerts (alert issued but not needed)
• The RDCW had the highest percentage of true-positive alerts when the shoulder was 1 to 2 meters wide
14RDCW Performance and Capability, Bruce Wilson and Jonathan Koopmann
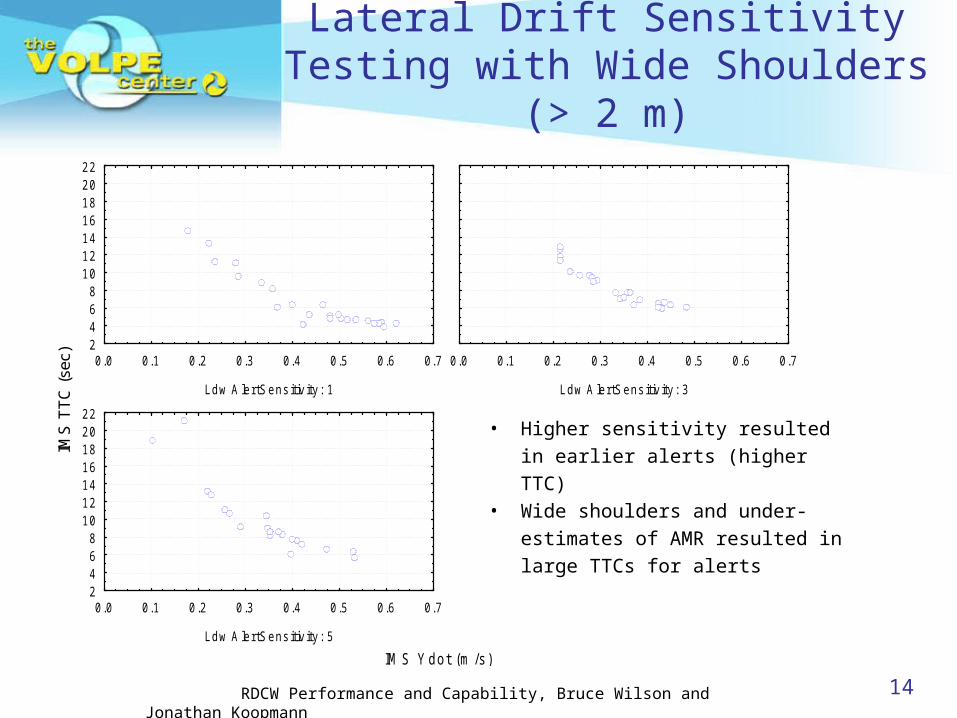
Lateral Drift Sensitivity Testing with Wide Shoulders (> 2 m)
Inc lude c ondit ion: v1= 423 A ND v4= '2.4.c ' A ND v20= 'default '
IM S Y dot (m /s )
IMS
TT
C (
sec)
Ldw A lertSens itiv ity : 1
0.0 0.1 0.2 0.3 0.4 0.5 0.6 0.72468
10121416182022
Ldw A lertSens itiv ity : 3
0.0 0.1 0.2 0.3 0.4 0.5 0.6 0.7
Ldw A lertSens itiv ity : 5
0.0 0.1 0.2 0.3 0.4 0.5 0.6 0.72468
10121416182022
• Higher sensitivity resulted in earlier alerts (higher TTC)
• Wide shoulders and under-estimates of AMR resulted in large TTCs for alerts

15RDCW Performance and Capability, Bruce Wilson and Jonathan Koopmann
LDW Alert Issuance and Validity
78%91%
22%9%
0%
10%
20%
30%
40%
50%
60%
70%
80%
90%
100%
Left Right
Alert Direction
Not Issued
Issued
78%
47%
22%
53%
0%
10%
20%
30%
40%
50%
60%
70%
80%
90%
100%
Left Right
Alert Direction
False Positive
True Positive
Alert needed Alert issued

16RDCW Performance and Capability, Bruce Wilson and Jonathan Koopmann
TTC by Shoulder Width for Solid Lane Boundary
31%
1%13%
63%
15%
6%
23%
84%43%
19%
0%
10%
20%
30%
40%
50%
60%
70%
80%
90%
100%
Narrow (< 1 m.) Medium (1 to 2 m.) Wide (> 2 m.)
Shoulder Width
TTC >= 5.0
1.5 <= TTC < 5.0
0 <= TTC < 1.5
TTC < 0

17RDCW Performance and Capability, Bruce Wilson and Jonathan Koopmann
TTC when Crossing Dashed Boundary, datum 1 m outside
boundary
57%68%
38%29%
5% 3%
0%
10%
20%
30%
40%
50%
60%
70%
80%
90%
100%
Left Right
Alert Direction
TTC >= 5.0
1.5 <= TTC < 5.0
0 <= TTC < 1.5
Alert typically issued 0.4 m after crossing dashed boundary

18RDCW Performance and Capability, Bruce Wilson and Jonathan Koopmann
TTC when Drifting Toward Jersey Barrier or Traffic Barrel
Occasional incorrect radar readings caused inconsistent alert timing
37%
63%
40%
60%
0%
10%
20%
30%
40%
50%
60%
70%
80%
90%
100%
Left RightAlert Direction
TTC >= 5.0
1.5 <= TTC < 5.0
0 <= TTC < 1.5

19RDCW Performance and Capability, Bruce Wilson and Jonathan Koopmann
LDW Video Analysis and Survey Responses
• 3,800 alerts analyzed using video and numerical data
• 62 percent were true positive• In dry weather 70 percent of the alerts were true
positive; decreasing to 39 percent in rainy weather
• On wet surfaces 44 percent of the alerts were true positive
• On a scale of 1 to 7, participants rated the LDW alert timing favorably – above 5

20RDCW Performance and Capability, Bruce Wilson and Jonathan Koopmann
LDW Alert Classification by Maneuver (without lane
changes)
Maneuver False Pos True Pos Row Totals
Count Going Straight 699 999 1698
Row Percent 41.17% 58.83%
Count On Curve 376 1154 1530
Row Percent 24.58% 75.42%Count Passing 42 34 76
Row Percent 55.26% 44.74%
Count Merging 22 21 43
Row Percent 51.16% 48.84%
Count Entering Ramp 22 14 36
Row Percent 61.11% 38.89%
Count All Groups 1162 2222 3384
Total Percent 34.34% 65.66%

21RDCW Performance and Capability, Bruce Wilson and Jonathan Koopmann
LDW Alert Classification by Atmosphere and Road Surface
Atmosphere False Pos True Pos
Rain 256 165
Column % 22.40% 7.50%
Row % 60.81% 39.19%
Dry 887 2036
Column % 77.60% 92.50%
Row % 30.35% 69.65%
Totals 1143 2201
Total % 34.18% 65.82%
Surface Moisture
False Pos True Pos
Other 356 283
Column % 30.64% 12.74%
Row % 55.71% 44.29%
Dry 806 1939
Column % 69.36% 87.26%
Row % 29.36% 70.64%
Totals 1162 2222
Total % 34.34% 65.66%
Rain and wet roads caused disproportionate number of false alerts

22RDCW Performance and Capability, Bruce Wilson and Jonathan Koopmann
LDW Alert Classification by Pavement Marking
Pavement Marking
False Pos True Pos Row Totals
Atypical 174 72 246
Column % 14.97% 3.24%
Row % 70.73% 29.27%
Typical 988 2150 3138
Column % 85.03% 96.76%
Row % 31.49% 68.51%Totals 1162 2222 3384
Total % 34.34% 65.66% 100.00%
Atypical pavement markings, e.g., lane merge, caused disproportionate number of false alerts
23RDCW Performance and Capability, Bruce Wilson and Jonathan Koopmann
Survey Responses to LDW Alert Timing
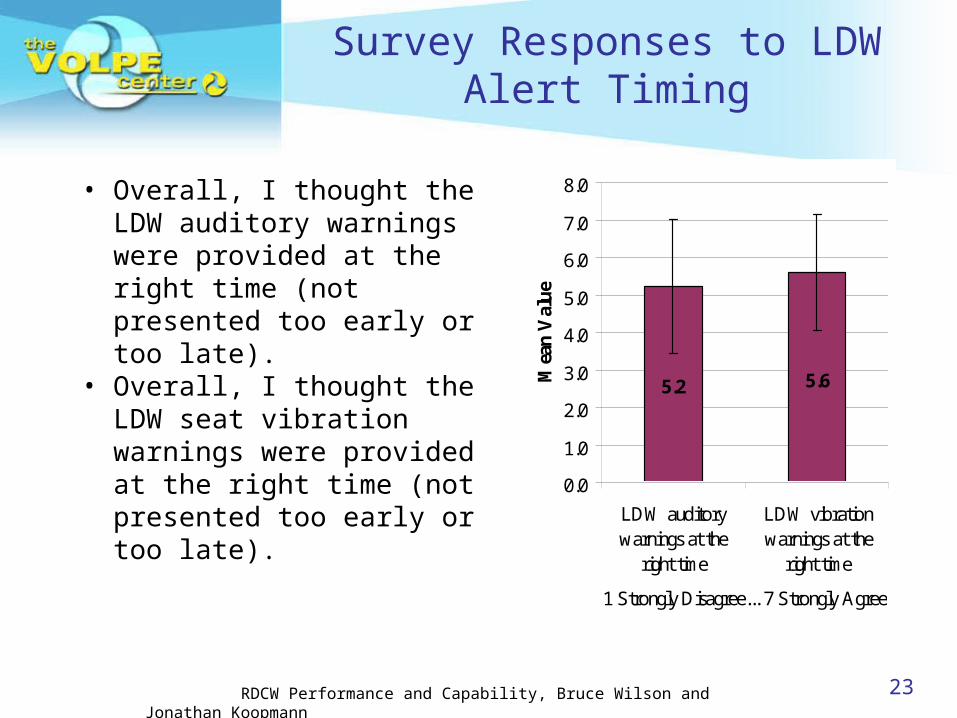
• Overall, I thought the LDW auditory warnings were provided at the right time (not presented too early or too late).
• Overall, I thought the LDW seat vibration warnings were provided at the right time (not presented too early or too late).
5.2 5.6
0.0
1.0
2.0
3.0
4.0
5.0
6.0
7.0
8.0
LDW auditorywarnings at the
right time
LDW vibrationwarnings at the
right time
1 Strongly Disagree... 7 Strongly Agree
Mea
n V
alu
e
24RDCW Performance and Capability, Bruce Wilson and Jonathan Koopmann
Survey Responses to LDW Alert Need
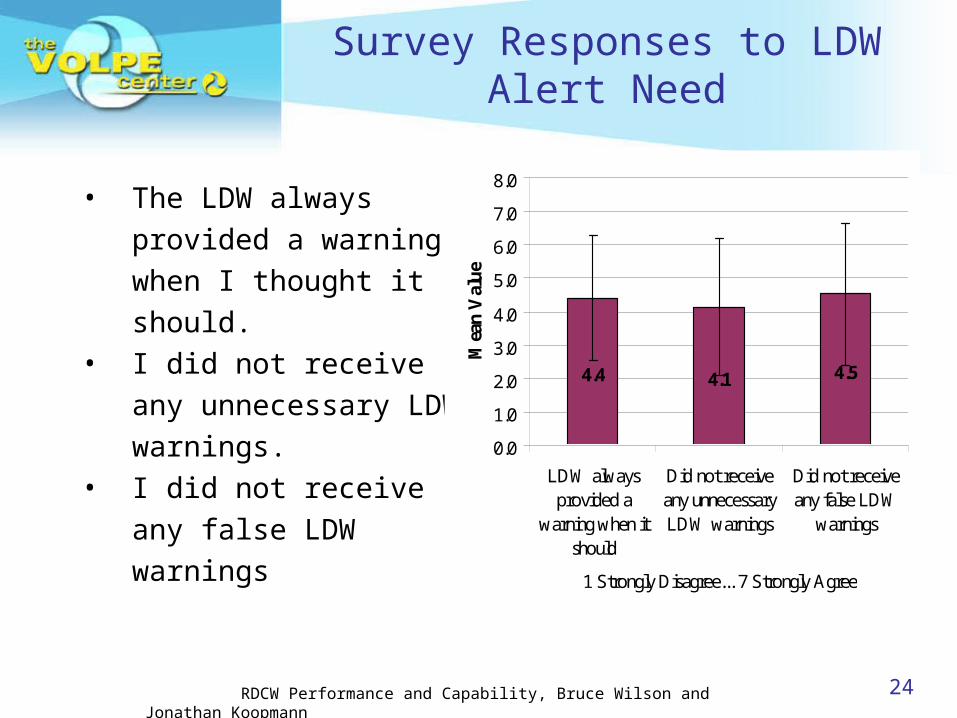
• The LDW always provided a warning when I thought it should.
• I did not receive any unnecessary LDW warnings.
• I did not receive any false LDW warnings
4.4 4.1 4.5
0.0
1.0
2.0
3.0
4.0
5.0
6.0
7.0
8.0
LDW alwaysprovided a
warning when itshould
Did not receiveany unnecessaryLDW warnings
Did not receiveany false LDW
warnings
1 Strongly Disagree... 7 Strongly Agree
Mea
n V
alu
e

25RDCW Performance and Capability, Bruce Wilson and Jonathan Koopmann
Curve Speed Alerts
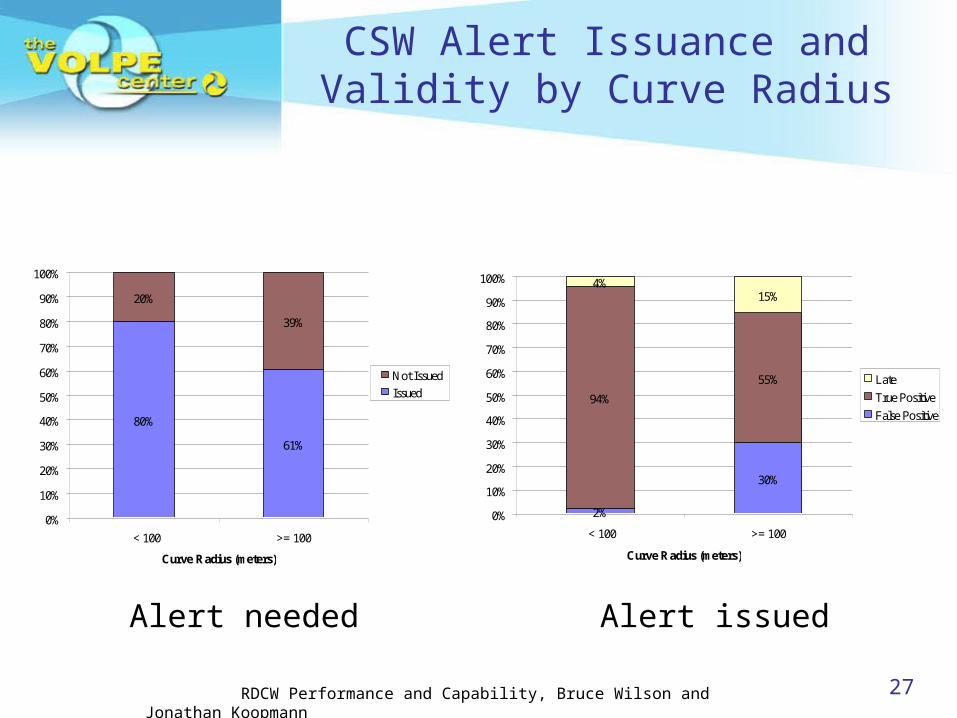
• 1 of 5 alerts missed for curves with a radius less than 100 meters
• 2 of 5 alerts missed for curves with a radius greater than 100 meters
• Of the alerts issued on curves whose radius was less than 100 meters, 94 percent were on time, neither too early nor too late
• On a scale of 1 to 7, participants rated the CSW alert timing favorably; at 5

26RDCW Performance and Capability, Bruce Wilson and Jonathan Koopmann
Alert Timing by Sensitivity SettingC s w Se n s itivity*Se n s itivity Te s t (Sp e e d ); L S Me a n s
C u rre n t e ffe ct: F(2 , 7 7 )=.3 4 0 6 9 , p =.7 1 2 3 5
Ve rtica l b a rs d e n o te 0 .9 5 co n fid e n ce in te rva ls
H ig h s p e e d L o w s p e e d
1 3 5
C s w Se n s itivity
6 .0
6 .5
7 .0
7 .5
8 .0
8 .5
9 .0
9 .5
Est
. Tim
e fr
om
CP
OI (
sec)
C SW tim e fro m C POI in cre a s e s w ith s p e e d
C SW tim e fro m C POI in cre a s e s fro m lo w to m id d le s e ttin g
Higher speeds and higher sensitivity settings resulted in earlier alerts
27RDCW Performance and Capability, Bruce Wilson and Jonathan Koopmann
CSW Alert Issuance and Validity by Curve Radius
80%
61%
20%
39%
0%
10%
20%
30%
40%
50%
60%
70%
80%
90%
100%
< 100 >= 100
Curve Radius (meters)
Not Issued
Issued
2%
30%
94%
55%
4%15%
0%
10%
20%
30%
40%
50%
60%
70%
80%
90%
100%
< 100 >= 100
Curve Radius (meters)
Late
True Positive
False Positive
Alert needed Alert issued

28RDCW Performance and Capability, Bruce Wilson and Jonathan Koopmann
Alert Issuance near Exit Ramps
73%
9%
27%
91%
0%
10%
20%
30%
40%
50%
60%
70%
80%
90%
100%
Turn Signal On Turn Signal Off
Turn Signal Status
No Alert
Alert
• Turn signal resulted in most likely path (MLP) switching to exit ramp
• With turn signal, ¾ ramp passes had alert
• Without signal, 10/11 ramp passes did not have alert

29RDCW Performance and Capability, Bruce Wilson and Jonathan Koopmann
Survey Responses to CSW Alert Timing
• Overall, I thought the CSW auditory warnings were provided at the right time (not too early or too late).
• Overall, I thought the CSW seat vibration warnings were provided at the right time (not too early or too late).
4.9 5.1
0.0
1.0
2.0
3.0
4.0
5.0
6.0
7.0
8.0
CSW auditorywarnings at the
right time
CSW vibrationwarnings at the
right time
1 Strongly Disagree... 7 Strongly Agree
Mea
n V
alu
e

30RDCW Performance and Capability, Bruce Wilson and Jonathan Koopmann
RDCW Characterization: Survey Responses, Timing
4.5
4.4
5.2
3.7
4.5
4.9
0.0 1.0 2.0 3.0 4.0 5.0 6.0 7.0
Auditory warningsat the right time
Always provided awarning when it
should
Did not receive anyfalse warnings
Mean Value (1 Strongly Disagree... 7 Strongly Agree)
LDW
CSW
LDW ratings slightly higher than CSW

31RDCW Performance and Capability, Bruce Wilson and Jonathan Koopmann
DVI Readability
6.3 6.4 6.5 6.2 6.45.5 5.3
0.0
1.0
2.0
3.0
4.0
5.0
6.0
7.0
8.0
RDCWgraphicsright size
LDWgraphicsright size
CSWgraphicsright size
Easy to seeLDW
graphics
Easy to seeCSW
graphics
Easy todistinguish
LDWwarningdirection
Easy todistinguish
CSWwarnings
1 Strongly Disagree... 7 Strongly Agree
Mea
n V
alu
e
Participants approved of DVI visual elements, graphics, and performance

32RDCW Performance and Capability, Bruce Wilson and Jonathan Koopmann
Warning Audibility
Alert volume and directionality convey warning information to drivers
6.6 6.7
5.26.1
0.0
1.0
2.0
3.0
4.0
5.0
6.0
7.0
8.0
Ease of hearingLDW warnings
while driving
Ease of hearingCSW warnings
while driving
Easy to recognizedirection of LDWauditory warning
Easy to recognizedirection of CSWauditory warning
1 Strongly Disagree... 7 Strongly Agree
Mea
n V
alu
e

33RDCW Performance and Capability, Bruce Wilson and Jonathan Koopmann
Summary of LDW FOT Performance
• 1 of 3 alerts issued was a false positive, AMR frequently underestimated
• Odds of nighttime alert being a false positive are 1.8 odds for daytime alert
• Odds of rain alert being a false positive are 3.6 odds for driving under dry conditions
• Half the alerts issued in construction zones were false positive
• Despite this – participants rated LDW quite favorably

34RDCW Performance and Capability, Bruce Wilson and Jonathan Koopmann
Summary of CSW Characterization Test
Performance
• Inaccurate estimates of the distance to the curve, the curve radius, or both compromised performance
• For typical curves, system failed to alert in 1 of 4 cases of excessive speed
• Map errors created some false curves and false alerts
• System performed well near ramps

35RDCW Performance and Capability, Bruce Wilson and Jonathan Koopmann
Summary of Survey Data
• High ratings for: LDW and CSW alert timing, LDW and CSW missed alerts, LDW false positive performance
• Lower ratings for CSW false positive performance• Participants recognized LDW limitations under poor
lighting, rain, and wet roads• 7 of 8 participants found it easy to interpret seat
vibration alerts• 4 of 5 found LDW audible alerts easy to interpret• 6 of 7 found visual alerts easy to interpret
36RDCW Performance and Capability, Bruce Wilson and Jonathan Koopmann
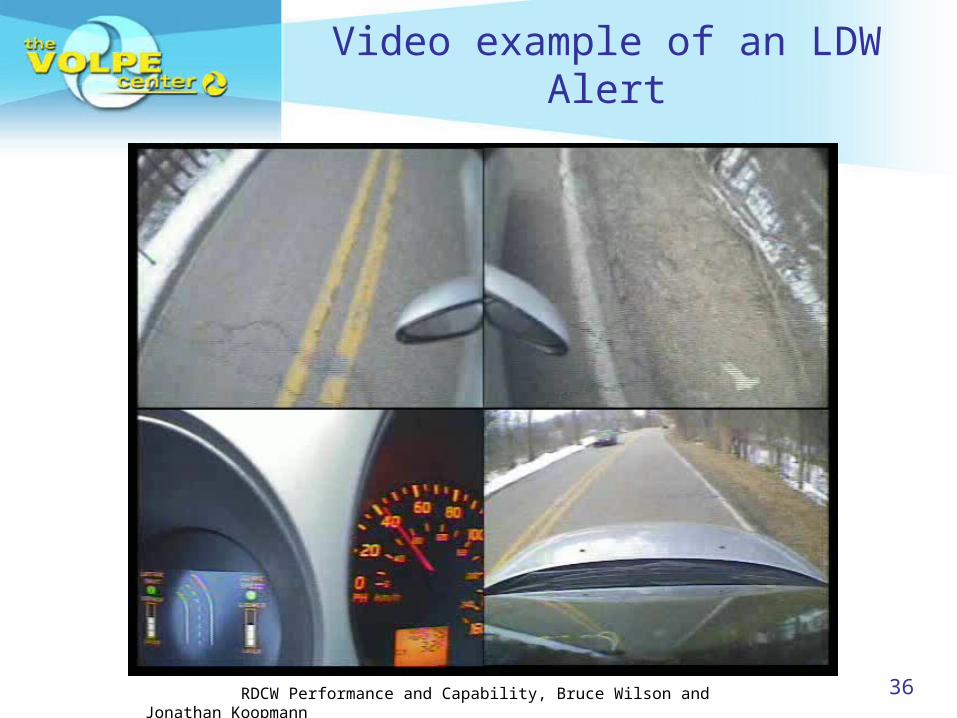
Video example of an LDW Alert