performance and progress report—executive...
TRANSCRIPT
30 January 2016 1
UNH/NOAA Joint Hydrographic CenterPerformance and Progress Report—Executive Summary
NOAA Ref No: NA10NOS4000073 Principal Investigator: Larry A. Mayer
Project Title: Joint Hydrographic CenterReport Period: 01/01/2015 – 12/31/2015
2015
JHC Performance Report2
Executive Summary Executive Summary
30 January 2016
Executive Summary Executive Summary
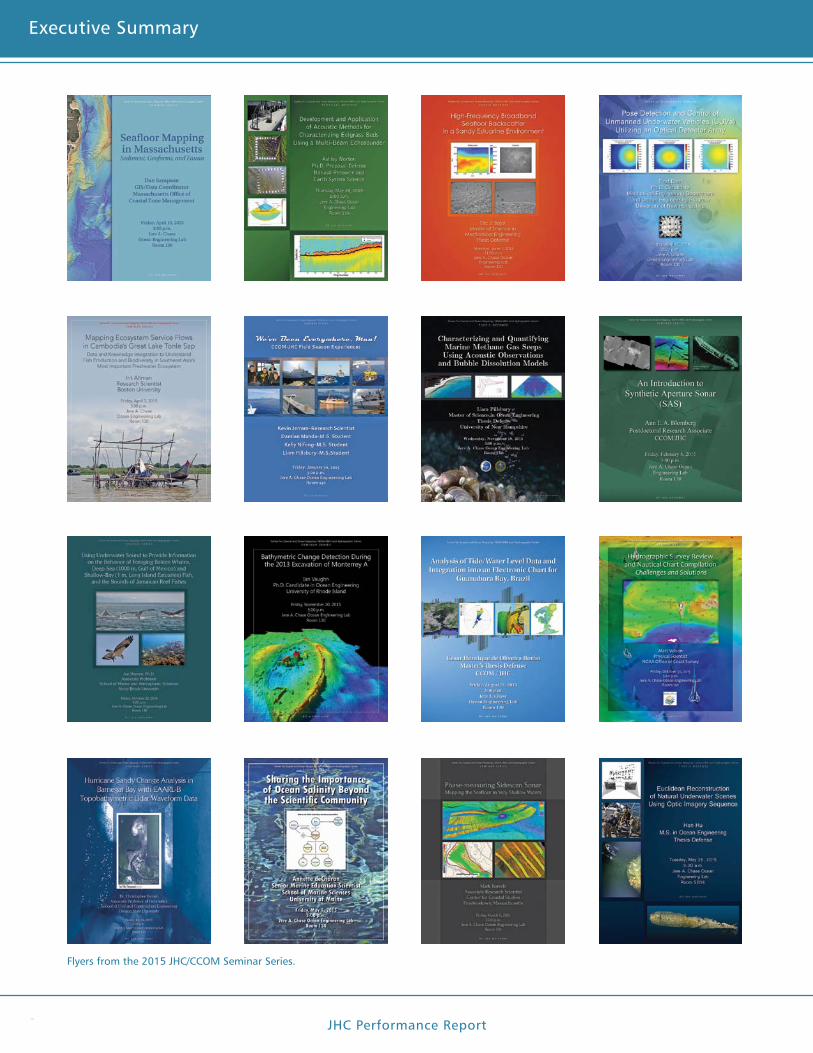
Flyers from the 2015 JHC/CCOM Seminar Series.
JHC Performance Report
Executive Summary Executive Summary
30 January 2016 3
Executive Summary Executive Summary
he NOAA-UNH Joint Hydrographic Center (JHC/ CCOM) was founded sixteen years ago with the objective of developing tools and offering training that would help NOAA and others to meet the chal-lenges posed by the rapid transition from the sparse measurements of depth offered by traditional sounding techniques (lead lines and single-beam sonars) to the massive amounts of data collected by the new genera-tion of multibeam echo sounders, and to promote the development of new ocean mapping technolo-gies. Since its inception, the Center has been funded through Cooperative Agreements with NOAA. The most recent of these, which was the result of a national competition, funded the Center for the period of 1 July 2010 until December 2015. Over the years, the focus of research at the Center has expanded, and now encom-passes a broad range of ocean mapping applications.
An initial goal of the Center was to find ways to process the massive amounts of data generated by multibeam and sidescan sonar systems at rates com-mensurate with data collection; that is, to make the data ready for chart production as rapidly as the data were collected. We have made great progress over the years in attaining, and now far surpassing, this goal and, while we continue to focus our efforts on data processing in support of safe navigation, our atten-tion has also turned to the opportunities provided by this huge flow of information to create a wide range of products that meet needs beyond safe navigation (e.g., marine habitat assessments, gas seep detection, fisheries management, disaster mitigation, and national security). Our approach to extracting “value added” from data collected in support of safe navigation was formalized with the enactment on the 30th of March 2009 of the Ocean and Coastal Mapping Integration Act—and our establishment of an Integrated Ocean and Coastal Mapping (IOCM) Processing Center at UNH to support NOAA and others in delivering the required products of this new legislation. In 2010 the concept of IOCM was demonstrated when we were able to quickly and successfully apply tools and techniques developed for hydrographic and fisheries applications to the Deep-water Horizon oil spill crisis.
In the time since our establishment, we have built a vibrant Center with international reputation as the place, “where the cutting edge of hydrography is now located” (Adam Kerr, Past Director of the International Hydrographic Organization in Hydro International). In the words of Pat Sanders, then President of HYPACK Inc., a leading provider of hydrographic software to governments and the private sector:
JHC/CCOM has been THE WORLD LEADER in develop-ing new processing techniques for hydrographic data. JHC/CCOM has also shown that they can quickly push new developments out into the marketplace, making both government and private survey projects more efficient and cost effective.”
Since our inception, we have worked on the develop-ment of automated and statistically robust approaches to multibeam sonar data processing. These efforts came to fruition when our automated processing algorithm (CUBE) and our new database approach (The Navigation Surface), were, after careful verification and evaluation, accepted by NOAA, the Naval Oceano-graphic Office and other hydrographic agencies, as part of their standard processing protocols. Today, almost every hydrographic software manufacturer has, or is, incorporating these approaches into their products. It is not an overstatement to say that these techniques are revolutionizing the way NOAA and others in the ocean mapping community are doing hydrography. These new techniques can reduce data processing time by a factor of 30 to 70 and provide a quantification of uncertainty that has never before been achievable in hydrographic data. The result has been: “gained efficiency, reduced costs, improved data quality and consistency, and the ability to put products in the hands of our customers faster.” (Capt. Roger Parsons, former NOAA IOCM Coordinator and Director of NOAA’s Office of Coast Survey).
The acceptance of CUBE and the Navigation Surface represents a paradigm shift for the hydrographic com-munity—from dealing with individual soundings (rea-sonable in a world of lead line and single-beam sonar measurements) to the acceptance of gridded depth estimates (with associated uncertainty values) as a starting point for hydrographic products. The research needed to support this paradigm shift has been a focus of the Center since its inception and to now see it ac-cepted is truly rewarding. It is also indicative of the role that the Center has played and will continue to play, in establishing new directions in hydrography and ocean mapping.
Another long-term theme of our research efforts has been our desire to extract information beyond depth (bathymetry) from the mapping systems used by NOAA and others. We have made significant progress in the development of a simple-to-use tool (GeoCoder) that generates a sidescan-sonar or backscatter “mosaic”—a critical first step in the analysis of seafloor character. There has been tremendous interest in this software throughout NOAA and many of our industrial partners
“
JHC Performance Report4
Executive Summary Executive Summary
30 January 2016
Executive Summary Executive Summary
have now incorporated GeoCoder into their software products. Like CUBE’s role in bathymetric process-ing, GeoCoder is becoming the standard approach to backscatter processing. An email from a member of the Biogeography Team of NOAA’s Center for Coastal Monitoring and Assessment said:
We are so pleased with GeoCoder! We jumped in with both feet and made some impressive mosaics. Thanks so much for all the support.”
Beyond GeoCoder, our efforts to support the IOCM concept of "map once, use many times" are also com-ing to fruition. In 2011, software developed by Center researchers was installed on several NOAA fisheries ves-sels equipped with Simrad ME70 fisheries multibeam echosounders. These sonars were originally designed for mapping pelagic fish schools but, using our soft-ware, the sonars are now being used for multiple seabed mapping purposes. For example, data collected on the Oscar Dyson during an acoustic-trawl survey for walleye pollock was opportunistically processed for seabed characterization in support of essential fish habitat (EFH) and also in support of safety of naviga-tion, including submission for charts and identification of a Danger to Navigation. In 2012, seafloor mapping data from the ME70 was used by fisheries scientists to identify optimal sites for fish-traps during a red snapper survey. Scientists on board ship said that the seafloor data provided by Center software was "invaluable in helping accomplish our trapping objectives on this trip." In 2013, tools developed for producing bathymetry and other products from fisheries sonars were installed on NOAA fisheries vessels and operators trained in their use. In 2015, one of our industrial partners began providing fully supported commercial-grade versions of these tools and they are being installed on NOAA fish-eries vessels. All of these examples (CUBE, GeoCoder, and our fisheries sonar tools) are tangible examples of our (and NOAA’s) goal of bringing our research efforts to operational practice (R2O).
The Center was also called upon to help with an inter-national disaster—the mysterious loss of Air Malaysia Flight MH370. As part of our GEBCO/Nippon Founda-tion Bathymetric Training Program, researchers and students in the Center are compiling all available bathy-metric data from the Indian Ocean. When MH370 was lost, the Government of Australia and several major media outlets came to the Center for the best avail-able representations of the seafloor in the vicinity of the crash. The data we provided were used during the search and were displayed both on TV and in print media.
As technology evolves, the tools needed to process the data and the range of applications that the data can address will also change. We have begun to explore the use of Autonomous Underwater Vehicles (AUVs) and Autonomous Surface Vehicles (ASVs) as platforms for hydrographic and other mapping surveys and are looking closely at the capabilities and limitations of Airborne Laser Bathymetry (lidar) and Satellite Derived Bathymetry (SDB) in shallow-water coastal mapping applications. To further address the critical very-shal-low-water regimes we are also looking at the use of personal watercraft and aerial imagery as tools to mea-sure bathymetry in that difficult zone between zero and ten meters water depth. The Center is also bringing together many of the tools and visualization techniques we have developed to explore what the “Chart of the Future” may look like.
In the last few years, a new generation of multibeam sonars has been developed (in part as a result of research done at the Center) that have the capability of mapping targets in the water-column as well as the seafloor. We have been developing visualization tools that allow this water-column data to be viewed in 3D in real-time. Although the ability to map 3D targets in a wide swath around a survey vessel has obvious applica-tions in terms of fisheries targets (and we are working with fisheries scientists to exploit these capabilities), it also allows careful identification of shallow hazards in the water column and may obviate the need for wire sweeps or diver examinations to verify least depths in hydrographic surveys. These water-column mapping tools were a key component to our efforts to map sub-merged oil and gas seeps and monitor the integrity of the Macondo 252 wellhead as part of the national re-sponse to the Deepwater Horizon oil spill. The Center’s seep mapping efforts continue to be of national and international interest as we begin to use them to help quantify the flux of methane into the ocean and atmo-sphere. The initial water-column studies funded by this grant have led to many new opportunities including follow-up work that has been funded by the National Science Foundation, the Office of Naval Research, the Dept. of Energy, and the Sloan Foundation.
The value of our visualization, water-column mapping, and Chart of the Future capabilities have also been demonstrated by our work with Stellwagen National Marine Sanctuary aimed at facilitating an adaptive ap-proach to reducing the risk of collisions between ships and endangered North American Right Whales in the sanctuary. We have developed 4D (space and time) visualization tools to monitor the underwater behavior
“
JHC Performance Report
Executive Summary Executive Summary
30 January 2016 5
Executive Summary Executive Summary
“
of whales, as well as to notify vessels of the presence of whales in the shipping lanes and to monitor and analyze vessel traffic patterns. Describing our interaction with this project, Dan Basta, Director of the Office of National Marine Sanctuaries, said:
…I am taking this opportunity to thank you for the unsurpassed support and technical expertise that the University of New Hampshire’s Center for Coastal and Ocean Mapping/NOAA-UNH Joint Hydrographic Center provides NOAA’s Office of National Marine Sanctuaries. Our most recent collaboration to produce the innovative marine conservation tool Whale-Alert is a prime example of the important on-going relationship between our organizations. WhaleAlert is a software program that displays all mariner-relevant right whale conservation measures on NOAA nautical charts via iPad and iPhone devices. The North American right whale is one of the world’s most endangered large animals and its protection is a major NOAA and ONMS responsibility. The creation of WhaleAlert is a major accomplishment as NOAA works to reduce the risk of collision between commercial ships and whales, a major cause of whale mortality.
...WhaleAlert brings ONMS and NOAA into the 21st century of marine conservation. Its development has only been possible because of the vision, technical expertise, and cooperative spirit that exist at CCOM/JHC and the synergies that such an atmosphere creates. CCOM/JHC represents the best of science and engineering and I look forward to continuing our highly productive relationship.”
Statements from senior NOAA managers and the actions of other hydrographic agencies and the industrial sector provide clear evidence that we are making a real contribution to NOAA and the international community. We will certainly not stop there. CUBE, the Navigation Surface, GeoCoder, and the Chart of the Future offer frameworks upon which new innovations are being built and new efficiencies gained. Additionally, these achievements provide a start-ing point for the delivery of a range of hydrographic and non-hydrographic mapping products that set the scene for many future research efforts.
Highlights from Our 2015 Program
Our efforts in 2015 represent the continued growth and refinement of successful ongoing research programs com-bined with the evolution of new programs developed within the seven research themes prescribed by the Cooperative Agreement with NOAA (Sensors, Processing, Habitat and Water Column Mapping, IOCM, Visualization, Chart of the Future, and Law of the Sea). In 2015, as in 2013 and 2014, some of our efforts have been diverted to research and data processing associated with an immediate need—response to Super Storm Sandy. This led to a rapid increase in the staff at the Center in 2014 (three new Center employees and six new NOAA contract employees). Although the costs associated with most of the new staff and much of the Super Storm Sandy related effort are not being covered by the Joint Hydrographic Center grant, the work being conducted draws upon, and is linked to, many of the efforts funded by the JHC grant. The selection of the Center as the venue for the Super Storm Sandy work is further evidence of the relevance of the JHC-funded work to NOAA and the nation.
As our research progresses and evolves, the initially clear boundaries between the themes have become more and more blurred. For example, from an initial focus on sonar sensors we have expanded our efforts to include lidar and satellite imagery. Our data-processing efforts are evolving into habitat characterization, mid-water mapping and IOCM efforts. The data-fusion and visualization projects are also blending with our seafloor characterization, habitat and Chart of the Future efforts as we begin to define new sets of “non-traditional” products. This blending is a natural—and desirable—evolution that slowly changes the nature of the programs and the thrust of our efforts. While the boundaries between the themes are often diffuse and often somewhat arbitrary, our Annual Progress Report main-tains the thematic divisions; the highlights outlined below offer only a glimpse at the Center's activities, but hopefully provide key examples of this year's efforts.
“
JHC Performance Report6
Executive Summary Executive Summary
30 January 2016
Executive Summary Executive Summary
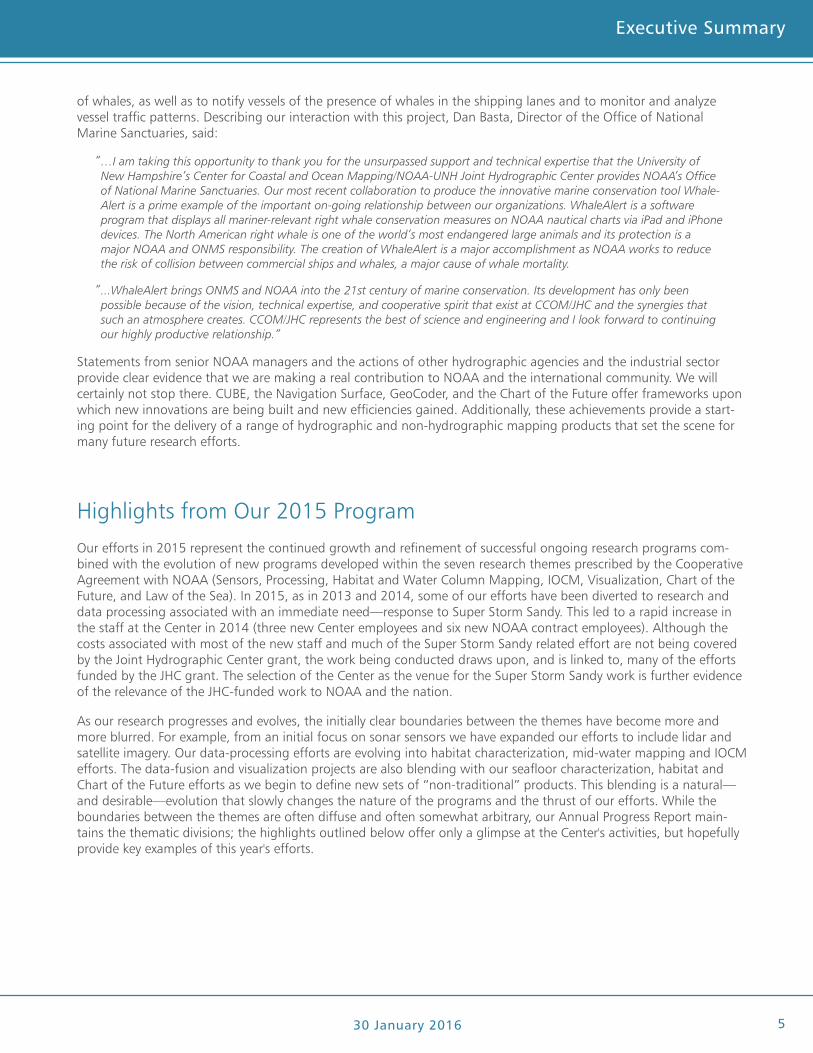
SensorsWe continue to work closely with NOAA and the man-ufacturers of sonar and lidar systems to better under-stand and calibrate the behavior of the sensors used to make the hydrographic and other measurements used for ocean mapping. Many of these take advantage of our unique acoustic test tank facility, the largest of its kind in New England and now equipped with state-of-the-art test and calibration facilities. This year the facility was upgraded to include the ability to automati-cally measure sound speed in the tank and humidity in the highbay facility. Accurate understanding of sound speed is essential to our acoustic measurements, while understanding humidity fluctuations in the highbay is critical to the functioning of our measuring equipment and the long-term viability of the facility. Several sonars were calibrated this year including an MSI constant beamwidth transducer (Figure ES-1) and a new Kongs-berg wideband transceiver (both to provide higher resolution in target detection), a NOAA fisheries sonar, a DIDSON imaging system (to explore its applicability to habitat studies) and two small Garmin transducers to understand their potential applicability to crowd-sourced bathymetric data collection. The broadband transceiver tested in our tank was later deployed on several cruises focused on quantitative measurements of gas bubbles and on the Swedish Icebreaker Oden in Petermann Fjord, northern Greenland, to identify seeps and other midwater targets as part of an NSF-sponsored study to understand the causes of the rapid melting of the Greenland Ice Sheet.
The expertise of the Center, with respect to MBES, has been recog-nized through a number of requests for Center personnel to participate in field acceptance trials of newly in-stalled sonars. The Center has taken a lead (through funding from the National Science Foundation) in the establishment of a national Multi-beam Advisory Committee (MAC) with the goal of ensuring that con-sistently high-quality multibeam data are collected across the U.S. Academ-ic Research Fleet and other vessels. NOAA personnel have begun to accompany Center participants on MAC cruises and the experience gained from our MAC activities has been fed directly back into NOAA, aiding our support of NOAA mission-related research and education.
Part of this effort is the development and dissemination of best-practices documentation, and quality-assurance and performance-prediction software that have already been introduced into the NOAA fleet. In 2015, the MAC team peformed Shipboard Acceptance Trials (SAT) for upgraded multi-beam sonars on the research ves-sels Kilo Moana and Nathanial B. Palmer. Center staff also teamed with NOAA personnel to perform Quality Assurance Tests (QATs) on the NOAA Vessel Ron Brown. The MAC team also performed annual maintenance and inspections of the multibeam systems aboard the Schmidt Ocean Institute’s R/V Falkor and the Ocean Exploration Trust’s E/V Nautilus and continued with the development of a suite of publicly available software tools for the analysis and interpretation of multibeam sonar performance.
Figure ES-1. MSI Constant Beamwdith Tranducer being tested in the Center’s acoustic test tank.
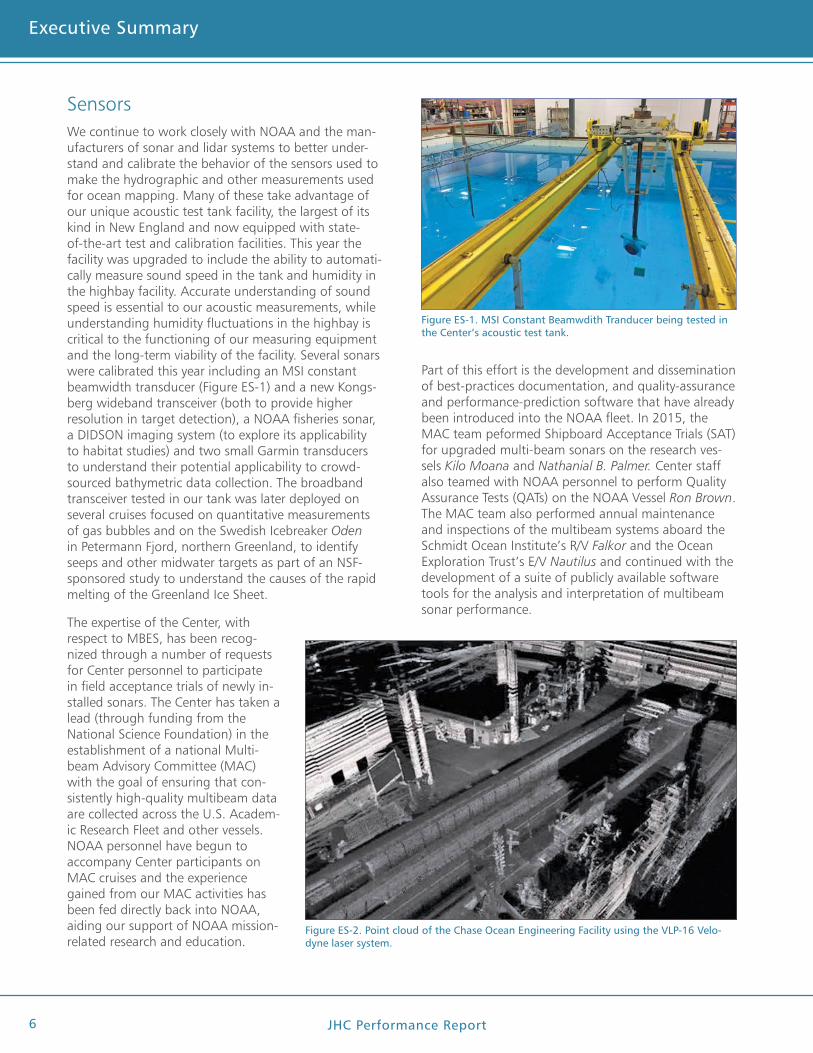
Figure ES-2. Point cloud of the Chase Ocean Engineering Facility using the VLP-16 Velo-dyne laser system.
JHC Performance Report
Executive Summary Executive Summary
30 January 2016 7
Executive Summary Executive Summary
We have long recognized that one of the greatest challenges presented to the hydrographic community is the need to map very shal-low coastal regions where multibeam echo sounding systems become less ef-ficient. Airborne bathymet-ric lidar systems offer the possibility to rapidly collect bathymetric (and other) data in these very shal-low regions but there still remains great uncertainty about the accuracy and resolution of these systems. Additionally, lidar (both bathymetric and terrestrial) offer the opportunity to extract other critical infor-mation about the coastal zone including seafloor characterization and shoreline mapping data. We have thus invested heavily in lidar-based research (mostly reported under the HABITAT and PROCESSING themes) but also with respect to the sensors themselves.
Shachak Pe’eri and NOAA Corps officer and graduate student John Kidd are exploring the use of inexpensive 2D laser scanners mounted on NOAA vessels to detect natural (e.g., shoals and boulders), and man-made (e.g., piers, piles) features that pose dangers to naviga-tion. Initial laboratory testing (Figure ES-2) indicate that this approach may be a cost-effective addition to near-shore surveys.
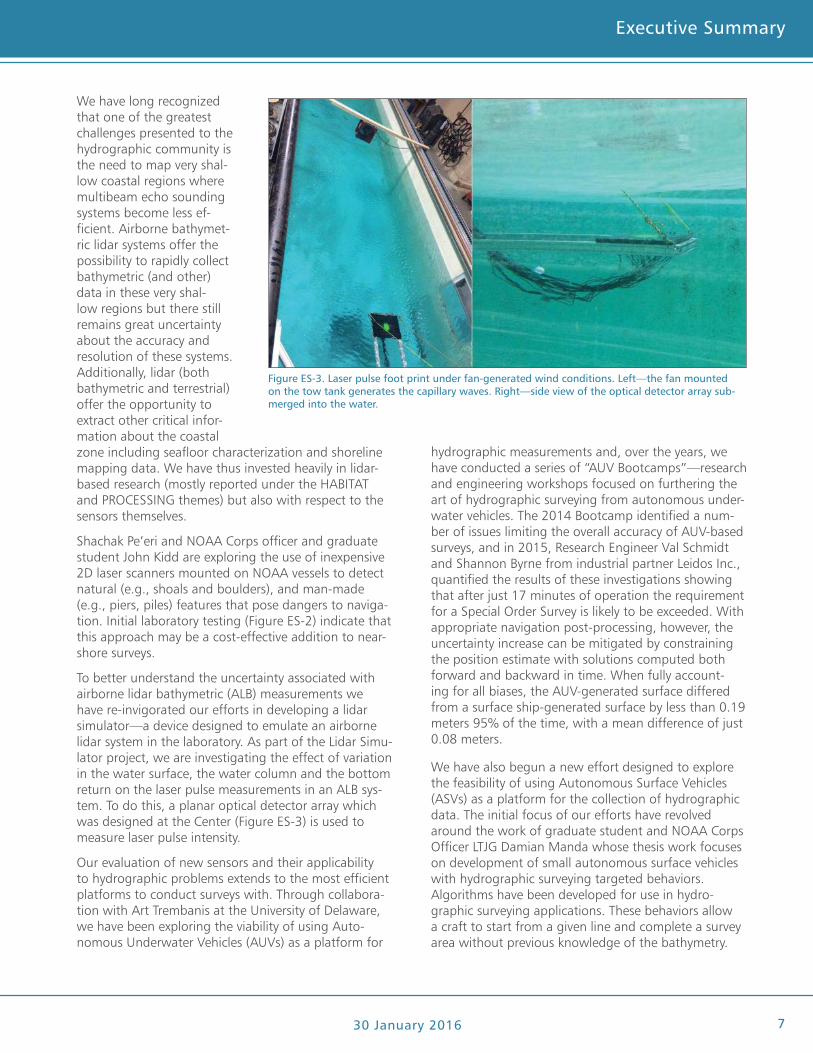
To better understand the uncertainty associated with airborne lidar bathymetric (ALB) measurements we have re-invigorated our efforts in developing a lidar simulator—a device designed to emulate an airborne lidar system in the laboratory. As part of the Lidar Simu-lator project, we are investigating the effect of variation in the water surface, the water column and the bottom return on the laser pulse measurements in an ALB sys-tem. To do this, a planar optical detector array which was designed at the Center (Figure ES-3) is used to measure laser pulse intensity.
Our evaluation of new sensors and their applicability to hydrographic problems extends to the most efficient platforms to conduct surveys with. Through collabora-tion with Art Trembanis at the University of Delaware, we have been exploring the viability of using Auto- nomous Underwater Vehicles (AUVs) as a platform for
hydrographic measurements and, over the years, we have conducted a series of “AUV Bootcamps”—research and engineering workshops focused on furthering the art of hydrographic surveying from autonomous under-water vehicles. The 2014 Bootcamp identified a num-ber of issues limiting the overall accuracy of AUV-based surveys, and in 2015, Research Engineer Val Schmidt and Shannon Byrne from industrial partner Leidos Inc., quantified the results of these investigations showing that after just 17 minutes of operation the requirement for a Special Order Survey is likely to be exceeded. With appropriate navigation post-processing, however, the uncertainty increase can be mitigated by constraining the position estimate with solutions computed both forward and backward in time. When fully account-ing for all biases, the AUV-generated surface differed from a surface ship-generated surface by less than 0.19 meters 95% of the time, with a mean difference of just 0.08 meters.
We have also begun a new effort designed to explore the feasibility of using Autonomous Surface Vehicles (ASVs) as a platform for the collection of hydrographic data. The initial focus of our efforts have revolved around the work of graduate student and NOAA Corps Officer LTJG Damian Manda whose thesis work focuses on development of small autonomous surface vehicles with hydrographic surveying targeted behaviors. Algorithms have been developed for use in hydro-graphic surveying applications. These behaviors allow a craft to start from a given line and complete a survey area without previous knowledge of the bathymetry.
Figure ES-3. Laser pulse foot print under fan-generated wind conditions. Left—the fan mounted on the tow tank generates the capillary waves. Right—side view of the optical detector array sub-merged into the water.
JHC Performance Report8
Executive Summary Executive Summary
30 January 2016
Executive Summary Executive Summary
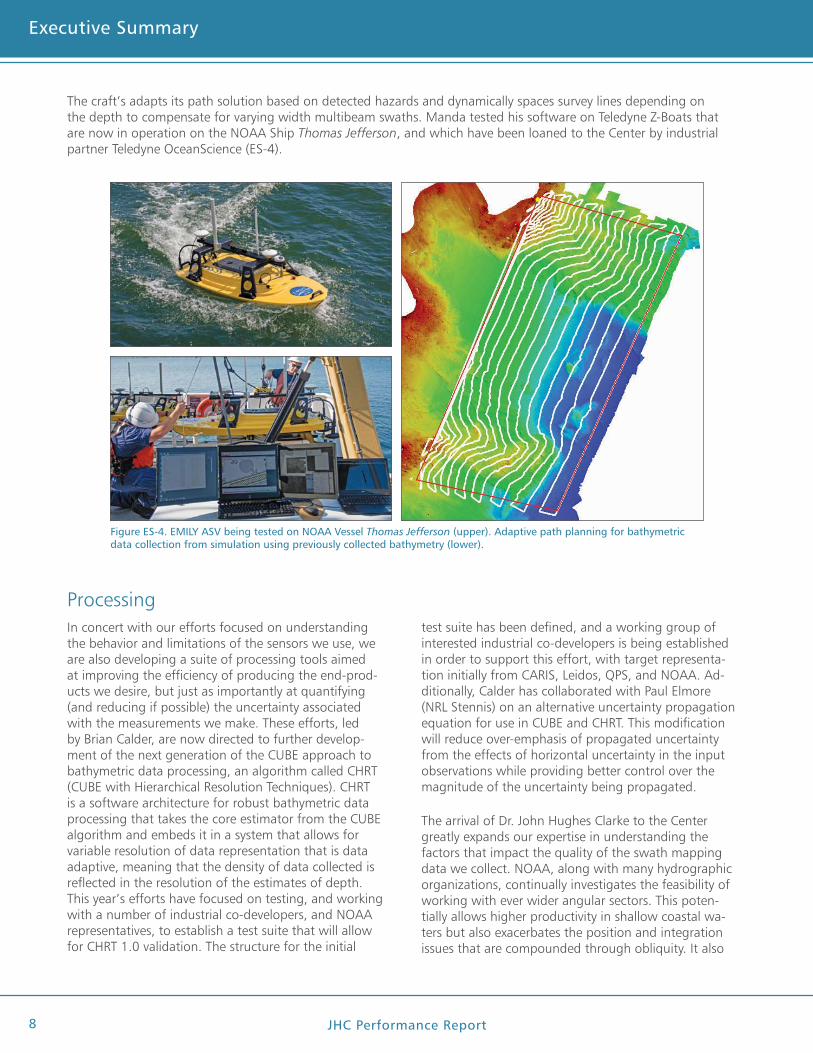
The craft’s adapts its path solution based on detected hazards and dynamically spaces survey lines depending on the depth to compensate for varying width multibeam swaths. Manda tested his software on Teledyne Z-Boats that are now in operation on the NOAA Ship Thomas Jefferson, and which have been loaned to the Center by industrial partner Teledyne OceanScience (ES-4).
ProcessingIn concert with our efforts focused on understanding the behavior and limitations of the sensors we use, we are also developing a suite of processing tools aimed at improving the efficiency of producing the end-prod-ucts we desire, but just as importantly at quantifying (and reducing if possible) the uncertainty associated with the measurements we make. These efforts, led by Brian Calder, are now directed to further develop-ment of the next generation of the CUBE approach to bathymetric data processing, an algorithm called CHRT (CUBE with Hierarchical Resolution Techniques). CHRT is a software architecture for robust bathymetric data processing that takes the core estimator from the CUBE algorithm and embeds it in a system that allows for variable resolution of data representation that is data adaptive, meaning that the density of data collected is reflected in the resolution of the estimates of depth. This year’s efforts have focused on testing, and working with a number of industrial co-developers, and NOAA representatives, to establish a test suite that will allow for CHRT 1.0 validation. The structure for the initial
Figure ES-4. EMILY ASV being tested on NOAA Vessel Thomas Jefferson (upper). Adaptive path planning for bathymetric data collection from simulation using previously collected bathymetry (lower).
test suite has been defined, and a working group of interested industrial co-developers is being established in order to support this effort, with target representa-tion initially from CARIS, Leidos, QPS, and NOAA. Ad-ditionally, Calder has collaborated with Paul Elmore (NRL Stennis) on an alternative uncertainty propagation equation for use in CUBE and CHRT. This modification will reduce over-emphasis of propagated uncertainty from the effects of horizontal uncertainty in the input observations while providing better control over the magnitude of the uncertainty being propagated.
The arrival of Dr. John Hughes Clarke to the Center greatly expands our expertise in understanding the factors that impact the quality of the swath mapping data we collect. NOAA, along with many hydrographic organizations, continually investigates the feasibility of working with ever wider angular sectors. This poten-tially allows higher productivity in shallow coastal wa-ters but also exacerbates the position and integration issues that are compounded through obliquity. It also
JHC Performance Report
Executive Summary Executive Summary
30 January 2016 9
Executive Summary Executive Summary
ments. Schmidt has been working with manufacturers to help them find better designs, and with software developers of post-processing packages to help them better handle PMBS data such that it is more readily suitable for hydrographic work. As a direct result of these interactions, Edgetech and Klein systems now provide real-time bathymetric uncertainty estimates with their data. In addition, Klein has redesigned their bathy processing engine to produce nearly full coverage at nadir in water depths shallower than approximately 20 m, where their previous systems left a 60 degree gap. Further, Caris and Hypack now support ingestion of uncertainty from Edgetech and Klein systems.
Schmidt has been working closely with NOAA contrac-tors Cassandra Bongiovanni, Juliet Kinney and Sarah Wolfskehl, who are co-located at the Center to help determine if recent post Hurricane Sandy surveys by the USGS with the SeaSwath system are suitable for nauti-cal charting. In addition, as part of our work under the IOCM Super Storm Sandy Disaster Relief cooperative agreement, PMBS data sets have been evaluated for their effectiveness in post-storm survey. From these findings a series of recommendations have been pro-duced for effective object detection from the bathy- metry of PMBS systems. These include careful interpre-tation of the bathymetry data in the context of the sid-escan imagery (Figure ES-6), scanning data in real time to ensure hazards to navigation are captured in the most favorable survey geometries, utilizing systems that produce real-time uncertainty with their measurements as well as binning and averaging data to reduce noise, and conducting thoughtful outlier rejection to ensure true outliers and not the tails of a noisy measurement distributions are omitted.
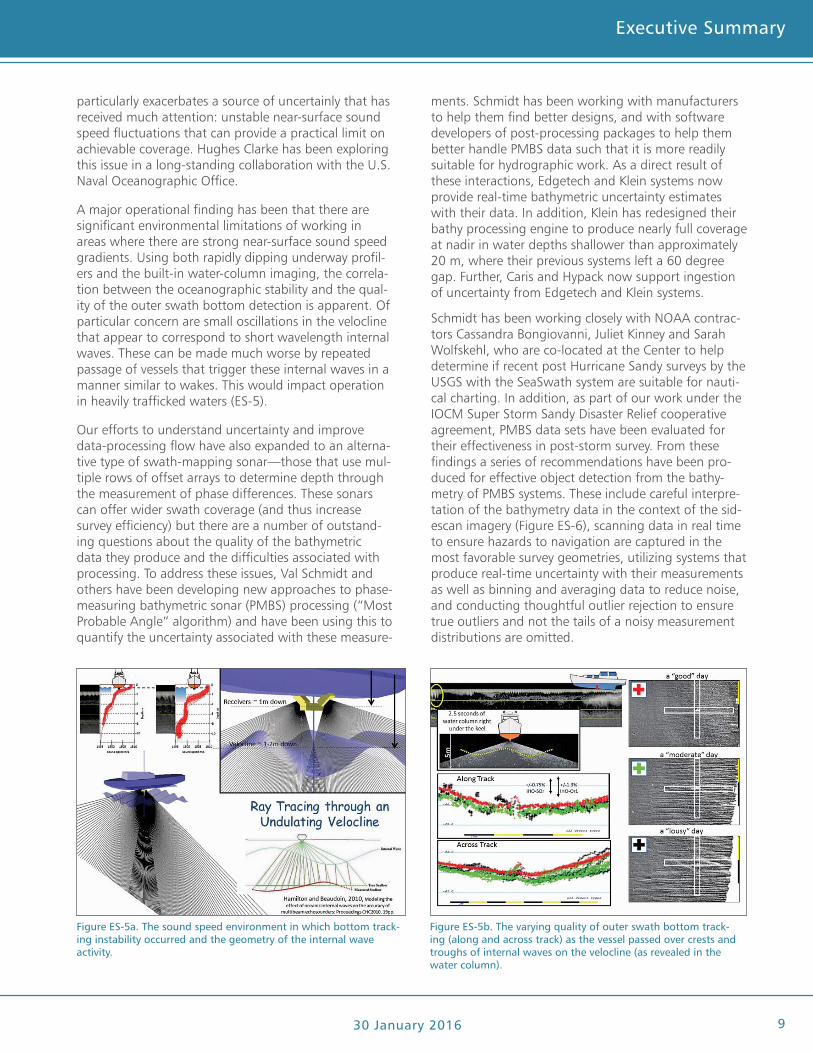
particularly exacerbates a source of uncertainly that has received much attention: unstable near-surface sound speed fluctuations that can provide a practical limit on achievable coverage. Hughes Clarke has been exploring this issue in a long-standing collaboration with the U.S. Naval Oceanographic Office.
A major operational finding has been that there are significant environmental limitations of working in areas where there are strong near-surface sound speed gradients. Using both rapidly dipping underway profil-ers and the built-in water-column imaging, the correla-tion between the oceanographic stability and the qual-ity of the outer swath bottom detection is apparent. Of particular concern are small oscillations in the velocline that appear to correspond to short wavelength internal waves. These can be made much worse by repeated passage of vessels that trigger these internal waves in a manner similar to wakes. This would impact operation in heavily trafficked waters (ES-5).
Our efforts to understand uncertainty and improve data-processing flow have also expanded to an alterna-tive type of swath-mapping sonar—those that use mul-tiple rows of offset arrays to determine depth through the measurement of phase differences. These sonars can offer wider swath coverage (and thus increase survey efficiency) but there are a number of outstand-ing questions about the quality of the bathymetric data they produce and the difficulties associated with processing. To address these issues, Val Schmidt and others have been developing new approaches to phase-measuring bathymetric sonar (PMBS) processing (“Most Probable Angle” algorithm) and have been using this to quantify the uncertainty associated with these measure-
Figure ES-5a. The sound speed environment in which bottom track-ing instability occurred and the geometry of the internal wave activity.
Figure ES-5b. The varying quality of outer swath bottom track-ing (along and across track) as the vessel passed over crests and troughs of internal waves on the velocline (as revealed in the water column).
JHC Performance Report10
Executive Summary Executive Summary
30 January 2016
Executive Summary Executive Summary
Our efforts to understand the limitations and capabili-ties of PMBS have been greatly enhanced by the arrival of Dr. Tony Lyons. Dr. Lyons, supported mostly by the Office of Naval Research, brings a rich history of expertise in PMBS and Synthetic Aperture Sonar (SAS) design and processing to the Center; his Navy work has immediate applicability to the questions faced by NOAA and others regarding the efficacy of PMBS and SAS for hydrographic applications. The introduction of stable, commercially avail-able autonomous underwater vehicles (AUVs) and improved micronavigation methods have made interferometric SAS and interferometric sidescan (or phase measuring) bathymetric sonar systems increasingly viable solutions for increasing aerial coverage rates in shallow water. Both of these technolo-gies present a number of chal-lenges, however, including: platform stability, acoustic multipath interference, low signal-to-noise (SNR) and
water-column sound speed variation. The advantages of SAS interferometry may out-weigh its problems when resolution and area-coverage rate is of concern since SAS interfer-ometry outperforms multibeam echosounders in terms of bathy-metry measurement density while also providing co-registered intensity imagery, useful for target detection and map-ping of habitat or sediment types.
We have also been exploring "crowd sourced" bathymetric measurements. Although there are a number of projects underway to collect bathymetric data with the intent of creating or updating charts, many (if not all) hydro-graphic offices are reluctant to accept non-professional survey data for chart update due to the liability issues involved. We are address-ing this issue by investigating an alternative approach to the problem where instead of gathering data of uncertain provenance and then attempting to make it suitable for chart-ing through some sophisticated processing, a more sophisticated data collection system is developed that by design gathers data that is of demonstrable quality, and preferably of sufficient quality to be used for chart update (Trusted Community Bathymetry—TCB). We have started testing equipment that could be used for a TCB system, determining the capa-
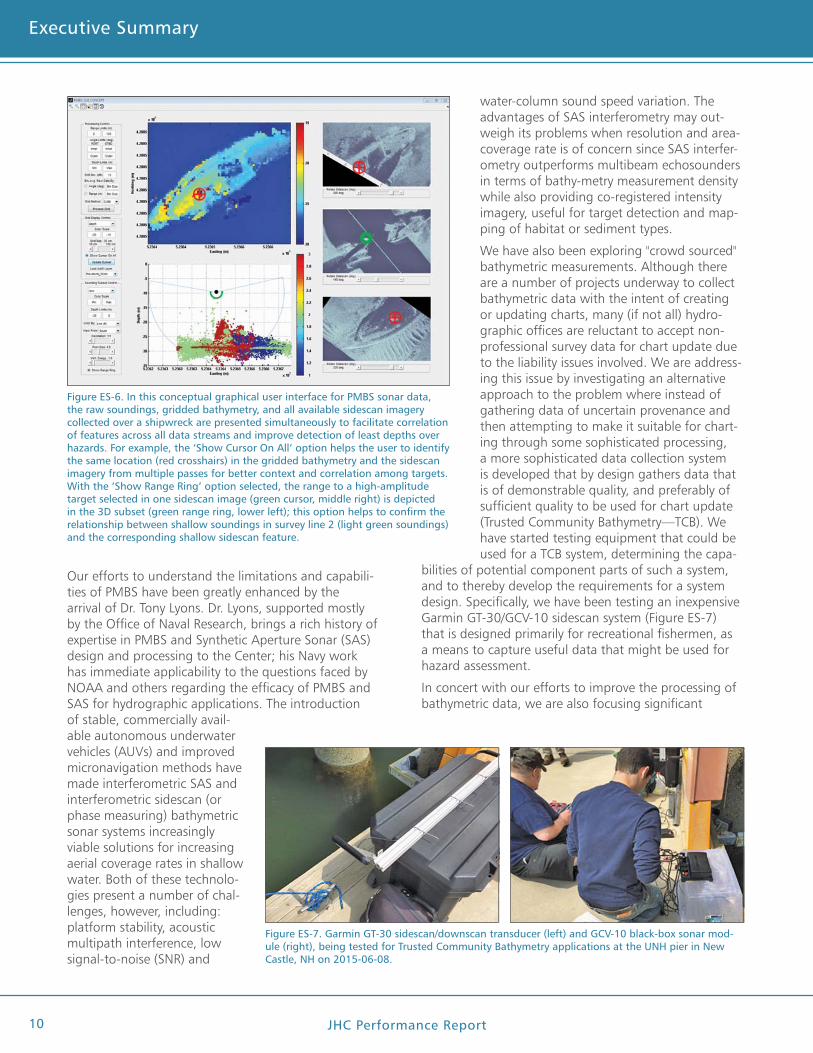
bilities of potential component parts of such a system, and to thereby develop the requirements for a system design. Specifically, we have been testing an inexpensive Garmin GT-30/GCV-10 sidescan system (Figure ES-7) that is designed primarily for recreational fishermen, as a means to capture useful data that might be used for hazard assessment.
In concert with our efforts to improve the processing of bathymetric data, we are also focusing significant
Figure ES-7. Garmin GT-30 sidescan/downscan transducer (left) and GCV-10 black-box sonar mod-ule (right), being tested for Trusted Community Bathymetry applications at the UNH pier in New Castle, NH on 2015-06-08.
Figure ES-6. In this conceptual graphical user interface for PMBS sonar data, the raw soundings, gridded bathymetry, and all available sidescan imagery collected over a shipwreck are presented simultaneously to facilitate correlation of features across all data streams and improve detection of least depths over hazards. For example, the ‘Show Cursor On All’ option helps the user to identify the same location (red crosshairs) in the gridded bathymetry and the sidescan imagery from multiple passes for better context and correlation among targets. With the ‘Show Range Ring’ option selected, the range to a high-amplitude target selected in one sidescan image (green cursor, middle right) is depicted in the 3D subset (green range ring, lower left); this option helps to confirm the relationship between shallow soundings in survey line 2 (light green soundings) and the corresponding shallow sidescan feature.
JHC Performance Report
Executive Summary Executive Summary
30 January 2016 11
Executive Summary Executive Summary
ing (GeoCoding); backscatter inversion; and backscatter ground truth (e.g., optical imagery, bottom sampling, and high accuracy positioning). Associated with this effort is our work calibrating individual sonars and ad-dressing concerns raised by our NOAA partners about specific systems they are using in the field. In bringing together scientists with disparate backgrounds to ad-dress a common problem, the NEWBEX project epito-mizes the strength of the Center. As problems arise, we can call upon local expertise (in signal processing,
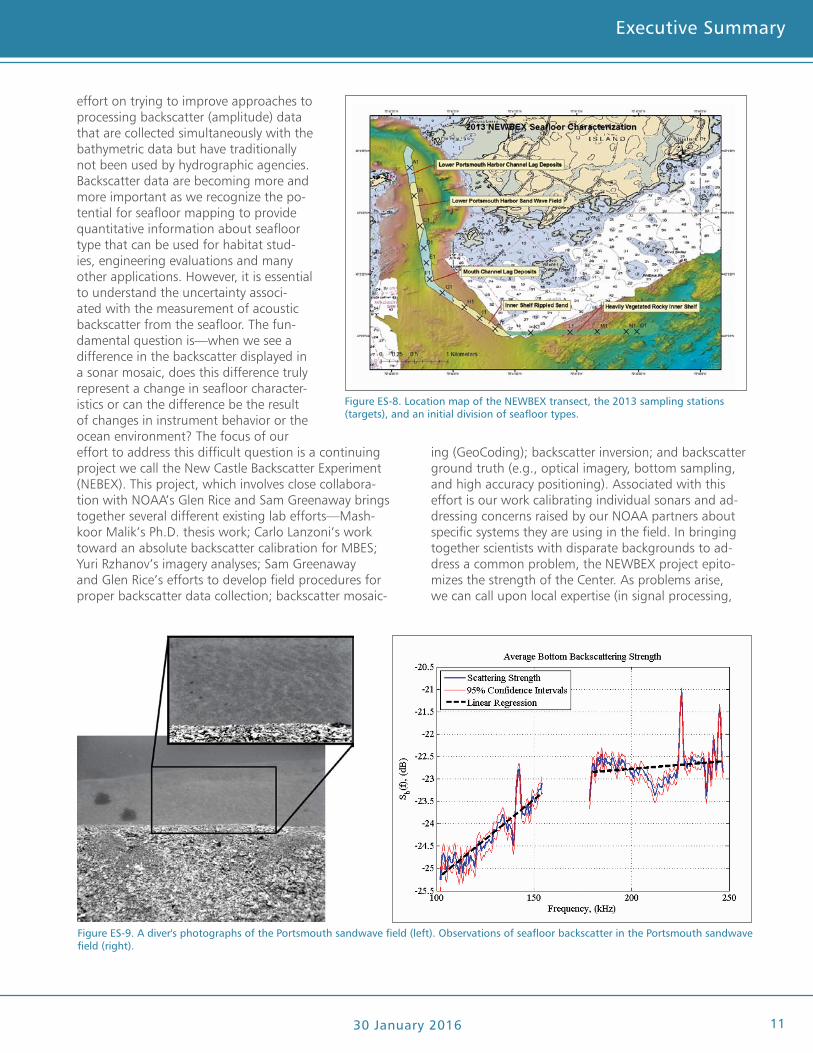
effort on trying to improve approaches to processing backscatter (amplitude) data that are collected simultaneously with the bathymetric data but have traditionally not been used by hydrographic agencies. Backscatter data are becoming more and more important as we recognize the po-tential for seafloor mapping to provide quantitative information about seafloor type that can be used for habitat stud-ies, engineering evaluations and many other applications. However, it is essential to understand the uncertainty associ-ated with the measurement of acoustic backscatter from the seafloor. The fun-damental question is—when we see a difference in the backscatter displayed in a sonar mosaic, does this difference truly represent a change in seafloor character-istics or can the difference be the result of changes in instrument behavior or the ocean environment? The focus of our effort to address this difficult question is a continuing project we call the New Castle Backscatter Experiment (NEBEX). This project, which involves close collabora-tion with NOAA’s Glen Rice and Sam Greenaway brings together several different existing lab efforts—Mash-koor Malik’s Ph.D. thesis work; Carlo Lanzoni’s work toward an absolute backscatter calibration for MBES; Yuri Rzhanov’s imagery analyses; Sam Greenaway and Glen Rice’s efforts to develop field procedures for proper backscatter data collection; backscatter mosaic-
Figure ES-8. Location map of the NEWBEX transect, the 2013 sampling stations (targets), and an initial division of seafloor types.
Figure ES-9. A diver's photographs of the Portsmouth sandwave field (left). Observations of seafloor backscatter in the Portsmouth sandwave field (right).
JHC Performance Report12
Executive Summary Executive Summary
30 January 2016
Executive Summary Executive Summary
image processing, geology, acoustics, etc.) to quickly and collaboratively seek solutions. Tools and protocols developed as part of this effort (e.g., a backscatter “saturation monitor” developed by Glen Rice) and designed to ensure high-quality backscatter data are collected have already been implemented in the NOAA hydrographic fleet.
In late December 2013, we finished an eight-month field campaign that established a “standard backscat-ter line” conveniently located near the UNH pier in
New Castle, NH. This line was chosen in consultation with the officers of the NOAA Ship Hassler and will be crossed by the Hassler whenever she leaves or returns to her home port. In developing this line, we collected weekly 200 kHz calibrated EK60 data, weekly sediment samples at two locations, and several seasonal sampling trips where more sediment samples and bottom images were collected at a number of locations along the line. The line passes over a variety of seabed types including sand with shell hash, clean sand, sand with sand dollars, gravel, and a complicated region with a bedrock/cobble/gravel/sand mixture (Figure ES-8). The variety of sediment types provides an excellent test-bed for studying high-frequency acoustic backscatter from a range of seafloor conditions. Grain-size analyses suggest that the sediment composition of each of these regions is very stable.
The focus of the NEWBEX project this past year has been the analysis of ste-reo camera data and sediment samples within the Portsmouth Harbor sand-wave field (Figure ES-9) and its compari-son to broadband seafloor backscatter data. The main empirical result is Figure ES-8, which shows broadband seafloor backscatter over frequencies ranging from approximately 100-200 kHz. These observations show two distinct trends: a relatively steep rise in backscatter strength with increasing frequency between 100 and 150 kHz, and then a frequency dependence that is nearly absent about ~175 kHz. The challenge now is to identify the mechanisms that control this frequency response and the backscatter levels themselves, so that
backscatter mosaics collected with MBES at similar frequencies can be properly interpreted.
Along with our efforts to understand and reduce the uncertainty associated with bathymetric and backscat-ter measurements, we have also worked collaboratively with NOAA to enhance the overall rate at which data are processed and brought into chart products. To facilitate the development of hydrographic processing software, a new software environment, HydrOffice, has been designed by Giuseppe Masetti and NOAA
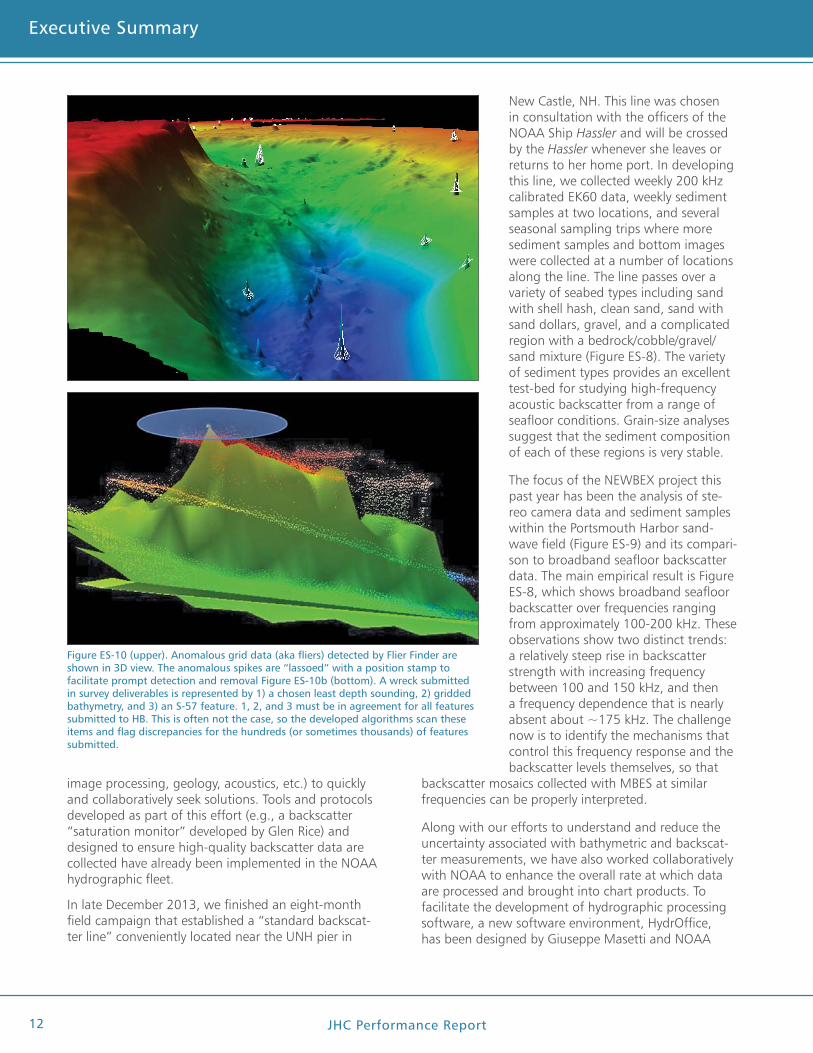
Figure ES-10 (upper). Anomalous grid data (aka fliers) detected by Flier Finder are shown in 3D view. The anomalous spikes are “lassoed” with a position stamp to facilitate prompt detection and removal Figure ES-10b (bottom). A wreck submitted in survey deliverables is represented by 1) a chosen least depth sounding, 2) gridded bathymetry, and 3) an S-57 feature. 1, 2, and 3 must be in agreement for all features submitted to HB. This is often not the case, so the developed algorithms scan these items and flag discrepancies for the hundreds (or sometimes thousands) of features submitted.
JHC Performance Report
Executive Summary Executive Summary
30 January 2016 13
Executive Summary Executive Summary
collaborators. HydrOffice allows new processing algo-rithms to be quickly developed and tested within the current data processing pipeline and, if they prove effective, quickly go into operation through implemen-tation by industrial partners. The HydrOffice environ-ment currently contains a number of “hydro-packages,” including “Flier-finder,” designed to automatically iden-tify outliers in gridded products and “Feature scan,” which checks the required agreement between gridded bathymetry and submitted feature files (e.g., wrecks) as well as the adherence of those feature files to current specifications (Figure ES-10a and b). Additional tools
are available for reducing survey data volumes, manag-ing sound speed profile data, and Bathymetric Attrib-uted Grids (BAGs), the open-source basis for the IHO S-102 gridded bathymetric data exchange standard.
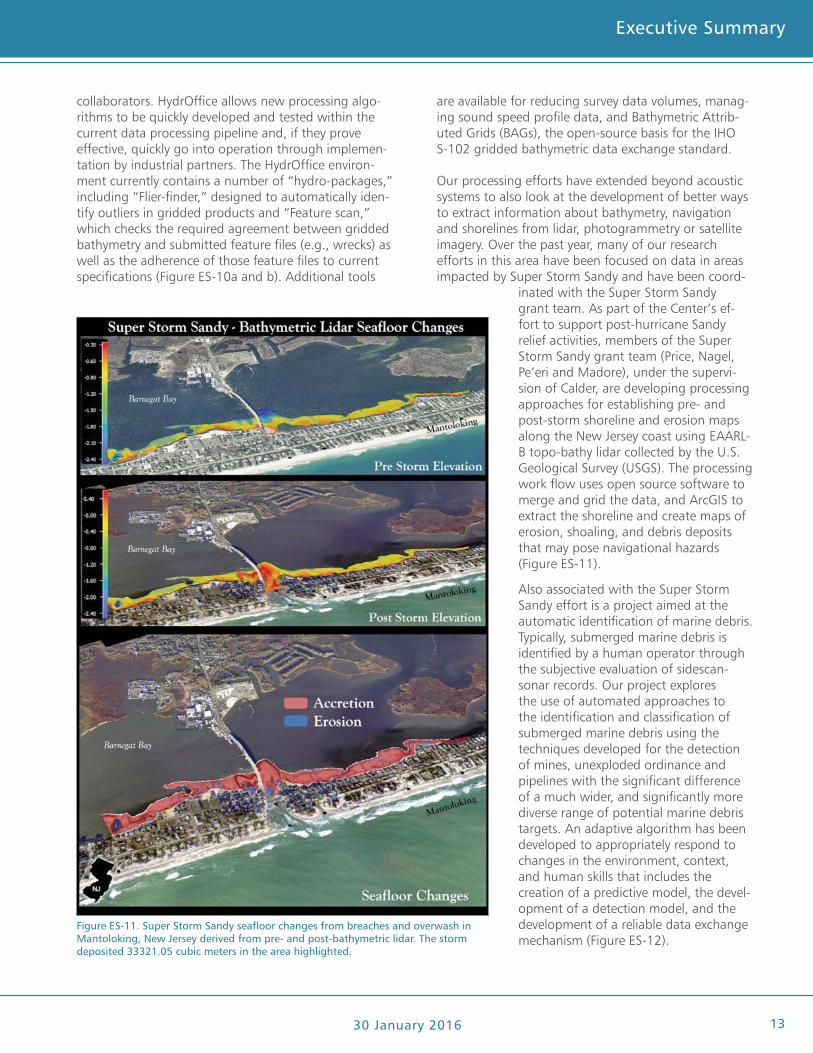
Our processing efforts have extended beyond acoustic systems to also look at the development of better ways to extract information about bathymetry, navigation and shorelines from lidar, photogrammetry or satellite imagery. Over the past year, many of our research efforts in this area have been focused on data in areas impacted by Super Storm Sandy and have been coord-
inated with the Super Storm Sandy grant team. As part of the Center’s ef-fort to support post-hurricane Sandy relief activities, members of the Super Storm Sandy grant team (Price, Nagel, Pe’eri and Madore), under the supervi-sion of Calder, are developing processing approaches for establishing pre- and post-storm shoreline and erosion maps along the New Jersey coast using EAARL-B topo-bathy lidar collected by the U.S. Geological Survey (USGS). The processing work flow uses open source software to merge and grid the data, and ArcGIS to extract the shoreline and create maps of erosion, shoaling, and debris deposits that may pose navigational hazards (Figure ES-11).
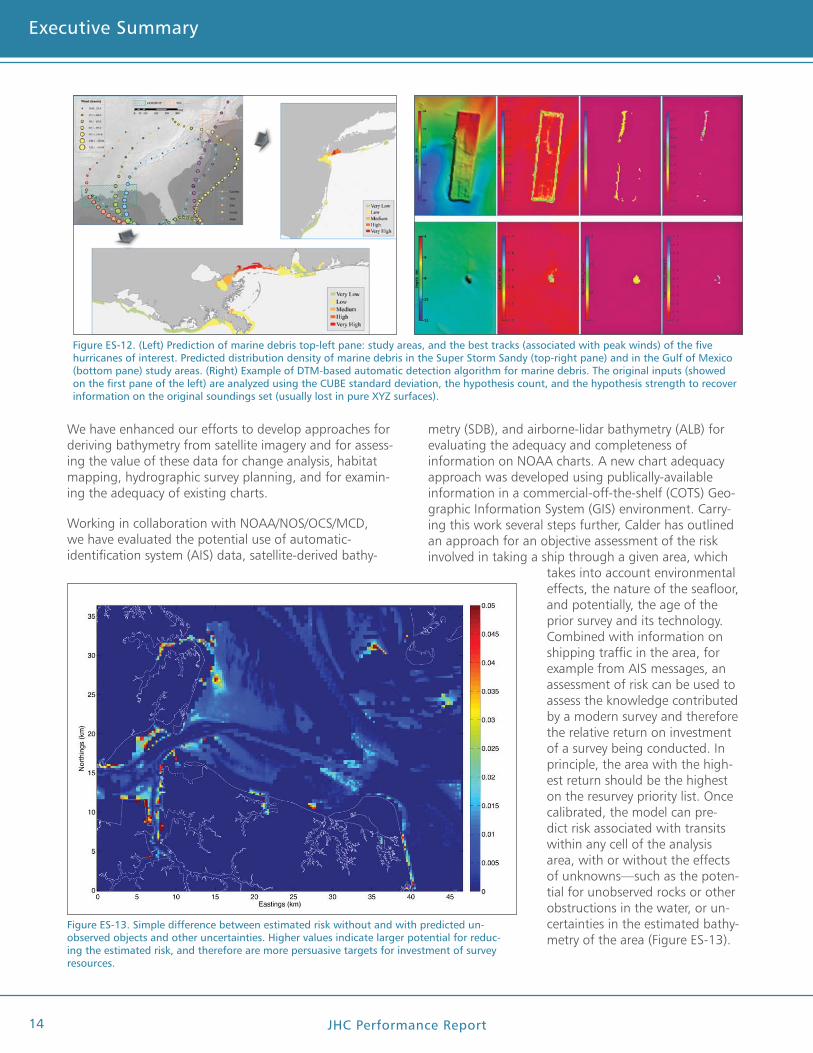
Also associated with the Super Storm Sandy effort is a project aimed at the automatic identification of marine debris. Typically, submerged marine debris is identified by a human operator through the subjective evaluation of sidescan- sonar records. Our project explores the use of automated approaches to the identification and classification of submerged marine debris using the techniques developed for the detection of mines, unexploded ordinance and pipelines with the significant difference of a much wider, and significantly more diverse range of potential marine debris targets. An adaptive algorithm has been developed to appropriately respond to changes in the environment, context, and human skills that includes the creation of a predictive model, the devel-opment of a detection model, and the development of a reliable data exchange mechanism (Figure ES-12).
Figure ES-11. Super Storm Sandy seafloor changes from breaches and overwash in Mantoloking, New Jersey derived from pre- and post-bathymetric lidar. The storm deposited 33321.05 cubic meters in the area highlighted.
JHC Performance Report14
Executive Summary Executive Summary
30 January 2016
Executive Summary Executive Summary
We have enhanced our efforts to develop approaches for deriving bathymetry from satellite imagery and for assess-ing the value of these data for change analysis, habitat mapping, hydrographic survey planning, and for examin-ing the adequacy of existing charts.
Working in collaboration with NOAA/NOS/OCS/MCD, we have evaluated the potential use of automatic- identification system (AIS) data, satellite-derived bathy-
metry (SDB), and airborne-lidar bathymetry (ALB) for evaluating the adequacy and completeness of information on NOAA charts. A new chart adequacy approach was developed using publically-available information in a commercial-off-the-shelf (COTS) Geo-graphic Information System (GIS) environment. Carry-ing this work several steps further, Calder has outlined an approach for an objective assessment of the risk involved in taking a ship through a given area, which
takes into account environmental effects, the nature of the seafloor, and potentially, the age of the prior survey and its technology. Combined with information on shipping traffic in the area, for example from AIS messages, an assessment of risk can be used to assess the knowledge contributed by a modern survey and therefore the relative return on investment of a survey being conducted. In principle, the area with the high-est return should be the highest on the resurvey priority list. Once calibrated, the model can pre-dict risk associated with transits within any cell of the analysis area, with or without the effects of unknowns—such as the poten-tial for unobserved rocks or other obstructions in the water, or un-certainties in the estimated bathy-metry of the area (Figure ES-13).
Figure ES-12. (Left) Prediction of marine debris top-left pane: study areas, and the best tracks (associated with peak winds) of the five hurricanes of interest. Predicted distribution density of marine debris in the Super Storm Sandy (top-right pane) and in the Gulf of Mexico (bottom pane) study areas. (Right) Example of DTM-based automatic detection algorithm for marine debris. The original inputs (showed on the first pane of the left) are analyzed using the CUBE standard deviation, the hypothesis count, and the hypothesis strength to recover information on the original soundings set (usually lost in pure XYZ surfaces).
Figure ES-13. Simple difference between estimated risk without and with predicted un-observed objects and other uncertainties. Higher values indicate larger potential for reduc-ing the estimated risk, and therefore are more persuasive targets for investment of survey resources.
JHC Performance Report
Executive Summary Executive Summary
30 January 2016 15
Executive Summary Executive Summary
Habitat and Water-Column MappingOur efforts to understand and calibrate the acoustic and optical sensors we use (SENSORS theme) and to develop software to process the data they produce in an efficient manner while minimizing and quantify-ing the uncertainty associated with the measurements (PROCESSING theme), are directed to the development of products that not only support safe navigation but that can also provide information critical to fisheries management and other environmental and engineering problems. These efforts focus on understanding and interpreting the backscatter (both from the seafloor and, with the recent advent of a new generation of multibeam sonars, in the water column) and gen-erating tools to use this information to provide key information useful to marine managers. Our initial efforts in acoustic seafloor characterization focused around the development of GeoCoder, a software package designed to produce fully- corrected backscatter mosaics, calculate a num-ber of backscatter statistics, and perform a constrained ARA (Angular Response Analysis) inversion that is designed to analyze the angular response of the backscatter as an approach to remote seafloor characterization. Although Geo-Coder has been implemented by a number of our industrial partners, many questions remain about the calibration of the sonars (e.g., work described in the SENSORS and PROCESSING sections) and the inherent nature of the approaches used to segment and characterize seafloor properties.
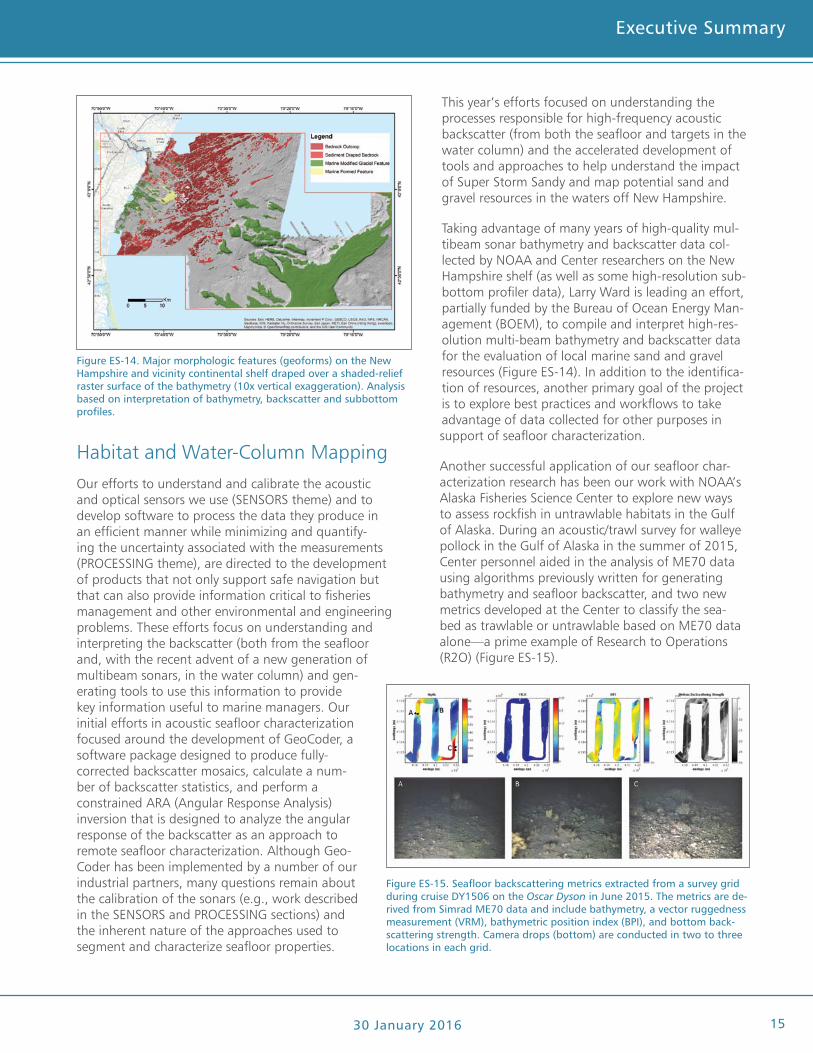
This year’s efforts focused on understanding the processes responsible for high-frequency acoustic backscatter (from both the seafloor and targets in the water column) and the accelerated development of tools and approaches to help understand the impact of Super Storm Sandy and map potential sand and gravel resources in the waters off New Hampshire.
Taking advantage of many years of high-quality mul-tibeam sonar bathymetry and backscatter data col-lected by NOAA and Center researchers on the New Hampshire shelf (as well as some high-resolution sub-bottom profiler data), Larry Ward is leading an effort, partially funded by the Bureau of Ocean Energy Man-agement (BOEM), to compile and interpret high-res-olution multi-beam bathymetry and backscatter data for the evaluation of local marine sand and gravel resources (Figure ES-14). In addition to the identifica-tion of resources, another primary goal of the project is to explore best practices and workflows to take advantage of data collected for other purposes in support of seafloor characterization.
Another successful application of our seafloor char-acterization research has been our work with NOAA’s Alaska Fisheries Science Center to explore new ways to assess rockfish in untrawlable habitats in the Gulf of Alaska. During an acoustic/trawl survey for walleye pollock in the Gulf of Alaska in the summer of 2015, Center personnel aided in the analysis of ME70 data using algorithms previously written for generating bathymetry and seafloor backscatter, and two new metrics developed at the Center to classify the sea-bed as trawlable or untrawlable based on ME70 data alone—a prime example of Research to Operations (R2O) (Figure ES-15).
Figure ES-14. Major morphologic features (geoforms) on the New Hampshire and vicinity continental shelf draped over a shaded-relief raster surface of the bathymetry (10x vertical exaggeration). Analysis based on interpretation of bathymetry, backscatter and subbottom profiles.
Figure ES-15. Seafloor backscattering metrics extracted from a survey grid during cruise DY1506 on the Oscar Dyson in June 2015. The metrics are de-rived from Simrad ME70 data and include bathymetry, a vector ruggedness measurement (VRM), bathymetric position index (BPI), and bottom back-scattering strength. Camera drops (bottom) are conducted in two to three locations in each grid.
JHC Performance Report16
Executive Summary Executive Summary
30 January 2016
Executive Summary Executive Summary
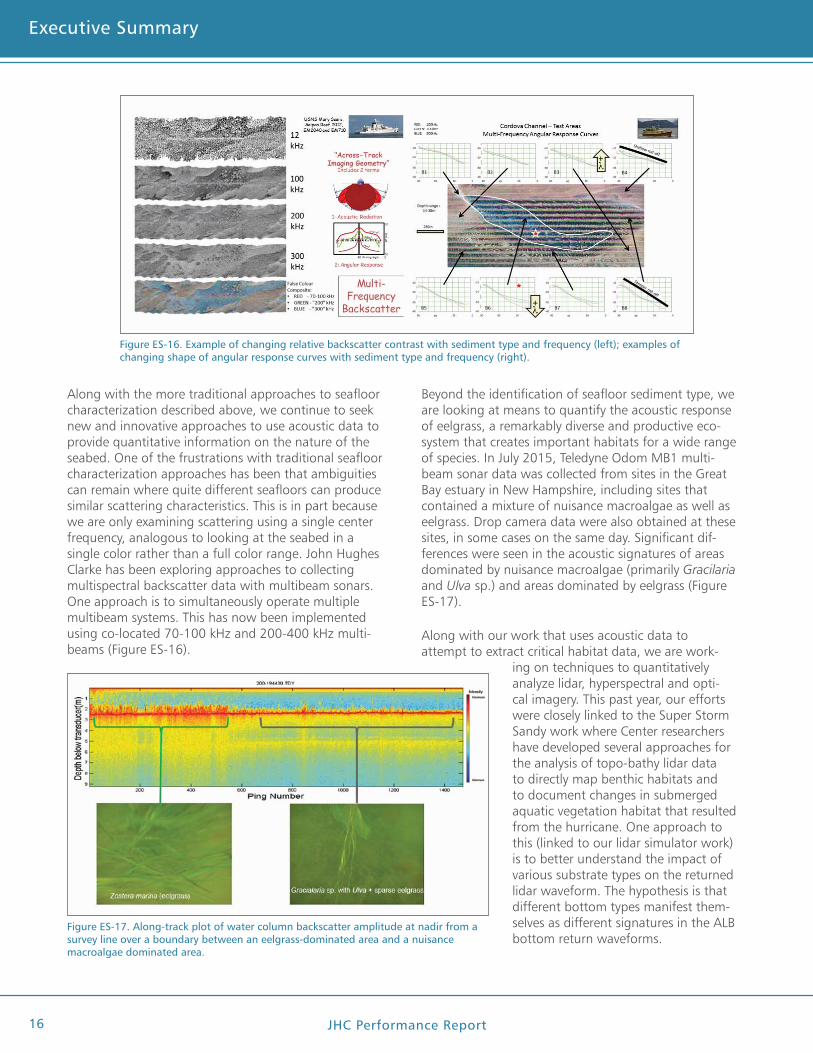
Along with the more traditional approaches to seafloor characterization described above, we continue to seek new and innovative approaches to use acoustic data to provide quantitative information on the nature of the seabed. One of the frustrations with traditional seafloor characterization approaches has been that ambiguities can remain where quite different seafloors can produce similar scattering characteristics. This is in part because we are only examining scattering using a single center frequency, analogous to looking at the seabed in a single color rather than a full color range. John Hughes Clarke has been exploring approaches to collecting multispectral backscatter data with multibeam sonars. One approach is to simultaneously operate multiple multibeam systems. This has now been implemented using co-located 70-100 kHz and 200-400 kHz multi-beams (Figure ES-16).
Beyond the identification of seafloor sediment type, we are looking at means to quantify the acoustic response of eelgrass, a remarkably diverse and productive eco-system that creates important habitats for a wide range of species. In July 2015, Teledyne Odom MB1 multi-beam sonar data was collected from sites in the Great Bay estuary in New Hampshire, including sites that contained a mixture of nuisance macroalgae as well as eelgrass. Drop camera data were also obtained at these sites, in some cases on the same day. Significant dif-ferences were seen in the acoustic signatures of areas dominated by nuisance macroalgae (primarily Gracilaria and Ulva sp.) and areas dominated by eelgrass (Figure ES-17).
Along with our work that uses acoustic data to attempt to extract critical habitat data, we are work-
ing on techniques to quantitatively analyze lidar, hyperspectral and opti-cal imagery. This past year, our efforts were closely linked to the Super Storm Sandy work where Center researchers have developed several approaches for the analysis of topo-bathy lidar data to directly map benthic habitats and to document changes in submerged aquatic vegetation habitat that resulted from the hurricane. One approach to this (linked to our lidar simulator work) is to better understand the impact of various substrate types on the returned lidar waveform. The hypothesis is that different bottom types manifest them-selves as different signatures in the ALB bottom return waveforms.
Figure ES-16. Example of changing relative backscatter contrast with sediment type and frequency (left); examples of changing shape of angular response curves with sediment type and frequency (right).
Figure ES-17. Along-track plot of water column backscatter amplitude at nadir from a survey line over a boundary between an eelgrass-dominated area and a nuisance macroalgae dominated area.
JHC Performance Report
Executive Summary Executive Summary
30 January 2016 17
Executive Summary Executive Summary
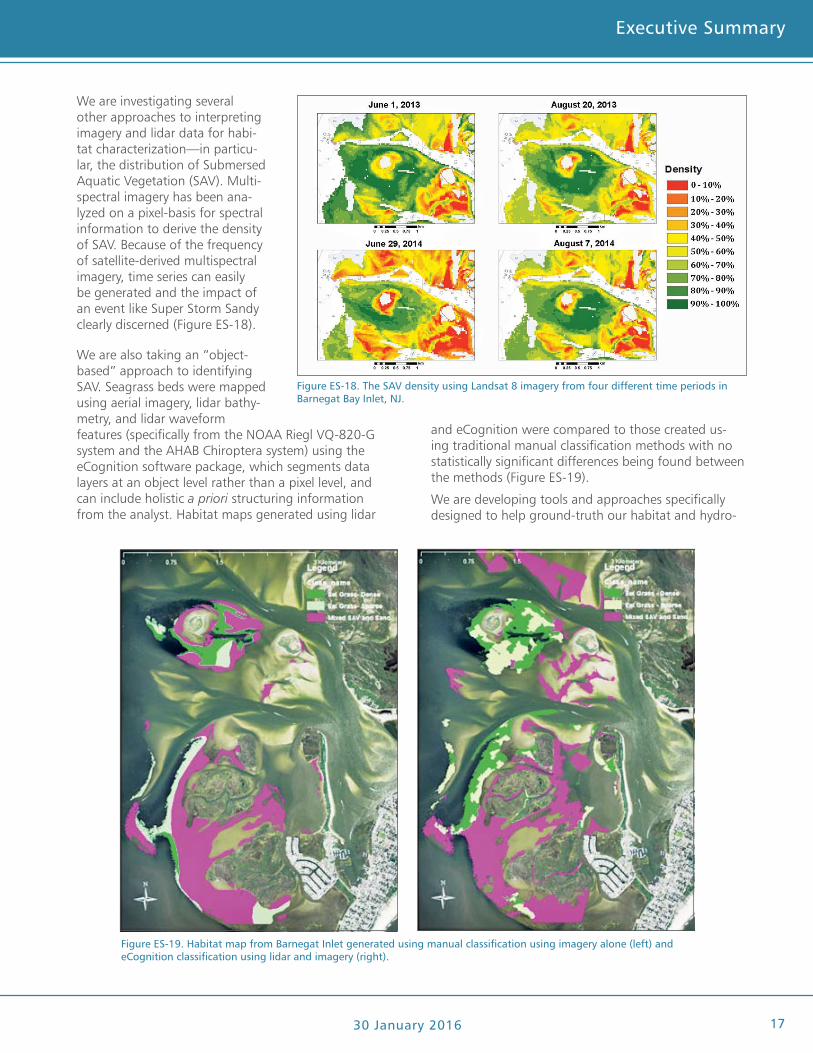
We are investigating several other approaches to interpreting imagery and lidar data for habi-tat characterization—in particu-lar, the distribution of Submersed Aquatic Vegetation (SAV). Multi-spectral imagery has been ana-lyzed on a pixel-basis for spectral information to derive the density of SAV. Because of the frequency of satellite-derived multispectral imagery, time series can easily be generated and the impact of an event like Super Storm Sandy clearly discerned (Figure ES-18).
We are also taking an “object-based” approach to identifying SAV. Seagrass beds were mapped using aerial imagery, lidar bathy-metry, and lidar waveform features (specifically from the NOAA Riegl VQ-820-G system and the AHAB Chiroptera system) using the eCognition software package, which segments data layers at an object level rather than a pixel level, and can include holistic a priori structuring information from the analyst. Habitat maps generated using lidar
and eCognition were compared to those created us-ing traditional manual classification methods with no statistically significant differences being found between the methods (Figure ES-19).
We are developing tools and approaches specifically designed to help ground-truth our habitat and hydro-
Figure ES-18. The SAV density using Landsat 8 imagery from four different time periods in Barnegat Bay Inlet, NJ.
Figure ES-19. Habitat map from Barnegat Inlet generated using manual classification using imagery alone (left) and eCognition classification using lidar and imagery (right).

JHC Performance Report18
Executive Summary Executive Summary
30 January 2016
Executive Summary Executive Summary
graphic studies. During conventional hydrographic operations, survey units are required to take sediment samples in order to determine, among other things, the suitability of an area for anchoring. Working with input from the NOAA Ship Hassler, Center researchers devel-oped a reliable and robust camera system that can be deployed readily by field personnel, and which matches the operational tempo of NOAA field units (Figure ES-20).
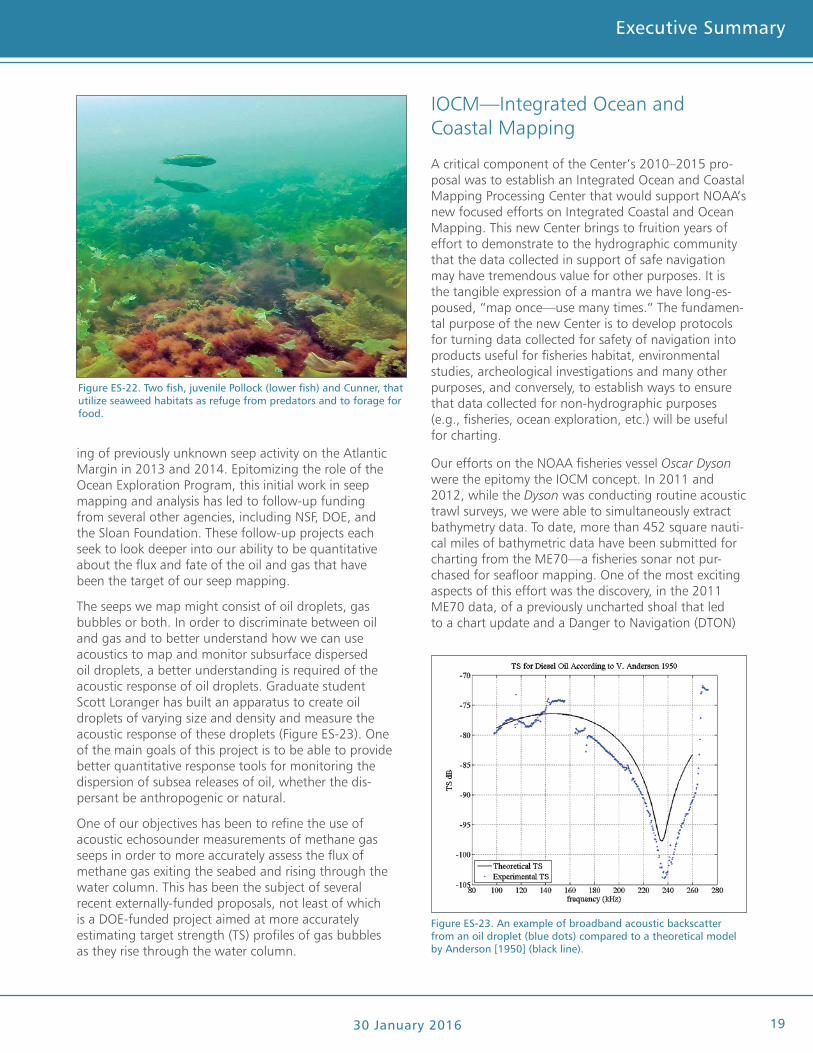
of connecting fish abundance and behavior patterns with native and non-native algal assemblages (Figure ES-22). The fish videos, in combination with our other data (e.g., video mosaics) will provide the opportunity to determine how non-native species affect ecosystem processes.
The efforts described above have focused on the sea-floor. A new generation of multibeam sonars now has the ability to simultaneously map both the seafloor and the water column. The ability to image the water col-umn and the seafloor over wide swaths with high-res-olution offers great opportunities for new applications and increased survey efficiencies. The Center has been very active in the development of new tools to capture, analyze and visualize water-column data and these tools proved extremely valuable in our efforts to map the deep oil plume and monitor the integrity of the Macondo wellhead during the Deepwater Horizon crisis (see the 2010 Annual Progress Report for a full descrip-tion of our activities related to Deepwater Horizon). Im-mediately following the Deepwater Horizon explosion and leak of the Macondo wellhead, we proposed using a 30 kHz multibeam sonar with water-column capabi-lity—a Kongsberg Maritime EM302—as a potential tool for mapping deep oil and gas spills and monitoring the well head for leaks. At the time of the spill, such a system was not available so we used fisheries sonars instead. In August and September of 2011, we finally had the opportunity to take the EM302 multibeam echo sounder on board the NOAA Ship Okeanos Explorer to the Gulf of Mexico and demonstrate the use of water-column data for the detection and character-ization of methane gas seeps over large areas. During
this relatively short cruise with less than two weeks of active mapping, we mapped 17,477 km2 of the northern Gulf of Mexico making 573 seep ob-servations. The results from this cruise suggested that wide-scale mapping of seeps in the deep Gulf of Mexico is viable—an objective that is important for both scientific and industry management perspectives.
The tools developed for map-ping oil and gas, originally in response to the Deepwater Horizon spill, have attracted a great deal of interest in the community and have fostered a number of follow-on studies, including the remarkable find-
Figure ES-20. Complete Grab Camera system with lightweight imaging frame.
Figure ES-21. Mosaic of a mixed seaweed assemblage at Nubble Light House in York, ME. Each color denotes a different seaweed species or free space.
We have also developed a suite of automated video mosaicking algorithms and software to generate mo-saics of benthic communities dominated by different algal species. These mosaics have been used as ground-truth for acoustic data and to spatially characterize benthic habitats at an unprecedented scale (Figure ES-21). In addition to seafloor video and acoustic data, fish behavior video has been collected with the goal
JHC Performance Report
Executive Summary Executive Summary
30 January 2016 19
Executive Summary Executive Summary
ing of previously unknown seep activity on the Atlantic Margin in 2013 and 2014. Epitomizing the role of the Ocean Exploration Program, this initial work in seep mapping and analysis has led to follow-up funding from several other agencies, including NSF, DOE, and the Sloan Foundation. These follow-up projects each seek to look deeper into our ability to be quantitative about the flux and fate of the oil and gas that have been the target of our seep mapping.
The seeps we map might consist of oil droplets, gas bubbles or both. In order to discriminate between oil and gas and to better understand how we can use acoustics to map and monitor subsurface dispersed oil droplets, a better understanding is required of the acoustic response of oil droplets. Graduate student Scott Loranger has built an apparatus to create oil droplets of varying size and density and measure the acoustic response of these droplets (Figure ES-23). One of the main goals of this project is to be able to provide better quantitative response tools for monitoring the dispersion of subsea releases of oil, whether the dis-persant be anthropogenic or natural.
One of our objectives has been to refine the use of acoustic echosounder measurements of methane gas seeps in order to more accurately assess the flux of methane gas exiting the seabed and rising through the water column. This has been the subject of several recent externally-funded proposals, not least of which is a DOE-funded project aimed at more accurately estimating target strength (TS) profiles of gas bubbles as they rise through the water column.
IOCM—Integrated Ocean and Coastal Mapping
A critical component of the Center’s 2010–2015 pro-posal was to establish an Integrated Ocean and Coastal Mapping Processing Center that would support NOAA’s new focused efforts on Integrated Coastal and Ocean Mapping. This new Center brings to fruition years of effort to demonstrate to the hydrographic community that the data collected in support of safe navigation may have tremendous value for other purposes. It is the tangible expression of a mantra we have long-es-poused, “map once—use many times.” The fundamen-tal purpose of the new Center is to develop protocols for turning data collected for safety of navigation into products useful for fisheries habitat, environmental studies, archeological investigations and many other purposes, and conversely, to establish ways to ensure that data collected for non-hydrographic purposes (e.g., fisheries, ocean exploration, etc.) will be useful for charting.
Our efforts on the NOAA fisheries vessel Oscar Dyson were the epitomy the IOCM concept. In 2011 and 2012, while the Dyson was conducting routine acoustic trawl surveys, we were able to simultaneously extract bathymetry data. To date, more than 452 square nauti-cal miles of bathymetric data have been submitted for charting from the ME70—a fisheries sonar not pur-chased for seafloor mapping. One of the most exciting aspects of this effort was the discovery, in the 2011 ME70 data, of a previously uncharted shoal that led to a chart update and a Danger to Navigation (DTON)
Figure ES-22. Two fish, juvenile Pollock (lower fish) and Cunner, that utilize seaweed habitats as refuge from predators and to forage for food.
Figure ES-23. An example of broadband acoustic backscatter from an oil droplet (blue dots) compared to a theoretical model by Anderson [1950] (black line).
JHC Performance Report20
Executive Summary Executive Summary
30 January 2016
Executive Summary Executive Summary
The collection of multipurpose data from NOAA hydro-graphic vessels (e.g., backscatter data that can be use-ful for habitat mapping) is only one aspect of the IOCM effort. Just as important is the design of protocols to ensure that as the fisheries vessels use their multibeam sonars they produce bathymetry and other outputs that can serve hydrographic and other purposes (ex-emplified in our work with the NOAA ME70 fisheries sonar on the NOAA Ship Oscar Dyson). The approaches developed at the Center are now being put into prac-tice. Simrad ME70 fisheries multibeam echosounders (MBES) are now installed on each of five NOAA Fisher-ies Survey Vessels (FSVs). Weber’s ME70 software for producing bathymetry and seafloor backscatter is being integrated with the Hypack acquisition software that is standardly used on these vessels (Figure ES-24). This integration enables the ME70 sonar to simultaneously collect water-column and bathymetric data, improving survey operations aboard the FSVs by increasing data collection, enabling visualization of ME70 bathymetry in real-time, and providing mapping and data process-ing tools.
Super Storm Sandy supplemental funding provided an accelerated opportunity to turn many of the on-going research projects in the lab into products needed to help understand and mitigate the impact of one of the worst storms recorded in U.S. history. This was achieved through funding of a research team (the Sandy Grant team under the supervision of Brian Calder) who developed a number of algorithms and processes specific to the Sandy need based on on-
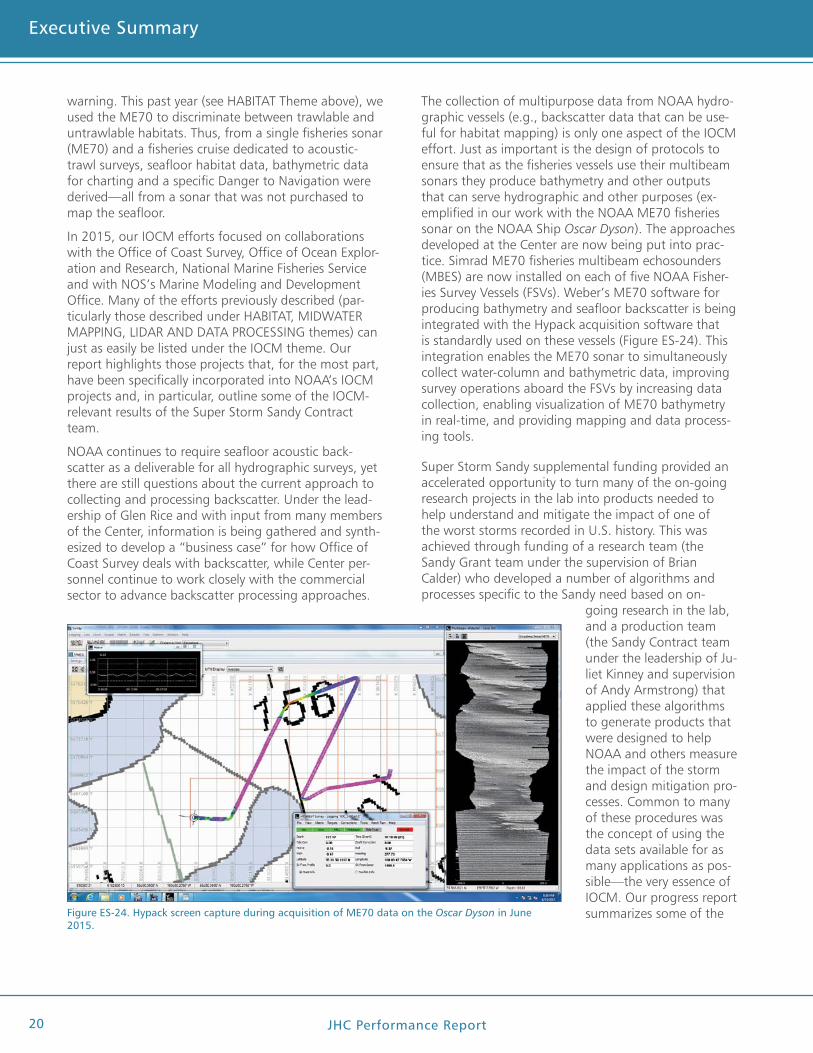
going research in the lab, and a production team (the Sandy Contract team under the leadership of Ju-liet Kinney and supervision of Andy Armstrong) that applied these algorithms to generate products that were designed to help NOAA and others measure the impact of the storm and design mitigation pro-cesses. Common to many of these procedures was the concept of using the data sets available for as many applications as pos-sible—the very essence of IOCM. Our progress report summarizes some of the Figure ES-24. Hypack screen capture during acquisition of ME70 data on the Oscar Dyson in June
2015.
warning. This past year (see HABITAT Theme above), we used the ME70 to discriminate between trawlable and untrawlable habitats. Thus, from a single fisheries sonar (ME70) and a fisheries cruise dedicated to acoustic-trawl surveys, seafloor habitat data, bathymetric data for charting and a specific Danger to Navigation were derived—all from a sonar that was not purchased to map the seafloor.
In 2015, our IOCM efforts focused on collaborations with the Office of Coast Survey, Office of Ocean Explor-ation and Research, National Marine Fisheries Service and with NOS’s Marine Modeling and Development Office. Many of the efforts previously described (par-ticularly those described under HABITAT, MIDWATER MAPPING, LIDAR AND DATA PROCESSING themes) can just as easily be listed under the IOCM theme. Our report highlights those projects that, for the most part, have been specifically incorporated into NOAA’s IOCM projects and, in particular, outline some of the IOCM-relevant results of the Super Storm Sandy Contract team.
NOAA continues to require seafloor acoustic back-scatter as a deliverable for all hydrographic surveys, yet there are still questions about the current approach to collecting and processing backscatter. Under the lead-ership of Glen Rice and with input from many members of the Center, information is being gathered and synth-esized to develop a “business case” for how Office of Coast Survey deals with backscatter, while Center per-sonnel continue to work closely with the commercial sector to advance backscatter processing approaches.
JHC Performance Report
Executive Summary Executive Summary
30 January 2016 21
Executive Summary Executive Summary
most relevant IOCM products that came out of this effort, including creating protocols for:
1. Bringing USGS Phase Measuring Bathymetric Sonar (PMBS) data into chart products;
2. Bringing third party (USGS and ACOE) multibeam sonar data into NOAA charts;
3. Integrating FEMA and state and local government collected single beam sonar products into NOAA charts;
4. Improving chart adequacy using merged source (multiple lidar, imagery, and sonar sources) data (Figure ES-24);
5. Use of USGS EAARL-B DEMS, Remote Sensing Division Lidar and USACE CZMIL data for charting;
6. Use of Remote Sensing Division Lidar for charting;
7. Producing habitat maps from EAARL-B reflectivity;
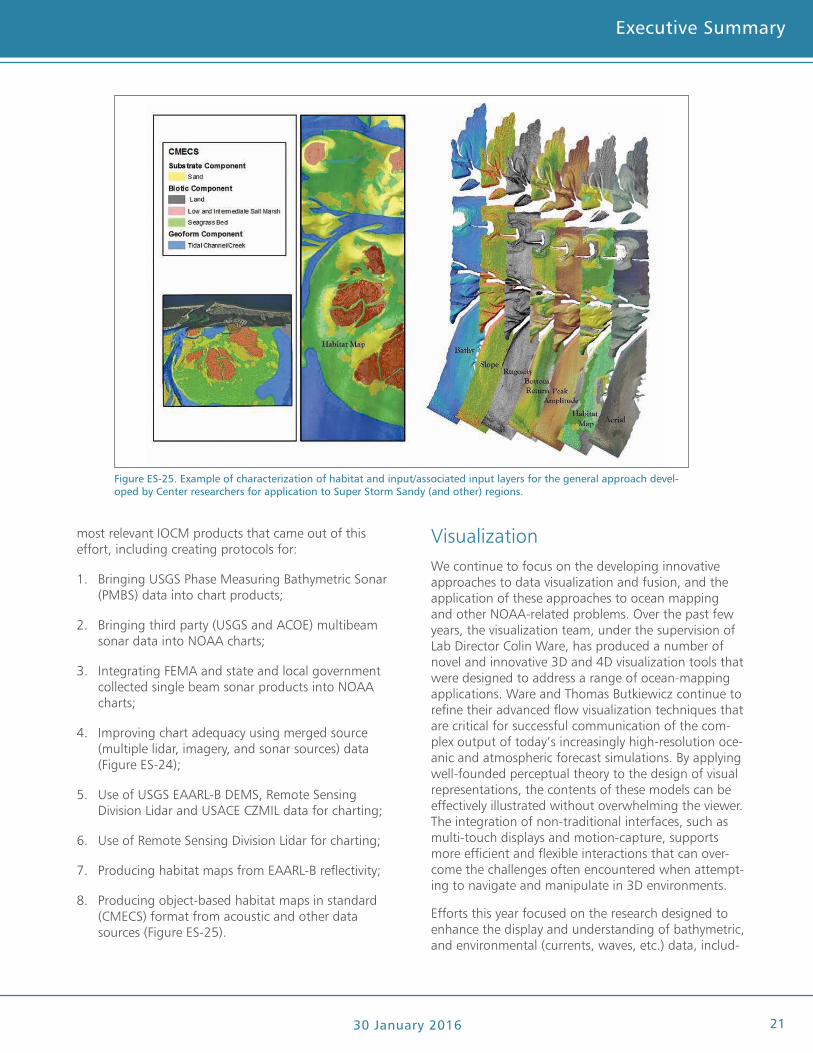
8. Producing object-based habitat maps in standard (CMECS) format from acoustic and other data sources (Figure ES-25).
VisualizationWe continue to focus on the developing innovative approaches to data visualization and fusion, and the application of these approaches to ocean mapping and other NOAA-related problems. Over the past few years, the visualization team, under the supervision of Lab Director Colin Ware, has produced a number of novel and innovative 3D and 4D visualization tools that were designed to address a range of ocean-mapping applications. Ware and Thomas Butkiewicz continue to refine their advanced flow visualization techniques that are critical for successful communication of the com-plex output of today’s increasingly high-resolution oce-anic and atmospheric forecast simulations. By applying well-founded perceptual theory to the design of visual representations, the contents of these models can be effectively illustrated without overwhelming the viewer. The integration of non-traditional interfaces, such as multi-touch displays and motion-capture, supports more efficient and flexible interactions that can over-come the challenges often encountered when attempt-ing to navigate and manipulate in 3D environments.
Efforts this year focused on the research designed to enhance the display and understanding of bathymetric, and environmental (currents, waves, etc.) data, includ-
Figure ES-25. Example of characterization of habitat and input/associated input layers for the general approach devel-oped by Center researchers for application to Super Storm Sandy (and other) regions.
JHC Performance Report22
Executive Summary Executive Summary
30 January 2016
Executive Summary Executive Summary
ing uncertainty; innovative approaches for interacting with complex ocean mapping data sets; tools to help oceanographers, hydrographers, ocean engineers, bio-logists and others interpret complex data from a variety of sensors, models and data sets; and several tools created specifically to support our Super Storm Sandy efforts, including those designed to help identify marine debris, and several outreach tools.
Included in these efforts are human factor studies to determine the optimal mode of display to help viewers correctly perceive the shape of 3D terrain/bathymetry models. Earlier research concluded that contours are extremely effective, even in a 3D environment. Based on this, Tom Butkiewicz is experimenting with a novel dynamic contour line algorithm which intelligently sub-divides contour lines to add more detail where needed, raising the question of whether it is possible to mix countable, fixed-interval contour lines with dynamically spaced contour lines in the same presentation. This work is being further extended to determine the opti-mal methods to illustrate dynamically changing bathy-metry surfaces within 4D visualizations.
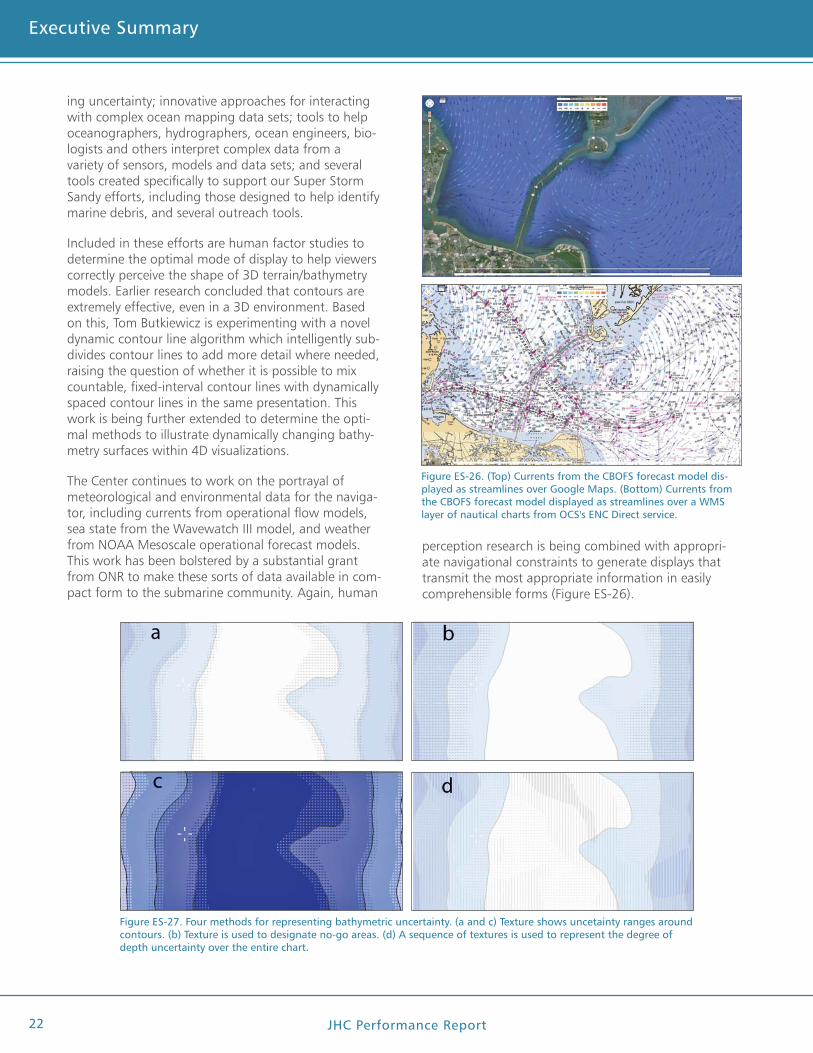
The Center continues to work on the portrayal of meteorological and environmental data for the naviga-tor, including currents from operational flow models, sea state from the Wavewatch III model, and weather from NOAA Mesoscale operational forecast models. This work has been bolstered by a substantial grant from ONR to make these sorts of data available in com-pact form to the submarine community. Again, human
perception research is being combined with appropri-ate navigational constraints to generate displays that transmit the most appropriate information in easily comprehensible forms (Figure ES-26).
Figure ES-26. (Top) Currents from the CBOFS forecast model dis-played as streamlines over Google Maps. (Bottom) Currents from the CBOFS forecast model displayed as streamlines over a WMS layer of nautical charts from OCS's ENC Direct service.
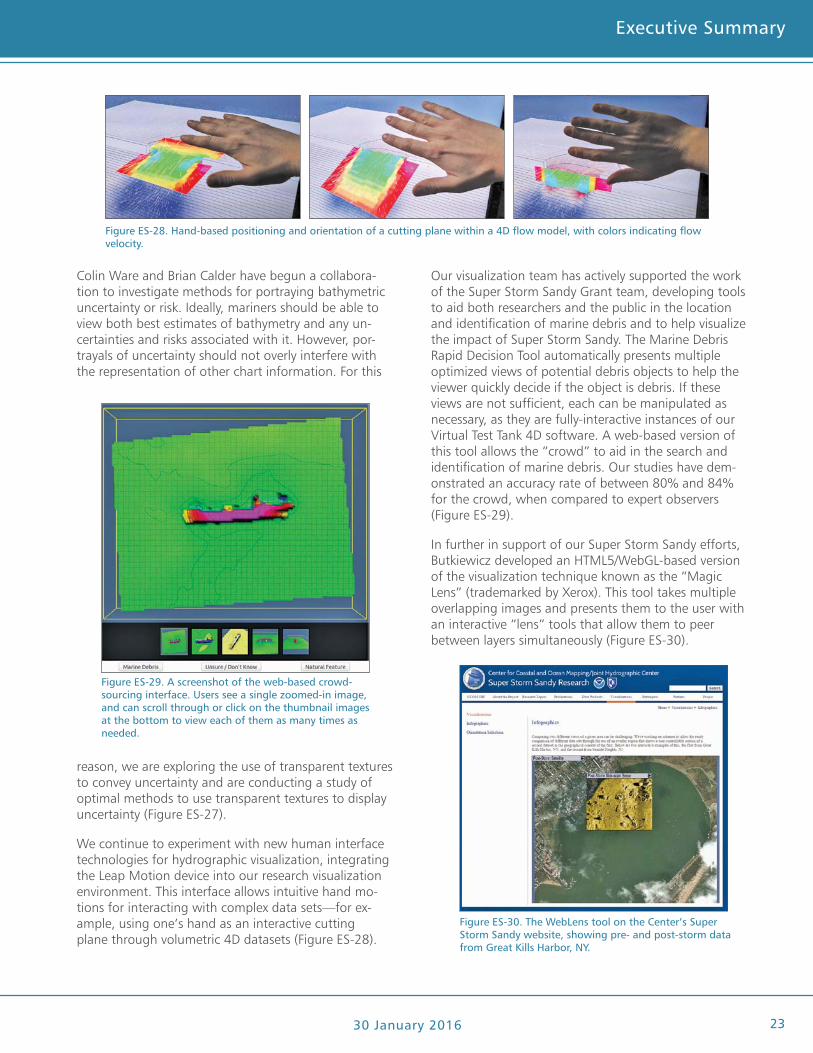
Figure ES-27. Four methods for representing bathymetric uncertainty. (a and c) Texture shows uncetainty ranges around contours. (b) Texture is used to designate no-go areas. (d) A sequence of textures is used to represent the degree of depth uncertainty over the entire chart.
JHC Performance Report
Executive Summary Executive Summary
30 January 2016 23
Executive Summary Executive Summary
Colin Ware and Brian Calder have begun a collabora-tion to investigate methods for portraying bathymetric uncertainty or risk. Ideally, mariners should be able to view both best estimates of bathymetry and any un-certainties and risks associated with it. However, por-trayals of uncertainty should not overly interfere with the representation of other chart information. For this
Our visualization team has actively supported the work of the Super Storm Sandy Grant team, developing tools to aid both researchers and the public in the location and identification of marine debris and to help visualize the impact of Super Storm Sandy. The Marine Debris Rapid Decision Tool automatically presents multiple optimized views of potential debris objects to help the viewer quickly decide if the object is debris. If these views are not sufficient, each can be manipulated as necessary, as they are fully-interactive instances of our Virtual Test Tank 4D software. A web-based version of this tool allows the “crowd” to aid in the search and identification of marine debris. Our studies have dem-onstrated an accuracy rate of between 80% and 84% for the crowd, when compared to expert observers (Figure ES-29).
In further in support of our Super Storm Sandy efforts, Butkiewicz developed an HTML5/WebGL-based version of the visualization technique known as the “Magic Lens” (trademarked by Xerox). This tool takes multiple overlapping images and presents them to the user with an interactive “lens” tools that allow them to peer between layers simultaneously (Figure ES-30).
Figure ES-28. Hand-based positioning and orientation of a cutting plane within a 4D flow model, with colors indicating flow velocity.
Figure ES-29. A screenshot of the web-based crowd-sourcing interface. Users see a single zoomed-in image, and can scroll through or click on the thumbnail images at the bottom to view each of them as many times as needed.
Figure ES-30. The WebLens tool on the Center’s Super Storm Sandy website, showing pre- and post-storm data from Great Kills Harbor, NY.
reason, we are exploring the use of transparent textures to convey uncertainty and are conducting a study of optimal methods to use transparent textures to display uncertainty (Figure ES-27).
We continue to experiment with new human interface technologies for hydrographic visualization, integrating the Leap Motion device into our research visualization environment. This interface allows intuitive hand mo-tions for interacting with complex data sets—for ex-ample, using one’s hand as an interactive cutting plane through volumetric 4D datasets (Figure ES-28).
JHC Performance Report24
Executive Summary Executive Summary
30 January 2016
Executive Summary Executive Summary
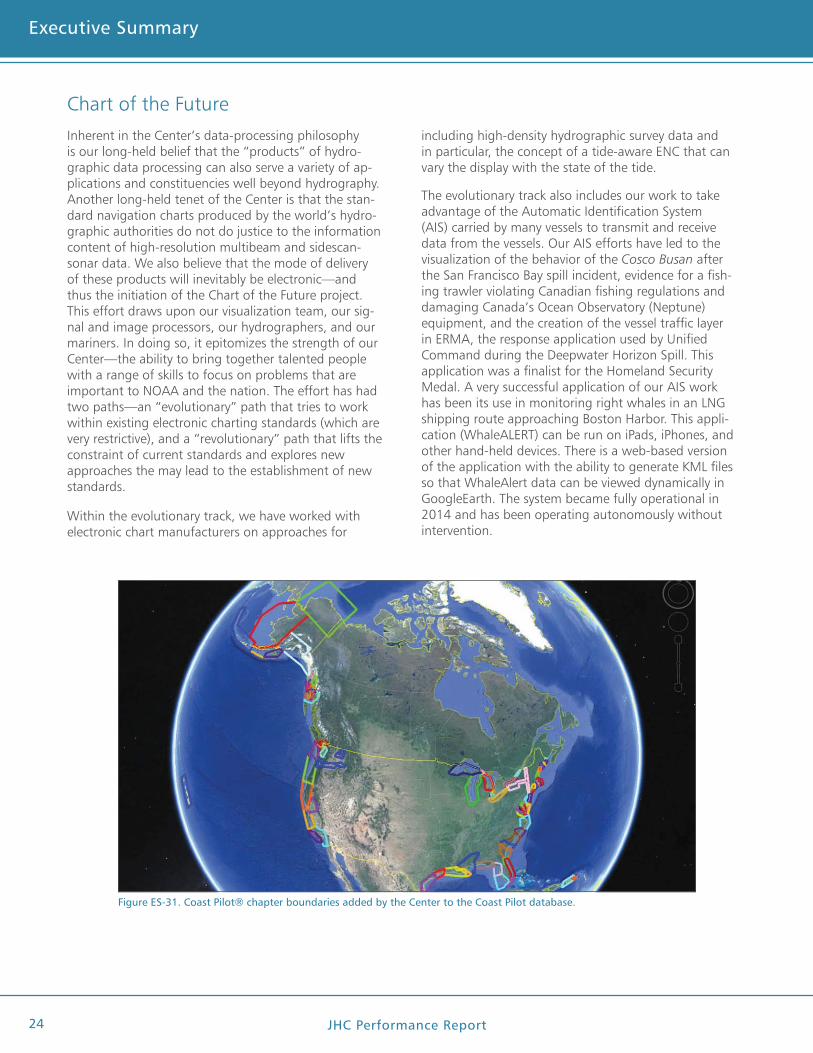
Chart of the FutureInherent in the Center’s data-processing philosophy is our long-held belief that the “products” of hydro-graphic data processing can also serve a variety of ap-plications and constituencies well beyond hydrography. Another long-held tenet of the Center is that the stan-dard navigation charts produced by the world’s hydro-graphic authorities do not do justice to the information content of high-resolution multibeam and sidescan-sonar data. We also believe that the mode of delivery of these products will inevitably be electronic—and thus the initiation of the Chart of the Future project. This effort draws upon our visualization team, our sig-nal and image processors, our hydrographers, and our mariners. In doing so, it epitomizes the strength of our Center—the ability to bring together talented people with a range of skills to focus on problems that are important to NOAA and the nation. The effort has had two paths—an “evolutionary” path that tries to work within existing electronic charting standards (which are very restrictive), and a “revolutionary” path that lifts the constraint of current standards and explores new approaches the may lead to the establishment of new standards.
Within the evolutionary track, we have worked with electronic chart manufacturers on approaches for
Figure ES-31. Coast Pilot® chapter boundaries added by the Center to the Coast Pilot database.
including high-density hydrographic survey data and in particular, the concept of a tide-aware ENC that can vary the display with the state of the tide.
The evolutionary track also includes our work to take advantage of the Automatic Identification System (AIS) carried by many vessels to transmit and receive data from the vessels. Our AIS efforts have led to the visualization of the behavior of the Cosco Busan after the San Francisco Bay spill incident, evidence for a fish-ing trawler violating Canadian fishing regulations and damaging Canada’s Ocean Observatory (Neptune) equipment, and the creation of the vessel traffic layer in ERMA, the response application used by Unified Command during the Deepwater Horizon Spill. This application was a finalist for the Homeland Security Medal. A very successful application of our AIS work has been its use in monitoring right whales in an LNG shipping route approaching Boston Harbor. This appli-cation (WhaleALERT) can be run on iPads, iPhones, and other hand-held devices. There is a web-based version of the application with the ability to generate KML files so that WhaleAlert data can be viewed dynamically in GoogleEarth. The system became fully operational in 2014 and has been operating autonomously without intervention.
JHC Performance Report
Executive Summary Executive Summary
30 January 2016 25
Executive Summary Executive Summary
The revolutionary track for the Chart of the Future involves 3D and 4D displays and much more interactiv-ity (see VISUALIZATION Theme). In the last few years, another focus of this effort has been the development of GeoCoastPilot, a research software application built to explore techniques to simplify access to the naviga-tion information that a mariner needs prior to entering or leaving port. GeoCoastPilot is not intended to be used directly for navigation purposes but, instead, is intended to demonstrate what is possible with current technology and to facilitate technology transfer. With such a digital product, a mariner could, in real-time on the vessel or before entering a harbor, explore, with the click of a mouse, any object identified in the text and see a pictorial representation (in 2D or 3D) of the object in a geospatial context. Conversely, a click on a picture of an object will directly link to the full descrip-tion of the object, as well as other relevant information. GeoCoastPilot turns the NOAA Coast Pilot manual into an interactive document linked to a 3D map environ-ment that provides connections between the written text; 2D and 3D views; web content; and other primary sources such as charts, maps, and related federal regu-lations. This visualization technique helps the mariner become familiar with the relative location of critical navigation-related features within a port before ever going there.
Our efforts in 2015 focused on going beyond the pro-totype and working directly with OCS-derived Coastal Pilot data. In collaboration with the OCS Coast Pilot team, Briana Sullivan is now working with the OCS
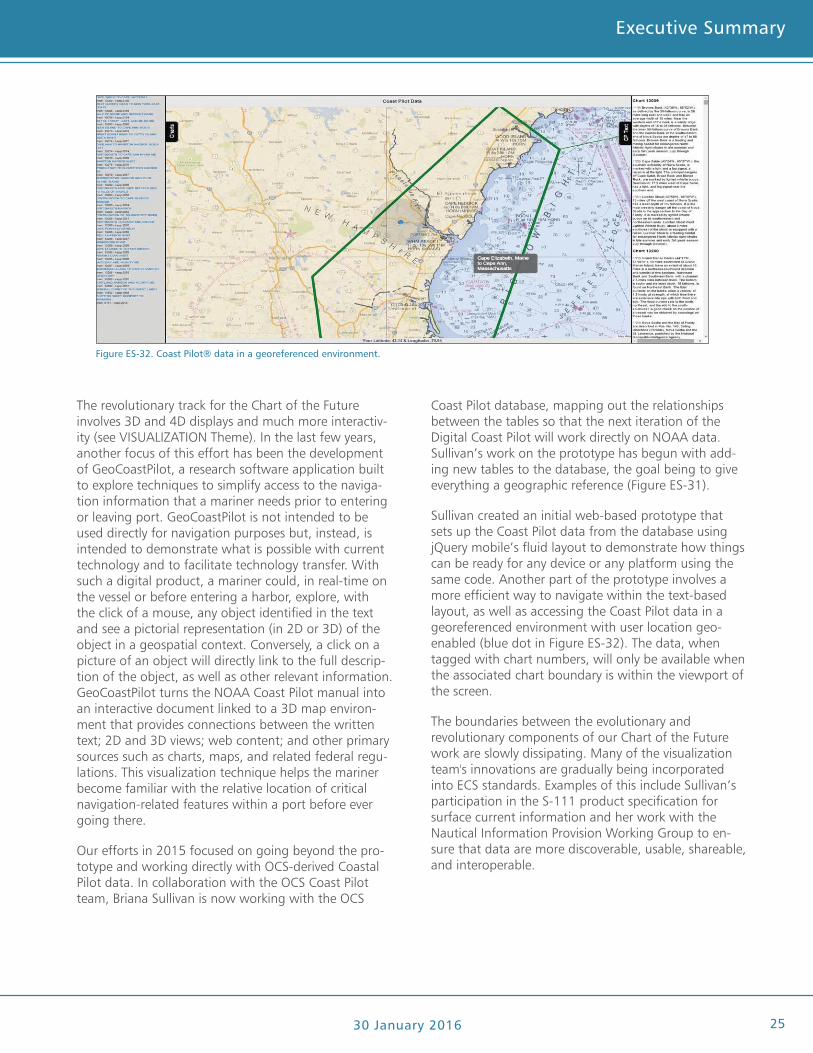
Coast Pilot database, mapping out the relationships between the tables so that the next iteration of the Digital Coast Pilot will work directly on NOAA data. Sullivan’s work on the prototype has begun with add-ing new tables to the database, the goal being to give everything a geographic reference (Figure ES-31).
Sullivan created an initial web-based prototype that sets up the Coast Pilot data from the database using jQuery mobile’s fluid layout to demonstrate how things can be ready for any device or any platform using the same code. Another part of the prototype involves a more efficient way to navigate within the text-based layout, as well as accessing the Coast Pilot data in a georeferenced environment with user location geo-enabled (blue dot in Figure ES-32). The data, when tagged with chart numbers, will only be available when the associated chart boundary is within the viewport of the screen.
The boundaries between the evolutionary and revolutionary components of our Chart of the Future work are slowly dissipating. Many of the visualization team's innovations are gradually being incorporated into ECS standards. Examples of this include Sullivan’s participation in the S-111 product specification for surface current information and her work with the Nautical Information Provision Working Group to en-sure that data are more discoverable, usable, shareable, and interoperable.
Figure ES-32. Coast Pilot® data in a georeferenced environment.
JHC Performance Report26
Executive Summary Executive Summary
30 January 2016
Executive Summary Executive Summary
Law of the SeaRecognizing that the implemention the United Nations Convention on the Law of the Sea (UNCLOS) could confer sovereign rights and management author-ity over large—and potentially resource-rich—areas of the seabed beyond our current 200 nautical mile limit, Congress (through NOAA) funded the Center to evaluate the content and completeness of the nation’s bathymetric and geophysical data holdings in areas sur-rounding our Exclusive Economic Zone, or EEZ (www.ccom.unh.edu/unclos). Following up on the recom-mendations made in the UNH study, Congress has funded the Center through NOAA to collect new multi-beam sonar data in support of a potential submission for an Extended Continental Shelf (ECS) under UNCLOS Article 76.
Since 2003, Center staff have participated in 28 cruises, surveying regions of the Bering Sea, the Gulf of Alaska, the Atlantic margin, the ice-covered Arctic, the Gulf of Mexico, and the eastern, central and western Pacific Ocean. We have collected 2,450,000 km2 of bathy-metry and backscatter data that provide an unprece-dented high-resolution view of the seafloor. These data are revolutionizing our understanding of many geologi-
cal processes on the margins and will result in signifi-cant additions to a potential U.S. ECS under UNCLOS, particularly in the Arctic.
Two ECS cruises were competed in 2015—a 30-day cruise in the Atlantic aboard the R/V Langseth and a 30-day expedition in the Kingman/Palmyra region of the Pacific aboard the R/V Kilo Moana. The Atlantic cruise, led by Brian Calder, was the fifth UNH cruise to this area, collecting 157,166 km2 of high-resolution multibeam bathymetry and backscatter data and com-pleting the needed coverage of the Atlantic for ECS purposes (Figure ES-33). Post-cruise, Jim Gardner and Paul Johnson archived data (at both the Center and NCEI in Boulder), generated metadata, and created derivative products from the data.
The second 2015 ECS cruise to the Kingman Reef- Palmyra Atoll area of the central Equatorial Pacific, again led by Brian Calder, collected 164,200 km2 of high-resolution multibeam sonar and backscatter with the objective of mapping the northern extent of the Line Islands platform, a broad feature that rises as much as 1000 m above the adjacent deep-sea floor
Figure ES-33. 2015 Langseth survey added on to previous ECS data.
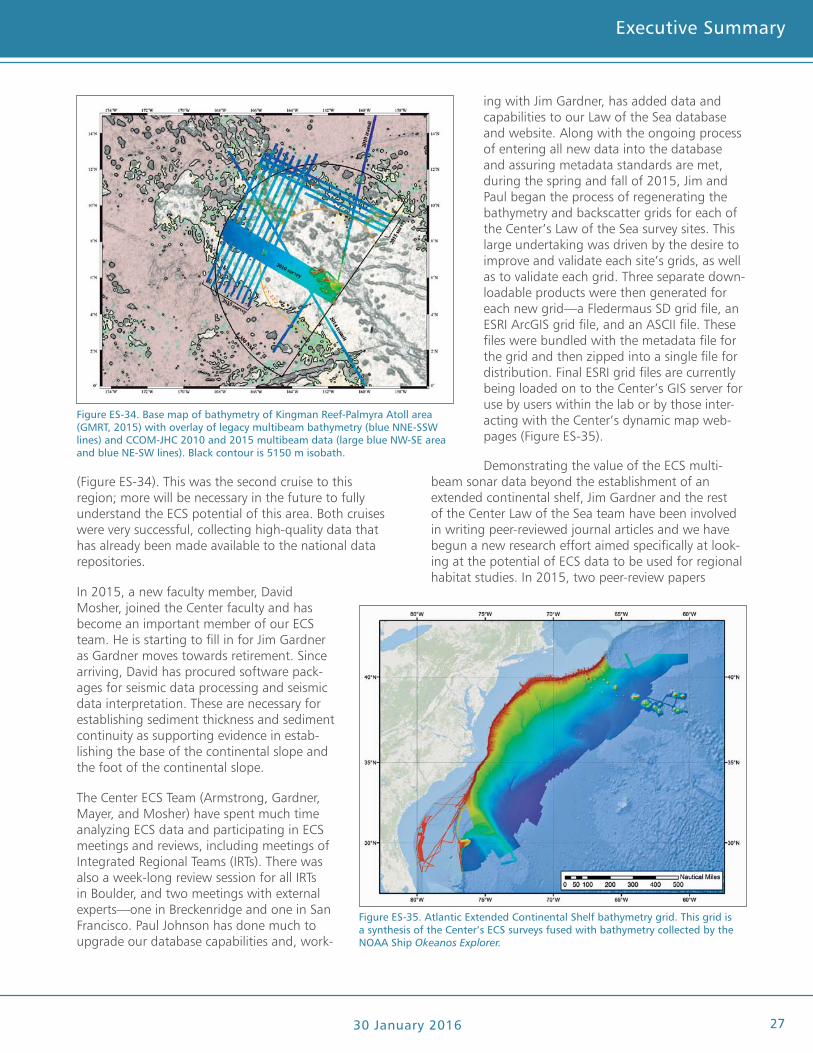
JHC Performance Report
Executive Summary Executive Summary
30 January 2016 27
Executive Summary Executive Summary
(Figure ES-34). This was the second cruise to this region; more will be necessary in the future to fully understand the ECS potential of this area. Both cruises were very successful, collecting high-quality data that has already been made available to the national data repositories.
In 2015, a new faculty member, David Mosher, joined the Center faculty and has become an important member of our ECS team. He is starting to fill in for Jim Gardner as Gardner moves towards retirement. Since arriving, David has procured software pack-ages for seismic data processing and seismic data interpretation. These are necessary for establishing sediment thickness and sediment continuity as supporting evidence in estab-lishing the base of the continental slope and the foot of the continental slope.
The Center ECS Team (Armstrong, Gardner, Mayer, and Mosher) have spent much time analyzing ECS data and participating in ECS meetings and reviews, including meetings of Integrated Regional Teams (IRTs). There was also a week-long review session for all IRTs in Boulder, and two meetings with external experts—one in Breckenridge and one in San Francisco. Paul Johnson has done much to upgrade our database capabilities and, work-
ing with Jim Gardner, has added data and capabilities to our Law of the Sea database and website. Along with the ongoing process of entering all new data into the database and assuring metadata standards are met, during the spring and fall of 2015, Jim and Paul began the process of regenerating the bathymetry and backscatter grids for each of the Center’s Law of the Sea survey sites. This large undertaking was driven by the desire to improve and validate each site’s grids, as well as to validate each grid. Three separate down-loadable products were then generated for each new grid—a Fledermaus SD grid file, an ESRI ArcGIS grid file, and an ASCII file. These files were bundled with the metadata file for the grid and then zipped into a single file for distribution. Final ESRI grid files are currently being loaded on to the Center’s GIS server for use by users within the lab or by those inter-acting with the Center’s dynamic map web-pages (Figure ES-35).
Demonstrating the value of the ECS multi-beam sonar data beyond the establishment of an extended continental shelf, Jim Gardner and the rest of the Center Law of the Sea team have been involved in writing peer-reviewed journal articles and we have begun a new research effort aimed specifically at look-ing at the potential of ECS data to be used for regional habitat studies. In 2015, two peer-review papers
Figure ES-34. Base map of bathymetry of Kingman Reef-Palmyra Atoll area (GMRT, 2015) with overlay of legacy multibeam bathymetry (blue NNE-SSW lines) and CCOM-JHC 2010 and 2015 multibeam data (large blue NW-SE area and blue NE-SW lines). Black contour is 5150 m isobath.
Figure ES-35. Atlantic Extended Continental Shelf bathymetry grid. This grid is a synthesis of the Center’s ECS surveys fused with bathymetry collected by the NOAA Ship Okeanos Explorer.
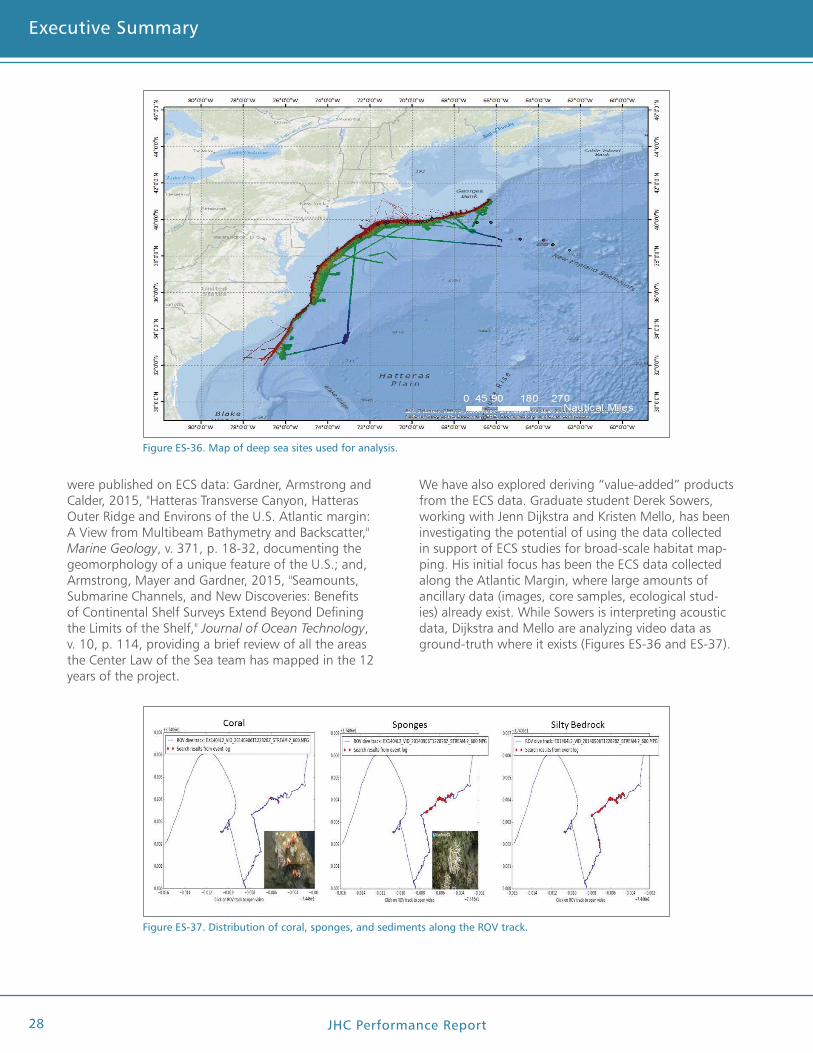
JHC Performance Report28
Executive Summary Executive Summary
30 January 2016
Executive Summary Executive Summary
were published on ECS data: Gardner, Armstrong and Calder, 2015, "Hatteras Transverse Canyon, Hatteras Outer Ridge and Environs of the U.S. Atlantic margin: A View from Multibeam Bathymetry and Backscatter," Marine Geology, v. 371, p. 18-32, documenting the geomorphology of a unique feature of the U.S.; and, Armstrong, Mayer and Gardner, 2015, "Seamounts, Submarine Channels, and New Discoveries: Benefits of Continental Shelf Surveys Extend Beyond Defining the Limits of the Shelf," Journal of Ocean Technology, v. 10, p. 114, providing a brief review of all the areas the Center Law of the Sea team has mapped in the 12 years of the project.
Figure ES-37. Distribution of coral, sponges, and sediments along the ROV track.
Figure ES-36. Map of deep sea sites used for analysis.
We have also explored deriving “value-added” products from the ECS data. Graduate student Derek Sowers, working with Jenn Dijkstra and Kristen Mello, has been investigating the potential of using the data collected in support of ECS studies for broad-scale habitat map-ping. His initial focus has been the ECS data collected along the Atlantic Margin, where large amounts of ancillary data (images, core samples, ecological stud-ies) already exist. While Sowers is interpreting acoustic data, Dijkstra and Mello are analyzing video data as ground-truth where it exists (Figures ES-36 and ES-37).
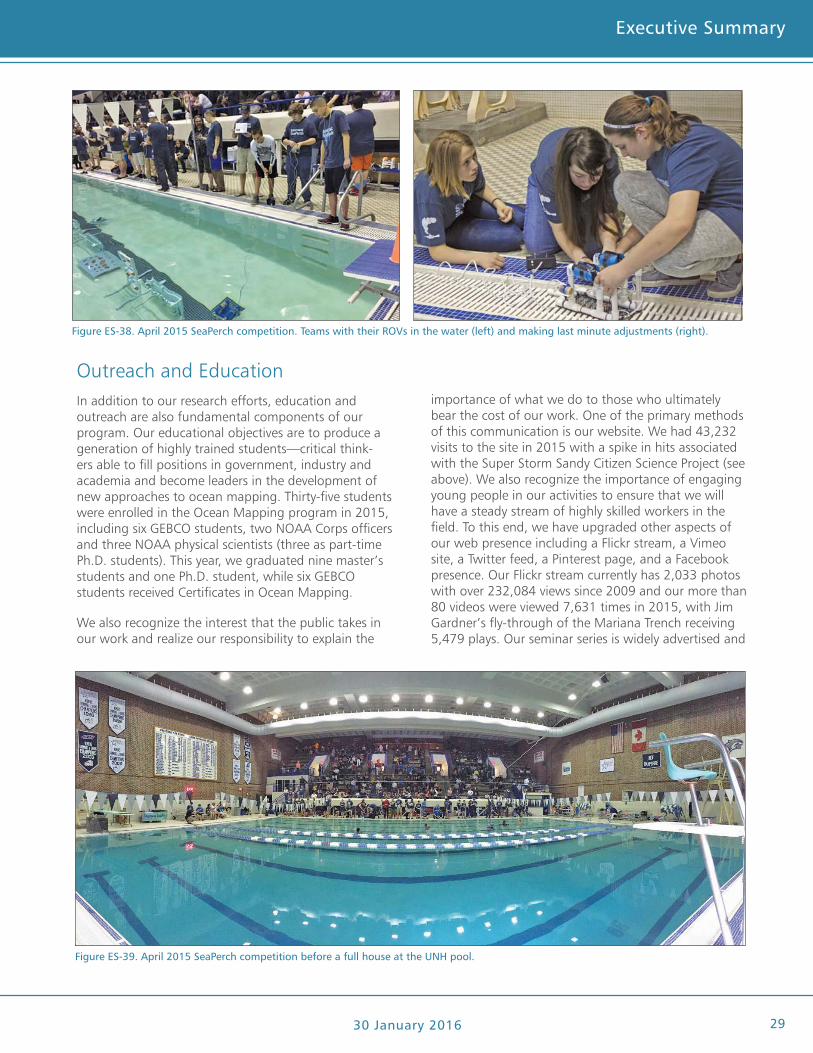
JHC Performance Report
Executive Summary Executive Summary
30 January 2016 29
Executive Summary Executive Summary
importance of what we do to those who ultimately bear the cost of our work. One of the primary methods of this communication is our website. We had 43,232 visits to the site in 2015 with a spike in hits associated with the Super Storm Sandy Citizen Science Project (see above). We also recognize the importance of engaging young people in our activities to ensure that we will have a steady stream of highly skilled workers in the field. To this end, we have upgraded other aspects of our web presence including a Flickr stream, a Vimeo site, a Twitter feed, a Pinterest page, and a Facebook presence. Our Flickr stream currently has 2,033 photos with over 232,084 views since 2009 and our more than 80 videos were viewed 7,631 times in 2015, with Jim Gardner’s fly-through of the Mariana Trench receiving 5,479 plays. Our seminar series is widely advertised and
Outreach and EducationIn addition to our research efforts, education and outreach are also fundamental components of our program. Our educational objectives are to produce a generation of highly trained students—critical think-ers able to fill positions in government, industry and academia and become leaders in the development of new approaches to ocean mapping. Thirty-five students were enrolled in the Ocean Mapping program in 2015, including six GEBCO students, two NOAA Corps officers and three NOAA physical scientists (three as part-time Ph.D. students). This year, we graduated nine master’s students and one Ph.D. student, while six GEBCO students received Certificates in Ocean Mapping.
We also recognize the interest that the public takes in our work and realize our responsibility to explain the
Figure ES-38. April 2015 SeaPerch competition. Teams with their ROVs in the water (left) and making last minute adjustments (right).
Figure ES-39. April 2015 SeaPerch competition before a full house at the UNH pool.
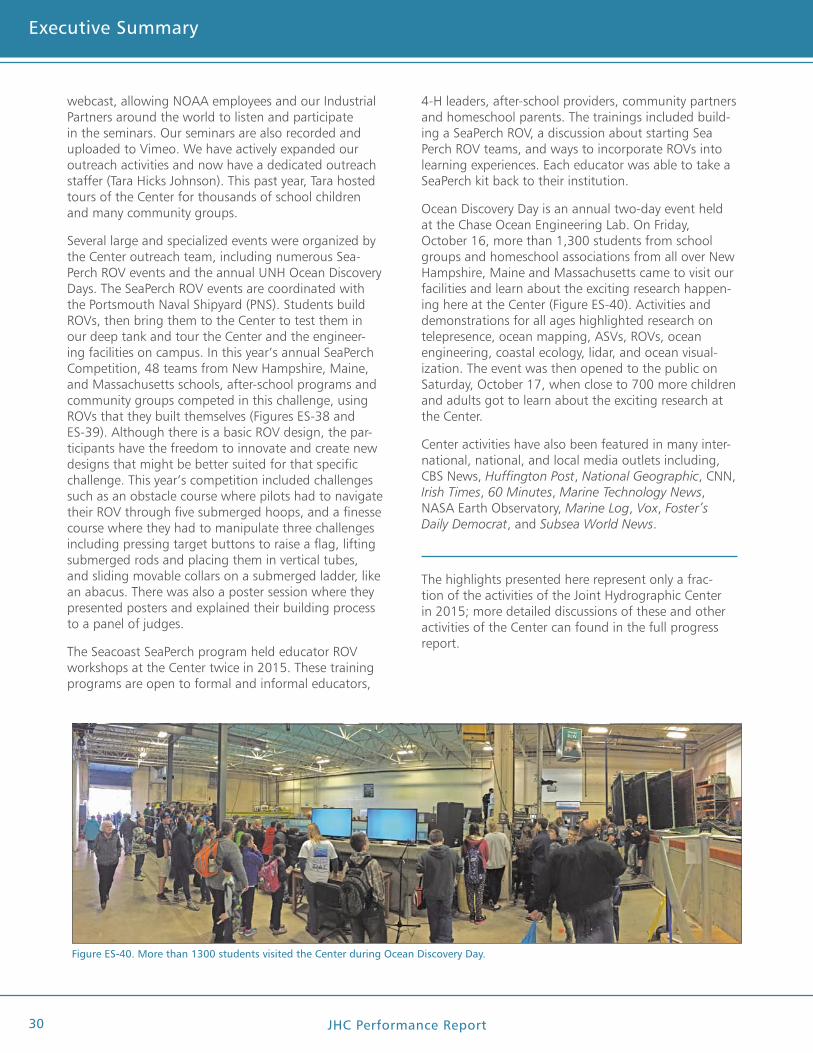
JHC Performance Report30
Executive Summary Executive Summary
30 January 2016
Executive Summary Executive Summary
Figure ES-40. More than 1300 students visited the Center during Ocean Discovery Day.
webcast, allowing NOAA employees and our Industrial Partners around the world to listen and participate in the seminars. Our seminars are also recorded and uploaded to Vimeo. We have actively expanded our outreach activities and now have a dedicated outreach staffer (Tara Hicks Johnson). This past year, Tara hosted tours of the Center for thousands of school children and many community groups.
Several large and specialized events were organized by the Center outreach team, including numerous Sea- Perch ROV events and the annual UNH Ocean Discovery Days. The SeaPerch ROV events are coordinated with the Portsmouth Naval Shipyard (PNS). Students build ROVs, then bring them to the Center to test them in our deep tank and tour the Center and the engineer-ing facilities on campus. In this year’s annual SeaPerch Competition, 48 teams from New Hampshire, Maine, and Massachusetts schools, after-school programs and community groups competed in this challenge, using ROVs that they built themselves (Figures ES-38 and ES-39). Although there is a basic ROV design, the par-ticipants have the freedom to innovate and create new designs that might be better suited for that specific challenge. This year’s competition included challenges such as an obstacle course where pilots had to navigate their ROV through five submerged hoops, and a finesse course where they had to manipulate three challenges including pressing target buttons to raise a flag, lifting submerged rods and placing them in vertical tubes, and sliding movable collars on a submerged ladder, like an abacus. There was also a poster session where they presented posters and explained their building process to a panel of judges.
The Seacoast SeaPerch program held educator ROV workshops at the Center twice in 2015. These training programs are open to formal and informal educators,
4-H leaders, after-school providers, community partners and homeschool parents. The trainings included build-ing a SeaPerch ROV, a discussion about starting Sea Perch ROV teams, and ways to incorporate ROVs into learning experiences. Each educator was able to take a SeaPerch kit back to their institution.
Ocean Discovery Day is an annual two-day event held at the Chase Ocean Engineering Lab. On Friday, October 16, more than 1,300 students from school groups and homeschool associations from all over New Hampshire, Maine and Massachusetts came to visit our facilities and learn about the exciting research happen-ing here at the Center (Figure ES-40). Activities and demonstrations for all ages highlighted research on telepresence, ocean mapping, ASVs, ROVs, ocean engineering, coastal ecology, lidar, and ocean visual-ization. The event was then opened to the public on Saturday, October 17, when close to 700 more children and adults got to learn about the exciting research at the Center.
Center activities have also been featured in many inter-national, national, and local media outlets including, CBS News, Huffington Post, National Geographic, CNN, Irish Times, 60 Minutes, Marine Technology News, NASA Earth Observatory, Marine Log, Vox, Foster’s Daily Democrat, and Subsea World News.
The highlights presented here represent only a frac-tion of the activities of the Joint Hydrographic Center in 2015; more detailed discussions of these and other activities of the Center can found in the full progress report.
JHC Performance Report
Executive Summary Executive Summary
30 January 2016 31
Executive Summary Executive Summary
NOAA/UNH Joint Hydrographic Center 2015 Research to Operations Initiatives Since its inception, the NOAA/UNH Joint Hydrographic Center has taken pride in its efforts to turn the research projects undertaken by the Center into practical operational tools that serve NOAA and the nation. Examples of past successes are the CUBE and GeoCoder algorithms, both of which are now in widespread use by NOAA and other U.S. agencies, by hydrographic agencies worldwide, and by academics and the private sector. The concept of turning research into practical operational tools has now been formalized within NOAA under the label of “Research to Operations” (R2O) and, in this report, we briefly outline those aspects of our 2015 research endeavors that we believe qualify as successful examples of R20. A more detailed description of these research endeavors can be found in the JHC 2015 Annual Performance and Progress Report at www.ccom.unh.edu/reports.
Sensor Research Theme
• New item: Autonomous Surface Vehicles for Hydrographic Applications. Graduate student and NOAA Corps Officer LTJG Damian Manda’s thesis work focuses on the development of small auto- nomous surface vehicles with hydrographic surveying targeted behaviors. Algorithms have been developed that allow a craft to start from a given line and complete a survey area without previous knowledge of the bathymetry. The craft adapts its path solution based on detected hazards and dynam-ically spaces survey lines depending on the depth to compensate for varying width multibeam swaths. The first operational test of this software took place in 2015 using a Teledyne Z-Boat on board the NOAA Ship Thomas Jefferson. Additionally, the algorithms were used in a field demonstration at the Alliance for Coastal Techologies ASV workshop in Solomons, MD where a selected region was surveyed for full coverage using the autonomy system. Further testing with the NOAA Ship Thomas Jefferson is ongoing, including remote operation tests for control and monitoring of the boats over a cell network. A boat in Virginia has successfully completed survey acquisition while being managed by Manda in New Hampshire.
• New Item: Grab Camera. In response to a demonstrated NOAA need, the Center developed a reli-able and robust camera system that can be deployed readily by field personnel, and which matches the operational tempo of NOAA field units. The camera system is compact and relatively light, is powered by standard Lithium rechargeable batteries, and can be controlled from the outside of the pressure casings. The camera and light are designed to be field positionable with respect to the grab sampler through a specially machined clamp that rides on the support pole, and to operate for a full survey day without having to either recharge batteries, or off-load data. The unit is currently undergoing NOAA field trials.
Processing Research Theme
• Update from 2014: CHRT. Brian Calder is developing a second generation of the CUBE algorithm—CUBE with Hierarchical Resolution Techniques (CHRT). It allows for variable resolution of data represen-tation and is data adaptive, meaning that the density of data collected is reflected in the resolution of estimates of depth generated. A co-development model that has the software vendors who are imple-menting CHRT assisting in the development of a test suite has now been implemented, and the soft-ware is available for license to industrial partners. IFREMER, CARIS, SAIC (Leidos), Alidade Hydrographic, and QPS are the first five licensees, with CARIS providing a version to NOAA/HSTP and the CHS for test-ing and feedback. This year’s efforts focused on testing and working with the industrial co-developers
R2O Initiatives
JHC Performance Report32 30 January 2016
and NOAA representatives to establish a test suite that will allow for validation. The structure for the initial test suite has been defined, and a working group of interested industrial co-developers is being established in order to support this effort, with target representation initially from CARIS, Leidos, QPS, and NOAA.
• Update from 2014: SCB. A Center team, led by Shachak Pe’eri, has been developing and evaluating approaches to extracting bathymetry from satellite imagery (Satellite Derived Bathymetry—SDB), as well as exploring the applicability of SDB for change analysis, benthic habitat mapping, depth retrieval in remote regions, and hydrographic survey planning. In 2014, in conjunction with NOAA, we derived bathymetry from Landsat 8 and World View-2 imagery from Bechevin Bay, Alaska and Bouge Inlet, South Carolina. In Bechevin Bay, the satellite-derived bathymetry was used to map ice-induced changes in navigation channels and thus provide a guide for the location of contract surveys. This work was recognized in a letter of appreciation from the USCG. The work in Bouge Inlet demonstrated the viability of using satellite-derived bathymetry to map changes in the “Magenta Line,” the line placed on NOAA charts to mark the center of navigation channels in the Intercoastal Waterway. Following the US-Canada Hydrographic Commission (USCHC) meeting in March 2015, OCS outlined an internal NOAA policy regarding the use of SDB as supplementary information that can support the hydro-grapher/cartographer with respect to the need for chart updates. Shachak Pe’eri has been consulting with MCD on this policy.
• Update from 2014: PMBS. Phase-measuring bathymetric sonars (PMBS) (multi-row sidescan sonars that look at the phase differences of the acoustic signals between the rows to derive a bathymetric solution) have the potential of offering much wider coverage in shallow water than conventional beam-forming multibeam sonars. NOAA and other mapping agencies have recognized this potential benefit and have begun to explore the feasibility of using PMBS as a hydrographic tool. Val Schmidt has been working with various Industrial Partners who manufacturer PMBS systems and are collaborating with them in their development, assisting with their integration into common data processing packages, and developing work-flows for processing data. In 2015, Schmidt worked with hardware manufactur-ers to help them find better designs, and with software developers to help them better handle PMBS data such that it is more readily suitable for hydrographic work. As a direct result of these interactions, Edgetech and Klein systems now provide real-time bathymetric uncertainty estimates with their data. In addition, at our suggestion, Klein redesigned their bathy processing engine to produce nearly full cover-age at nadir in water depths shallower than approximately 20 m, where their previous systems left a 60 degree gap. Further, Caris and Hypack now support ingestion of uncertainty from Edgetech and Klein systems.
• New item: HydrOffice. We have worked collaboratively with NOAA to enhance the overall rate at which data are processed and brought into chart products. To facilitate the development of hydro-graphic processing software, a new software environment, HydrOffice, has been designed by Giuseppe Masetti and NOAA collaborators. HydrOffice allows new processing algorithms to be quickly developed and tested within the current data processing pipeline and, if they prove effective, quickly go into operation through implementation by industrial partners. The HydrOffice environment currently con-tains a number of “hydro-packages.” Two of these (SARScan and HCellScan), which are designed to scan gridded bathymetry and feature files to ensure there is agreement, and that the attributes of the feature are per the current version of the NOAA Hydrographic Survey Specifications and Deliverables (HSSD) manual or the current NOAA HCell Specifications, are in active use by both OCS hydrographic data processing branches, and the NOAA hydrographic fleet.
R2O Initiatives
JHC Performance Report 30 January 2016 33
R2O Initiatives
Water Column Mapping and Habitat Theme
• Update from 2014: Mapping Gas Seeps. Techniques for mapping, locating and visualizing gas seeps developed by Center researchers led by Tom Weber, have now been put into application through both the direct use of Weber’s research software and the use of commercial versions of this software imple-mented by our industrial partners. As an example, in 2014, the Okeanos Explorer mapped 17,477 km2 of the northern Gulf of Mexico, observed 573 seeps, and discovered many new seeps on the Atlan-tic margin. The results from these cruises demonstrated a new mid-water mapping technology for the Okeanos Explorer and suggest that wide-scale mapping of seeps in the deep Gulf of Mexico and elsewhere is viable and important for both scientific and industry studies. Commercial software derived from Weber’s research code to automatically locate seep targets in acoustic data has now been imple-mented by at least one of our industrial associates (QPS).
• Update from 2014: ME70. During the summer of 2015, acoustic/trawl surveys for walleye pollock in the Gulf of Alaska took place in regions that need to be classified as either trawlable or untrawlable. The Center is playing a supporting role in the analysis of the ME70 data, using algorithms previously written for generating bathymetry and seafloor backscatter and two new metrics used to classify the seabed as trawlable or untrawlable based on ME70 data alone—bathymetric position index (BPI) and a vector ruggedness measure (VRM). The Center provided MATLAB code and helped the Alaska Fisheries Science Center (who are leading the ME70 data analysis) with interpretation of the data.
• New Item: Resource Mapping. Demonstrating the value of the bathymetry and particularly the back-scatter collected by NOAA and others, as well as the processing tools developed under this grant, Larry Ward has been funded by the Bureau of Ocean Energy Management to conduct a two-year intensive study of existing data to define the seafloor and sedimentary environments of the New Hampshire con-tinental shelf and vicinity, with the objective of identifying and characterizing sand and gravel deposits that are suitable for beach nourishment and to help build coastal resiliency in New Hampshire.
IOCM Research Theme
• Update from 2014: Bathymetry from FSVs. Weber’s ME70 software for producing bathymetry and seafloor backscatter is being integrated with Industrial Partner Hypack's acquisition software that is standardly used on these vessels. This integration enables the ME70 sonar to simultaneously collect water column and bathymetric data, improving survey operations aboard the FSVs by increasing data collection, enabling visualization of ME70 bathymetry in real-time, and providing mapping and data processing tools. In June 2015, we had the opportunity to test Hypack’s development on the Oscar Dyson. The Hypack development has progressed nicely, and it appears there are only a few items left to incorporate, e.g., the ability to turn off roll and pitch compensation (which is on by default), and the ability to log backscatter data.
• New item: Super Storm Sandy IOCM Projects. Building on years of research conducted at the Center, the Super Storm Sandy contract team (funded by Super Storm Sandy supplemental funds) created protocols for and put into practice approaches to:
1. Bringing USGS Phase Measuring Bathymetric Sonar (PMBS) data into chart products;
2. Bringing third party (USGS and ACOE) multibeam sonar data into NOAA charts;
3. Integrating FEMA and state and local government collected single beam sonar products into NOAA charts;
JHC Performance Report34 30 January 2016
4. Improving chart adequacy using merged source (multiple lidar, imagery, and sonar sources) data;
5. Using USGS EAARL-B DEMS, Remote Sensing Division lidar and USACE CZMIL data for charting;
6. Using Remote Sensing Division lidar for charting;
7. Producing habitat maps from EAARL-B reflectivity;
8. Producing object-based habitat maps in standard (CMECS) format from acoustic and other data sources.
Electronic Chart of the Future Research Theme
• Update from 2014: Open Navigation Surface. The Center continues to lead efforts to standardize formats for the distribution of full-density bathymetric data to be included in ENCs through the Open Navigation Surface Working Group. Brian Calder serves as the Chair of the Open Navigation Surface (ONS) Working Group. The ONS Working Group has continued to develop the Bathymetric Attributed Grid (BAG) format since its adoption as S-102 in 2012. BAG version 1.5.3 was released in June of 2014. In 2015, after review by the Open Navigation Surface Working Group Architecture Review Board, a proposal was approved for inclusion of a variable resolution extension to the BAG, starting with version 1.6 of the library.
• New item: S-111 Product Specification. Briana Sullivan, working with Carl Kammerer, has developed a revised S-111 (Surface Currents) Product Specification that was put into the latest S-100 template. Korea has already implemented some of the design suggestions.
• New item: New Wind Barb Design. The new nowCOAST uses an alternative to the traditional wind barb used on weather maps for decades. The alternative consists of a wind barb with a curved shaft and arrowhead placed along equally spaced streamlines. The curved wind barb improves the ability to see patterns as well as depicting the wind speed and direction. The curved wind barb was developed by Dr. Colin Ware, the director of the Visualization Lab at the Center and was transitioned from research to operations by a collaborative effort between the visualization lab personnel and nowCOAST Develop-ment Team led by NOAA’s John Kelley. The new nowCOAST version was migrated to NOAA’s Integrated Dissemination Program (IDP) 24 x 7 high availability operational facility operated by NWS/NCEP Central Operations in College Park, MD to provide users with high reliability. The new nowCOAST version became operational in the NOAA IDP facility on September 21, 2015.
R2O Initiatives
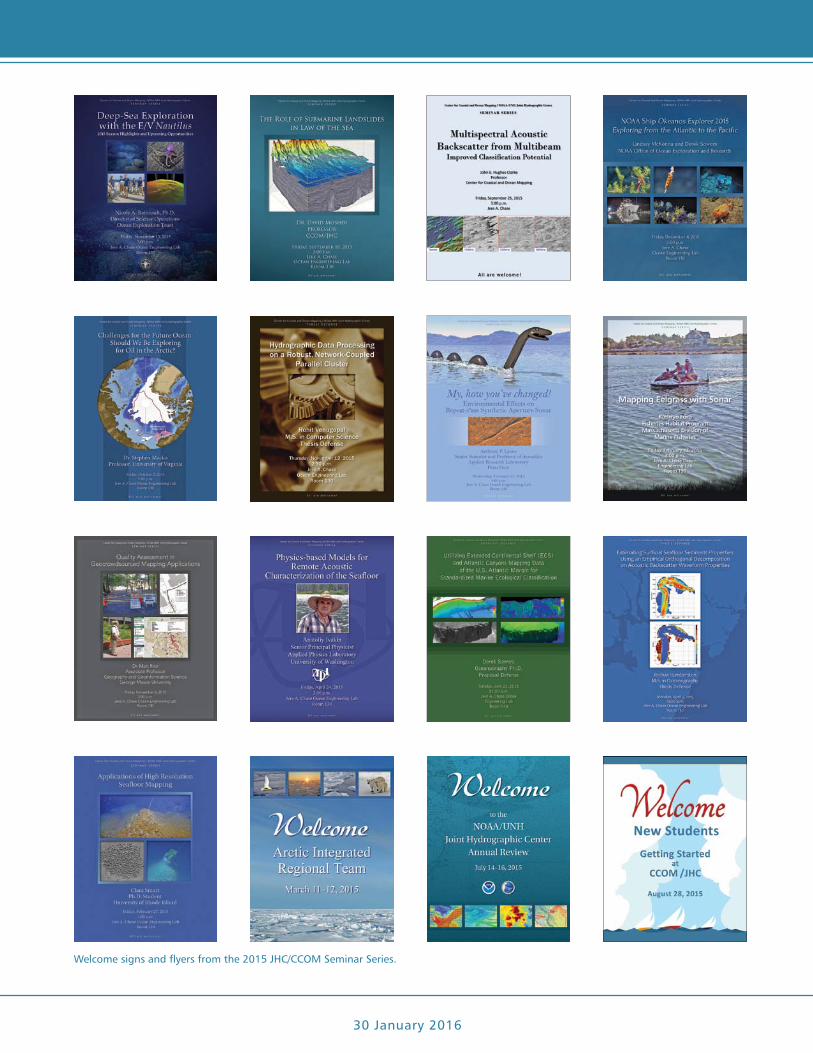
JHC Performance Report 30 January 2016 35
Welcome signs and flyers from the 2015 JHC/CCOM Seminar Series.
JHC Performance Report36
The NOAA-UNH Joint Hydrographic CenterThe Center for Coastal and Ocean Mapping
Jere A. Chase Ocean Engineering Lab 24 Colovos Road Durham, NH 03824
603.862.3438 tel 603.862.0839 fax
www.ccom.unh.edu