performance assessment task our pets common … pets.pdfperformance assessment task our pets ... the...
TRANSCRIPT
© 2012 Noyce Foundation
Performance Assessment Task Our Pets Grade 2
The task challenges a student to demonstrate understanding of concepts involved in representing and interpreting data. Students must make sense of representing the same data in more than one way. A student must understand how to interpret data from different representations. A student must understand how to describe and compare data and data representations using qualitative and quantitative measures.
Common Core State Standards Math - Content Standards Measurement and Data Represent and interpret data 2.MD.10 Draw a picture graph and a bar graph (with single-unit scale) to represent a data set with up to four categories. Solve simple put- together, take-apart, and compare problems using information presented in a bar graph.
Common Core State Standards Math – Standards of Mathematical Practice MP.2 Reason abstractly and quantitatively. Mathematically proficient students make sense of quantities and their relationships in problem situations. They bring two complementary abilities to bear on problems involving quantitative relationships: the ability to decontextualize—to abstract a given situation and represent it symbolically and manipulate the representing symbols as if they have a life of their own, without necessarily attending to their referents—and the ability to contextualize, to pause as needed during the manipulation process in order to probe into the referents for the symbols involved. Quantitative reasoning entails habits of creating a coherent representation of the problem at hand; considering the units involved; attending to the meaning of quantities, not just how to compute them; and knowing and flexibly using different properties of operations and objects. MP.4 Model with mathematics. Mathematically proficient students can apply the mathematics they know to solve problems arising in everyday life, society, and the workplace. In early grades, this might be as simple as writing an addition equation to describe a situation. In middle grades, a student might apply proportional reasoning to plan a school event or analyze a problem in the community. By high school, a student might use geometry to solve a design problem or use a function to describe how one quantity of interest depends on another. Mathematically proficient students who can apply what they know are comfortable making assumptions and approximations to simplify a complicated situation, realizing that these may need revision later. They are able to identify important quantities in a practical situation and map their relationships using such tools as diagrams, two-way tables, graphs, flowcharts and formulas. They can analyze those relationships mathematically to draw conclusions. They routinely interpret their mathematical results in the context of the situation and reflect on whether the results make sense, possibly improving the model if it has not served its purpose.
Assessment Results This task was developed by the Mathematics Assessment Resource Service and administered as part of a national, normed math assessment. For comparison purposes, teachers may be interested in the results of the national assessment, including the total points possible for the task, the number of core points, and the percent of students that scored at standard on the task. Related materials, including the scoring rubric, student work, and discussions of student understandings and misconceptions on the task, are included in the task packet.
Grade Level Year Total Points Core Points % At Standard 2 2008 10 6 69%
2nd Grade – 2008 23 Copyright ©2008 by Noyce Foundation All rights reserved.
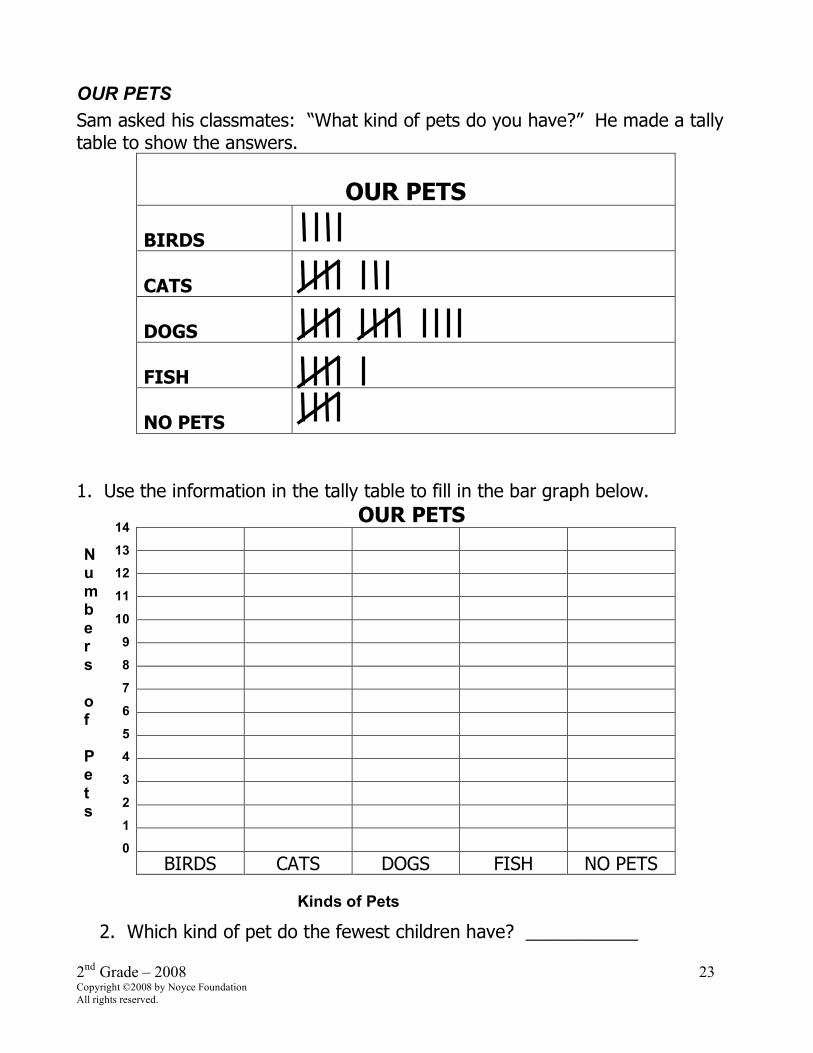
OUR PETS Sam asked his classmates: “What kind of pets do you have?” He made a tally table to show the answers.
OUR PETS BIRDS
CATS
DOGS
FISH
NO PETS
1. Use the information in the tally table to fill in the bar graph below. OUR PETS
BIRDS CATS DOGS FISH NO PETS
2. Which kind of pet do the fewest children have? ___________
14
13 12
11
10
9
8
7
6
5 4
3
2
1 0
Numb e r s o f P e t s
Kinds of Pets
2nd Grade – 2008 24 Copyright ©2008 by Noyce Foundation All rights reserved.
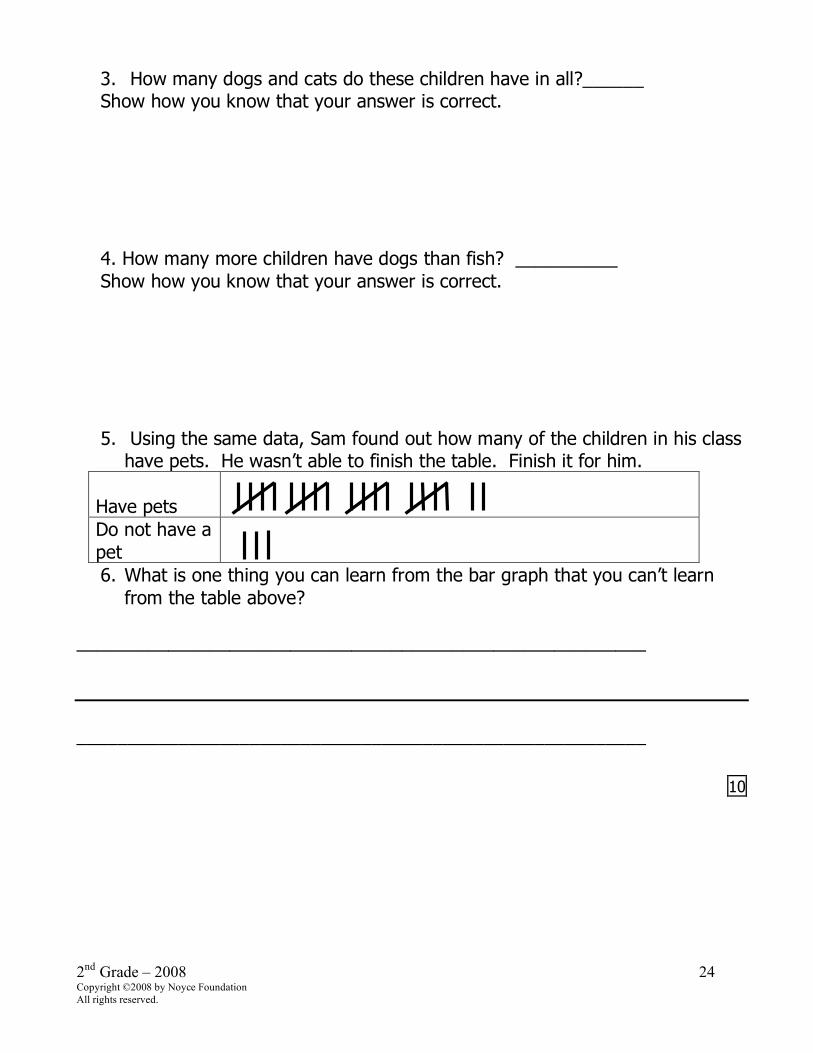
3. How many dogs and cats do these children have in all?______ Show how you know that your answer is correct.
4. How many more children have dogs than fish? __________ Show how you know that your answer is correct.
5. Using the same data, Sam found out how many of the children in his class have pets. He wasn’t able to finish the table. Finish it for him.
Have pets
Do not have a pet
6. What is one thing you can learn from the bar graph that you can’t learn from the table above?
________________________________________________________ ________________________________________________________
10
1
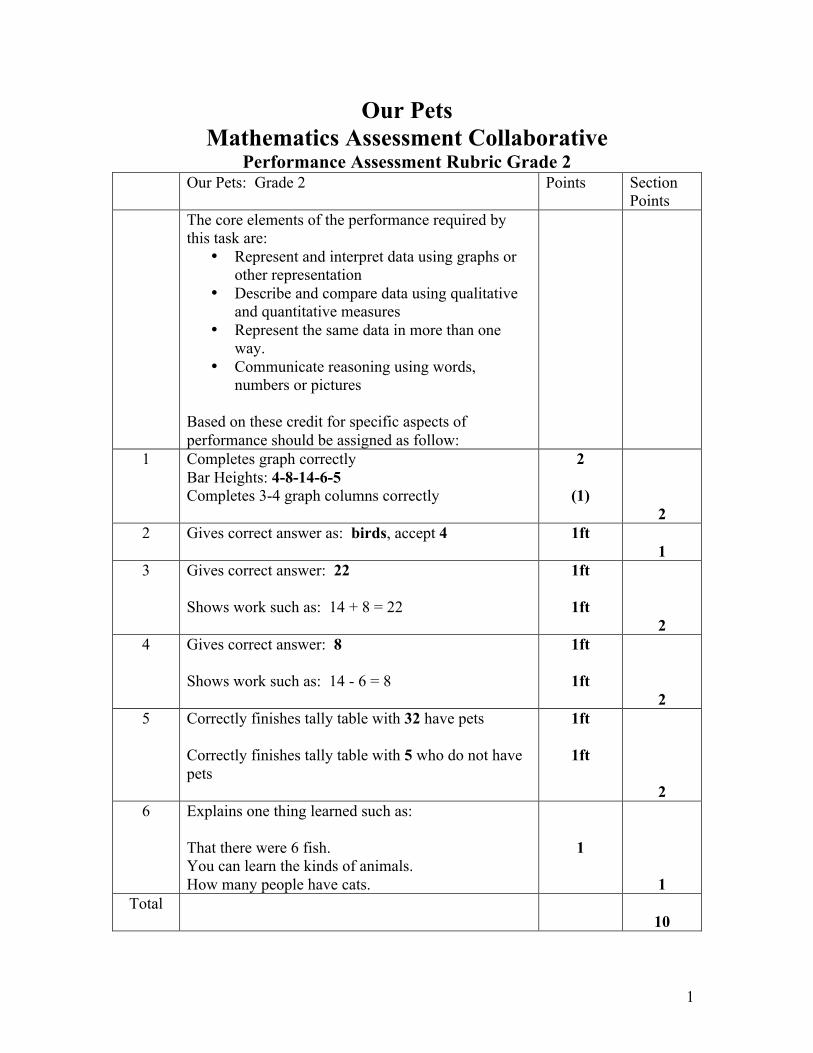
Our Pets Mathematics Assessment Collaborative
Performance Assessment Rubric Grade 2 Our Pets: Grade 2 Points Section
Points The core elements of the performance required by
this task are: • Represent and interpret data using graphs or
other representation • Describe and compare data using qualitative
and quantitative measures • Represent the same data in more than one
way. • Communicate reasoning using words,
numbers or pictures Based on these credit for specific aspects of performance should be assigned as follow:
1 Completes graph correctly Bar Heights: 4-8-14-6-5 Completes 3-4 graph columns correctly
2
(1)
2
2
Gives correct answer as: birds, accept 4 1ft 1
3 Gives correct answer: 22 Shows work such as: 14 + 8 = 22
1ft
1ft
2
4 Gives correct answer: 8 Shows work such as: 14 - 6 = 8
1ft
1ft
2
5 Correctly finishes tally table with 32 have pets Correctly finishes tally table with 5 who do not have pets
1ft
1ft
2
6 Explains one thing learned such as: That there were 6 fish. You can learn the kinds of animals. How many people have cats.
1
1
Total
10
2nd Grade – 2008 26 Copyright ©2008 by Noyce Foundation All rights reserved.
2nd grade – Task 2: Pets Work the task and examine the rubric. What do you think are the key mathematics the task is trying to assess? ________________________________________________________________ ________________________________________________________________ ________________________________________________________________ ________________________________________________________________ Looking at the student work, determine which students were able to accurately transfer the data from the tally table to the bar graph in Part 1. As you look at the student work in other parts of the task, think about how the accuracy of this bar graph affects the accuracy of all other calculations and statements students are required to complete to be successful at this task.
• For students who made mistakes in creating the bar graph, were these caused by confusion on how to read tallies? Inaccuracies in visual discrimination, such as moving data over one bar for each pet when transferring? Misunderstandings in how to make a bar graph, including starting from the top to shade, leaving the first bar blank, or using tallies in the bar graph?
• What learning experiences would benefit students who are struggling with this transfer of information?
Look at the student work for Part 3. How many students put:
22 32 37 6 Other
• For students who accurately summed to 22, which strategies did they use? How could those
successful strategies be shared with other students? • How might students arrive at the other answers of 32, 37, and 6? • When you look at the student work for students who got an “other” answer, how many of them
chose a correct process and strategy, but were using incorrect data because of an inaccurately constructed bar graph?
Look at the student work for Part 4. How many students put:
8 20 9 6 Other
• For students who accurately found a difference of 8, which strategies did they use? How could
those successful strategies be shared with students? • How might students arrive at the other answers of 20, 9, and 6? What does this tell us about
student understanding? • When you look at the student work for students who got an “other” answer, how many of them
made an error in calculating? Which were based on an error in the data? • What strategies did students use to find the difference between 14 and 6? Were some more
accurate than others? More efficient than others?
When analyzing Parts 3 and 4, think about examples in the student work where students used particularly effective tools, strategies, or explanations of their thinking. In what ways can these successes be shared with other students? Are there models that you don’t see evidence of, such as the use of open number lines or bar models or drawings, that you think would have been helpful in clarifying student thinking, improving their explanations, and increasing their efficiency and accuracy? How might these tools and strategies also be introduced in meaningful ways?
2nd Grade – 2008 27 Copyright ©2008 by Noyce Foundation All rights reserved.
Looking at the statements in Part 6, can you identify students who:
• Offer judgments on usability of a graph, such as one being harder or prettier? • Make a statement that could easily be applicable to both graphs, such as “I can count” or
“There are 32 pets”? • Make statements about an incomplete tally count in the table from Part 5, such as stating that
there are 22 or 3? • Make unclear or incomplete statements about one or both graphs?
What do these different answers tell you about the students’ understanding of the relationship between
the three representations of the data? What evidence is there that students understand that each of these is a representation of the same data? Or is there evidence that they see these as unrelated, separate tasks?
2nd Grade – 2008 28 Copyright ©2008 by Noyce Foundation All rights reserved.
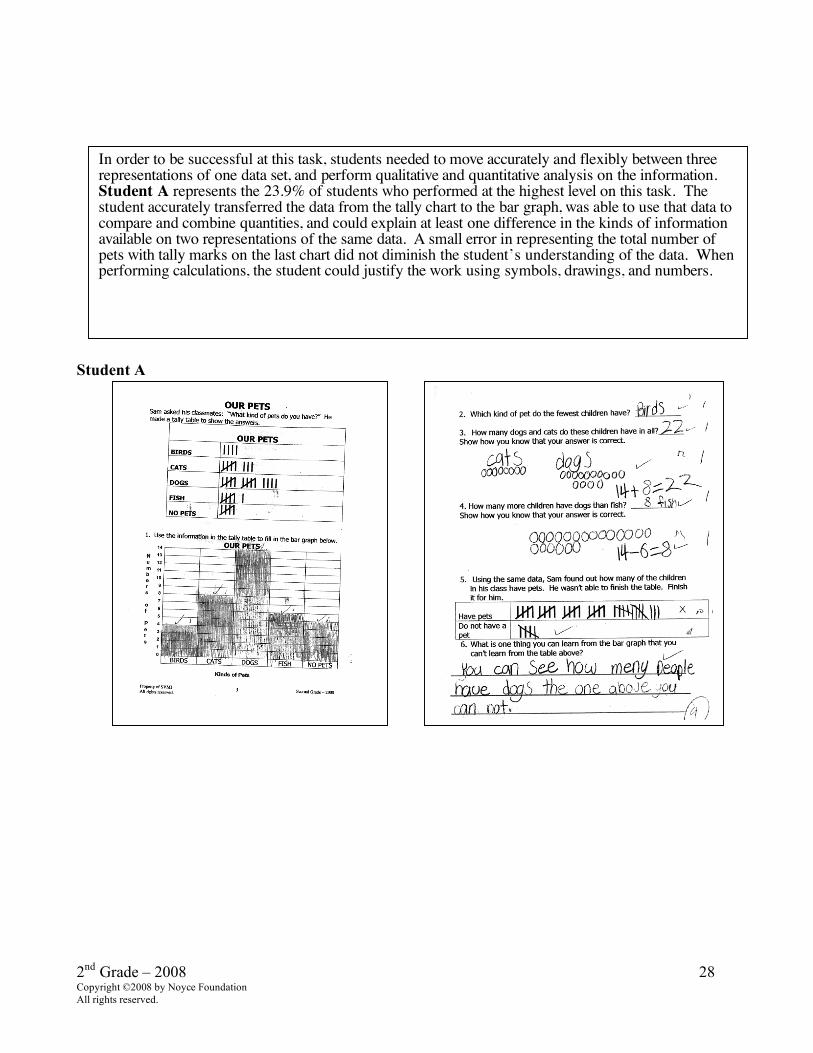
Student A
In order to be successful at this task, students needed to move accurately and flexibly between three representations of one data set, and perform qualitative and quantitative analysis on the information. Student A represents the 23.9% of students who performed at the highest level on this task. The student accurately transferred the data from the tally chart to the bar graph, was able to use that data to compare and combine quantities, and could explain at least one difference in the kinds of information available on two representations of the same data. A small error in representing the total number of pets with tally marks on the last chart did not diminish the student’s understanding of the data. When performing calculations, the student could justify the work using symbols, drawings, and numbers.
2nd Grade – 2008 29 Copyright ©2008 by Noyce Foundation All rights reserved.
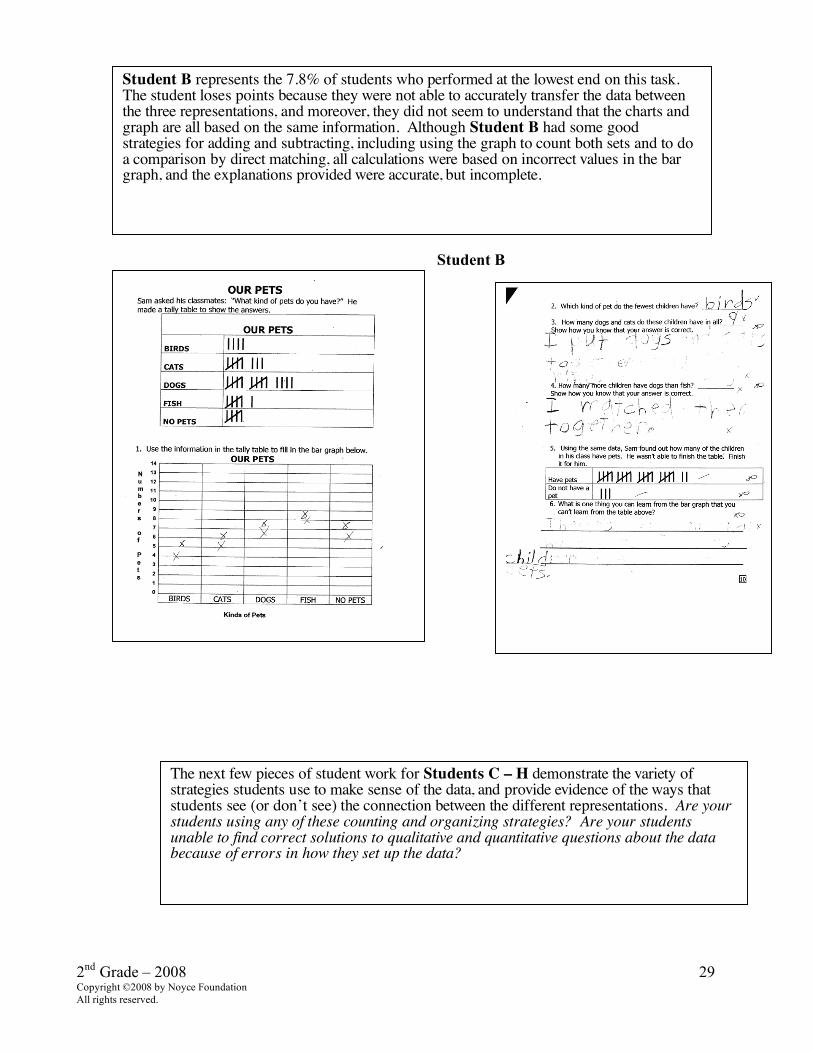
Student B
Student B represents the 7.8% of students who performed at the lowest end on this task. The student loses points because they were not able to accurately transfer the data between the three representations, and moreover, they did not seem to understand that the charts and graph are all based on the same information. Although Student B had some good strategies for adding and subtracting, including using the graph to count both sets and to do a comparison by direct matching, all calculations were based on incorrect values in the bar graph, and the explanations provided were accurate, but incomplete.
The next few pieces of student work for Students C – H demonstrate the variety of strategies students use to make sense of the data, and provide evidence of the ways that students see (or don’t see) the connection between the different representations. Are your students using any of these counting and organizing strategies? Are your students unable to find correct solutions to qualitative and quantitative questions about the data because of errors in how they set up the data?
2nd Grade – 2008 30 Copyright ©2008 by Noyce Foundation All rights reserved.
Student C Student D
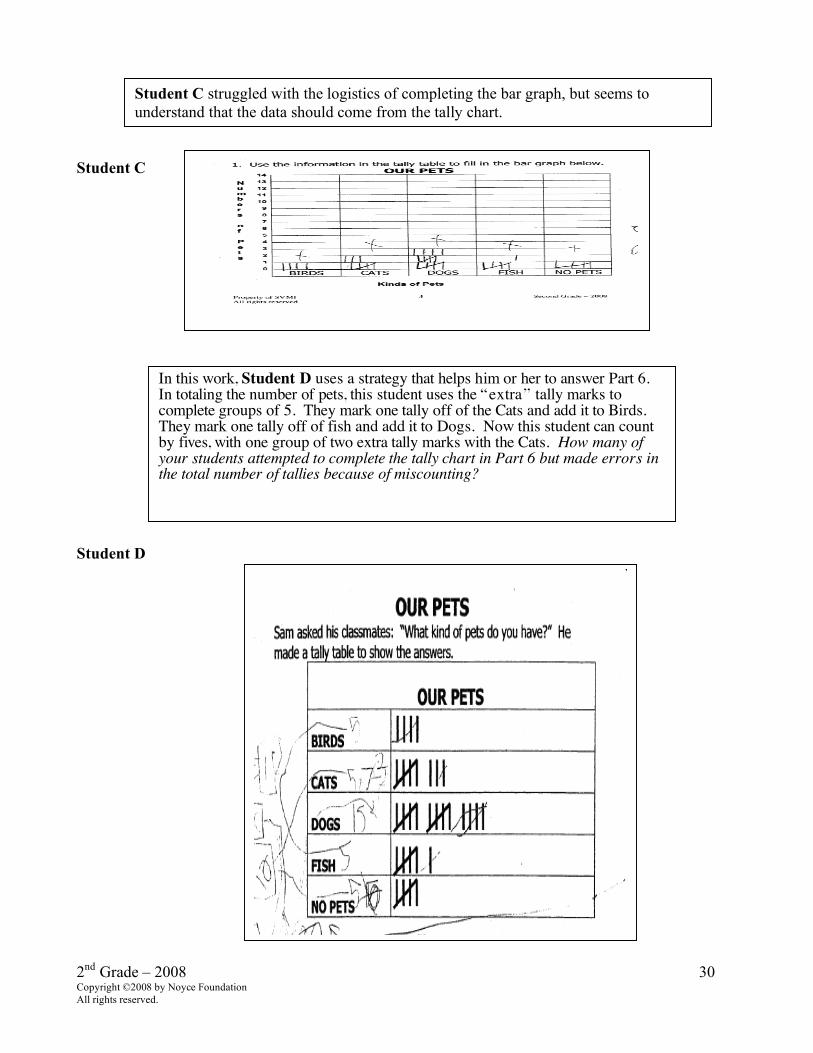
Student C struggled with the logistics of completing the bar graph, but seems to understand that the data should come from the tally chart.
In this work, Student D uses a strategy that helps him or her to answer Part 6. In totaling the number of pets, this student uses the “extra” tally marks to complete groups of 5. They mark one tally off of the Cats and add it to Birds. They mark one tally off of fish and add it to Dogs. Now this student can count by fives, with one group of two extra tally marks with the Cats. How many of your students attempted to complete the tally chart in Part 6 but made errors in the total number of tallies because of miscounting?
2nd Grade – 2008 31 Copyright ©2008 by Noyce Foundation All rights reserved.
Student E Student F
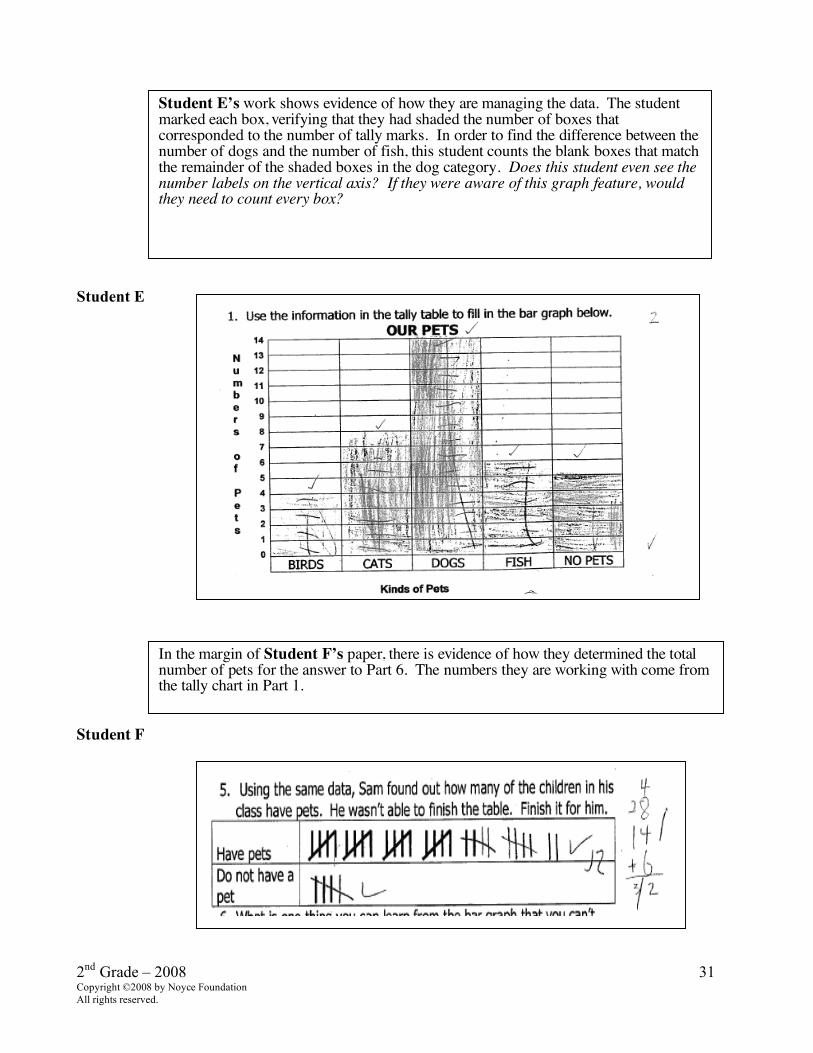
Student E’s work shows evidence of how they are managing the data. The student marked each box, verifying that they had shaded the number of boxes that corresponded to the number of tally marks. In order to find the difference between the number of dogs and the number of fish, this student counts the blank boxes that match the remainder of the shaded boxes in the dog category. Does this student even see the number labels on the vertical axis? If they were aware of this graph feature, would they need to count every box?
In the margin of Student F’s paper, there is evidence of how they determined the total number of pets for the answer to Part 6. The numbers they are working with come from the tally chart in Part 1.
2nd Grade – 2008 32 Copyright ©2008 by Noyce Foundation All rights reserved.
Student G Student H Student I Student J
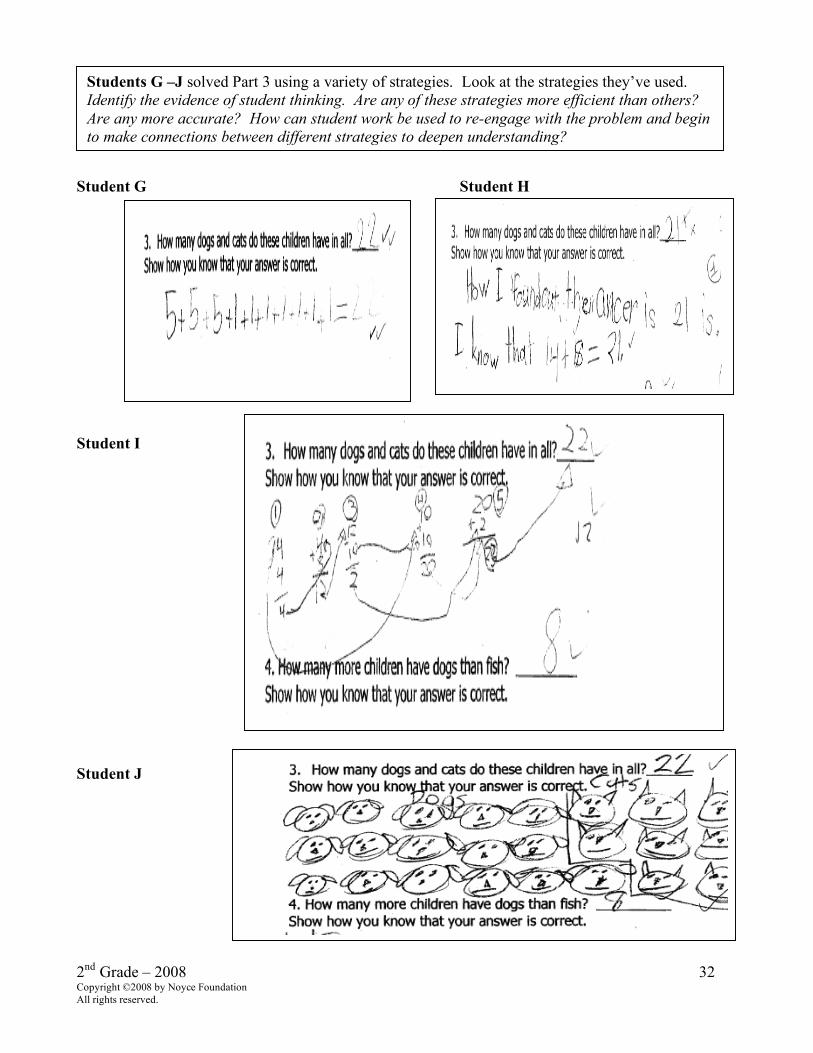
Students G –J solved Part 3 using a variety of strategies. Look at the strategies they’ve used. Identify the evidence of student thinking. Are any of these strategies more efficient than others? Are any more accurate? How can student work be used to re-engage with the problem and begin to make connections between different strategies to deepen understanding?
2nd Grade – 2008 33 Copyright ©2008 by Noyce Foundation All rights reserved.
Student K Student L Student M Student N
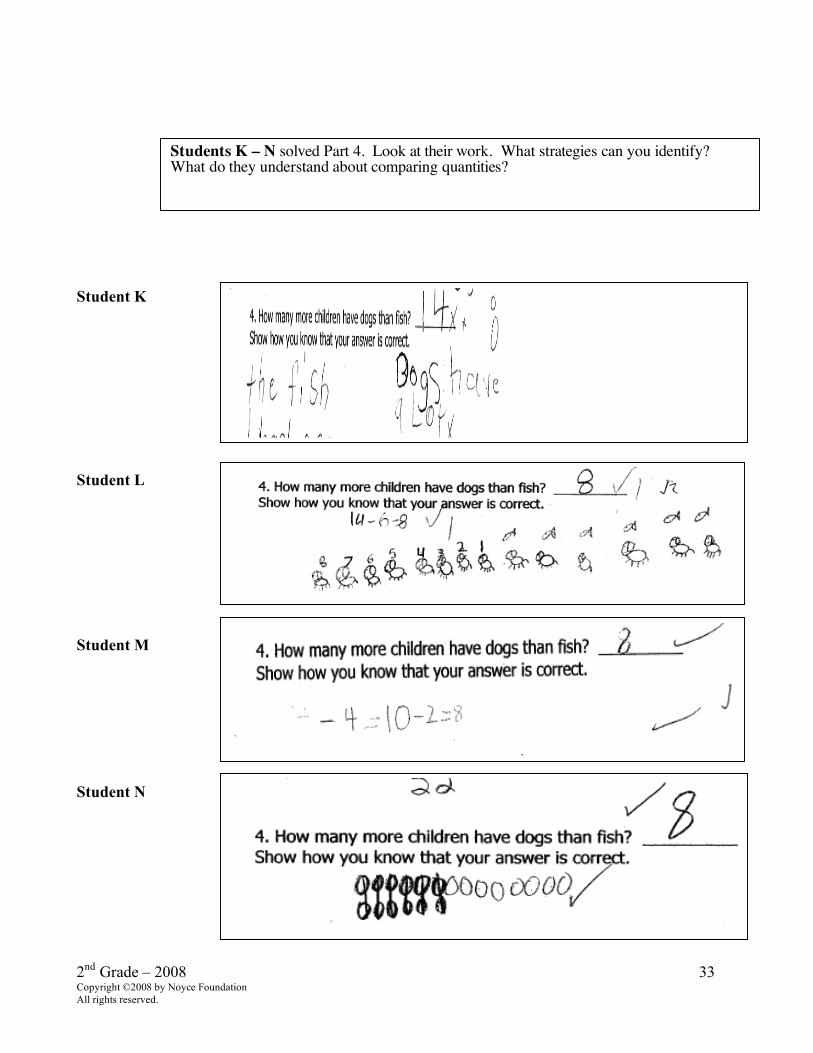
Students K – N solved Part 4. Look at their work. What strategies can you identify? What do they understand about comparing quantities?
2nd Grade – 2008 34 Copyright ©2008 by Noyce Foundation All rights reserved.
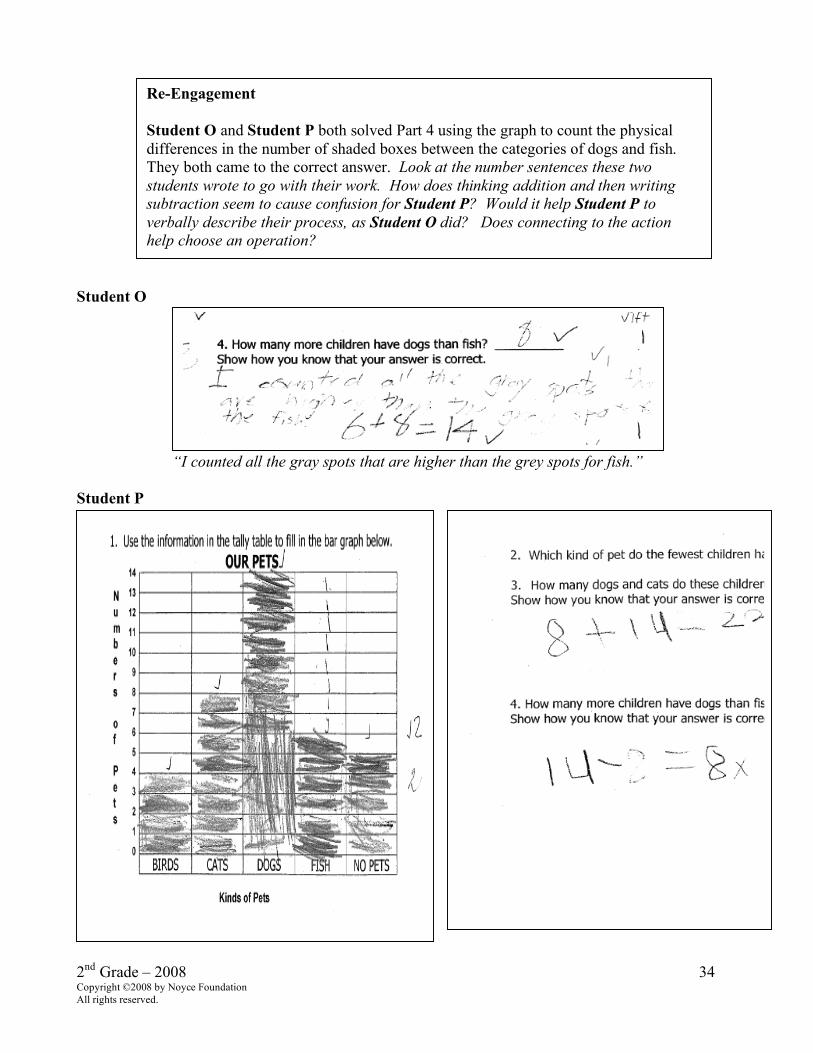
Student O
“I counted all the gray spots that are higher than the grey spots for fish.” Student P
Re-Engagement Student O and Student P both solved Part 4 using the graph to count the physical differences in the number of shaded boxes between the categories of dogs and fish. They both came to the correct answer. Look at the number sentences these two students wrote to go with their work. How does thinking addition and then writing subtraction seem to cause confusion for Student P? Would it help Student P to verbally describe their process, as Student O did? Does connecting to the action help choose an operation?
2nd Grade – 2008 35 Copyright ©2008 by Noyce Foundation All rights reserved.
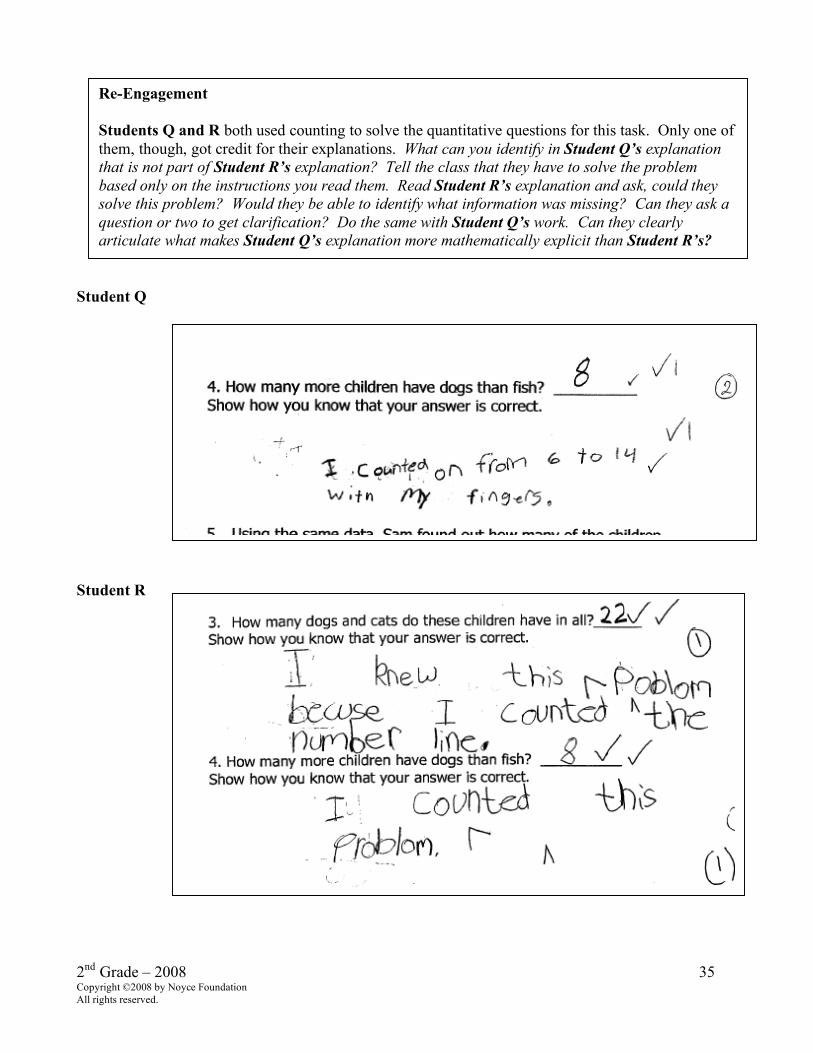
Student Q Student R
Re-Engagement Students Q and R both used counting to solve the quantitative questions for this task. Only one of them, though, got credit for their explanations. What can you identify in Student Q’s explanation that is not part of Student R’s explanation? Tell the class that they have to solve the problem based only on the instructions you read them. Read Student R’s explanation and ask, could they solve this problem? Would they be able to identify what information was missing? Can they ask a question or two to get clarification? Do the same with Student Q’s work. Can they clearly articulate what makes Student Q’s explanation more mathematically explicit than Student R’s?
2nd Grade – 2008 36 Copyright ©2008 by Noyce Foundation All rights reserved.
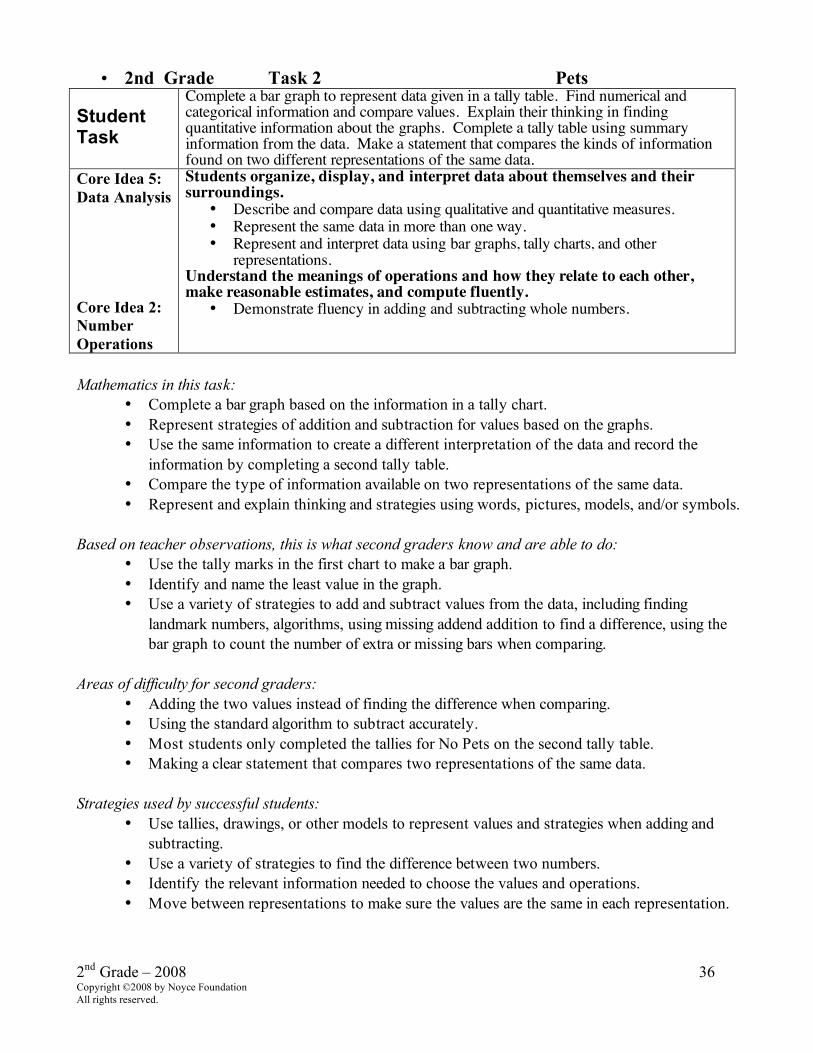
• 2nd Grade Task 2 Pets
Student Task
Complete a bar graph to represent data given in a tally table. Find numerical and categorical information and compare values. Explain their thinking in finding quantitative information about the graphs. Complete a tally table using summary information from the data. Make a statement that compares the kinds of information found on two different representations of the same data.
Core Idea 5: Data Analysis Core Idea 2: Number Operations
Students organize, display, and interpret data about themselves and their surroundings.
• Describe and compare data using qualitative and quantitative measures. • Represent the same data in more than one way. • Represent and interpret data using bar graphs, tally charts, and other
representations. Understand the meanings of operations and how they relate to each other, make reasonable estimates, and compute fluently.
• Demonstrate fluency in adding and subtracting whole numbers.
Mathematics in this task:
• Complete a bar graph based on the information in a tally chart. • Represent strategies of addition and subtraction for values based on the graphs. • Use the same information to create a different interpretation of the data and record the
information by completing a second tally table. • Compare the type of information available on two representations of the same data. • Represent and explain thinking and strategies using words, pictures, models, and/or symbols.
Based on teacher observations, this is what second graders know and are able to do:
• Use the tally marks in the first chart to make a bar graph. • Identify and name the least value in the graph. • Use a variety of strategies to add and subtract values from the data, including finding
landmark numbers, algorithms, using missing addend addition to find a difference, using the bar graph to count the number of extra or missing bars when comparing.
Areas of difficulty for second graders:
• Adding the two values instead of finding the difference when comparing. • Using the standard algorithm to subtract accurately. • Most students only completed the tallies for No Pets on the second tally table. • Making a clear statement that compares two representations of the same data.
Strategies used by successful students: • Use tallies, drawings, or other models to represent values and strategies when adding and
subtracting. • Use a variety of strategies to find the difference between two numbers. • Identify the relevant information needed to choose the values and operations. • Move between representations to make sure the values are the same in each representation.
2nd Grade – 2008 37 Copyright ©2008 by Noyce Foundation All rights reserved.
2nd Grade – 2008 38 Copyright ©2008 by Noyce Foundation All rights reserved.
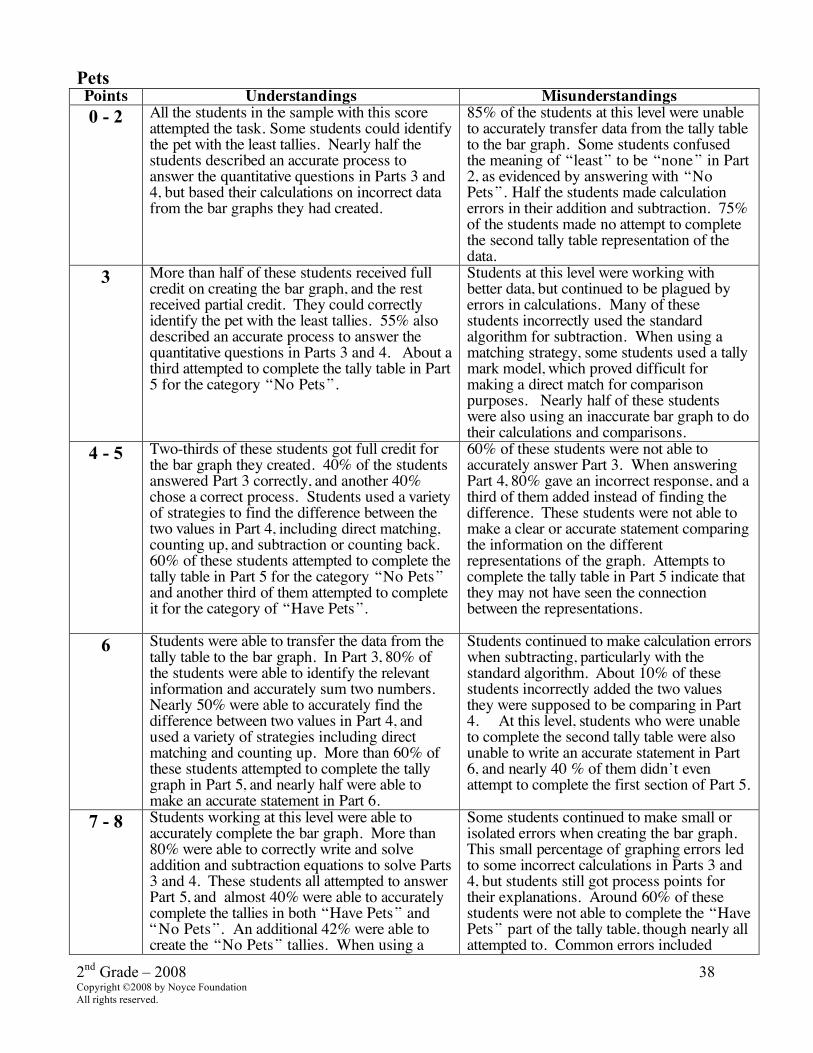
Pets Points Understandings Misunderstandings 0 - 2 All the students in the sample with this score
attempted the task. Some students could identify the pet with the least tallies. Nearly half the students described an accurate process to answer the quantitative questions in Parts 3 and 4, but based their calculations on incorrect data from the bar graphs they had created.
85% of the students at this level were unable to accurately transfer data from the tally table to the bar graph. Some students confused the meaning of “least” to be “none” in Part 2, as evidenced by answering with “No Pets”. Half the students made calculation errors in their addition and subtraction. 75% of the students made no attempt to complete the second tally table representation of the data.
3 More than half of these students received full credit on creating the bar graph, and the rest received partial credit. They could correctly identify the pet with the least tallies. 55% also described an accurate process to answer the quantitative questions in Parts 3 and 4. About a third attempted to complete the tally table in Part 5 for the category “No Pets”.
Students at this level were working with better data, but continued to be plagued by errors in calculations. Many of these students incorrectly used the standard algorithm for subtraction. When using a matching strategy, some students used a tally mark model, which proved difficult for making a direct match for comparison purposes. Nearly half of these students were also using an inaccurate bar graph to do their calculations and comparisons.
4 - 5 Two-thirds of these students got full credit for the bar graph they created. 40% of the students answered Part 3 correctly, and another 40% chose a correct process. Students used a variety of strategies to find the difference between the two values in Part 4, including direct matching, counting up, and subtraction or counting back. 60% of these students attempted to complete the tally table in Part 5 for the category “No Pets” and another third of them attempted to complete it for the category of “Have Pets”.
60% of these students were not able to accurately answer Part 3. When answering Part 4, 80% gave an incorrect response, and a third of them added instead of finding the difference. These students were not able to make a clear or accurate statement comparing the information on the different representations of the graph. Attempts to complete the tally table in Part 5 indicate that they may not have seen the connection between the representations.
6 Students were able to transfer the data from the tally table to the bar graph. In Part 3, 80% of the students were able to identify the relevant information and accurately sum two numbers. Nearly 50% were able to accurately find the difference between two values in Part 4, and used a variety of strategies including direct matching and counting up. More than 60% of these students attempted to complete the tally graph in Part 5, and nearly half were able to make an accurate statement in Part 6.
Students continued to make calculation errors when subtracting, particularly with the standard algorithm. About 10% of these students incorrectly added the two values they were supposed to be comparing in Part 4. At this level, students who were unable to complete the second tally table were also unable to write an accurate statement in Part 6, and nearly 40 % of them didn’t even attempt to complete the first section of Part 5.
7 - 8 Students working at this level were able to accurately complete the bar graph. More than 80% were able to correctly write and solve addition and subtraction equations to solve Parts 3 and 4. These students all attempted to answer Part 5, and almost 40% were able to accurately complete the tallies in both “Have Pets” and “No Pets”. An additional 42% were able to create the “No Pets” tallies. When using a
Some students continued to make small or isolated errors when creating the bar graph. This small percentage of graphing errors led to some incorrect calculations in Parts 3 and 4, but students still got process points for their explanations. Around 60% of these students were not able to complete the “Have Pets” part of the tally table, though nearly all attempted to. Common errors included
2nd Grade – 2008 39 Copyright ©2008 by Noyce Foundation All rights reserved.
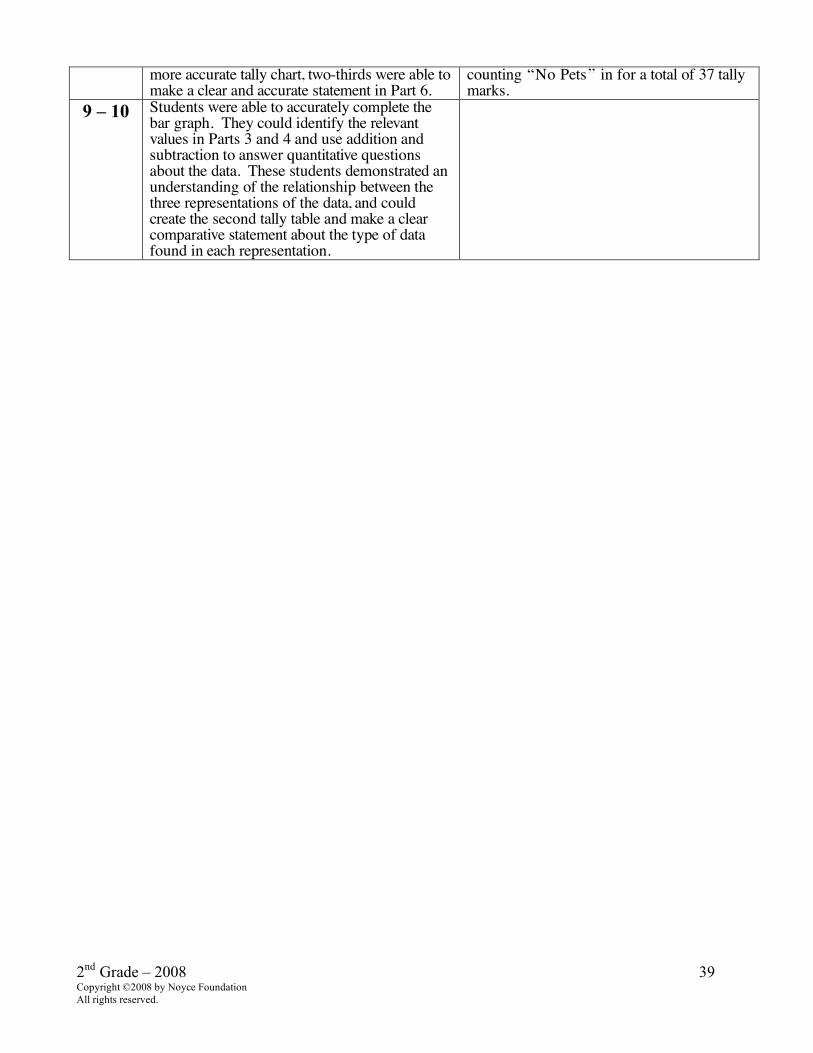
more accurate tally chart, two-thirds were able to make a clear and accurate statement in Part 6.
counting “No Pets” in for a total of 37 tally marks.
9 – 10 Students were able to accurately complete the bar graph. They could identify the relevant values in Parts 3 and 4 and use addition and subtraction to answer quantitative questions about the data. These students demonstrated an understanding of the relationship between the three representations of the data, and could create the second tally table and make a clear comparative statement about the type of data found in each representation.
2nd Grade – 2008 40 Copyright ©2008 by Noyce Foundation All rights reserved.
Teaching Implications In this task, we saw that students working at all but the highest levels struggled with answering the question “How many more?” when comparing two values on the graph.
Direct Modeling In their book, Children’s Mathematics (Heinemann, 1999), Thomas Carpenter and his colleagues reflect on their research with young children who have been given the opportunity to direct model their thinking and actions when operating on two values. These students were given many opportunities to use cubes to directly model various actions they interpreted from math stories involving combining, separating, or comparing values. Looking at the curriculum and materials for your classroom, where can you provide experiences for them experience direct modeling?
Counting Strategies From these experiences, they invented counting strategies that were direct reflections of the actions they took with the cubes. From these counting strategies, they began to construct increasingly efficient counting strategies that involved groupings, doublings, etc. At each step along this progression, the students were engaged in constructing their own understandings and strategies. As you observe your own students, where can you guide them and use questioning techniques to help them identify and formalize the strategies they are using? Comparisons In many elementary math classrooms, young children who are asked to solve a task that involves a comparison to find out “How many more” between two values are often instructed to look for those “key words” which indicate that they should then subtract to find the answer. Interestingly, when children construct their own meaning, they very often don’t think of comparisons as subtractive in nature. In fact, when these children had stacked two sets of cubes (for example a tower of 5 and a tower of 7) to represent to values, they tended to solve the comparison by directly matching the cubes that were the same, and then counting on to the smaller value to find out the difference between the two. In our example, they would start with 5, and count up two cubes until they reached 7. Those two cubes represent the difference between the numbers.
Reflection If we insist that they use the definition “finding the difference” to mean “subtract”, are we overwriting their intuition about how this relationship works? How could using the techniques of Cognitively Guided Instruction described in Carpenter’s book help us to build on the intuition they bring to the mathematical situation? Making a connection between the two equations 5 + ___ = 7 and 7 – 5 = ____ deepens the children’s understanding of addition, subtraction, comparison, and inverse operations. It helps them understand the relationship between both operations, and between both values. When they understand this relationship, picking an operation becomes a trivial part of the mathematics, because they know the situation can be resolved using either addition or subtraction. In what ways could this deeper understanding support students who continue to struggle with the standard algorithm and counting backward models of subtraction?
2nd Grade – 2008 41 Copyright ©2008 by Noyce Foundation All rights reserved.
Ideas for Action Research In this task, we also saw that students working at all but the highest levels struggled with understanding that the three representations in the task were all generated from the same data. Re-Engagement Have your students complete the task, Pets, and/or use this activity any time your students are working with data. Use the student work to re-engage with your students afterward. Have them look at the three graphs that are part of the task. When students understand that these represent the same data, that they are in fact related, they can begin to reflect on the idea that different representations might be helpful to answer different questions. They can begin to imagine other ways they might represent the data. In order to help students make connections between various representations of the same data, use a questioning strategy such as:
• Can students identify the question asked to make the original tally table in the task? • Can they make the connection that the same question is answered with the bar graph? • Can they identify the question asked to make the second tally table? • Can they make a connection between that question and the data pool that answered that question? • Where did this data come from? • Who answered the question “how many students did not have pets”?
Once students have connected the data in the different representations, are they more successful in thinking about and explaining differences in information reflected about that data? Does thinking about the data this way help them to accurately make the second tally table? If not, what other experiences would help students explore these two questions about data sets and multiple representations of them?