performance audit of the streets division pothole … · performance audit of the streets...
TRANSCRIPT
Performance Audit of the Streets Division’s Pothole Repair Operations
Data Reliability and Program Efficiencies Can Be Improved
APRIL 2013
Audit Report Office of the City Auditor
City of San Diego

This Page Intentionally Left Blank
April 12, 2013
Honorable Mayor, City Council, and Audit Committee Members City of San Diego, California Transmitted herewith is an audit report on the Streets Division’s Pothole Repair Operations. This report was conducted in accordance with the City Auditor’s Fiscal Year 2013 Audit Work Plan, and the report is presented in accordance with City Charter Section 39.2. The Results in Brief is presented on page 1. Audit Objectives, Scope, and Methodology are presented in Appendix A. The Administration’s response to our audit recommendations is presented on page 30 of the report. We would like to thank staff from the Transportation & Storm Water Department’s Streets Maintenance Division for their assistance and cooperation during this audit. All of their valuable time and efforts spent on providing us information is greatly appreciated. The audit staff members responsible for this audit report are Chris Constantin, Chris Kime, Sunny McLernon, Steve Gomez, and Sara Collier.
Respectfully submitted,
Eduardo Luna City Auditor cc: Jan Goldsmith, City Attorney Scott Chadwick, Interim Chief Operating Officer Nelson Hernandez, Assistant Chief Operating Officer Kip Sturdevan, Transportation and Storm Water Director
John Helminski, Transportation and Storm Water Deputy Director Ken Whitfield, City Comptroller
Andrea Tevlin, Independent Budget Analyst
OFFICE OF THE CITY AUDITOR 1010 SECOND AVENUE, SUITE 555 ● SAN DIEGO, CA 92101
PHONE (619) 533-3165 ● FAX (619) 533-3036
TO REPORT FRAUD, WASTE, OR ABUSE, CALL OUR FRAUD HOTLINE (866) 809-3500

This Page Intentionally Left Blank
Table of Contents
Results In Brief 1
Background 3
Audit Results 6
Finding 1: Data Entry Inaccuracies Impede the Streets Division’s Ability to Accurately Report on Key Metrics 6
Finding 2: Streets Division’s Pothole Repair Operations Can Achieve a Better Balance of Services and Increase Efficiency of Its Operations 12
Conclusion 25
Recommendations 26
Appendix A: Objectives, Scope, and Methodology 28
Appendix B: Definition of Audit Recommendation Priorities 30

Performance Audit of the Streets Division’s Pothole Repair Operations
OCA-13-012 Page 1
Results In Brief
As requested by Councilmember and Audit Committee Chair, Kevin Faulconer, the Office of the City Auditor conducted a performance audit of the City of San Diego (City) pothole repair and tracking system, which is administered by the Transportation & Storm Water Department’s Streets Maintenance Division. Our office was asked to answer key questions regarding the division’s pothole repair operations.
Specifically, we were asked to assess the pothole repair operations and determine the accuracy and reliability of its operational data. In order to answer this question and assess pothole operations, we analyzed the pothole operations data system to determine the reliability of its operations data. Our testing identified high error rates for data relied upon to report key metrics, including repair response times and the number of potholes filled. We found that as a result of these errors, the division is unable to accurately report on certain metrics.
Additionally, we were asked to analyze the efficiency of pothole repair operations. To do this, we assessed the effectiveness of the City’s potholes repair program and reviewed methods used by other governments to track and follow-up on pothole complaints. We found the following:
• The division is unable to determine the average response time to repair reported potholes due to data reliability issues;
• The number of requests for service differ by council district;
• The deployment strategy can be improved to operate more efficiently; and
• Other cities repair processes are similar to San Diego.

Performance Audit of the Streets Division’s Pothole Repair Operations
OCA-13-012 Page 2
We made four recommendations to address the issues we identified and reported. The recommendations we made are intended to improve the division’s data accuracy and increase the annual number of potholes the division is able to fill.
Performance Audit of the Streets Division’s Pothole Repair Operations
OCA-13-012 Page 3
Background
Transportation & Storm Water Department
The City of San Diego Transportation & Storm Water Department (department) is responsible for the operation and maintenance of streets, sidewalks, and storm drains; has responsibility to help protect and improve the water quality of rivers, creeks, bays, and the ocean; performs traffic and transportation system engineering; manages the Utilities Undergrounding program; and plans and coordinates work in the right-of-way. To perform these functions, the department—which was formed under a City restructuring in 2011—is comprised of four distinct divisions:
• Administration and Right of Way Coordination
• Storm Water
• Streets
• Transportation Engineering Operations
This audit focuses on pothole repair operations which are part of the Light Asphalt Section within the Streets Division (division).
Streets Division’s Pothole Repair Responsibilities
The division is responsible for maintaining and repairing City streets, alleys, sidewalks, bridges and other infrastructure. In fiscal year 2012, the division reported more than 30,000 potholes repaired, and had a budget of approximately $1.3 million dollars dedicated to pothole repair operations. The division is also responsible for the City’s Resurfacing Program and for overseeing resurfacing and slurry seal contracts as well as maintaining other important street safety functions and equipment.
The division is currently under the Transportation & Storm Water Department but had previously been part of the General Services Department. Although the pothole repair function’s responsibility has been moved between departments, its primary performance measure—days to fill reported potholes—has remained primarily the same since 2009.
Performance Audit of the Streets Division’s Pothole Repair Operations
OCA-13-012 Page 4
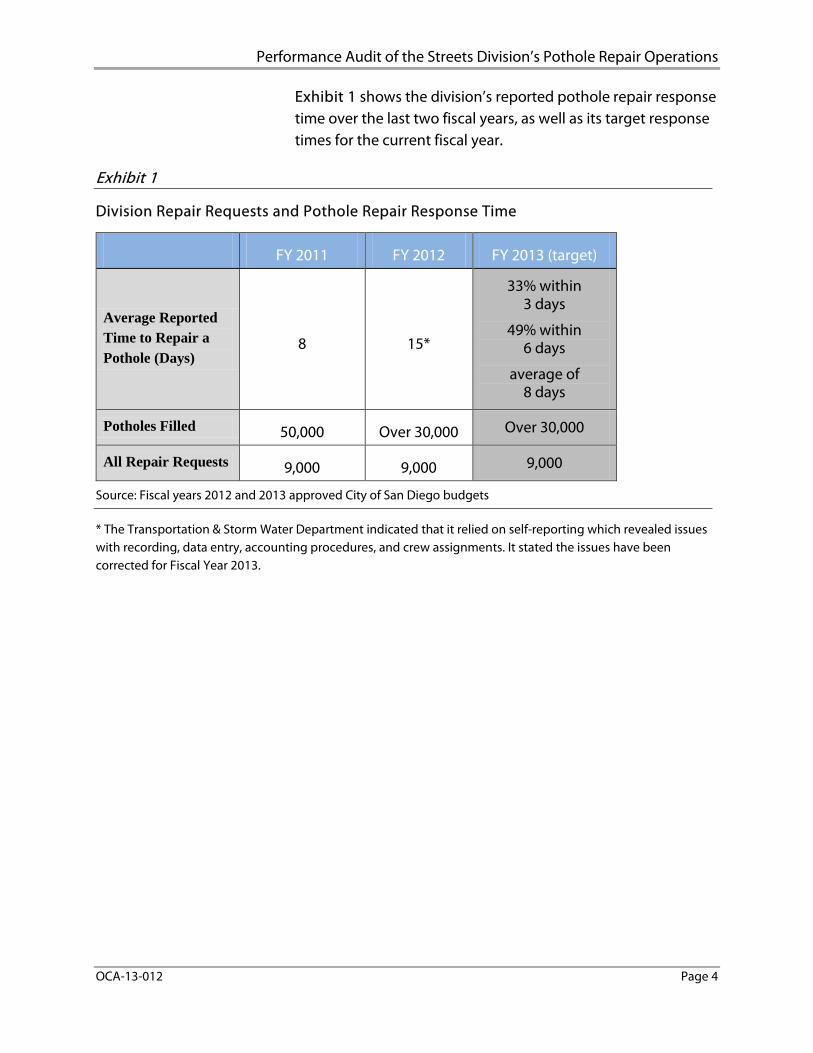
Exhibit 1 shows the division’s reported pothole repair response time over the last two fiscal years, as well as its target response times for the current fiscal year.
Exhibit 1
Division Repair Requests and Pothole Repair Response Time
Source: Fiscal years 2012 and 2013 approved City of San Diego budgets
* The Transportation & Storm Water Department indicated that it relied on self-reporting which revealed issues with recording, data entry, accounting procedures, and crew assignments. It stated the issues have been corrected for Fiscal Year 2013.
FY 2011 FY 2012 FY 2013 (target)
Average Reported Time to Repair a Pothole (Days)
8 15*
33% within 3 days
49% within 6 days
average of 8 days
Potholes Filled 50,000 Over 30,000 Over 30,000
All Repair Requests 9,000 9,000 9,000
Performance Audit of the Streets Division’s Pothole Repair Operations
OCA-13-012 Page 5
Methods of Notifying the Streets Division of
Potholes
Pothole repairs are initiated in response to repair requests made by the public. The public can make a repair request to the division by email, telephone, or through a mobile phone application. Additionally, residents can contact their City Council representative’s office to request pothole repairs. These repair requests can be for one pothole, several potholes, entire blocks or large sections of streets. Repair crews can repair what are referred to as “self-generated” potholes, or potholes that have not been reported to the division for repair, but that the crews identify and fill during their workday.
As stated earlier, the City’s pothole filling activities have been under the purview of different departments in the past years. It was not until 2009 that pothole operations started to report repair response time in the annual City budget. Since the 2009 budget, repair response time has been a key metric that has been reported as an assessment of pothole operations service delivery. The City did not report any metric for pothole repair operations in fiscal year 2007 and 2008 budgets. However, in the 2005 and 2006 adopted budgets, the responsible department reported an average cost per pothole as a key performance metric. Although it appears that this reporting metric has not been used for several years, it is a good measure of operational efficiency.
Performance Audit of the Streets Division’s Pothole Repair Operations
OCA-13-012 Page 6
Audit Results
Finding 1: Data Entry Inaccuracies Impede the Streets Division’s Ability to Accurately Report on Key Metrics
Our office was asked to answer key questions regarding the Streets Division’s (division) pothole repair operations. Among other things, we were specifically asked to assess the pothole repair operations and determine the accuracy and reliability of its core operational data. In order to answer this question and assess the pothole operations, we analyzed the pothole operations data system to determine the reliability of its operations data. Our testing identified high error rates for data relied upon to report key metrics, including repair response times and the number of potholes filled. We found that as a result of these errors, the division is unable to accurately report on certain metrics.
While these errors impede the division’s ability to accurately report on the progress of its operations, we were able to use the number of repair requests it received and completed, the repair locations and approximate dates of service to analyze the efficiency of its operational model (See Finding 2).

Performance Audit of the Streets Division’s Pothole Repair Operations
OCA-13-012 Page 7
Inconsistent Data Collection Tools and Data
Entry Inaccuracies Impede the Division’s Ability to
Report Key Metrics
We performed an analysis to evaluate the accuracy of the pothole repair data in the division’s information system (data system).1 Our analysis focused on the data system used to measure and manage the division’s operational workload and performance. This information included the repair request date, repair completion date, and the total number of potholes filled by repair crews. Our testing showed that the division’s data for fiscal year 2012 had deficiencies in both completeness (showing all information) and accuracy. Division management stated they were aware of data accuracy challenges with historic operational data. In response to these data accuracy issues, management began a data accuracy improvement effort in January 2012 via monthly and weekly managerial review of data input into the data system. Because of this effort, we performed our data reliability testing for the period of January 1, 2012 through September 30, 2012, to ensure we focused on a sufficient timeframe with the best data available.
The Least Reliable Data in the System Includes
Pothole Count and Date of Work Completed
Our analysis of the division’s January through September 2012 data indicated that the two fields with the most errors were the field that recorded the number of potholes filled, and the date the work was completed. We evaluated the accuracy of these fields by comparing a hard copy sample of the daily work reports (which record daily activities of the pothole repair crews) to the information contained in the division’s data system.
For our testing sample, we used a random sample of 29 working days between January 1, 2012 and September 30, 2012, from a total of 222 possible working days in that period. In every sampled day, we found erroneous service entries including miscounted potholes, and/or incorrect dates for work completed. The frequency and nature of these errors shows that data entry errors occur on most days.
By further reviewing the data errors, we found that the most common errors impact key metrics used for planning repair operations and reporting services completed. Specifically, our
1 The Streets Division has utilized SAP’s Enterprise Asset Management as its core data system for over 10 years, and maintains its system independently of the City’s Financial SAP system.
Performance Audit of the Streets Division’s Pothole Repair Operations
OCA-13-012 Page 8
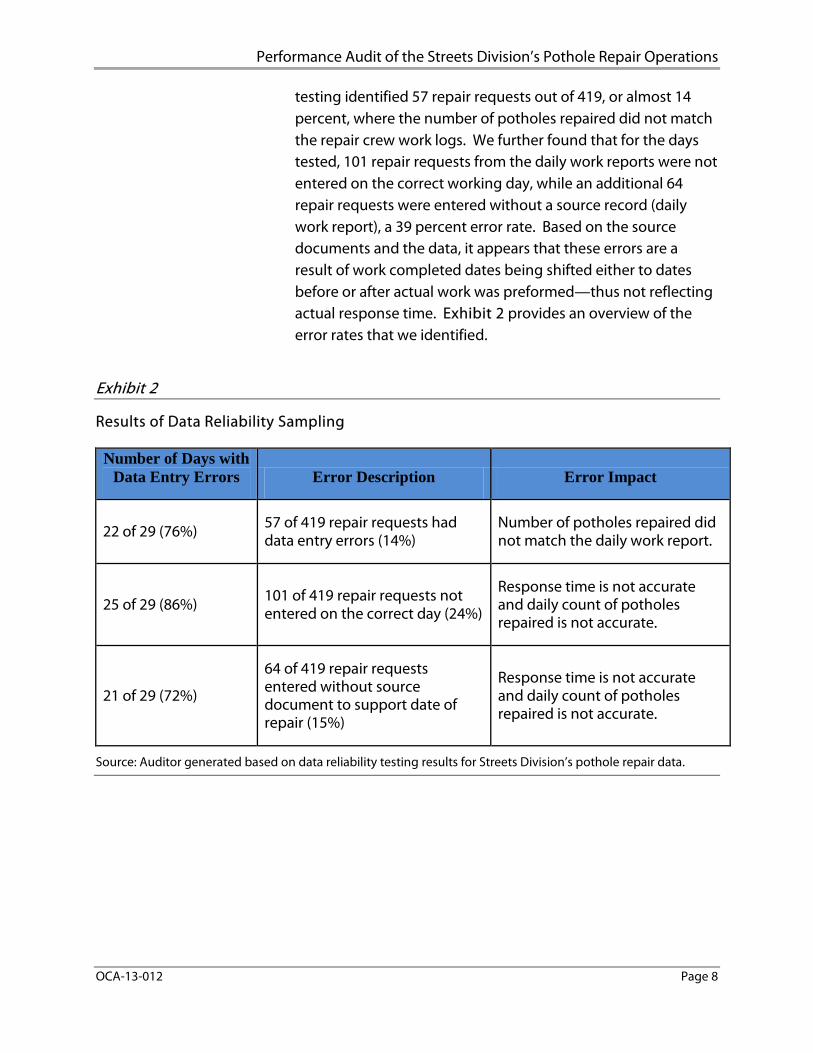
testing identified 57 repair requests out of 419, or almost 14 percent, where the number of potholes repaired did not match the repair crew work logs. We further found that for the days tested, 101 repair requests from the daily work reports were not entered on the correct working day, while an additional 64 repair requests were entered without a source record (daily work report), a 39 percent error rate. Based on the source documents and the data, it appears that these errors are a result of work completed dates being shifted either to dates before or after actual work was preformed—thus not reflecting actual response time. Exhibit 2 provides an overview of the error rates that we identified.
Exhibit 2
Results of Data Reliability Sampling
Number of Days with Data Entry Errors Error Description Error Impact
22 of 29 (76%) 57 of 419 repair requests had data entry errors (14%)
Number of potholes repaired did not match the daily work report.
25 of 29 (86%) 101 of 419 repair requests not entered on the correct day (24%)
Response time is not accurate and daily count of potholes repaired is not accurate.
21 of 29 (72%)
64 of 419 repair requests entered without source document to support date of repair (15%)
Response time is not accurate and daily count of potholes repaired is not accurate.
Source: Auditor generated based on data reliability testing results for Streets Division’s pothole repair data.
Performance Audit of the Streets Division’s Pothole Repair Operations
OCA-13-012 Page 9
Inaccuracies Impact the Division’s Ability to
Accurately Calculate and Report Key Metrics
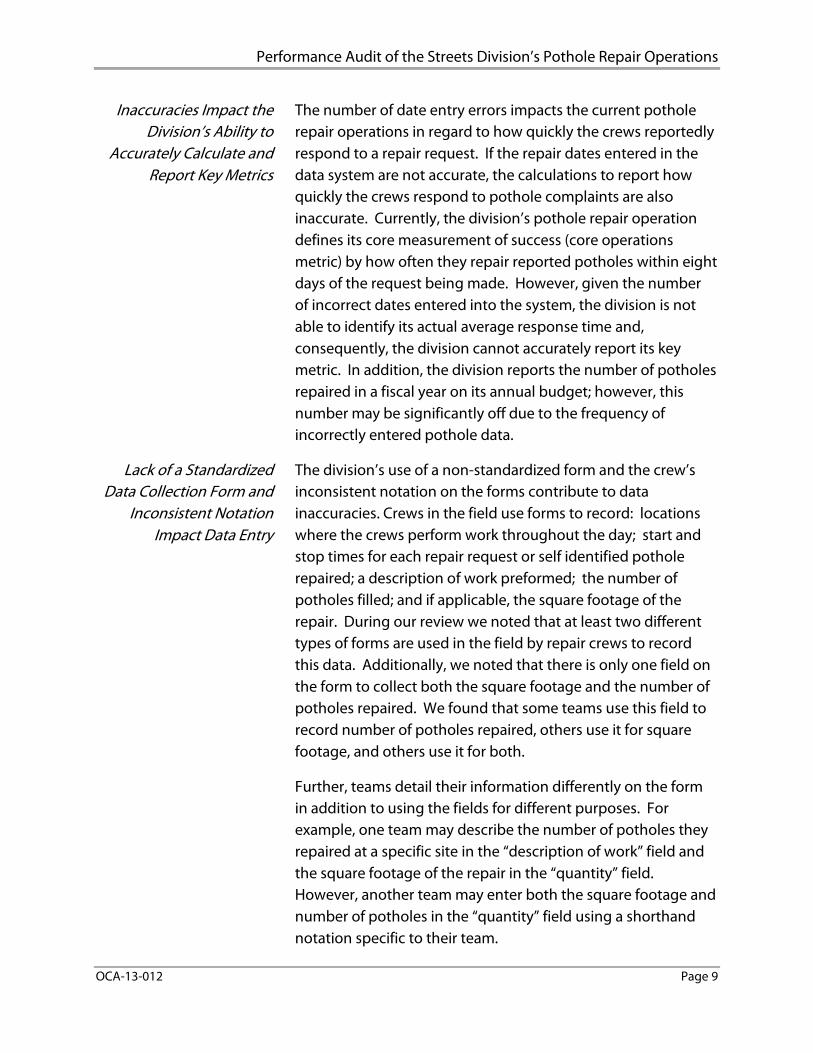
The number of date entry errors impacts the current pothole repair operations in regard to how quickly the crews reportedly respond to a repair request. If the repair dates entered in the data system are not accurate, the calculations to report how quickly the crews respond to pothole complaints are also inaccurate. Currently, the division’s pothole repair operation defines its core measurement of success (core operations metric) by how often they repair reported potholes within eight days of the request being made. However, given the number of incorrect dates entered into the system, the division is not able to identify its actual average response time and, consequently, the division cannot accurately report its key metric. In addition, the division reports the number of potholes repaired in a fiscal year on its annual budget; however, this number may be significantly off due to the frequency of incorrectly entered pothole data.
Lack of a Standardized Data Collection Form and
Inconsistent Notation Impact Data Entry
The division’s use of a non-standardized form and the crew’s inconsistent notation on the forms contribute to data inaccuracies. Crews in the field use forms to record: locations where the crews perform work throughout the day; start and stop times for each repair request or self identified pothole repaired; a description of work preformed; the number of potholes filled; and if applicable, the square footage of the repair. During our review we noted that at least two different types of forms are used in the field by repair crews to record this data. Additionally, we noted that there is only one field on the form to collect both the square footage and the number of potholes repaired. We found that some teams use this field to record number of potholes repaired, others use it for square footage, and others use it for both.
Further, teams detail their information differently on the form in addition to using the fields for different purposes. For example, one team may describe the number of potholes they repaired at a specific site in the “description of work” field and the square footage of the repair in the “quantity” field. However, another team may enter both the square footage and number of potholes in the “quantity” field using a shorthand notation specific to their team.
Performance Audit of the Streets Division’s Pothole Repair Operations
OCA-13-012 Page 10
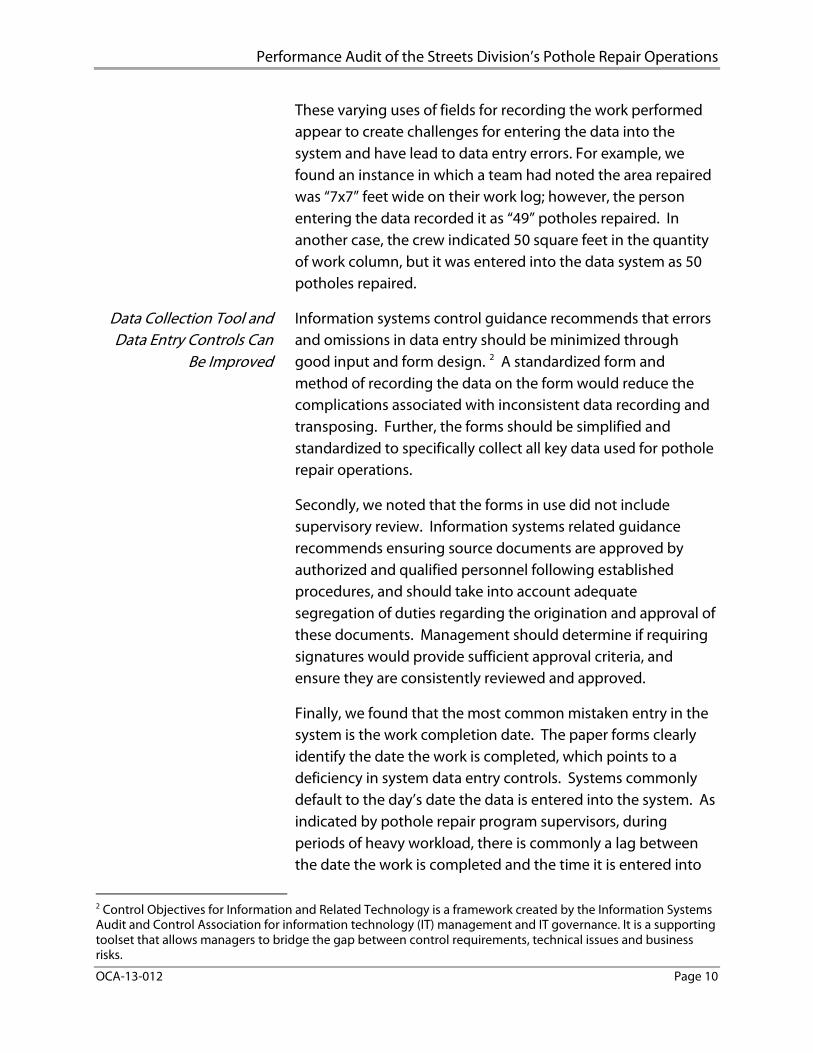
These varying uses of fields for recording the work performed appear to create challenges for entering the data into the system and have lead to data entry errors. For example, we found an instance in which a team had noted the area repaired was “7x7” feet wide on their work log; however, the person entering the data recorded it as “49” potholes repaired. In another case, the crew indicated 50 square feet in the quantity of work column, but it was entered into the data system as 50 potholes repaired.
Data Collection Tool and Data Entry Controls Can
Be Improved
Information systems control guidance recommends that errors and omissions in data entry should be minimized through good input and form design. 2 A standardized form and method of recording the data on the form would reduce the complications associated with inconsistent data recording and transposing. Further, the forms should be simplified and standardized to specifically collect all key data used for pothole repair operations.
Secondly, we noted that the forms in use did not include supervisory review. Information systems related guidance recommends ensuring source documents are approved by authorized and qualified personnel following established procedures, and should take into account adequate segregation of duties regarding the origination and approval of these documents. Management should determine if requiring signatures would provide sufficient approval criteria, and ensure they are consistently reviewed and approved.
Finally, we found that the most common mistaken entry in the system is the work completion date. The paper forms clearly identify the date the work is completed, which points to a deficiency in system data entry controls. Systems commonly default to the day’s date the data is entered into the system. As indicated by pothole repair program supervisors, during periods of heavy workload, there is commonly a lag between the date the work is completed and the time it is entered into
2 Control Objectives for Information and Related Technology is a framework created by the Information Systems Audit and Control Association for information technology (IT) management and IT governance. It is a supporting toolset that allows managers to bridge the gap between control requirements, technical issues and business risks.

Performance Audit of the Streets Division’s Pothole Repair Operations
OCA-13-012 Page 11
the system. The division’s information technology personnel should review the current controls over the date entry. Specifically, they should consider additional controls over the date entry, such as leaving the field blank and making it a required field to ensure the data entry personnel enters the actual date the work was performed, rather than allowing the date data was entered to be the default date.
Performance Audit of the Streets Division’s Pothole Repair Operations
OCA-13-012 Page 12
Finding 2: Streets Division’s Pothole Repair Operations Can Achieve a Better Balance of Services and Increase Efficiency of Its Operations
We were asked to analyze the efficiency of pothole repair operations. Specifically, we evaluated the pothole repair response times; assessed the effectiveness of the City’s pothole repair program; and reviewed methods used by other governments to track and follow-up on potholes complaints. As reported in Finding I, the division is unable to determine the average response time to repair reported potholes due to data reliability issues. Nevertheless, we were able to analyze the efficiency of its operational model.
We found the following:
• The number of requests for service differ by council district;
• The deployment strategy can be improved to operate more efficiently; and
• Other cities repair processes are similar to San Diego.
Number of Requests for Services Differ by Council
District, Leading to a Disparity in Services
Received
The divisions’ pothole operations currently rely on resident complaints, or repair requests, to identify and prioritize potholes for repair. The division does not base pothole repair priorities on council districts; however, certain districts request services more frequently and therefore receive more pothole repair services. In addition to the complaint-driven repair model resulting in some areas receiving more services than other areas of the City, this operational model also does not systematically address potholes that are not reported.
Performance Audit of the Streets Division’s Pothole Repair Operations
OCA-13-012 Page 13
Current Pothole Repair Operation Deployment
Model
The division’s light asphalt section has eight pothole repair crews. Each crew is made up of a 2-person team and one hot asphalt truck. For pothole repair deployment, the division divides the City into two areas, North and South, which is divided by Interstate 8. Both areas are roughly divided into four quadrants, with each quadrant having one pothole repair crew to service it. Each workday, asphalt supervisors give a listing of repair requests to crews for their quadrant. The crews then are deployed to repair the potholes identified in the repair requests, and also to repair any crew-identified potholes found during their routes. If during the course of the workday, a priority pothole repair request comes in to the division—report of a pothole that is hazardous—the asphalt supervisor or a dispatcher will notify the repair crew and the crew will leave their route to repair the priority pothole.
Council Districts Receive Different Levels of Service
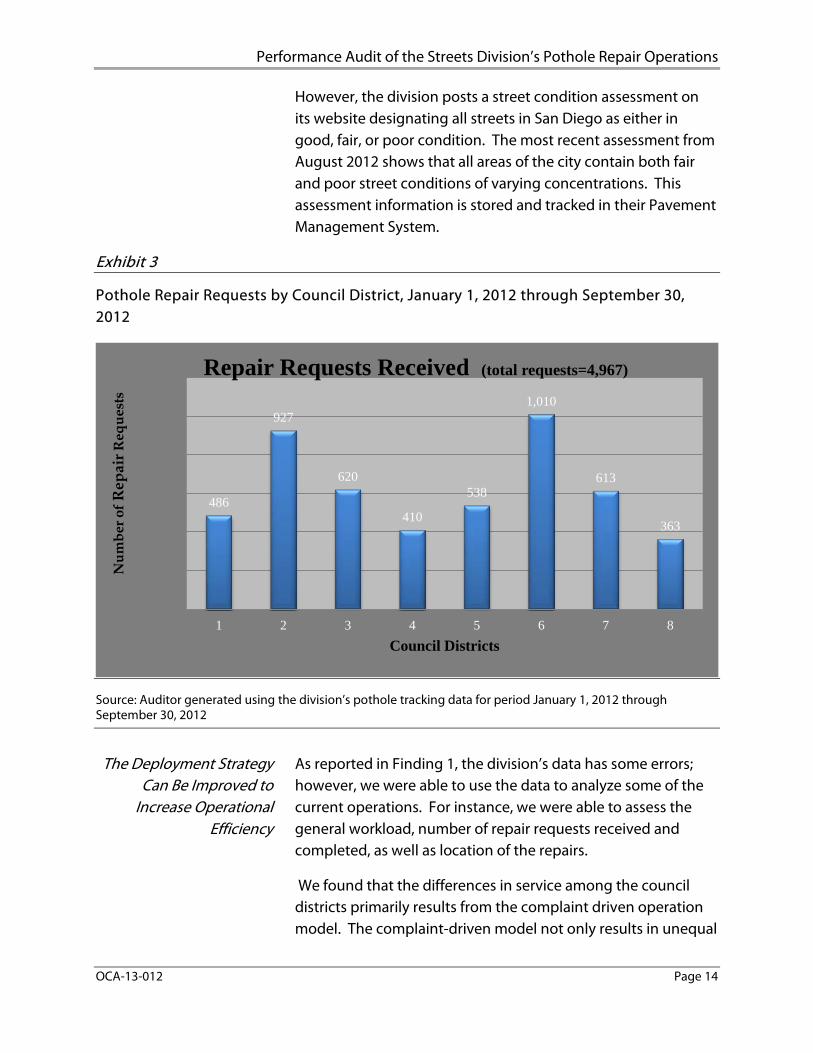
We reviewed the division’s data and found that although each repair crew generally services one quadrant, there are variations in the volume of repair requests by quadrant. Although the division does not base the quadrants on council district, the division’s data identifies which council district each repair was made within. As with the quadrants, we also found that council districts request repairs at different rates. Some districts consistently request more pothole repairs than other districts, see Exhibit 3. For instance, Council District 6 requested an average of approximately 112 pothole repairs per month during the period we reviewed (January 1, 2012 through September 30, 2012), whereas Council District 8 requested an average of 40 pothole repairs per month in the same period.
This disparity in the rate that council districts request repairs not only results in some council districts receiving more services than other council districts, but also lacks a systematic mechanism to identify and fix unreported potholes. Therefore, although some council districts do request more pothole repairs, the repair request rates do not necessarily reflect the actual number of potholes in that council district.
The current complaint deployment model does not have a mechanism to assess and repair streets with the most potholes.
Performance Audit of the Streets Division’s Pothole Repair Operations
OCA-13-012 Page 14
However, the division posts a street condition assessment on its website designating all streets in San Diego as either in good, fair, or poor condition. The most recent assessment from August 2012 shows that all areas of the city contain both fair and poor street conditions of varying concentrations. This assessment information is stored and tracked in their Pavement Management System.
Exhibit 3
Pothole Repair Requests by Council District, January 1, 2012 through September 30, 2012
Source: Auditor generated using the division’s pothole tracking data for period January 1, 2012 through September 30, 2012
The Deployment Strategy Can Be Improved to
Increase Operational Efficiency
As reported in Finding 1, the division’s data has some errors; however, we were able to use the data to analyze some of the current operations. For instance, we were able to assess the general workload, number of repair requests received and completed, as well as location of the repairs.
We found that the differences in service among the council districts primarily results from the complaint driven operation model. The complaint-driven model not only results in unequal
486
927
620
410
538
1,010
613
363
1 2 3 4 5 6 7 8
Num
ber o
f Rep
air R
eque
sts
Council Districts
Repair Requests Received (total requests=4,967)
Performance Audit of the Streets Division’s Pothole Repair Operations
OCA-13-012 Page 15
amounts of services between council districts, but also in redundant trips to the same areas. As previously stated, potholes are repaired once a repair request is made to the division. However, when a repair request is made to the division for an area that was serviced recently, the repair crew must again return to the same area in order to try to meet the repair time performance metric of eight days. These redundant trips result in higher mileage over time and potentially fewer potholes filled per day which results in a higher cost per pothole repaired.
Utilizing the Process Improvement
Methodology, Lean, to Improve Performance
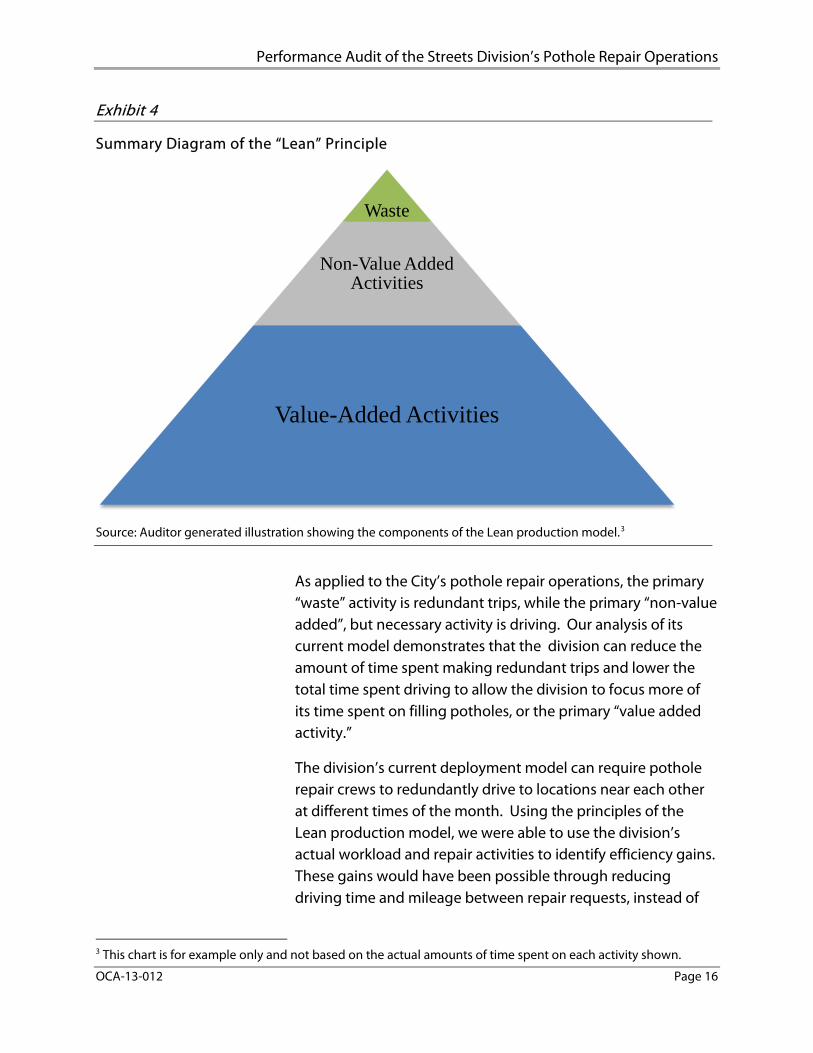
Redundant trips to the same area over time create inefficiencies in the pothole repair operations model. To reduce these inefficiencies, the private sector has utilized a model to measure and increase the efficiency of its operations through isolating “waste activity”, such as redundant trips, while reducing “non-value added activities”, such as driving, and focusing on the “value added activities,” in this case, repairing potholes. This model, illustrated in Exhibit 4 below, is known as the Lean production model and has been applied across various industries.
Performance Audit of the Streets Division’s Pothole Repair Operations
OCA-13-012 Page 16
Exhibit 4
Summary Diagram of the “Lean” Principle
Source: Auditor generated illustration showing the components of the Lean production model.3
As applied to the City’s pothole repair operations, the primary “waste” activity is redundant trips, while the primary “non-value added”, but necessary activity is driving. Our analysis of its current model demonstrates that the division can reduce the amount of time spent making redundant trips and lower the total time spent driving to allow the division to focus more of its time spent on filling potholes, or the primary “value added activity.”
The division’s current deployment model can require pothole repair crews to redundantly drive to locations near each other at different times of the month. Using the principles of the Lean production model, we were able to use the division’s actual workload and repair activities to identify efficiency gains. These gains would have been possible through reducing driving time and mileage between repair requests, instead of
3 This chart is for example only and not based on the actual amounts of time spent on each activity shown.
Waste
Non-Value Added Activities
Value-Added Activities
Performance Audit of the Streets Division’s Pothole Repair Operations
OCA-13-012 Page 17
focusing efforts on timeliness of completing repair requests.
Exhibits 5 and 6 below demonstrates how reducing driving (miles) can impact efficiency (number of potholes repaired) and increase the time available to repair potholes by putting the Lean production model into practice. To apply this model to pothole operations, we numbered each repair request/stop for a repair crew’s June 2012 activity and calculated the miles driven between the stops (repairs). The first model shows the crew’s actual number of stops made per day using the current deployment strategy that focuses only on responding to repair requests. The second model adopts a more regional approach for the deployment strategy which shows how the mileage and time could have been reduced if the repair crew repaired the potholes using a systematic method that would fill potholes geographically near each other.
The City’s pothole repair operations rely on a single asphalt plant near the Miramar area, which repair crews from both the north and south regions must use to fill their trucks in the morning. While this station significantly increases the mileage for the southern teams, according to the division, there are currently no other options for the crews to fill up their trucks due to contract and quality limitations.
Performance Audit of the Streets Division’s Pothole Repair Operations
OCA-13-012 Page 18
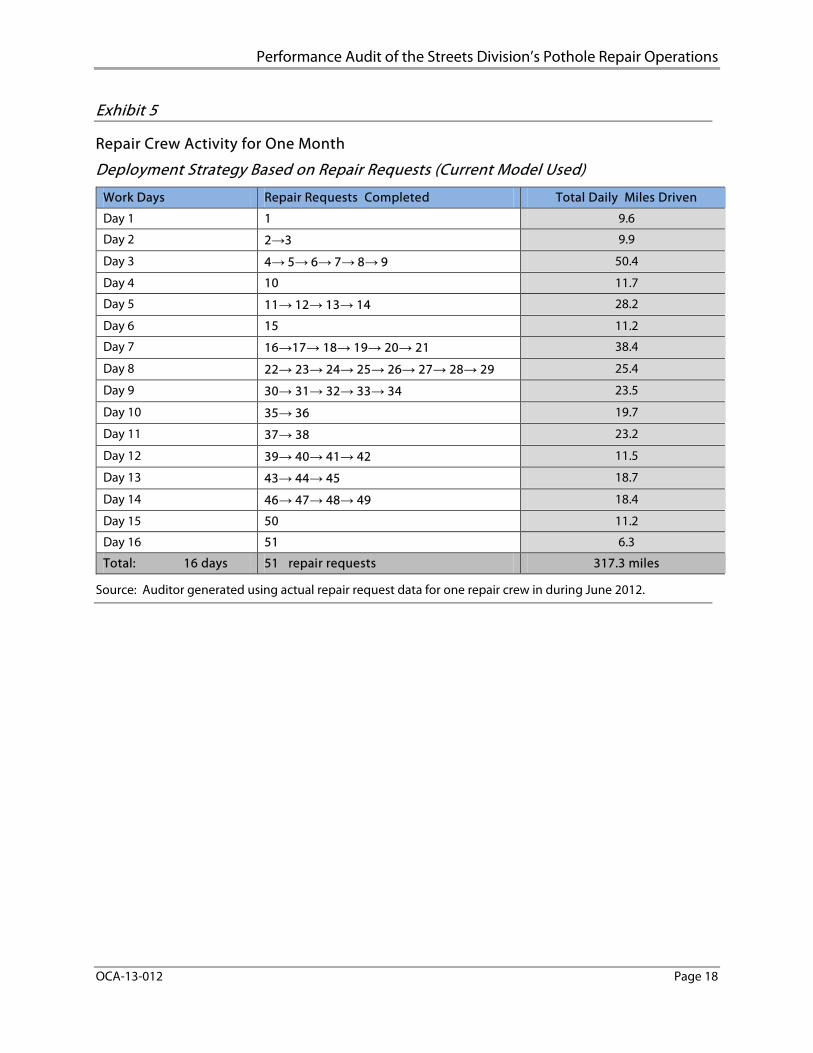
Exhibit 5
Repair Crew Activity for One Month
Deployment Strategy Based on Repair Requests (Current Model Used)
Work Days Repair Requests Completed Total Daily Miles Driven
Day 1 1 9.6
Day 2 2→3 9.9
Day 3 4→ 5→ 6→ 7→ 8→ 9 50.4
Day 4 10 11.7
Day 5 11→ 12→ 13→ 14 28.2
Day 6 15 11.2
Day 7 16→17→ 18→ 19→ 20→ 21 38.4
Day 8 22→ 23→ 24→ 25→ 26→ 27→ 28→ 29 25.4
Day 9 30→ 31→ 32→ 33→ 34 23.5
Day 10 35→ 36 19.7
Day 11 37→ 38 23.2
Day 12 39→ 40→ 41→ 42 11.5
Day 13 43→ 44→ 45 18.7
Day 14 46→ 47→ 48→ 49 18.4
Day 15 50 11.2
Day 16 51 6.3
Total: 16 days 51 repair requests 317.3 miles
Source: Auditor generated using actual repair request data for one repair crew in during June 2012.
Performance Audit of the Streets Division’s Pothole Repair Operations
OCA-13-012 Page 19
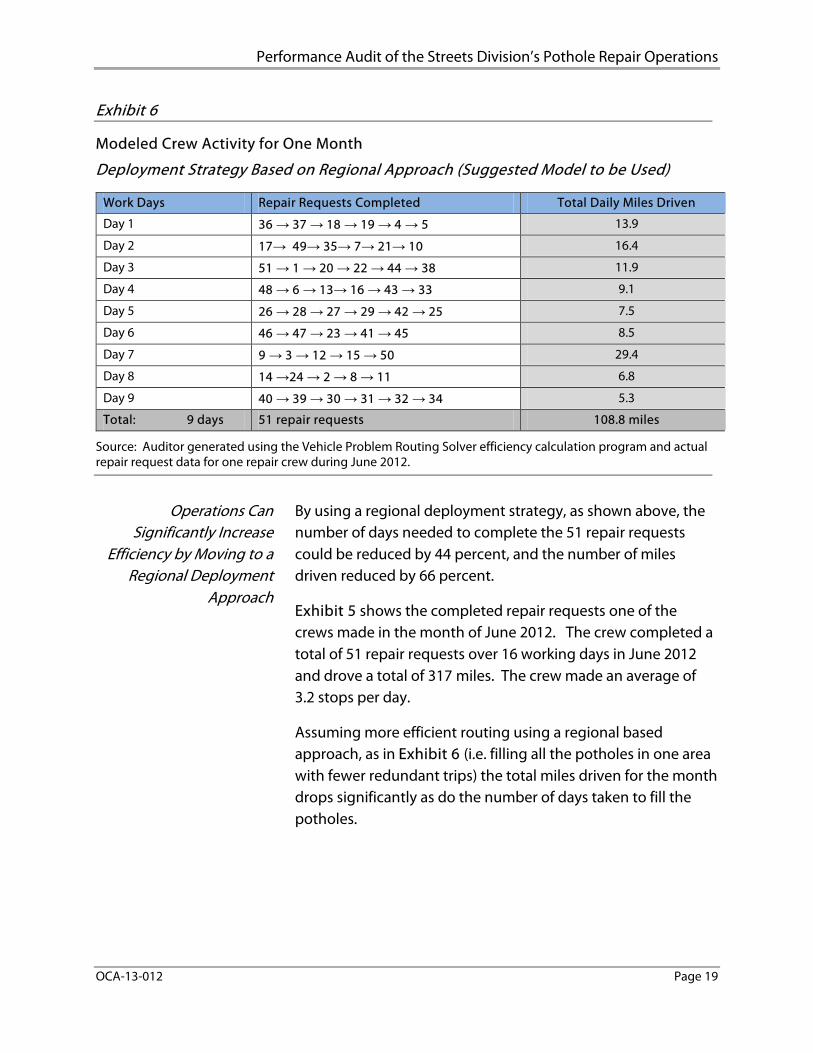
Exhibit 6
Modeled Crew Activity for One Month
Deployment Strategy Based on Regional Approach (Suggested Model to be Used)
Work Days Repair Requests Completed Total Daily Miles Driven
Day 1 36 → 37 → 18 → 19 → 4 → 5 13.9
Day 2 17→ 49→ 35→ 7→ 21→ 10 16.4
Day 3 51 → 1 → 20 → 22 → 44 → 38 11.9
Day 4 48 → 6 → 13→ 16 → 43 → 33 9.1
Day 5 26 → 28 → 27 → 29 → 42 → 25 7.5
Day 6 46 → 47 → 23 → 41 → 45 8.5
Day 7 9 → 3 → 12 → 15 → 50 29.4
Day 8 14 →24 → 2 → 8 → 11 6.8
Day 9 40 → 39 → 30 → 31 → 32 → 34 5.3
Total: 9 days 51 repair requests 108.8 miles
Source: Auditor generated using the Vehicle Problem Routing Solver efficiency calculation program and actual repair request data for one repair crew during June 2012.
Operations Can Significantly Increase
Efficiency by Moving to a Regional Deployment
Approach
By using a regional deployment strategy, as shown above, the number of days needed to complete the 51 repair requests could be reduced by 44 percent, and the number of miles driven reduced by 66 percent.
Exhibit 5 shows the completed repair requests one of the crews made in the month of June 2012. The crew completed a total of 51 repair requests over 16 working days in June 2012 and drove a total of 317 miles. The crew made an average of 3.2 stops per day.
Assuming more efficient routing using a regional based approach, as in Exhibit 6 (i.e. filling all the potholes in one area with fewer redundant trips) the total miles driven for the month drops significantly as do the number of days taken to fill the potholes.
Performance Audit of the Streets Division’s Pothole Repair Operations
OCA-13-012 Page 20
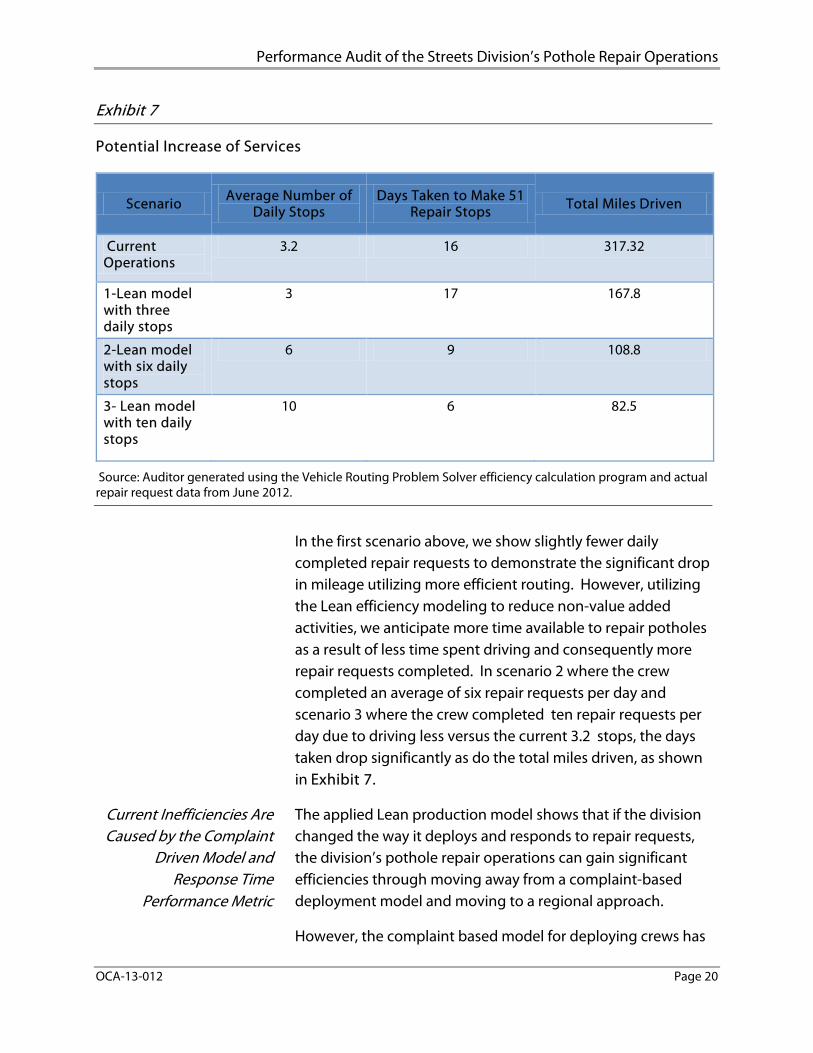
Exhibit 7
Potential Increase of Services
Scenario Average Number of Daily Stops
Days Taken to Make 51 Repair Stops Total Miles Driven
Current Operations
3.2 16 317.32
1-Lean model with three daily stops
3 17 167.8
2-Lean model with six daily stops
6 9 108.8
3- Lean model with ten daily stops
10 6 82.5
Source: Auditor generated using the Vehicle Routing Problem Solver efficiency calculation program and actual repair request data from June 2012.
In the first scenario above, we show slightly fewer daily completed repair requests to demonstrate the significant drop in mileage utilizing more efficient routing. However, utilizing the Lean efficiency modeling to reduce non-value added activities, we anticipate more time available to repair potholes as a result of less time spent driving and consequently more repair requests completed. In scenario 2 where the crew completed an average of six repair requests per day and scenario 3 where the crew completed ten repair requests per day due to driving less versus the current 3.2 stops, the days taken drop significantly as do the total miles driven, as shown in Exhibit 7.
Current Inefficiencies Are Caused by the Complaint
Driven Model and Response Time
Performance Metric
The applied Lean production model shows that if the division changed the way it deploys and responds to repair requests, the division’s pothole repair operations can gain significant efficiencies through moving away from a complaint-based deployment model and moving to a regional approach.
However, the complaint based model for deploying crews has
Performance Audit of the Streets Division’s Pothole Repair Operations
OCA-13-012 Page 21
been built into the division’s primary performance metric. The division currently measures its overall effectiveness on how quickly it responds to repair requests, as defined in the division’s budget. The division’s fiscal year 2013 budget details the primary pothole repair operations performance metric as responding to repair requests in less than eight days, regardless of how often requests are made for an area. As shown above, the current complaint-based system results in significant inefficiencies through redundant trips. Alternatively, the division could evaluate changing to a pro-active model of filling potholes by filling potholes as they are found rather than a reactive, complaint-driven model. At the end of calendar year 2012, the division experimented with a regional deployment pilot program in which it deployed its crews to a defined area to repair potholes, rather than having crews respond only to repair requests.
In order to reduce the mileage driven to repair potholes, the division should not use complaints as its only method to identify pothole locations, and instead it should systematically fill the potholes in an area. As previously mentioned, the division utilizes a Pavement Management System to record street assessment data as well as maintenance history. This system can also predict future street conditions and determine future maintenance needs and it may also assist the division in determining streets in most need of pothole repair. This assessment could be used in conjunction with complaints to identify areas for pothole repair when utilizing a regional approach. Moving away from the performance metric of an average repair response time of eight days and using a regional deployment strategy would allow the division to focus on filling potholes and utilize the same resources more efficiently.
The division would better serve the public through identifying a performance measure to focus on the efficiency of its operations versus how quickly it responds to a pothole complaint. A performance measure that takes into account the components of efficiency and resources, such as total cost and number of potholes repaired or cost-per-pothole, would ensure the division is utilizing its resources in the most efficient manner.
Performance Audit of the Streets Division’s Pothole Repair Operations
OCA-13-012 Page 22
Capturing Activity and Efficiency through Cost
per Pothole as a Performance Measure
Cost-per-pothole or unit cost is a way for management to relate total cost with work accomplished (output produced). It provides an incentive to look at costs in terms of outputs and can help target areas needing attention. The calculation for unit cost is Unit cost = total cost/total output.
Unit cost can be reduced by lowering cost or increasing outputs. For instance if the division had annual costs of $1.3 million and repaired 40,000 potholes per year, the unit cost or cost per pothole would be $32.50. By increasing the output to 60,000 potholes per year, the cost per pothole would be $21.67, reflecting a desired outcome. In this scenario, material costs would probably increase, but the change in unit cost can be evaluated to determine if the unit cost is consistent with management expectations. If total cost were to increase to $1.5 million, the unit cost, based on 60,000 repairs is $25 per pothole—still below the $32.50 mark.
Cost per pothole is an average total cost of producing one unit of output which can then be used to relate cost to work. By developing this measure, the division can quantify the effect of changing its deployment strategy and establish a performance measure that captures the relationship between input costs and output quantities.
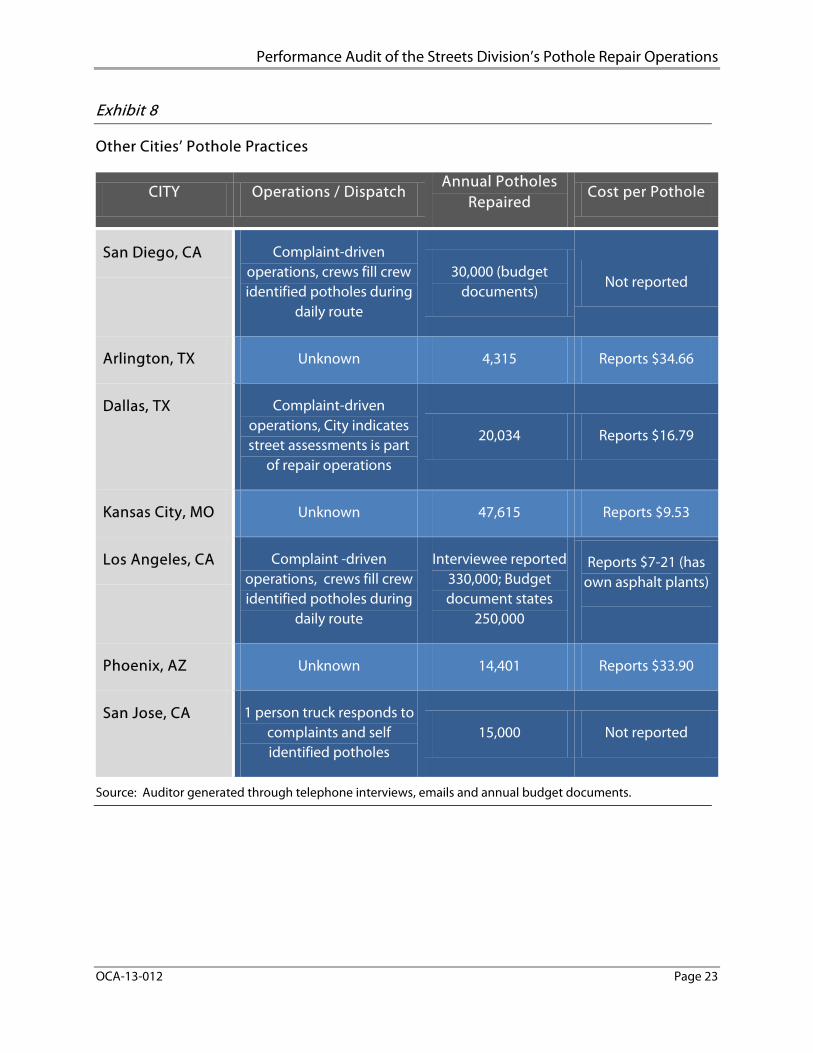
Other Cities’ Pothole Repair Practices
Many cities that we contacted or profiled manage their pothole repair operations in a similar fashion as the City of San Diego. Exhibit 8 shows that the cities we contacted also use a complaint-driven model for their pothole repair operations. However, during our audit, we found that several cities also track pothole repair efficiencies using a cost per pothole assessment. Although not all of these cities use the cost per pothole metric as a performance measure, they can use the average cost to evaluate if their program efficiency has increased or decreased over time.
Performance Audit of the Streets Division’s Pothole Repair Operations
OCA-13-012 Page 23
Exhibit 8
Other Cities’ Pothole Practices
CITY Operations / Dispatch Annual Potholes
Repaired Cost per Pothole
San Diego, CA Complaint-driven operations, crews fill crew identified potholes during
daily route
30,000 (budget documents)
Not reported
Arlington, TX Unknown 4,315 Reports $34.66
Dallas, TX Complaint-driven operations, City indicates street assessments is part
of repair operations
20,034 Reports $16.79
Kansas City, MO Unknown 47,615 Reports $9.53
Los Angeles, CA Complaint -driven operations, crews fill crew identified potholes during
daily route
Interviewee reported 330,000; Budget document states
250,000
Reports $7-21 (has own asphalt plants)
Phoenix, AZ Unknown 14,401 Reports $33.90
San Jose, CA 1 person truck responds to complaints and self identified potholes
15,000 Not reported
Source: Auditor generated through telephone interviews, emails and annual budget documents.
Performance Audit of the Streets Division’s Pothole Repair Operations
OCA-13-012 Page 24
Shifting Operational Focus to Increase Efficiencies
The division can reduce cost per pothole by including a regional-repair approach in its operations. As noted earlier, we found that if the division did use a regional or neighborhood pothole repair approach—focusing repair resources in targeted areas rather than only responding to complaints—it could have reduced overall miles driven and total days needed to complete repairs. Specifically, we found if the division used a targeted, or regional dispatching model, it could have repaired the same number of potholes as it did in June 2012, but reduced the total miles driven from 317 to 100, and decreased the number of days to repair those potholes from 16 to 9 days.
Currently the division’s focus is on meeting its performance metric of repairing reported potholes within an average of eight days. However, the division’s focus should be on filling as many potholes as possible and its goal to provide quality services should be focused on increasing the total number of potholes filled while keeping costs stable.
Performance Audit of the Streets Division’s Pothole Repair Operations
OCA-13-012 Page 25
Conclusion
Potholes are a vexing problem in many San Diego streets. In order to improve local road conditions, the City expends over $1.3 million annually in the tracking and repair of potholes. We found that the City can improve the reliability of its pothole operations data. Our testing identified high error rates for data relied upon to report key metrics, including repair response times and the number of potholes filled. We found that as a result of these errors, the division is unable to accurately report on certain metrics. We also found disparities in the number of service requests by council district. Utilizing a Lean production model, commonly used in the private sector to improve efficiency, we found that the division’s deployment strategy for repairing potholes can be improved to operate more efficiently. The Administration agreed to implement the four recommendations; as a result, we can expect that City residents will see increased pothole repair services and improved road conditions.
Performance Audit of the Streets Division’s Pothole Repair Operations
OCA-13-012 Page 26
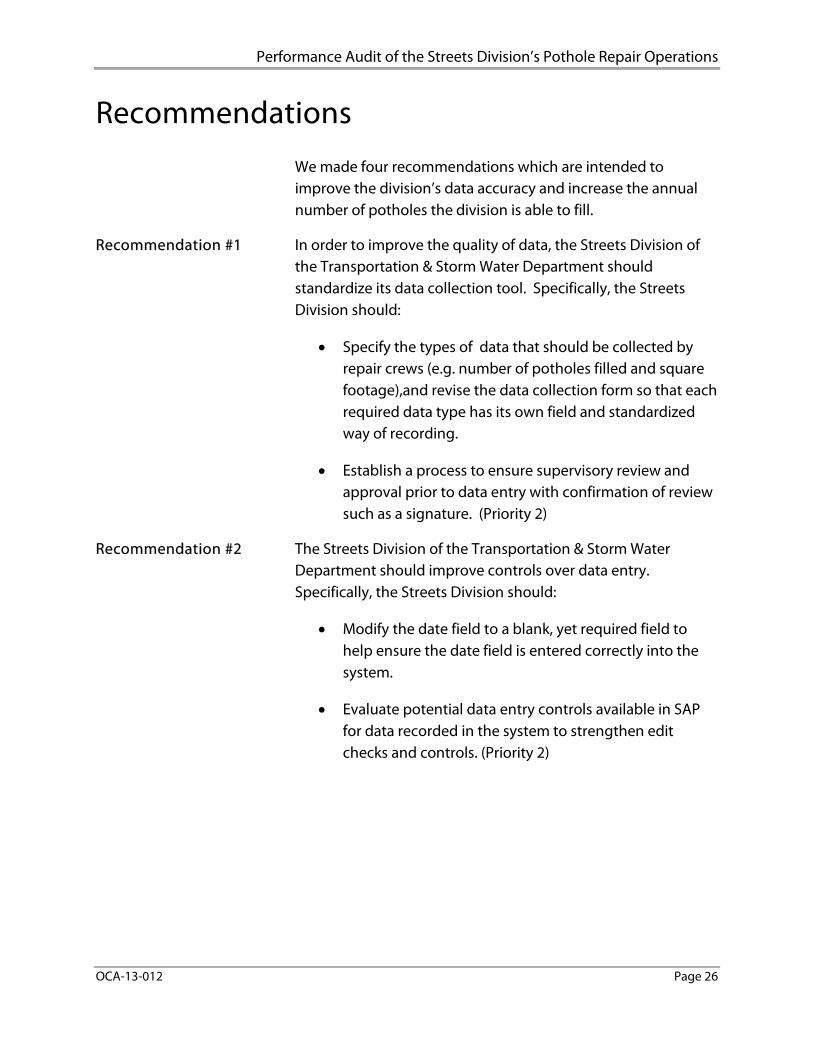
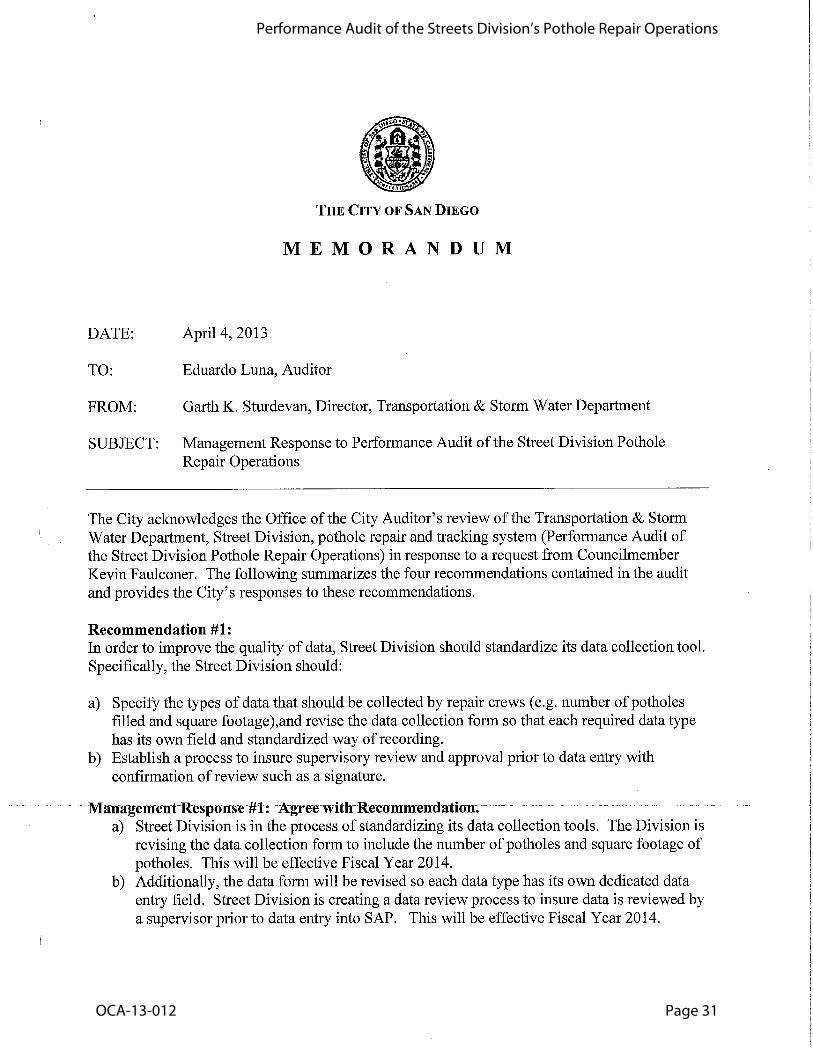
Recommendation #1 In order to improve the quality of data, the Streets Division of the Transportation & Storm Water Department should standardize its data collection tool. Specifically, the Streets Division should:
• Specify the types of data that should be collected by repair crews (e.g. number of potholes filled and square footage),and revise the data collection form so that each required data type has its own field and standardized way of recording.
• Establish a process to ensure supervisory review and approval prior to data entry with confirmation of review such as a signature. (Priority 2)
Recommendation #2 The Streets Division of the Transportation & Storm Water Department should improve controls over data entry. Specifically, the Streets Division should:
• Modify the date field to a blank, yet required field to help ensure the date field is entered correctly into the system.
• Evaluate potential data entry controls available in SAP for data recorded in the system to strengthen edit checks and controls. (Priority 2)
Recommendations
We made four recommendations which are intended to improve the division’s data accuracy and increase the annual number of potholes the division is able to fill.
Performance Audit of the Streets Division’s Pothole Repair Operations
OCA-13-012 Page 27
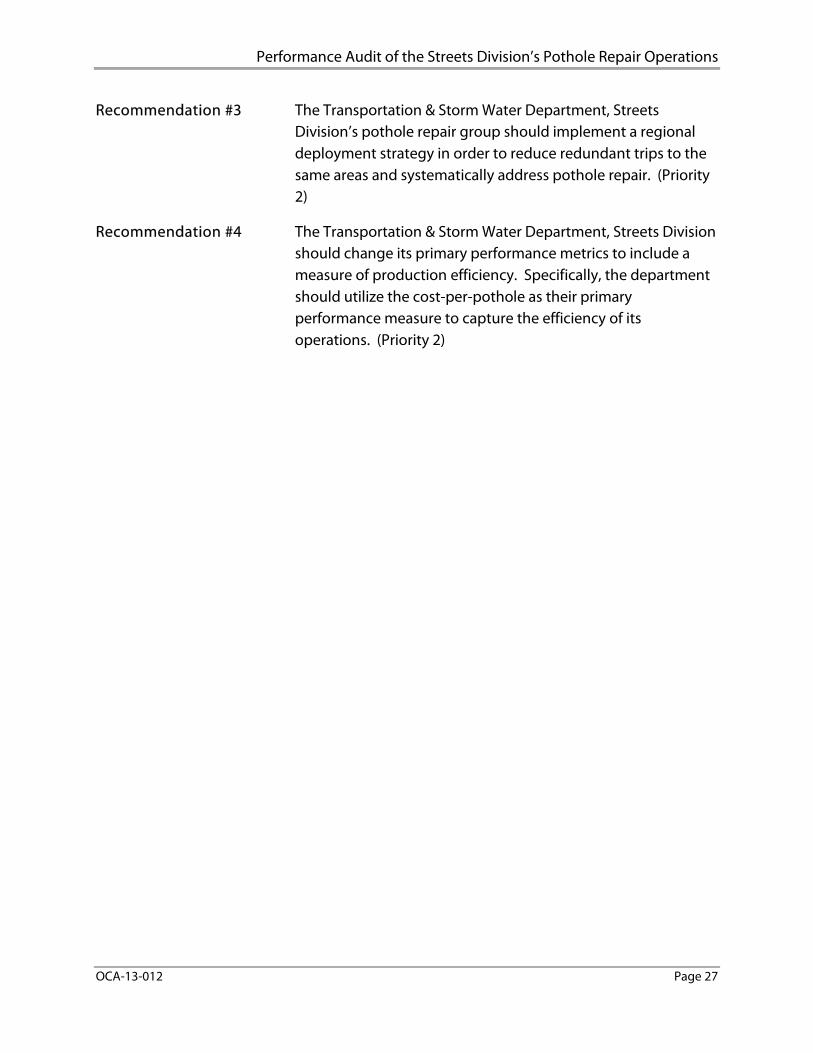
Recommendation #3
The Transportation & Storm Water Department, Streets Division’s pothole repair group should implement a regional deployment strategy in order to reduce redundant trips to the same areas and systematically address pothole repair. (Priority 2)
Recommendation #4 The Transportation & Storm Water Department, Streets Division should change its primary performance metrics to include a measure of production efficiency. Specifically, the department should utilize the cost-per-pothole as their primary performance measure to capture the efficiency of its operations. (Priority 2)
Performance Audit of the Streets Division’s Pothole Repair Operations
OCA-13-012 Page 28
Appendix A: Objectives, Scope, and Methodology
Objectives As requested by Councilmember and Audit Committee Chair, Kevin Faulconer, the Office of the City Auditor (OCA) included this audit of the pothole tracking system in our fiscal year 2013 audit work plan. Our review of the pothole repair operations focused on:
Determining the accuracy and reliability of core operational data;
Analyzing the effectiveness and efficiency of current pothole repair operations;
Evaluating the pothole repair response times analyzed both by council district and city wide; and
Identifying best practices used by other government pothole repair operations.
The pothole repair operations are administered by the Streets Division (division) within the Department of Transportation & Storm Water.
Scope & Methodology We reviewed pothole repair operations for the period of July 1, 2009 through December 31, 2012.
In order to test the accuracy of the division’s pothole operations data, we performed data reliability testing to determine the accuracy and completeness of the data. We focused our testing on the key operational data fields within its core information system by comparing the system data to the source documents.
To evaluate the effectiveness and efficiency of current pothole operations, we interviewed program management and observed operations through ride-alongs and auditor observations. We also analyzed the available pothole repair data to determine repair location as well as miles driven per day. We performed the mileage analysis by reviewing a sample of the daily routes used by the pothole repair crews.
Performance Audit of the Streets Division’s Pothole Repair Operations
OCA-13-012 Page 29
Finally, we compared the City of San Diego’s pothole repair operations with other cities’ pothole repair operations. We did this through interviewing other cities’ officials and by reviewing other programs’ pothole performance metrics and budget information.
We conducted this performance audit in accordance with generally accepted government auditing standards. Those standards require that we plan and perform the audit to obtain sufficient, appropriate evidence to provide a reasonable basis for our findings and conclusions based on our audit objectives. We believe that the evidence obtained provides a reasonable basis for our findings and conclusions based on our audit objectives.

Performance Audit of the Streets Division’s Pothole Repair Operations
OCA-13-012 Page 30
Appendix B: Definition of Audit Recommendation Priorities
DEFINITIONS OF PRIORITY 1, 2, AND 3 AUDIT RECOMMENDATIONS
The Office of the City Auditor maintains a classification scheme applicable to audit recommendations and the appropriate corrective actions as follows:
Priority Class4 Description5
Implementation Action6
1 Fraud or serious violations are being committed, significant fiscal or equivalent non-fiscal losses are occurring.
Immediate
2 A potential for incurring significant or equivalent fiscal and/or non-fiscal losses exist. Six months
3 Operation or administrative process will be improved.
Six months to one year
4 The City Auditor is responsible for assigning audit recommendation priority class numbers. A recommendation which clearly fits the description for more than one priority class shall be assigned the higher number. 5 For an audit recommendation to be considered related to a significant fiscal loss, it will usually be necessary for an actual loss of $50,000 or more to be involved or for a potential loss (including unrealized revenue increases) of $100,000 to be involved. Equivalent non-fiscal losses would include, but not be limited to, omission or commission of acts by or on behalf of the City which would be likely to expose the City to adverse criticism in the eyes of its residents. 6 The implementation time frame indicated for each priority class is intended as a guideline for establishing implementation target dates. While prioritizing recommendations is the responsibility of the City Auditor, determining implementation dates is the responsibility of the City Administration.
Performance Audit of the Streets Division’s Pothole Repair Operations
OCA-13-012 Page 31
Performance Audit of the Streets Division’s Pothole Repair Operations
OCA-13-012 Page 32
Performance Audit of the Streets Division’s Pothole Repair Operations
OCA-13-012 Page 33