performance-based long term incentive compensation and firm performance · ·...
TRANSCRIPT

Performance-Based Long Term Incentive Compensation
and Firm Performance∗
A Brief Prepared by the Institute for Compensation Studies
ILR School, Cornell University
Hassan Enayati, Kevin Hallock, and Linda Barrington
August 18, 2016
∗Funding for this study was provided by executive compensation consulting firm, Pearl Meyer, jointly
agreeing with the Institute for Compensation Studies (ICS) authors on the research question of interest.
This study builds upon our earlier work examining TSR, Executive Compensation, and Firm Performance.
Pearl Meyer obtained the underlying data from Equilar, Inc., a leading independent provider of executive
and board compensation data and analysis. Pearl Meyer provided these data to ICS for analysis, including
additional data on companies from Capital IQ, and “compensation plan existence and weight” variables that
they constructed. Pearl Meyer provided valuable insight on how executive compensation is structured in
the corporate landscape, which helped ICS ensure its models were valid in terms of real-world practice and
terminology. Independently, ICS conducted the statistical analyses herein. The views, opinions, findings
and conclusions or recommendations expressed in this paper are strictly those of the author(s). They do not
necessarily reflect the views of the ILR School at Cornell University.
For the complete set of analyses, please email Hassan Enayati at [email protected]. The authors wish to
thank Stephanie Thomas and the consultants at Pearl Meyer for their helpful comments.
1
1 Executive Summary
Awarding executives long-term incentive pay based on firm performance is often described
as a natural way to improve firm performance. This brief uses an analytical approach to
examine that proposed relationship. We first document the prevalence of performance-based
long-term incentive (PB LTI) measures and the trends in the relative size of these measures
compared to aggregate measures of compensation. We then compare the characteristics and
performance of firms that have implemented a PB LTI measure in the past to those that
have not. In order to understand the impact of PB LTI awards on firm performance, we
separately assess the roles of the existence of the PB LTI measures, the relative size of the
measures, and the type of PB LTI measure on firm performance.
Key Findings:
* In 2013, 88 percent of the 2014 S&P 500 firms offered PB LTI plans to one of their top
five named executive officers (NEO) - nearly a 40 percent increase from the level of 64
percent in 2006.
* There has been an increase in the weight of PB LTI awards relative to both all long-
term incentive pay and total direct compensation over the past eight years among NEOs.
Conditional upon having a PB LTI award, the average award has risen from 51 percent
of all LTI in 2006 to 56 percent in 2013.
* The increasing share of LTI that is performance-based is meaningful as LTI’s share of
TDC has jumped from 56 percent to 62 percent between 2006 and 2013.
* The inclusion of PB LTI plans is observed across all sectors, with particularly large uptake
in the Information Technology and Consumer Discretionary sectors.
* There are differences in the firms that include PB LTI awards in the compensation plans
of their executives compared to those that do not include PB LTI awards. Firms with PB
2

LTI awards tend to experience lower returns (as measured by 10 year compound annual
growth rates (CAGR) of Net Income, EBIT, EPS, ROA, and Free Cash Flow).
* Our models indicate a pattern of within-year increases of PB LTI on firm performance
followed by losses in subsequent years.
→ Contemporaneous estimates of the impact of a PB LTI plan on performance are positive
for one and three year TSR; however, we find a pattern of negative estimates for the
one and two year lags.
→ Results of the role of the relative weight of PB LTI plans on firm performance follow
a similar pattern of positive within year estimates followed by negative estimates in
lagged years when examining 1 year TSR and EPS growth. There is evidence of a
mostly positive impact on ROE and ROIC when increasing the weight of the plans.
* Comparing findings by level of analysis, i.e., top five NEOs, CEOs, and top five NEOs
excluding CEOs, across all subanalyses showed similar estimates and patterns.
3
2 Data
The firms studied in this brief were identified using the 2014 S&P 500 index. A rich longi-
tudinal dataset was constructed using compensation data and firm financial data covering
fiscal years 2006 through 2013.1 The information regarding compensation was derived from
Equilar’s executive compensation data. These data contain detailed records of the com-
pensation types and amounts for named executive officers from firms in our sample. For
example, we observe base salary, bonus payouts, stock awards, option awards, and several
types of incentive plan awards. Measures of firm performance include 1, 3 and 5-year TSR
as well as annual measures of return on equity (ROE), earning per share (EPS) growth, total
revenue growth, and return on invested capital (ROIC). Firm performance measures came
from Capital IQ.2
3 Methodology
To examine how the inclusion of PB LTI plans impacts firm performance, we used both
descriptive analysis and also regression analysis. The descriptive analysis compared the raw
patterns among groups of firms with and without PB LTI plans over time. The resulting
tables and figures are valuable in understanding the unconditional relationship between PB
LTI plans and firm performance. All analyses were conducted on three subsamples of ex-
ecutives: top five proxy-listed NEOs, CEOs only, and top five proxy-listed NEOs excluding
CEOs.
Regression analysis is used to as a way to control for other factors that might obscure
the role of PB LTI measures on firm performance. Our baseline model uses the following
1The analytical sample excluded firms due to extreme values: loses of 195 observations. Additionally,1,396 firm-year observations were removed from the sample when key data elements were missing. The finalbaseline sample consisted of 2,249 firm-year observations, which were associated with 367 firms.
2We would like to thank Pearl Meyer for providing us with the data used in this brief and also for con-structing the key measures of performance-based compensation, long-term incentive pay, total compensation,and others.
4
Ordinary Least Squares regression framework:
Yit = β1 + Zitβ2 + Sitβ3 + Ctβ4 + β5Xit + β6Xi,t−1 + β7Xi,t−2 + εit (1)
Yit represents a given performance measure for firm i in fiscal year t. The set of firm
performance measures studied in this brief are 1-year TSR, 3-year TSR, 5-year TSR, ROE,
EPS growth, total revenue growth, and ROIC. Zit is a set of control variables including
functions of market capitalization and an indicator for change in CEO. Our model also
accounts for sector performance and year fixed effects with Sit and Ct, respectively. The key
variables in this project are the PB LTI measures represented by Xit, which is an indicator
variable equal to one when a firm has any executive in the respective sample, i.e., top five
NEOs, CEOs, or top five NEOs excluding CEOs, with a PB LTI plan during the current
fiscal year. To analyze the role of weight on performance, Xit is set to the firm-level average,
given the respective sample, of the ratio of PB LTI award to either LTI or TDC. Our baseline
model includes two lags of Xit to account for a delay between PB LTI plan implementation
and impact on firm performance. Finally, the remaining error in the model is captured by
εit, which is clustered at the firm level.
Multiple extensions of the baseline model were investigated to assess the sensitivity of
our findings. One extension replaced the sector fixed effects with firm effects, which allows
the model to control for unobserved firm-specific and fixed attributes. We also considered
the impact of partitioning the sample across firm size and PB LTI plan history. Additional
sensitivity checks include removing the Financial sector from the analysis and running models
with a richer set of lag measures.
4 Findings
One of the most striking features of PB LTI plans among Fortune 500 firms is how common
they have become. Table 1 shows that the share of firms offering their NEOs PB LTI plans
5
has increased from 64 percent of firms in 2006 to 88 percent of firms in 2013. Put another
way, only one in ten Fortune 500 firms does not offer a PB LTI award to their NEOs. This
high level of prevalence is not driven by PB LTI awards only being offered to CEOs as
evidenced by the comparable prevalence levels among CEOs and top five NEOs excluding
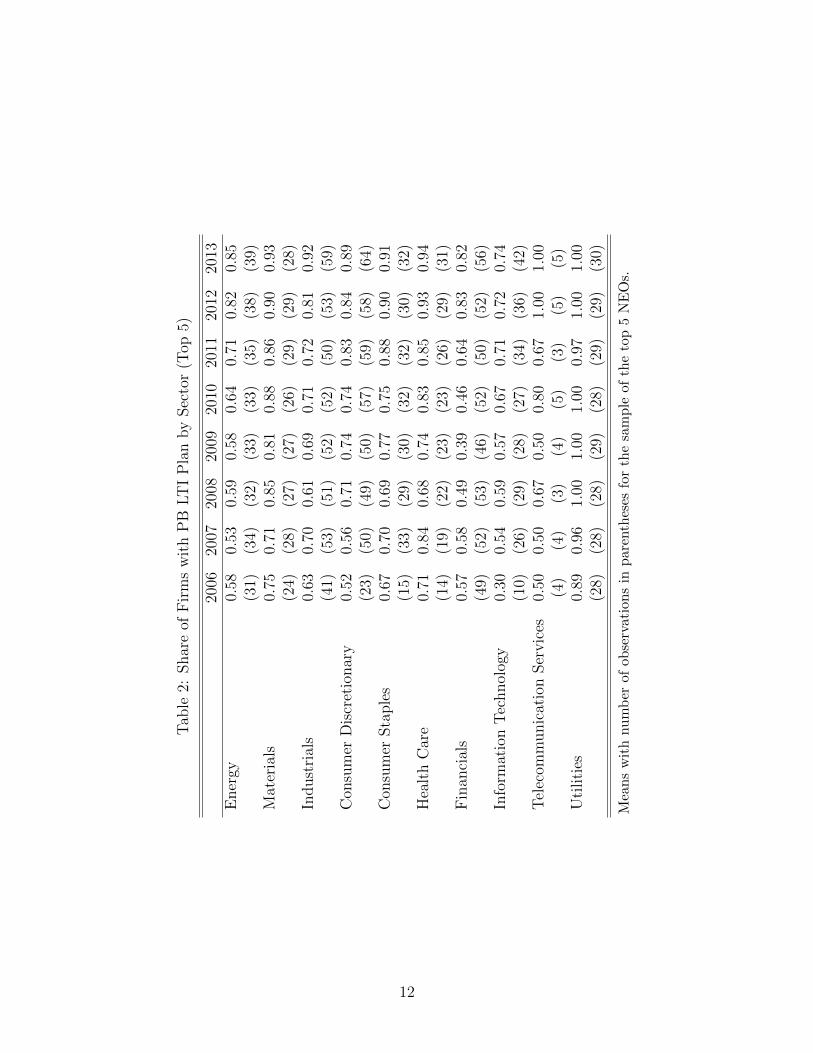
CEOs. Table 2 shows that firms in all sectors have increasingly included PB LTI plans in
the compensation of their executives.
With an understanding of the pervasiveness of PB LTI awards, we next assessed the
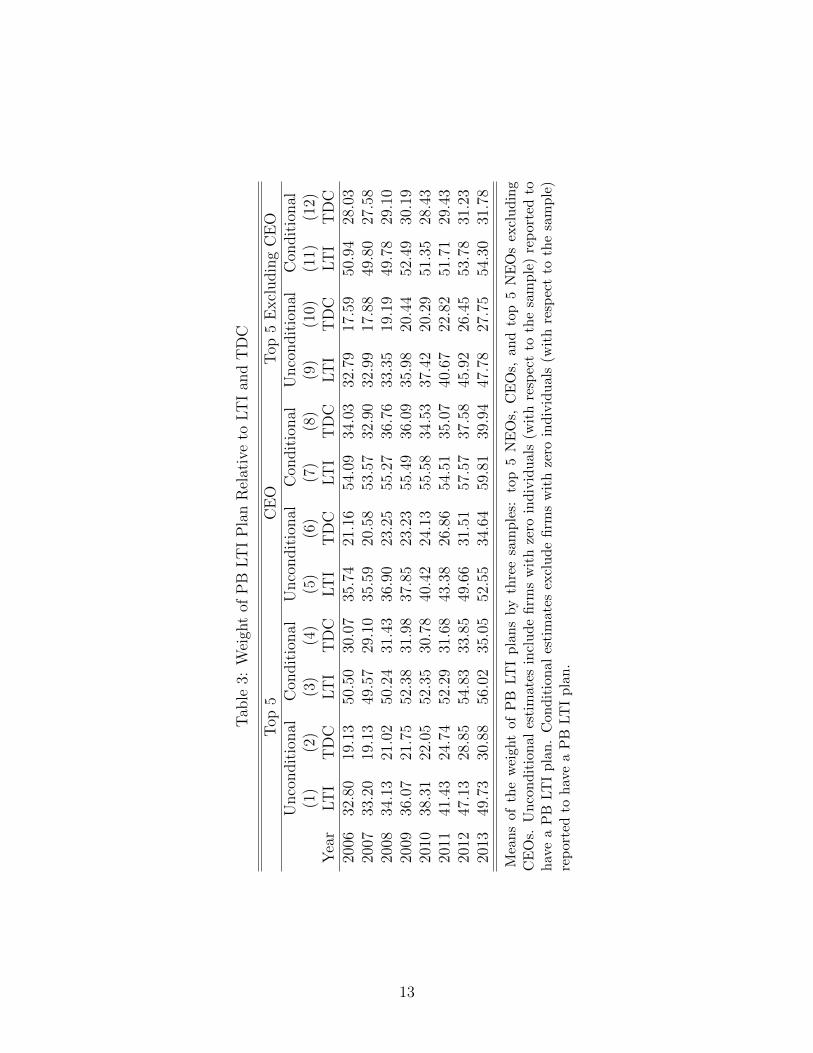
relative size of the PB LTI awards. Table 3 examines how the weight of PB LTI relative
to LTI and TDC has changed over time. The average weight of PB LTI plans has been
increasing over time among all firms (the unconditional columns); though the fast growth
rate is influenced by the rapid increase in the prevalence of these awards. For the firms that
actually offer PB LTI plans (conditional columns), the weight of the plans has increased
more modestly over the sample time period, e.g., NEO PB LTI weight grew from 51 percent
of LTI to 56 percent. Given the growth of LTI during this same time period, the share of
total compensation coming from PB LTI increased from 28 percent to 35 percent.3
In an effort to understand the prevalence and impact of specific components of PB LTI
awards, we worked with the executive compensation consulting firm Pearl Meyer to categorize
the thirty-one individual incentive pay metrics reported within the Equilar data into six
strategically-aligned groups. The groups and individual metrics are reported in Table 4:
Cash Flow, Growth, Market-Based, Profitability, Returns, and Other.
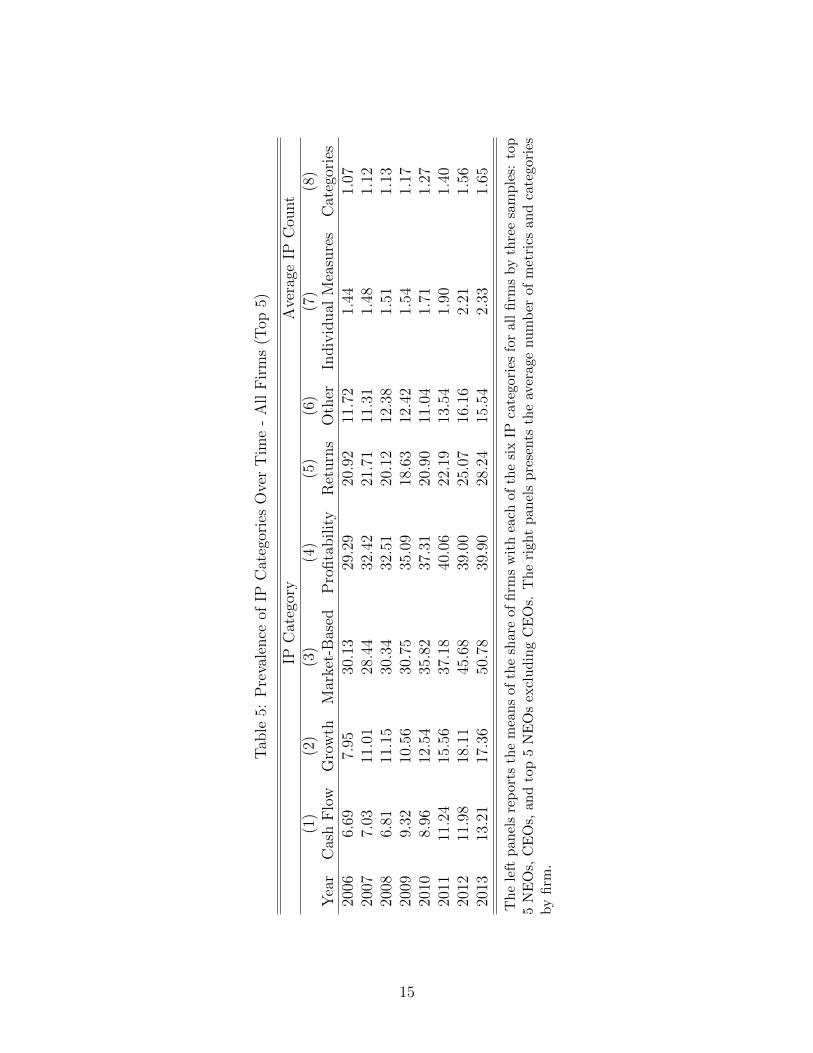
The trends in the prevalence of the IP categories among all firms are described in Table
5. We find that each of the six categories became more common over time. For example,
30 percent of firms offered Market-Based metrics to their NEOs in 2006 while 51 percent
offered Market-Based metrics in 2013. Table 6 reports the same prevalency rates but only
considers firms that offer at least one of their top five NEOs a PB LTI award. Conditioning
on PB LTI award changes the patterns observed in Table 5. Here we find that only Cash
3The share of total direct compensation attributed to LTI increased from 56 percent in 2006 to 62 percentin 2013.
6
Flow, Growth, and Market-Based metrics are becoming more common with the other three
groups becoming slightly less prevalent. Columns 7 and 8 report the number of individual
metrics and categories, respectively, in the NEOs plans. The average number of individual
measures among NEOs with a PB LTI award has increased by 17 percent from 2.36 to 2.75
metrics. At the same time, the number of unique categories only increased by 11 percent
(1.75 to 1.94). The slower growth rate of categories and higher value in individual measures
describe a situation where firms are offering NEOs multiple metrics from within the same
incentive pay category.
We next compared the performance of firms based on their prior history of offering PB
LTI awards to their NEOs. Table 7 shows the results of an analysis that separated firms
into one of three groups: those that always offered a PB LTI awards to their NEOs, those
that never offered the awards, and those that changed between offering and not. Results
indicate the firms that change or always had a PB LTI award have lower returns in terms
of Net Income, EBIT, EPS, and ROA. While Table 7 provides evidence of differences in
performance being related to a firm’s history offering PB LTI awards, these estimates may
be influenced by other factors associated to the firm.
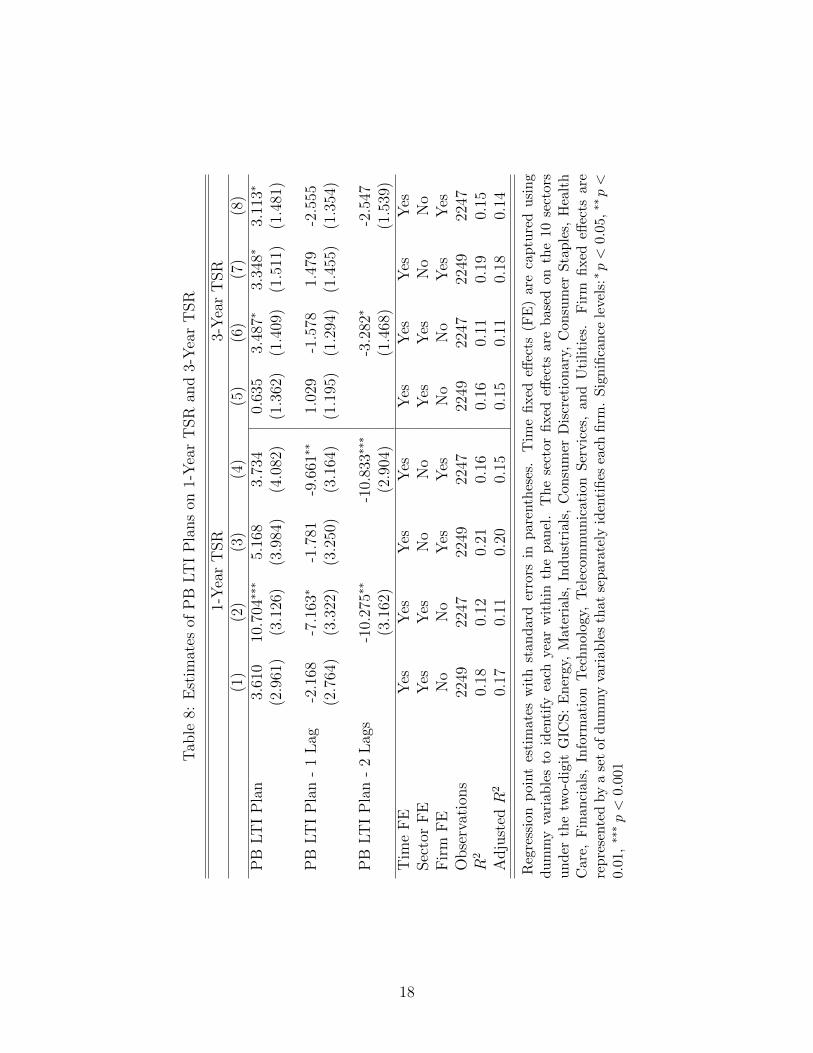
A series of regression analyses were implemented in an attempt to isolate the role of
PB LTI awards on firm performance. Tables 8 through 11 report the estimates from our
baseline model, described in Equation 1, of the relationship between the inclusion of PB
LTI awards and performance. The tables reveal a pattern of positive within year increases
followed by negative estimates in lagged years. For example, column 2 of Table 8 indicates
that including a PB LTI plan in the current year predicts a 10.7 percentage point jump in
1-year TSR. At the same time, we also find that having a PB LTI plan last year (two years
ago) predicts a 7.2 (10.3) percentage point decline in 1-year TSR. Looking at our preferred
specifications in the four columns reported for each dependent variable, we find evidence
of positive contemporaneous estimates on 1-year TSR, 3-year TSR, and ROE but negative
lagged estimates for 1-year TSR, 3-year TSR, and 5-year TSR.
7
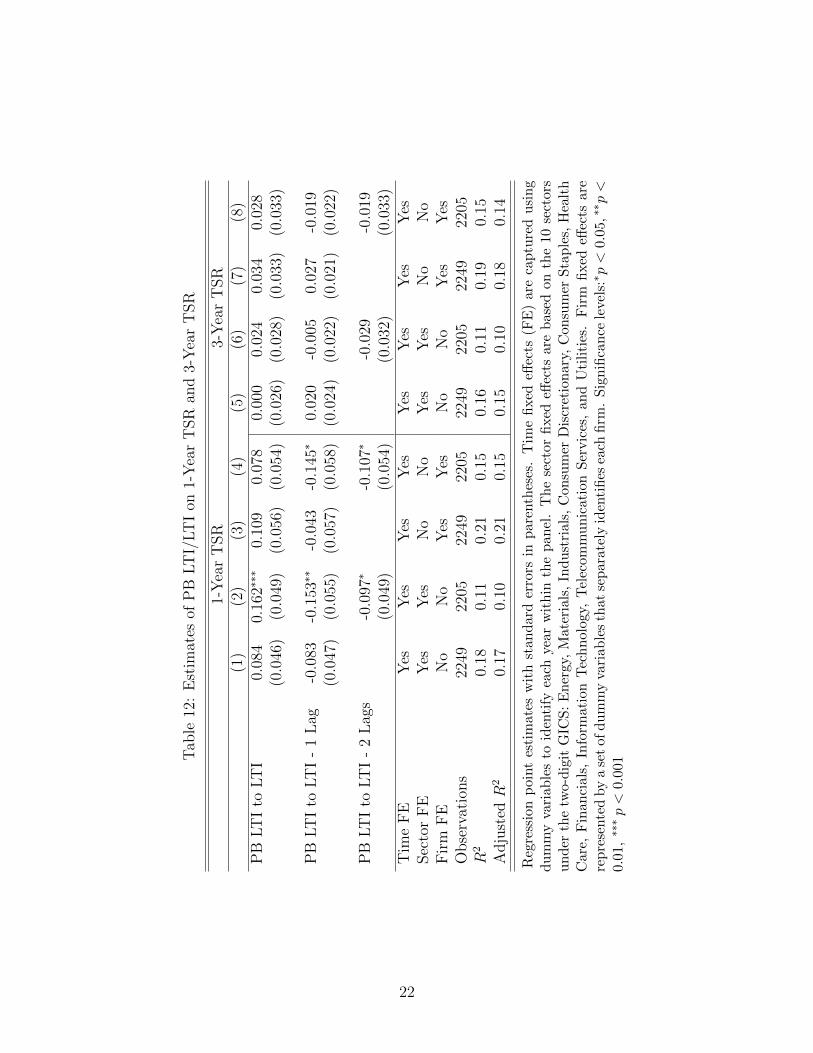
Estimates of the relative size of PB LTI to LTI on firm performance, reported in Tables
12 through 15, continue to present evidence of a short-term bump followed by a decline in
firm performance. Notably, a different set of firm performance measures are impacted by
changes in the weight compared to the introduction or removal of a PB LTI plan. Here we
find that the weight of PB LTI to LTI most directly predicts ROE, EPS Growth, and ROIC.
In fact, increasing the weight of PB LTI plans predicts only a positive increase in ROE and
ROIC with no subsequent decline, i.e., increasing the share of LTI that is performance based
by 1 percentage point is associated with between a 0.020 and 0.026 percentage point increase
in ROIC.
In addition to the baseline analysis, we performed a series of sensitivity checks, examining
the relative impact of market capitalization, financial sector, PB LTI offering pattern, and
richer five year lag structure. The positive relationship between contemporaneous PB LTI
plans is only present in Fortune 500 firms with lower market capitalization. Excluding firms
from the Financial sector weakens the evidence of the positive contemporaneous relationships
with PB LTI plans. Neither restricting the analysis to only those firms with changing PB
LTI policy nor extending the model to include five lags change the baseline findings other
than attenuating the results. Additionally, we explored the relationship between specific
incentive pay categories on firm performance but found most estimates to be insignificant.
Thus, these findings do not point to a particular category as driving the broader PB LTI
impact found earlier.
5 Discussion and Future Direction
Currently, almost ninety percent of the 2014 S&P 500 firms offer PB LTI plans to their named
executive officers - a forty percent increase between 2006 and 2013. The relative value of
these PB LTI plans has also increased over time, even among those firms that offer the plans,
with PB LTI awards now representing just over one third of the total direct compensation
8

for NEOs. Breaking all PB LTI into six major categories reveals that half of those categories
have growth while the other half remain stable or have slightly decreased.
Differences are observable in the firms that include PB LTI awards into the compensation
plans of their NEOs compared to those that do not. Firms with PB LTI plans experience
poorer performance in key areas. That said, the decision to use PB LTI awards may actually
have been a response by the board to improve poor performance among those firms with
any PB LTI history. In a similar vein, firms that have been performing well may not feel
the need to change their compensation structure. Thus, the usage of PB LTI awards may
be endogenous to observed firm performance, so care should be used when drawing causal
implications from descriptive statistics.
Our baseline models examined the impact of the inclusion and size of PB LTI awards on
firm performance. Evidence suggests that the inclusion of these plans results in short-term
increases in performance followed by later declines. Alternatively, increasing the weight
of the plans has a more positive impact overall, though there was still some evidence of
later losses. While these models provide a clearer understanding of the impact of PB LTI
awards on firm performance than the purely descriptive analyses, they still only describe the
statistical relationship and are not causal.
This work builds upon our prior work exploring the role of TSR awards on firm per-
formance. In this project, we aimed to understand how the role of the broader category
of PB LTI is related to firm performance and which subcomponents may be driving that
relationship. Future steps may include examining the role of compensation complexity on
the relationship between incentive pay and firm performance.
9

6 Appendix
This appendix provides variable definitions for key measures used in this study.
• TSR outcome measures, where the closing price is adjusted for dividends
– 1-Year TSR: (Fiscal year end stock price/previous fiscal year end stock price)-1
– 3-Year TSR: {(Fiscal year end stock price/three fiscal year priors end stock
price)(̂1/3)}-1
– 5-Year TSR: {(Fiscal year end stock price/five fiscal year priors end stock price)(̂1/5)}-
1
• TDC measure
– TDC = Long-Term Incentives + Base Salary + Short-Term Portion of NEIP
Compensation + Bonus
• LTI measure
– LTI = Grant Date Present Value of Securities + Grant Date Present Value of
Option (FAS 123(R)) + Grant Date Present Value of Target Award
10

7 Tables
Table 1: Percent of Firms with PB LTIPlans
Top 5 CEO Top 5Excluding CEO
2006 63.60 62.18 62.762007 65.75 62.35 64.832008 66.87 63.04 65.942009 68.01 64.38 67.702010 71.64 69.88 71.342011 78.10 76.59 77.522012 85.24 83.84 84.682013 88.08 86.49 87.31
Means of the share of firms with PB LTIplans by three samples: top 5 NEOs, CEOs,and top 5 NEOs excluding CEOs.
11
Tab
le2:
Shar
eof
Fir
ms
wit
hP
BLT
IP
lan
by
Sec
tor
(Top
5)
2006
2007
2008
2009
2010
2011
2012
2013
Ener
gy0.
580.
530.
590.
580.
640.
710.
820.
85(3
1)(3
4)(3
2)(3
3)(3
3)(3
5)(3
8)(3
9)M
ater
ials
0.75
0.71
0.85
0.81
0.88
0.86
0.90
0.93
(24)
(28)
(27)
(27)
(26)
(29)
(29)
(28)
Indust
rial
s0.
630.
700.
610.
690.
710.
720.
810.
92(4
1)(5
3)(5
1)(5
2)(5
2)(5
0)(5
3)(5
9)C
onsu
mer
Dis
cret
ionar
y0.
520.
560.
710.
740.
740.
830.
840.
89(2
3)(5
0)(4
9)(5
0)(5
7)(5
9)(5
8)(6
4)C
onsu
mer
Sta
ple
s0.
670.
700.
690.
770.
750.
880.
900.
91(1
5)(3
3)(2
9)(3
0)(3
2)(3
2)(3
0)(3
2)H
ealt
hC
are
0.71
0.84
0.68
0.74
0.83
0.85
0.93
0.94
(14)
(19)
(22)
(23)
(23)
(26)
(29)
(31)
Fin
anci
als
0.57
0.58
0.49
0.39
0.46
0.64
0.83
0.82
(49)
(52)
(53)
(46)
(52)
(50)
(52)
(56)
Info
rmat
ion
Tec
hnol
ogy
0.30
0.54
0.59
0.57
0.67
0.71
0.72
0.74
(10)
(26)
(29)
(28)
(27)
(34)
(36)
(42)
Tel
ecom
munic
atio
nSer
vic
es0.
500.
500.
670.
500.
800.
671.
001.
00(4
)(4
)(3
)(4
)(5
)(3
)(5
)(5
)U
tiliti
es0.
890.
961.
001.
001.
000.
971.
001.
00(2
8)(2
8)(2
8)(2
9)(2
8)(2
9)(2
9)(3
0)
Mea
ns
wit
hnu
mb
erof
obse
rvat
ion
sin
par
enth
eses
for
the
sam
ple
ofth
eto
p5
NE
Os.
12
Tab
le3:
Wei
ght
ofP
BLT
IP
lan
Rel
ativ
eto
LT
Ian
dT
DC
Top
5C
EO
Top
5E
xcl
udin
gC
EO
Unco
ndit
ional
Con
dit
ional
Unco
ndit
ional
Con
dit
ional
Unco
ndit
ional
Con
dit
ional
(1)
(2)
(3)
(4)
(5)
(6)
(7)
(8)
(9)
(10)
(11)
(12)
Yea
rLT
IT
DC
LT
IT
DC
LT
IT
DC
LT
IT
DC
LT
IT
DC
LT
IT
DC
2006
32.8
019
.13
50.5
030
.07
35.7
421
.16
54.0
934
.03
32.7
917
.59
50.9
428
.03
2007
33.2
019
.13
49.5
729
.10
35.5
920
.58
53.5
732
.90
32.9
917
.88
49.8
027
.58
2008
34.1
321
.02
50.2
431
.43
36.9
023
.25
55.2
736
.76
33.3
519
.19
49.7
829
.10
2009
36.0
721
.75
52.3
831
.98
37.8
523
.23
55.4
936
.09
35.9
820
.44
52.4
930
.19
2010
38.3
122
.05
52.3
530
.78
40.4
224
.13
55.5
834
.53
37.4
220
.29
51.3
528
.43
2011
41.4
324
.74
52.2
931
.68
43.3
826
.86
54.5
135
.07
40.6
722
.82
51.7
129
.43
2012
47.1
328
.85
54.8
333
.85
49.6
631
.51
57.5
737
.58
45.9
226
.45
53.7
831
.23
2013
49.7
330
.88
56.0
235
.05
52.5
534
.64
59.8
139
.94
47.7
827
.75
54.3
031
.78
Mea
ns
of
the
wei
ght
ofP
BLT
Ip
lan
sby
thre
esa
mp
les:
top
5N
EO
s,C
EO
s,an
dto
p5
NE
Os
excl
udin
gC
EO
s.U
nco
nd
itio
nal
esti
mat
esin
clu
de
firm
sw
ith
zero
ind
ivid
ual
s(w
ith
resp
ect
toth
esa
mp
le)
rep
orte
dto
hav
ea
PB
LT
Ip
lan
.C
ond
itio
nal
esti
mat
esex
clu
de
firm
sw
ith
zero
ind
ivid
ual
s(w
ith
resp
ect
toth
esa
mp
le)
rep
ort
edto
hav
ea
PB
LT
Ip
lan
.
13
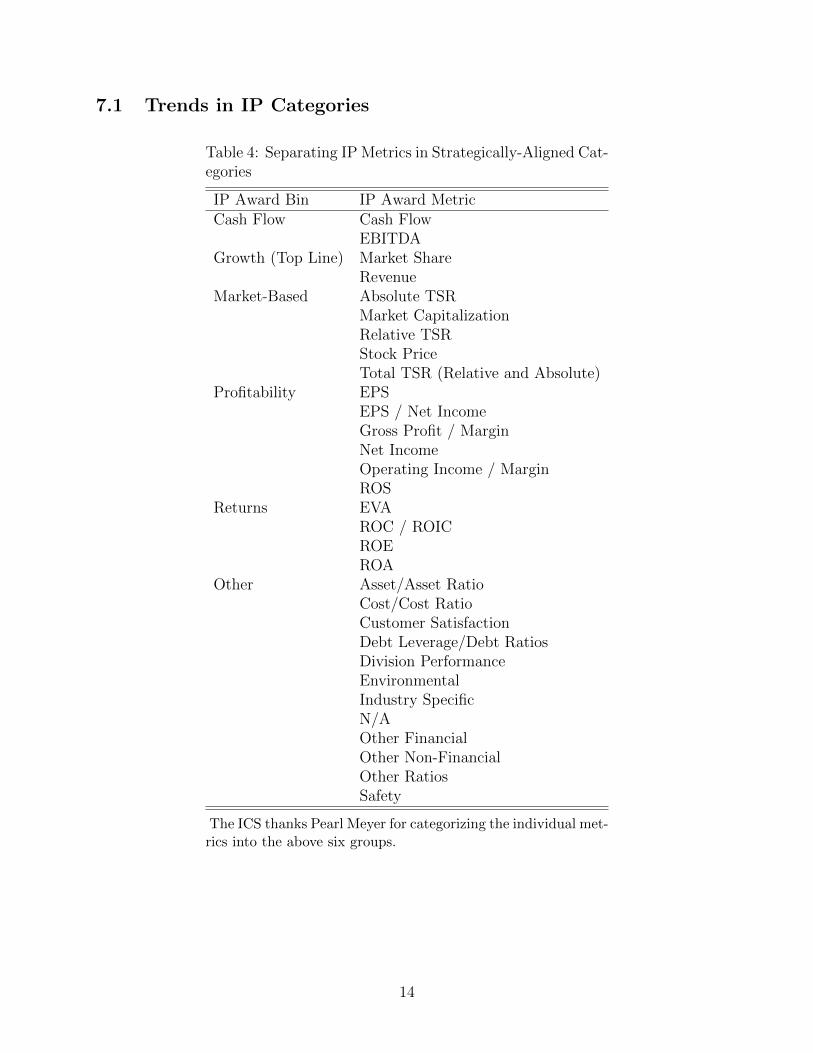
7.1 Trends in IP Categories
Table 4: Separating IP Metrics in Strategically-Aligned Cat-egories
IP Award Bin IP Award MetricCash Flow Cash Flow
EBITDAGrowth (Top Line) Market Share
RevenueMarket-Based Absolute TSR
Market CapitalizationRelative TSRStock PriceTotal TSR (Relative and Absolute)
Profitability EPSEPS / Net IncomeGross Profit / MarginNet IncomeOperating Income / MarginROS
Returns EVAROC / ROICROEROA
Other Asset/Asset RatioCost/Cost RatioCustomer SatisfactionDebt Leverage/Debt RatiosDivision PerformanceEnvironmentalIndustry SpecificN/AOther FinancialOther Non-FinancialOther RatiosSafety
The ICS thanks Pearl Meyer for categorizing the individual met-rics into the above six groups.
14
Tab
le5:
Pre
vale
nce
ofIP
Cat
egor
ies
Ove
rT
ime
-A
llF
irm
s(T
op5)
IPC
ateg
ory
Ave
rage
IPC
ount
(1)
(2)
(3)
(4)
(5)
(6)
(7)
(8)
Yea
rC
ash
Flo
wG
row
thM
arke
t-B
ased
Pro
fita
bilit
yR
eturn
sO
ther
Indiv
idual
Mea
sure
sC
ateg
orie
s20
066.
697.
9530
.13
29.2
920
.92
11.7
21.
441.
0720
077.
0311
.01
28.4
432
.42
21.7
111
.31
1.48
1.12
2008
6.81
11.1
530
.34
32.5
120
.12
12.3
81.
511.
1320
099.
3210
.56
30.7
535
.09
18.6
312
.42
1.54
1.17
2010
8.96
12.5
435
.82
37.3
120
.90
11.0
41.
711.
2720
1111
.24
15.5
637
.18
40.0
622
.19
13.5
41.
901.
4020
1211
.98
18.1
145
.68
39.0
025
.07
16.1
62.
211.
5620
1313
.21
17.3
650
.78
39.9
028
.24
15.5
42.
331.
65
Th
ele
ftp
anel
sre
por
tsth
em
ean
sof
the
shar
eof
firm
sw
ith
each
ofth
esi
xIP
cate
gori
esfo
ral
lfi
rms
by
thre
esa
mp
les:
top
5N
EO
s,C
EO
s,an
dto
p5
NE
Os
excl
ud
ing
CE
Os.
Th
eri
ght
pan
els
pre
sents
the
aver
age
nu
mb
erof
met
rics
and
cate
gori
esby
firm
.
15

Tab
le6:
Pre
vale
nce
ofIP
Cat
egor
ies
Ove
rT
ime
-F
irm
sW
ith
PB
LT
I(T
op5)
IPC
ateg
ory
Ave
rage
IPC
ount
(1)
(2)
(3)
(4)
(5)
(6)
(7)
(8)
Yea
rC
ash
Flo
wG
row
thM
arke
t-B
ased
Pro
fita
bilit
yR
eturn
sO
ther
Indiv
idual
Mea
sure
sC
ateg
orie
s20
0610
.96
13.0
149
.32
47.9
534
.25
19.1
82.
361.
7520
0711
.39
17.8
246
.04
52.4
835
.15
18.3
22.
391.
8120
0810
.84
17.7
348
.28
51.7
232
.02
19.7
02.
401.
8020
0914
.08
15.9
646
.48
53.0
528
.17
18.7
82.
331.
7720
1012
.71
17.8
050
.85
52.9
729
.66
15.6
82.
421.
8020
1115
.00
20.7
749
.62
53.4
629
.62
18.0
82.
531.
8720
1214
.83
22.4
156
.55
48.2
831
.03
20.0
02.
731.
9320
1315
.55
20.4
359
.76
46.9
533
.23
18.2
92.
751.
94
Th
ele
ftp
an
els
rep
ort
sth
em
ean
sof
the
shar
eof
firm
sw
ith
each
ofth
esi
xIP
cate
gori
esfo
rfi
rms
offer
ing
PB
LT
Iaw
ard
sby
thre
esa
mp
les:
top
5N
EO
s,C
EO
s,an
dto
p5
NE
Os
excl
ud
ing
CE
Os.
Th
eri
ght
pan
els
pre
sents
the
aver
age
nu
mb
erof
met
rics
an
dca
tego
ries
by
firm
.
16

Table 7: Firm Characteristics by PB LTI Plan Pattern (Top 5)
Always PB LTI Change PB LTI Never PB LTIMarket Cap - Avg 23690.79 25687.94 26379.44
(0.72) (0.94)Total Revenue - Avg 20476.85 17960.63 22355.41
(0.78) (0.55)10 Yr Net Inc CAGR 7.10 7.12 14.64
(0.00) (0.00)10 Yr ROIC CAGR 0.69 0.48 3.76
(0.07) (0.06)10 Yr EBIT CAGR 7.26 6.92 15.62
(0.00) (0.00)10 Yr EPS CAGR 7.00 6.33 13.38
(0.00) (0.00)10 Yr ROA CAGR 0.06 0.06 0.08
(0.01) (0.03)10 Yr ROE CAGR 0.16 0.15 0.26
(0.51) (0.02)10 Yr FCF CAGR 6.65 7.23 13.25
(0.03) (0.02)Observations 210 122 35
Means with p-values in parentheses for the sample of the top five NEOs. Firmsare grouped into three groups based on the sample period: those that always hada PB LTI plan, those that never had a PB LTI plan, and those that changed theirPB LTI plans by either introducing or removing them.
17
Tab
le8:
Est
imat
esof
PB
LT
IP
lans
on1-
Yea
rT
SR
and
3-Y
ear
TSR
1-Y
ear
TSR
3-Y
ear
TSR
(1)
(2)
(3)
(4)
(5)
(6)
(7)
(8)
PB
LT
IP
lan
3.61
010
.704
∗∗∗
5.16
83.
734
0.63
53.
487∗
3.34
8∗3.
113∗
(2.9
61)
(3.1
26)
(3.9
84)
(4.0
82)
(1.3
62)
(1.4
09)
(1.5
11)
(1.4
81)
PB
LT
IP
lan
-1
Lag
-2.1
68-7
.163
∗-1
.781
-9.6
61∗∗
1.02
9-1
.578
1.47
9-2
.555
(2.7
64)
(3.3
22)
(3.2
50)
(3.1
64)
(1.1
95)
(1.2
94)
(1.4
55)
(1.3
54)
PB
LT
IP
lan
-2
Lag
s-1
0.27
5∗∗
-10.
833∗
∗∗-3
.282
∗-2
.547
(3.1
62)
(2.9
04)
(1.4
68)
(1.5
39)
Tim
eF
EY
esY
esY
esY
esY
esY
esY
esY
esSec
tor
FE
Yes
Yes
No
No
Yes
Yes
No
No
Fir
mF
EN
oN
oY
esY
esN
oN
oY
esY
esO
bse
rvat
ions
2249
2247
2249
2247
2249
2247
2249
2247
R2
0.18
0.12
0.21
0.16
0.16
0.11
0.19
0.15
Adju
sted
R2
0.17
0.11
0.20
0.15
0.15
0.11
0.18
0.14
Reg
ress
ion
poin
tes
tim
ate
sw
ith
stan
dar
der
rors
inp
aren
thes
es.
Tim
efi
xed
effec
ts(F
E)
are
cap
ture
du
sin
gd
um
my
vari
ab
les
toid
enti
fyea
chye
arw
ith
inth
ep
anel
.T
he
sect
orfi
xed
effec
tsar
eb
ased
onth
e10
sect
ors
un
der
the
two-d
igit
GIC
S:
En
ergy
,M
ater
ials
,In
du
stri
als,
Con
sum
erD
iscr
etio
nar
y,C
onsu
mer
Sta
ple
s,H
ealt
hC
are
,F
inan
cials
,In
form
atio
nT
ech
nol
ogy,
Tel
ecom
mu
nic
atio
nS
ervic
es,
and
Uti
liti
es.
Fir
mfi
xed
effec
tsar
ere
pre
sente
dby
ase
tof
du
mm
yva
riab
les
that
sep
arat
ely
iden
tifi
esea
chfi
rm.
Sig
nifi
can
cele
vels
:∗p<
0.0
5,∗∗p<
0.01,
∗∗∗p<
0.0
01
18

Tab
le9:
Est
imat
esof
PB
LT
IP
lans
on5-
Yea
rT
SR
and
RO
E
5-Y
ear
TSR
RO
E(1
)(2
)(3
)(4
)(5
)(6
)(7
)(8
)P
BLT
IP
lan
-2.2
49∗
-0.5
15-0
.283
-0.4
251.
552
1.80
11.
120
1.16
3(1
.073
)(1
.089
)(1
.084
)(1
.098
)(1
.177
)(1
.171
)(0
.852
)(0
.877
)
PB
LT
IP
lan
-1
Lag
2.11
9∗∗
0.27
72.
103∗
-0.2
781.
088
0.46
40.
581
0.18
8(0
.791
)(0
.830
)(0
.855
)(0
.794
)(0
.862
)(0
.729
)(0
.714
)(0
.661
)
PB
LT
IP
lan
-2
Lag
s-1
.669
-1.4
990.
206
0.16
1(0
.858
)(0
.937
)(0
.928
)(0
.909
)T
ime
FE
Yes
Yes
Yes
Yes
Yes
Yes
Yes
Yes
Sec
tor
FE
Yes
Yes
No
No
Yes
Yes
No
No
Fir
mF
EN
oN
oY
esY
esN
oN
oY
esY
esO
bse
rvat
ions
2249
2247
2249
2247
2249
2247
2249
2247
R2
0.22
0.18
0.27
0.23
0.13
0.13
0.05
0.05
Adju
sted
R2
0.21
0.17
0.27
0.23
0.12
0.12
0.05
0.04
Reg
ress
ion
poi
nt
esti
mat
esw
ith
stan
dar
der
rors
inp
aren
thes
es.
Tim
efi
xed
effec
ts(F
E)
are
cap
ture
du
sin
gd
um
my
vari
able
sto
iden
tify
each
year
wit
hin
the
pan
el.
Th
ese
ctor
fixed
effec
tsar
eb
ased
onth
e10
sect
ors
un
der
the
two-
dig
itG
ICS
:E
ner
gy,
Mat
eria
ls,
Ind
ust
rial
s,C
onsu
mer
Dis
cret
ionar
y,C
onsu
mer
Sta
ple
s,H
ealt
hC
are,
Fin
an
cial
s,In
form
atio
nT
ech
nol
ogy,
Tel
ecom
mu
nic
atio
nS
ervic
es,
and
Uti
liti
es.
Fir
mfi
xed
effec
tsare
rep
rese
nte
dby
ase
tof
du
mm
yva
riab
les
that
sep
arat
ely
iden
tifi
esea
chfi
rm.
Sig
nifi
can
cele
vels
:∗p<
0.0
5,∗∗
p<
0.0
1,∗∗
∗p<
0.00
1
19

Tab
le10
:E
stim
ates
ofP
BLT
IP
lans
onE
PS
Gro
wth
and
Tot
alR
even
ue
Gro
wth
EP
SG
row
thT
otal
Rev
enue
Gro
wth
(1)
(2)
(3)
(4)
(5)
(6)
(7)
(8)
PB
LT
IP
lan
9.80
719
.286
32.8
9830
.231
-1.8
84-1
.450
0.29
60.
280
(13.
081)
(10.
589)
(21.
099)
(24.
286)
(0.9
60)
(0.9
97)
(1.1
17)
(1.1
22)
PB
LT
IP
lan
-1
Lag
-15.
031
-13.
884
-9.1
42-1
7.24
70.
323
0.41
21.
575
1.08
7(1
3.98
2)(1
4.62
4)(1
7.11
1)(1
6.08
0)(0
.882
)(0
.979
)(1
.059
)(1
.031
)
PB
LT
IP
lan
-2
Lag
s-2
4.67
6-1
7.60
5-1
.165
-0.2
68(2
0.67
6)(2
6.02
4)(0
.987
)(1
.152
)T
ime
FE
Yes
Yes
Yes
Yes
Yes
Yes
Yes
Yes
Sec
tor
FE
Yes
Yes
No
No
Yes
Yes
No
No
Fir
mF
EN
oN
oY
esY
esN
oN
oY
esY
esO
bse
rvat
ions
2249
2247
2249
2247
2249
2247
2249
2247
R2
0.02
0.02
0.02
0.02
0.17
0.16
0.19
0.19
Adju
sted
R2
0.01
0.01
0.01
0.01
0.16
0.16
0.18
0.18
Reg
ress
ion
poi
nt
esti
mate
sw
ith
stan
dar
der
rors
inp
aren
thes
es.
Tim
efi
xed
effec
ts(F
E)
are
cap
ture
du
sin
gd
um
my
vari
able
sto
iden
tify
each
year
wit
hin
the
pan
el.
Th
ese
ctor
fixed
effec
tsar
eb
ased
onth
e10
sect
ors
un
der
the
two-
dig
itG
ICS
:E
ner
gy,
Mat
eria
ls,
Ind
ust
rial
s,C
onsu
mer
Dis
cret
ion
ary,
Con
sum
erS
tap
les,
Hea
lth
Car
e,F
inan
cials
,In
form
ati
on
Tec
hn
olog
y,T
elec
omm
un
icat
ion
Ser
vic
es,
and
Uti
liti
es.
Fir
mfi
xed
effec
tsar
ere
pre
sente
dby
ase
tof
du
mm
yva
riab
les
that
sep
arat
ely
iden
tifi
esea
chfi
rm.
Sig
nifi
can
cele
vels
:∗p<
0.0
5,∗∗p<
0.01,∗∗
∗p<
0.0
01
20

Tab
le11
:E
stim
ates
ofP
BLT
IP
lans
onR
OIC
RO
IC(1
)(2
)(3
)(4
)P
BLT
IP
lan
0.28
50.
468
0.62
10.
642
(0.8
33)
(0.8
45)
(0.5
28)
(0.5
30)
PB
LT
IP
lan
-1
Lag
-0.0
08-0
.201
-0.1
04-0
.425
(0.5
95)
(0.4
37)
(0.4
11)
(0.3
94)
PB
LT
IP
lan
-2
Lag
s-0
.175
0.02
7(0
.625
)(0
.475
)T
ime
FE
Yes
Yes
Yes
Yes
Sec
tor
FE
Yes
Yes
No
No
Fir
mF
EN
oN
oY
esY
esO
bse
rvat
ions
2249
2247
2249
2247
R2
0.17
0.17
0.08
0.07
Adju
sted
R2
0.16
0.16
0.07
0.07
Reg
ress
ion
poi
nt
esti
mat
esw
ith
stan
dar
der
rors
inp
aren
thes
es.
Tim
efi
xed
effec
ts(F
E)
are
cap
ture
du
sin
gdu
mm
yva
riab
les
toid
enti
fyea
chye
arw
ith
inth
ep
anel
.T
he
sect
orfi
xed
effec
tsar
eb
ased
onth
e10
sect
ors
un
der
the
two-
dig
itG
ICS
:E
ner
gy,
Ma-
teri
als
,In
du
stri
als,
Con
sum
erD
iscr
etio
nar
y,C
onsu
mer
Sta
ple
s,H
ealt
hC
are,
Fin
anci
als,
Info
rmat
ion
Tec
hn
olog
y,T
elec
omm
un
i-ca
tion
Ser
vic
es,
and
Uti
liti
es.
Fir
mfi
xed
effec
tsar
ere
pre
sente
dby
ase
tof
du
mm
yva
riab
les
that
sep
arat
ely
iden
tifi
esea
chfi
rm.
Sig
nifi
can
cele
vels
:∗p<
0.0
5,∗∗
p<
0.0
1,∗∗
∗p<
0.0
01
21
Tab
le12
:E
stim
ates
ofP
BLT
I/LT
Ion
1-Y
ear
TSR
and
3-Y
ear
TSR
1-Y
ear
TSR
3-Y
ear
TSR
(1)
(2)
(3)
(4)
(5)
(6)
(7)
(8)
PB
LT
Ito
LT
I0.
084
0.16
2∗∗∗
0.10
90.
078
0.00
00.
024
0.03
40.
028
(0.0
46)
(0.0
49)
(0.0
56)
(0.0
54)
(0.0
26)
(0.0
28)
(0.0
33)
(0.0
33)
PB
LT
Ito
LT
I-
1L
ag-0
.083
-0.1
53∗∗
-0.0
43-0
.145
∗0.
020
-0.0
050.
027
-0.0
19(0
.047
)(0
.055
)(0
.057
)(0
.058
)(0
.024
)(0
.022
)(0
.021
)(0
.022
)
PB
LT
Ito
LT
I-
2L
ags
-0.0
97∗
-0.1
07∗
-0.0
29-0
.019
(0.0
49)
(0.0
54)
(0.0
32)
(0.0
33)
Tim
eF
EY
esY
esY
esY
esY
esY
esY
esY
esSec
tor
FE
Yes
Yes
No
No
Yes
Yes
No
No
Fir
mF
EN
oN
oY
esY
esN
oN
oY
esY
esO
bse
rvat
ions
2249
2205
2249
2205
2249
2205
2249
2205
R2
0.18
0.11
0.21
0.15
0.16
0.11
0.19
0.15
Adju
sted
R2
0.17
0.10
0.21
0.15
0.15
0.10
0.18
0.14
Reg
ress
ion
poi
nt
esti
mat
esw
ith
stan
dar
der
rors
inp
aren
thes
es.
Tim
efi
xed
effec
ts(F
E)
are
cap
ture
du
sin
gd
um
my
vari
able
sto
iden
tify
each
year
wit
hin
the
pan
el.
Th
ese
ctor
fixed
effec
tsar
eb
ased
onth
e10
sect
ors
un
der
the
two-
dig
itG
ICS
:E
ner
gy,
Mat
eria
ls,
Ind
ust
rial
s,C
onsu
mer
Dis
cret
ion
ary,
Con
sum
erS
tap
les,
Hea
lth
Car
e,F
inan
cial
s,In
form
atio
nT
ech
nol
ogy,
Tel
ecom
mu
nic
atio
nS
ervic
es,
and
Uti
liti
es.
Fir
mfi
xed
effec
tsar
ere
pre
sente
dby
ase
tofd
um
my
vari
able
sth
atse
par
atel
yid
enti
fies
each
firm
.S
ignifi
can
cele
vels
:∗p<
0.05
,∗∗ p
<0.0
1,∗∗
∗p<
0.001
22

Tab
le13
:E
stim
ates
ofP
BLT
I/LT
Ion
5-Y
ear
TSR
and
RO
E
5-Y
ear
TSR
RO
E(1
)(2
)(3
)(4
)(5
)(6
)(7
)(8
)P
BLT
Ito
LT
I-0
.022
-0.0
040.
017
0.01
60.
041∗
0.04
0∗0.
036∗
0.03
7∗
(0.0
15)
(0.0
15)
(0.0
16)
(0.0
17)
(0.0
17)
(0.0
17)
(0.0
14)
(0.0
15)
PB
LT
Ito
LT
I-
1L
ag0.
022
0.00
70.
042∗
0.01
5-0
.005
-0.0
06-0
.006
-0.0
13(0
.014
)(0
.015
)(0
.016
)(0
.015
)(0
.014
)(0
.013
)(0
.013
)(0
.013
)
PB
LT
Ito
LT
I-
2L
ags
-0.0
26-0
.016
-0.0
010.
013
(0.0
15)
(0.0
16)
(0.0
16)
(0.0
15)
Tim
eF
EY
esY
esY
esY
esY
esY
esY
esY
esSec
tor
FE
Yes
Yes
No
No
Yes
Yes
No
No
Fir
mF
EN
oN
oY
esY
esN
oN
oY
esY
esO
bse
rvat
ions
2249
2205
2249
2205
2249
2205
2249
2205
R2
0.22
0.18
0.27
0.23
0.13
0.13
0.05
0.05
Adju
sted
R2
0.21
0.17
0.27
0.23
0.12
0.12
0.05
0.05
Reg
ress
ion
poin
tes
tim
ates
wit
hst
and
ard
erro
rsin
par
enth
eses
.T
ime
fixed
effec
ts(F
E)
are
cap
ture
du
sin
gd
um
my
vari
ab
les
toid
enti
fyea
chye
arw
ith
inth
ep
anel
.T
he
sect
orfi
xed
effec
tsar
eb
ased
onth
e10
sect
ors
un
der
the
two-
dig
itG
ICS
:E
ner
gy,
Mat
eria
ls,
Ind
ust
rial
s,C
onsu
mer
Dis
cret
ion
ary,
Con
sum
erS
tap
les,
Hea
lth
Car
e,F
inan
cials
,In
form
atio
nT
ech
nol
ogy,
Tel
ecom
mu
nic
atio
nS
ervic
es,
and
Uti
liti
es.
Fir
mfi
xed
effec
tsar
ere
pre
sente
dby
ase
tof
du
mm
yva
riab
les
that
sep
arat
ely
iden
tifi
esea
chfi
rm.
Sig
nifi
can
cele
vels
:∗p
<0.0
5,∗∗
p<
0.01,∗∗
∗p<
0.0
01
23
Tab
le14
:E
stim
ates
ofP
BLT
I/LT
Ion
EP
SG
row
than
dT
otal
Rev
enue
Gro
wth
EP
SG
row
thT
otal
Rev
enue
Gro
wth
(1)
(2)
(3)
(4)
(5)
(6)
(7)
(8)
PB
LT
Ito
LT
I0.
767∗
∗0.
872∗
∗1.
050∗
1.09
2∗-0
.001
0.00
70.
027
0.03
2(0
.253
)(0
.300
)(0
.425
)(0
.435
)(0
.015
)(0
.016
)(0
.018
)(0
.018
)
PB
LT
Ito
LT
I-
1L
ag-0
.660
∗∗-0
.711
∗∗-0
.591
∗∗-0
.721
∗∗∗
-0.0
08-0
.005
0.01
10.
001
(0.2
25)
(0.2
31)
(0.1
91)
(0.2
13)
(0.0
17)
(0.0
21)
(0.0
20)
(0.0
23)
PB
LT
Ito
LT
I-
2L
ags
-0.1
94-0
.135
-0.0
18-0
.000
(0.2
71)
(0.2
81)
(0.0
18)
(0.0
21)
Tim
eF
EY
esY
esY
esY
esY
esY
esY
esY
esSec
tor
FE
Yes
Yes
No
No
Yes
Yes
No
No
Fir
mF
EN
oN
oY
esY
esN
oN
oY
esY
esO
bse
rvat
ions
2249
2205
2249
2205
2249
2205
2249
2205
R2
0.02
0.02
0.02
0.02
0.16
0.16
0.19
0.18
Adju
sted
R2
0.01
0.01
0.02
0.02
0.16
0.15
0.18
0.18
Reg
ress
ion
poin
tes
tim
ate
sw
ith
stan
dar
der
rors
inp
aren
thes
es.
Tim
efi
xed
effec
ts(F
E)
are
cap
ture
du
sin
gd
um
my
vari
able
sto
iden
tify
each
year
wit
hin
the
pan
el.
Th
ese
ctor
fixed
effec
tsar
eb
ased
onth
e10
sect
ors
un
der
the
two-
dig
itG
ICS
:E
ner
gy,
Mat
eria
ls,
Ind
ust
rial
s,C
onsu
mer
Dis
cret
ion
ary,
Con
sum
erS
tap
les,
Hea
lth
Care
,F
inan
cials
,In
form
ati
on
Tec
hn
olog
y,T
elec
omm
un
icat
ion
Ser
vic
es,
and
Uti
liti
es.
Fir
mfi
xed
effec
tsar
ere
pre
sente
dby
ase
tof
du
mm
yva
riab
les
that
sep
arat
ely
iden
tifies
each
firm
.S
ign
ifica
nce
level
s:∗p<
0.0
5,∗∗p<
0.01
,∗∗
∗p<
0.0
01
24
Tab
le15
:E
stim
ates
ofP
BLT
I/LT
Ion
RO
IC
RO
IC(1
)(2
)(3
)(4
)P
BLT
IP
lan
0.02
6∗0.
025∗
0.02
1∗0.
020∗
(0.0
12)
(0.0
12)
(0.0
09)
(0.0
10)
PB
LT
IP
lan
-1
Lag
-0.0
13-0
.010
-0.0
08-0
.013
(0.0
10)
(0.0
10)
(0.0
08)
(0.0
07)
PB
LT
IP
lan
-2
Lag
s-0
.006
0.00
5(0
.011
)(0
.008
)T
ime
FE
Yes
Yes
Yes
Yes
Sec
tor
FE
Yes
Yes
No
No
Fir
mF
EN
oN
oY
esY
esO
bse
rvat
ions
2249
2205
2249
2205
R2
0.17
0.16
0.08
0.07
Adju
sted
R2
0.16
0.15
0.07
0.07
Reg
ress
ion
poi
nt
esti
mat
esw
ith
stan
dar
der
rors
inp
aren
thes
es.
Tim
efi
xed
effec
ts(F
E)
are
cap
ture
du
sin
gdu
mm
yva
riab
les
toid
enti
fyea
chye
arw
ith
inth
ep
anel
.T
he
sect
orfi
xed
effec
tsar
eb
ased
onth
e10
sect
ors
un
der
the
two-
dig
itG
ICS
:E
ner
gy,
Ma-
teri
als
,In
du
stri
als,
Con
sum
erD
iscr
etio
nar
y,C
onsu
mer
Sta
ple
s,H
ealt
hC
are,
Fin
anci
als,
Info
rmat
ion
Tec
hn
olog
y,T
elec
omm
un
i-ca
tion
Ser
vic
es,
and
Uti
liti
es.
Fir
mfi
xed
effec
tsar
ere
pre
sente
dby
ase
tof
du
mm
yva
riab
les
that
sep
arat
ely
iden
tifi
esea
chfi
rm.
Sig
nifi
can
cele
vels
:∗p<
0.0
5,∗∗
p<
0.0
1,∗∗
∗p<
0.0
01
25