performance-based plan management - cps energy
TRANSCRIPT
Copyright © 2019 ScottMadden, Inc. All rights reserved. Report _2019
Performance-Based Plan Management
Briefing to the Board of Trustees
March 25, 2019

Copyright © 2019 by ScottMadden, Inc. All rights reserved.
Today’s Objective and Background
Today’s Objective – Provide a preview to the Board of Trustees on the key performance metrics slated for the April 29 Board Meeting in executive session.
Background
■ CPS Energy management reports two types of metrics to the Board of Trustees
■ These metrics combine to provide an environment with a focused attention on performance accountability, in accord with accepted industry practices, that encourages sustained strategic success across the enterprise
1
Annual Metrics Annual metrics specific to all salaried employees at
CPS Energy, including the President & Chief
Executive Officer (“CEO”).
Long-Term Metrics Two-year metrics specific to the President & CEO
and Senior Chiefs.
Copyright © 2019 by ScottMadden, Inc. All rights reserved.
ScottMadden’s Role
Similar to prior years, CPS Energy has engaged ScottMadden, an energy utility management consulting firm, to
assist with this process.
■ Independently assess prior-year metric results
■ Independently recommend future goals and work with Management to formalize a final recommendation
■ Assist with methods, processes, and communication related to the metric system
2

Copyright © 2019 by ScottMadden, Inc. All rights reserved.
Energy Is Who We Are
ScottMadden Overview
3
ScottMadden is a management consulting
firm with more than 35 years of deep, hands-
on experience.
We deliver a broad array of consulting
services—from strategic planning through
implementation—across the energy utility
ecosystem.
WHAT IT TAKESW E D O
TO GET IT DONER I G H T
Our Energy practice has been serving the industry since 1983 by solving the right problem, the right way, and delivering real results.
We provide guidance on how to solve the right problem with industry-leading practices and management insights.
EN
ER
GY
Our Grid Transformation practice helps you transform the way you operate, plan, and maintain the grid and interact with your customers.
We provide guidance on how to proactively engage with regulators through this transformation.
GR
ID
TR
AN
SF
OR
MA
TIO
NOur Clean Tech & Sustainability practice helps you develop innovative solutions based on a unique understanding of what works in the energy industry through a perspective built from 35 years of energy experience.
We provide guidance on navigating clean and renewable sources of energy, smart energy management, and sustainability.
CL
EA
N T
EC
H &
SU
ST
AIN
AB
ILIT
Y
Our Rates, Regulation, & Planning practice helps you develop your regulatory strategy, prepare your filing, and manage your rate case process.
We provide expert testimony on a wide range of issues and can help you with regulatory policy, best practices, regulatory process improvement, preparation for compliance audits, and more.
RA
TE
S,
RE
GU
LA
TIO
N,
&
PL
AN
NIN
G
Copyright © 2019 by ScottMadden, Inc. All rights reserved.
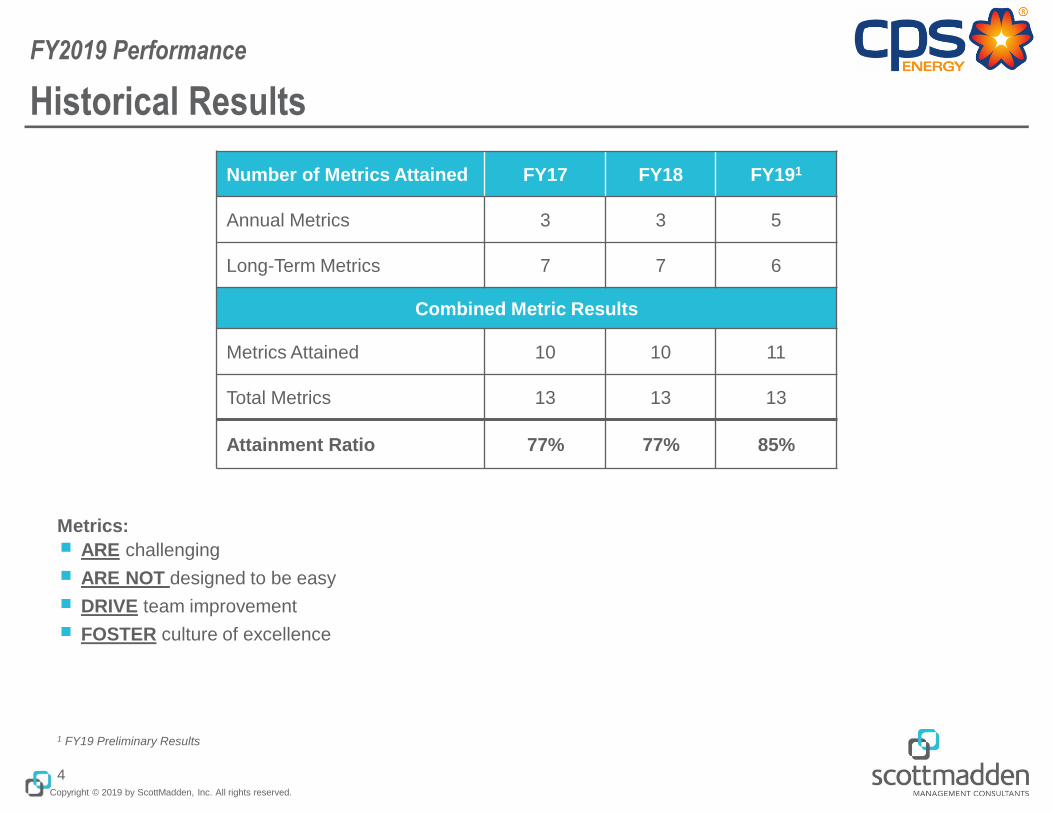
Historical Results
FY2019 Performance
4
Number of Metrics Attained FY17 FY18 FY191
Annual Metrics 3 3 5
Long-Term Metrics 7 7 6
Combined Metric Results
Metrics Attained 10 10 11
Total Metrics 13 13 13
Attainment Ratio 77% 77% 85%
1 FY19 Preliminary Results
Metrics:
■ ARE challenging
■ ARE NOT designed to be easy
■ DRIVE team improvement
■ FOSTER culture of excellence

Copyright © 2019 by ScottMadden, Inc. All rights reserved.
FY2019 Preliminary Results
FY2019 Performance
5
FY2019 Metric Results
Metrics Attained “Target” 4 36%
Metrics Attained “Outstanding” 7 64%
Total Metrics Attained 11
Outstanding Attained7 Metrics
64%
Target Attained4 Metrics
36%
FY2019 Metric Goal Levels Attained

Copyright © 2019 by ScottMadden, Inc. All rights reserved.
Annual Metrics – Preliminary Results1
FY2019 Performance
6
1 Financial Standard must be attained, which was achieved in preliminary FY2019 results2 Relative to this simple presentation, the actual results are aligned to their closest attainment levels. Precise
interpolation techniques are used to ensure accuracy.3 FY19 Preliminary Results 4 Calendar Year (CY) Measure
Performance Measure CategoryDesired
DirectionTarget2 Outstanding2 FY19 Results3 Preliminary FY19
Status3
Customer Satisfaction
(Residential) 4Customer 77.5 79.0 82.3
ACHIEVED
OUTSTANDING
Enterprise Safety (RIR) Employee 0.43 0.37 1.16 UNRECOVERABLE
Environmental Compliance
(NOV/NOE)Community = 0 NOEs 0 NOEs & 0 NOVs 0 NOEs & 1 NOV
ACHIEVED
TARGET
SAIDI 4 Operational 61.00 55.40 54.49ACHIEVED
OUTSTANDING
Portfolio Commercial
Availability 4 Operational 89.5% 90.6% 93.2%ACHIEVED
OUTSTANDING
Enterprise O&M Financial0–2.5% below Budget
(Budget=$617.2M)
2.5% or more below
Budget
($601.2M or less)
$606.9MACHIEVED
TARGET

Copyright © 2019 by ScottMadden, Inc. All rights reserved.
Long-Term Metrics – Preliminary Results1
7
FY2019 Performance
Performance Measure CategoryDesired
DirectionThreshold2 Target2 Outstanding2 FY18
Results
FY19
Results3FY18-19
Results3
Preliminary
FY18-19
Status
2-Yr Average Customer
Satisfaction Index 4,6
(Residential + Small/Medium +
Commercial)
Customer 81.0 81.5 81.9 83.4 83.9 83.7
ACHIEVED
OUTSTANDING
FY18-19
Residential Management
Reputation5 Community 76 77 78 78 81 N/A
ACHIEVED
OUTSTANDING
FY19
Enterprise Readiness5 Employee 64% 68% 76% 66% 73% N/A
ACHIEVED
TARGET
FY19
2-Yr Average SAIDI 4,6 Operational 61.00 55.00 54.11 53.97 54.49 54.23
ACHIEVED
TARGET
FY18-19
2-Yr Average SAIFI 4,6 Operational 0.830 0.817 0.804 0.831 0.844 0.838UNRECOVERABLE
FY18-19
2-Yr Average Portfolio
Commercial Availability 4,6 Operational 89.5% 90.3% 91.4% 90.8% 93.2% 92.0%
ACHIEVED
OUTSTANDING
FY18-19
Senior Lien Bond Ratings5 Financial = 1 1 1 N/A
ACHIEVED
OUTSTANDING
FY19
1 Financial Standard must be attained, which was achieved in preliminary
FY2019 results2 Relative to this simple presentation, the actual results are aligned to their
closest attainment levels. Precise interpolation techniques are used to ensure
accuracy.
3 FY19 Preliminary Results 4 Two-Year Average Metric: FY18-FY195 FY19 Threshold, Target and Outstanding Performance Measures6 Calendar Year (CY) Measure

Copyright © 2019 by ScottMadden, Inc. All rights reserved.
Financial Standard Metrics Preliminary Results
FY2019 Performance
8
Metric FY2019 Threshold FY2019 Results1
Adjusted Debt Service Coverage Ratio2 1.50 ↑ 2.00
Days Cash on Hand2 150 ↑ 246
Debt-to-Equity ratio to not exceed 62.2% 62.2% ↓ 61.8%
1 FY19 Preliminary Results
■ Thresholds are also set by the Board and are fixed year over year
■ It appears all financial standard metrics were met for FY2019
■ The Board has established three financial standard metrics that must be met each year
Copyright © 2019 by ScottMadden, Inc. All rights reserved.
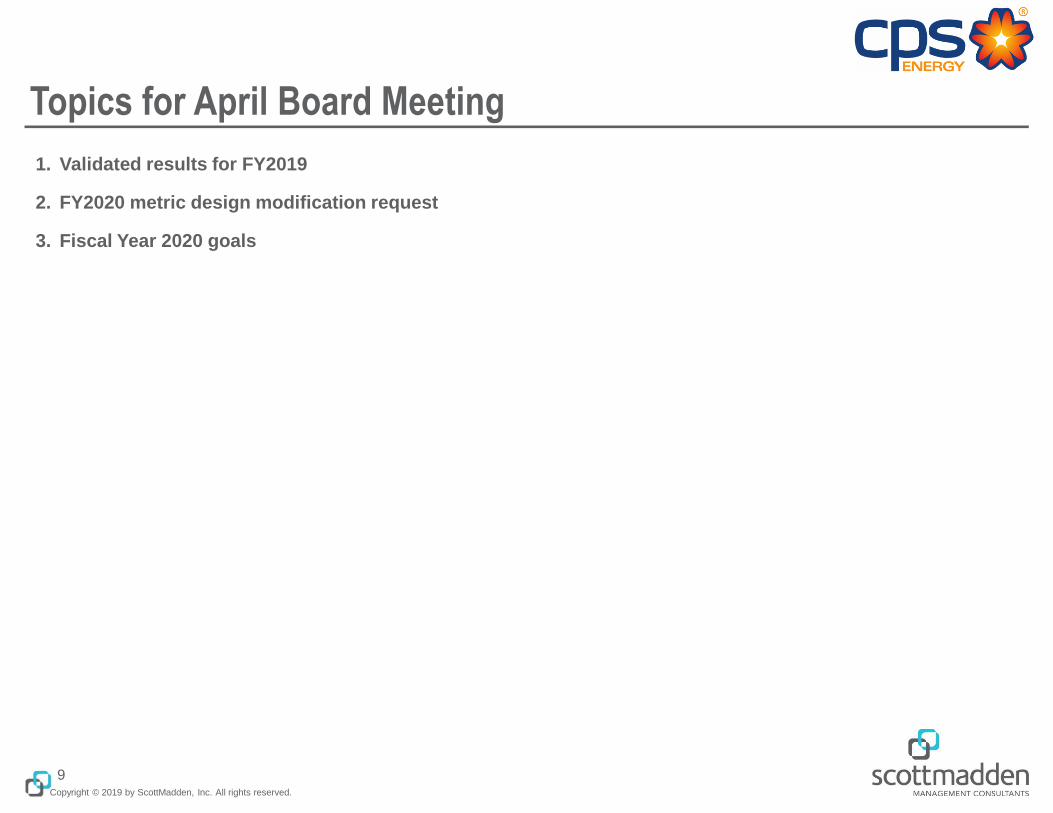
Topics for April Board Meeting
1. Validated results for FY2019
2. FY2020 metric design modification request
3. Fiscal Year 2020 goals
9
Copyright © 2019 by ScottMadden, Inc. All rights reserved.
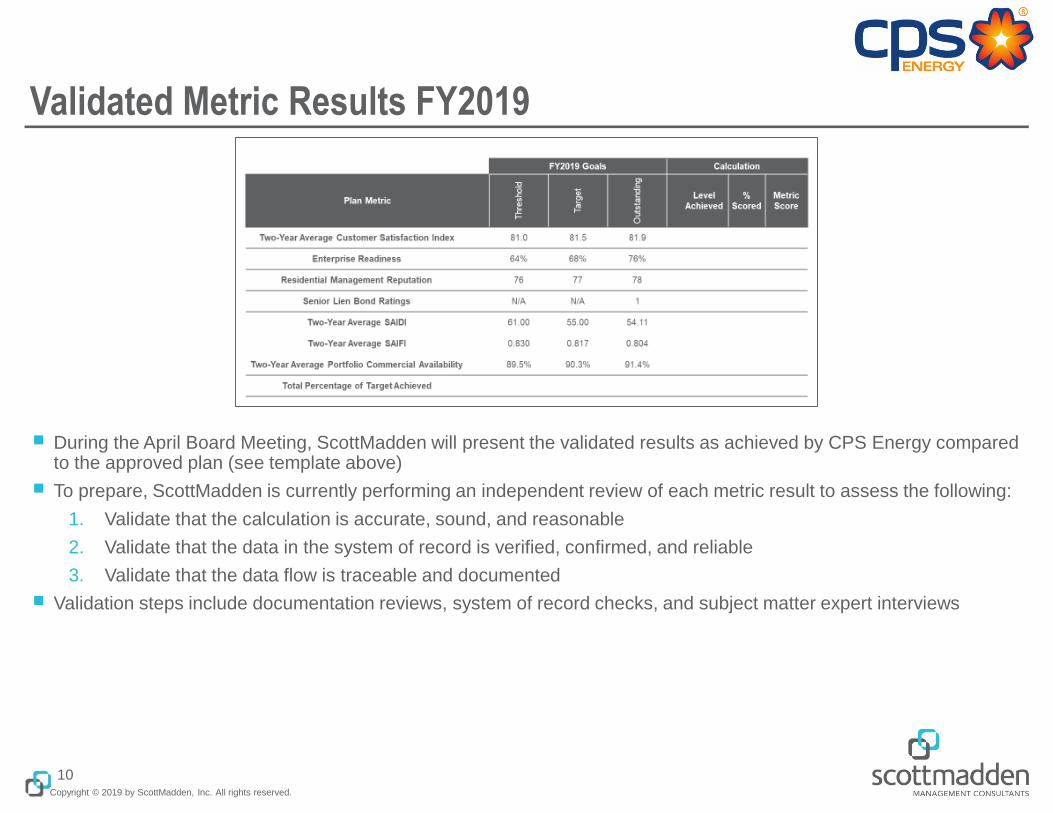
Validated Metric Results FY2019
■ During the April Board Meeting, ScottMadden will present the validated results as achieved by CPS Energy compared to the approved plan (see template above)
■ To prepare, ScottMadden is currently performing an independent review of each metric result to assess the following:
1. Validate that the calculation is accurate, sound, and reasonable
2. Validate that the data in the system of record is verified, confirmed, and reliable
3. Validate that the data flow is traceable and documented
■ Validation steps include documentation reviews, system of record checks, and subject matter expert interviews
10
Copyright © 2019 by ScottMadden, Inc. All rights reserved.
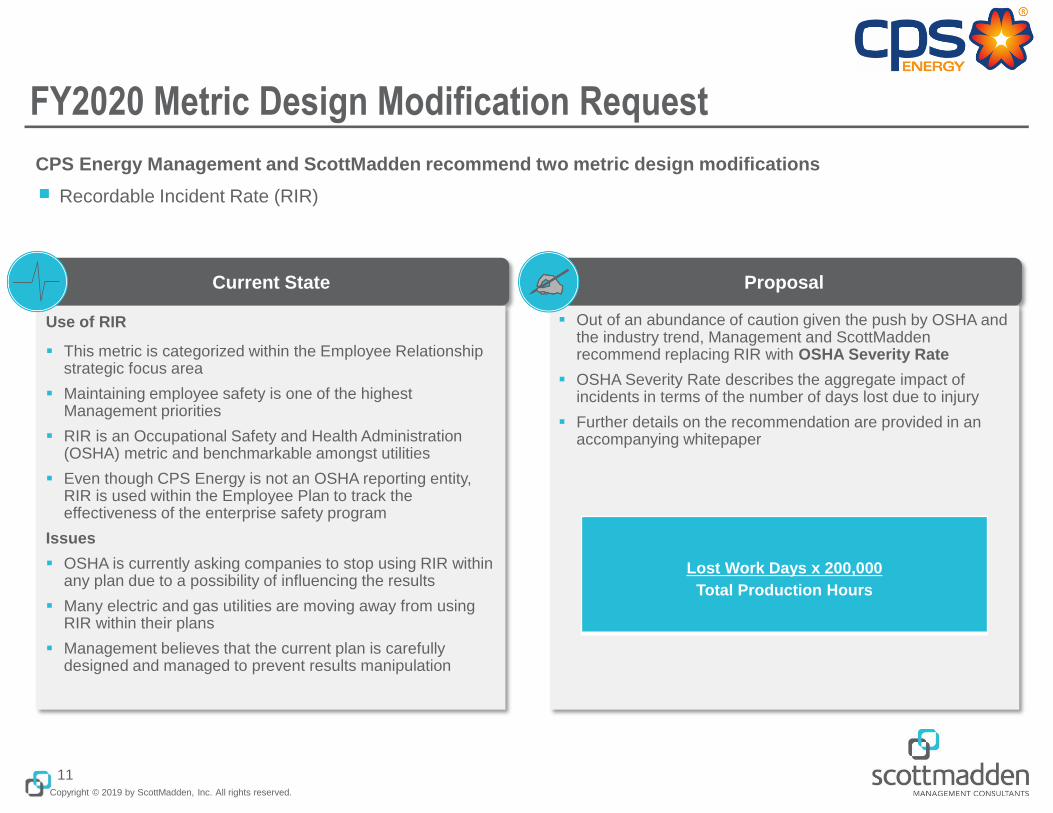
FY2020 Metric Design Modification Request
CPS Energy Management and ScottMadden recommend two metric design modifications
■ Recordable Incident Rate (RIR)
11
Current State Proposal
Use of RIR
This metric is categorized within the Employee Relationship strategic focus area
Maintaining employee safety is one of the highest Management priorities
RIR is an Occupational Safety and Health Administration (OSHA) metric and benchmarkable amongst utilities
Even though CPS Energy is not an OSHA reporting entity, RIR is used within the Employee Plan to track the effectiveness of the enterprise safety program
Issues
OSHA is currently asking companies to stop using RIR within any plan due to a possibility of influencing the results
Many electric and gas utilities are moving away from using RIR within their plans
Management believes that the current plan is carefully designed and managed to prevent results manipulation
Out of an abundance of caution given the push by OSHA and the industry trend, Management and ScottMadden recommend replacing RIR with OSHA Severity Rate
OSHA Severity Rate describes the aggregate impact of incidents in terms of the number of days lost due to injury
Further details on the recommendation are provided in an accompanying whitepaper
Lost Work Days x 200,000
Total Production Hours

Copyright © 2019 by ScottMadden, Inc. All rights reserved.
FY2020 Metric Design Modification Request (Cont’d)
CPS Energy Management and ScottMadden recommend two metric design modifications (Cont’d)
■ Environmental Compliance
12
Please see the accompanying whitepaper on this recommendation
Current State Proposal
Use of Environmental Compliance
This metric is categorized within the Community strategic focus area
The metric measures environmental Notices of Violation (NOV) and Notices of Enforcement (NOE) as issued by the Texas Commission on Environmental Quality (TCEQ) or other regulatory body
Issues
Previous minor issues (e.g., failing to file paperwork on time) have triggered an NOV
The Board has previously asked about the stringent goals of -0- for any notice of violation (NOV) or notice of enforcement (NOE)
Re-define the definition of the metric specific to NOVs while maintaining the part concerning NOEs with no change
Focus management attention on incidents that represent major or moderate harm to human health or the environment
Remove from the definition those NOVs that are minor or administrative in nature
TCEQ already differentiates NOVs into these categories, with Category A representing “major,” Category B representing “moderate,” and Category C representing “minor”
Further details on the recommendation are provided in an accompanying whitepaper
Copyright © 2019 by ScottMadden, Inc. All rights reserved.
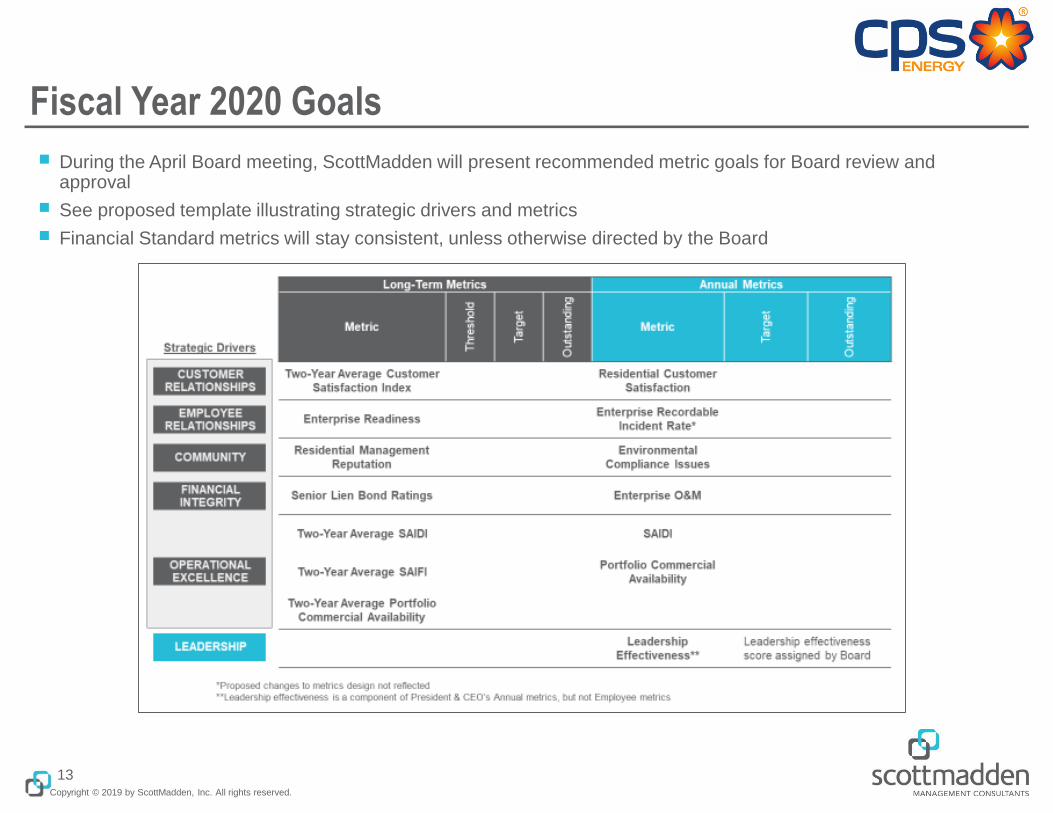
Fiscal Year 2020 Goals
■ During the April Board meeting, ScottMadden will present recommended metric goals for Board review and approval
■ See proposed template illustrating strategic drivers and metrics
■ Financial Standard metrics will stay consistent, unless otherwise directed by the Board
13
Copyright © 2019 by ScottMadden, Inc. All rights reserved.
Questions?
14

Appendix

Copyright © 2019 by ScottMadden, Inc. All rights reserved.
Glossary
Appendix
16
Business Term Definition & Context
Customer Satisfaction
(MSI Residential)
Measure of improvement in customer satisfaction as determined in interviews with customers using Market
Strategies International (MSI) methodology.
Performance is based on a 0 to 10 point scale where 0 represents extremely dissatisfied and 10 represents
extremely satisfied. Using this scale, it represents the average rating score of overall satisfaction among
CPS Energy’s customers, multiplied by 10.
Following each quarter, a composite score is calculated. For Employee Plan purposes, the annual
measurement is an average of the four quarterly composite scores (one (1) decimal point).
Enterprise Safety - RIR
(Recordable Incident Rate)
A measure of the number of recordable work-related injuries and illnesses as defined by Enterprise & Public
Safety (two (2) decimal points).
Environmental Compliance
This measure counts the number of written Notices of Violations (NOVs) and Notices of Enforcement
(NOEs) received during the fiscal year.
For Target there can be no NOEs, which if present, would document the violation and put the recipient on
notice that the case has been referred for enforcement. For Outstanding, the measure counts both the
number of NOEs and written NOVs received during the fiscal year (whole number).
NOTE: This metric does not include TCEQ Compliance History NOVs. Relative to any carryover item from
the prior year, if such an NOV is not cleared, as scheduled by the TCEQ, the item will be counted against
the current-year metric. If that item is subsequently cleared before the end of the fiscal year then in effect, it
will be excluded for measurement purposes.

Copyright © 2019 by ScottMadden, Inc. All rights reserved.
Glossary
Appendix
17
Business Term Definition & Context
System Average
Interruption Duration Index
(SAIDI)
Average duration of electric power outages during the calendar year (in minutes).
Total number of customer interrupted minutes during a sustained interruption divided by the total number of
customers served for the defined reporting period. For calendar year 2010 and beyond, the number
excludes major events, as defined by IEEE 1366 (two (2) decimal points).
Portfolio Commercial
Availability
Economic measure of unit’s value-weighted availability.
This measures actual margin capture as a percentage of potential (“dispatchable”) margin available. It is
driven by locational marginal pricing, variable unit cost, megawatt availability, maximum unit capacity and
unit status. Provided by PowerGADS Margin Analyzer (one (1) decimal point).
Enterprise O&M Budget The overall CPS Energy non-fuel O&M budget, including STP (one (1) decimal point

Copyright © 2019 by ScottMadden, Inc. All rights reserved.
Glossary
Appendix
18
Business Term Definition & Context
2-Yr Average Customer
Satisfaction Index
(Residential + Key & Large
+ Small/Medium)
Customer Satisfaction Index – the average of the current year and the prior year for the following: the
annual average Quarterly Residential Customer Satisfaction Values, plus the annual average Quarterly Key
& Large Commercial Satisfaction Values, plus the annual average Quarterly Small & Medium Business
Satisfaction Values, divided by three (one (1) decimal point).
Management Reputation
A measure of the perception of residential customers on the management of the Company against five
criteria:
1) Being a good corporate citizen
2) Being believable
3) Being a company you can trust
4) Being well-managed
5) Working hard to control costs (whole number)
Enterprise
Readiness
Average of the percentage of positions with at least 2 ready-now and/or emergency fill candidates for these
levels: 1) Chiefs (including the CEO), 2) the Senior Leadership Team, and 3) Directors.
Ready-now is defined as an employee who has the competency, skills and experiences to successfully
assume the role immediately. Emergency fill is defined as an employee who meets a majority of the
position requirements, has a gap-closing documented improvement plan in place, has been rated as ready
within one year or less, and the organization is willing to place in the role for at least one year.
The metric is the simple average of the percentage of three levels, not the weighted average. (whole
number).
Copyright © 2019 by ScottMadden, Inc. All rights reserved.
Glossary
Appendix
19
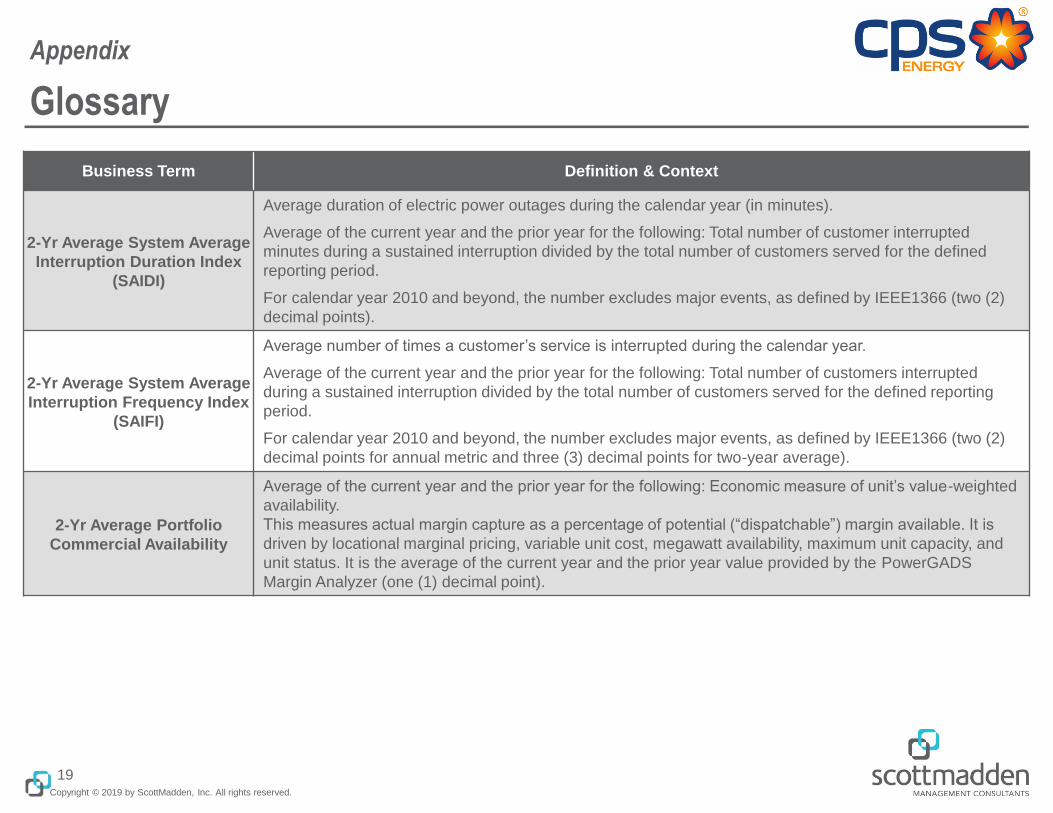
Business Term Definition & Context
2-Yr Average System Average
Interruption Duration Index
(SAIDI)
Average duration of electric power outages during the calendar year (in minutes).
Average of the current year and the prior year for the following: Total number of customer interrupted
minutes during a sustained interruption divided by the total number of customers served for the defined
reporting period.
For calendar year 2010 and beyond, the number excludes major events, as defined by IEEE1366 (two (2)
decimal points).
2-Yr Average System Average
Interruption Frequency Index
(SAIFI)
Average number of times a customer’s service is interrupted during the calendar year.
Average of the current year and the prior year for the following: Total number of customers interrupted
during a sustained interruption divided by the total number of customers served for the defined reporting
period.
For calendar year 2010 and beyond, the number excludes major events, as defined by IEEE1366 (two (2)
decimal points for annual metric and three (3) decimal points for two-year average).
2-Yr Average Portfolio
Commercial Availability
Average of the current year and the prior year for the following: Economic measure of unit’s value-weighted
availability.
This measures actual margin capture as a percentage of potential (“dispatchable”) margin available. It is
driven by locational marginal pricing, variable unit cost, megawatt availability, maximum unit capacity, and
unit status. It is the average of the current year and the prior year value provided by the PowerGADS
Margin Analyzer (one (1) decimal point).

Copyright © 2019 by ScottMadden, Inc. All rights reserved.
Glossary
Appendix
20
Business Term Definition & Context
Senior Lien Bond Ratings
A measure of the Senior Lien Bond ratings as measured by Fitch, Moody’s, and Standard & Poor’s (S&P):
Fitch = AA+, Moody's = Aa1, Standard & Poor's = AA.
A “1” represents the maintenance of current ratings, a “2” (or “0”) indicate an upgrade (or downgrade) in
one or more ratings, respectively.
Interpolation The estimation of values (data or a function) between two known values.