performance benchmarking with big data - geotab€¦ · · 2017-01-16performance benchmarking...
TRANSCRIPT
Performance Benchmarking with Big DataA Case Study on Fleet Benchmarking with Telematics
Mike Branch Vice President Business Intelligence, P. Eng. | Geotab Inc.
January 2017
Performance Benchmarking with Big Data | 1
© 2017 Geotab Inc. All Rights Reserved.
About GeotabGeotab is a global leader in telematics, providing open platform fleet management solutions to businesses of all sizes. Geotab’s intuitive, full-featured solutions help businesses better manage their drivers and vehicles by extracting accurate and actionable intelligence from real-time and historical trips data. With more than 1 billion points of data collected daily, Geotab helps companies access critical business intelligence and benchmarking data to improve productivity, optimize fleets through the reduction of fuel consumption, enhance driver safety, and achieve stronger compliance to regulatory changes. The company’s products are represented and sold worldwide through its Authorized Partner network. To learn more, please visit www.geotab.com.
Comments or questions related to this white paper can be emailed to: [email protected]
For more fleet tips and best practices, visit: www.geotab.com/blog

Performance Benchmarking with Big Data | 2
Introduction .............................................................................................3 The Big Data Challenge ..................................................... 3
Turning Data into Business Advantage with IoT and Big Data ........................................................ 3
Finding Value Through Benchmarking .......................4 Overview of Benchmarking ............................................. 4
Advantages of Benchmarking with IoT.................... 5
Challenges of Working with IoT Data ....................... 6
Case Study: FoodCo IoT Benchmarking ..................7 Introduction .............................................................................. 7
Note on Methodology .......................................................... 8
Benchmarking Analysis...................................................... 9
PLANNING STAGE ......................................................... 9
ANALYSIS ........................................................................ 13
IMPLEMENTATION ...................................................... 18
Next Steps .............................................................................. 18
Conclusion ............................................................................... 19
Glossary of Terms .........................................................................20
References ............................................................................................21
Table of Contents
Performance Benchmarking with Big Data | 3
IntroductionThe value of big data lies in how well an organization is able to draw insight from data and turn it into measurable revenue generation or cost savings.
Although there are a number of ways to do this, this white paper focuses on extracting value from benchmarking, using a standard approach as it relates to the world of IoT-connected devices and big data.
The Big Data ChallengeBig data can be a daunting prospect for many business leaders today. After conquering the challenge of capturing and storing mass amounts of data, deciding what to do with that data is yet another hurdle. Lack of clarity can bring a project to a standstill, leaving the tremendous potential in these big data systems untapped.
Studies show that this challenge is not uncommon. In fact, many struggle with putting their big data to use.
• Only 23% of respondents in a recent survey said they used over three-quarters of their available big data.1
• 59% of those surveyed understood the value of big data analytics, but couldn’t quantify or communicate that value to the extent that it could secure buy-in from the organization.2
• 58% of business and technology executives surveyed by PwC said “moving from data to insight is a major challenge.”3
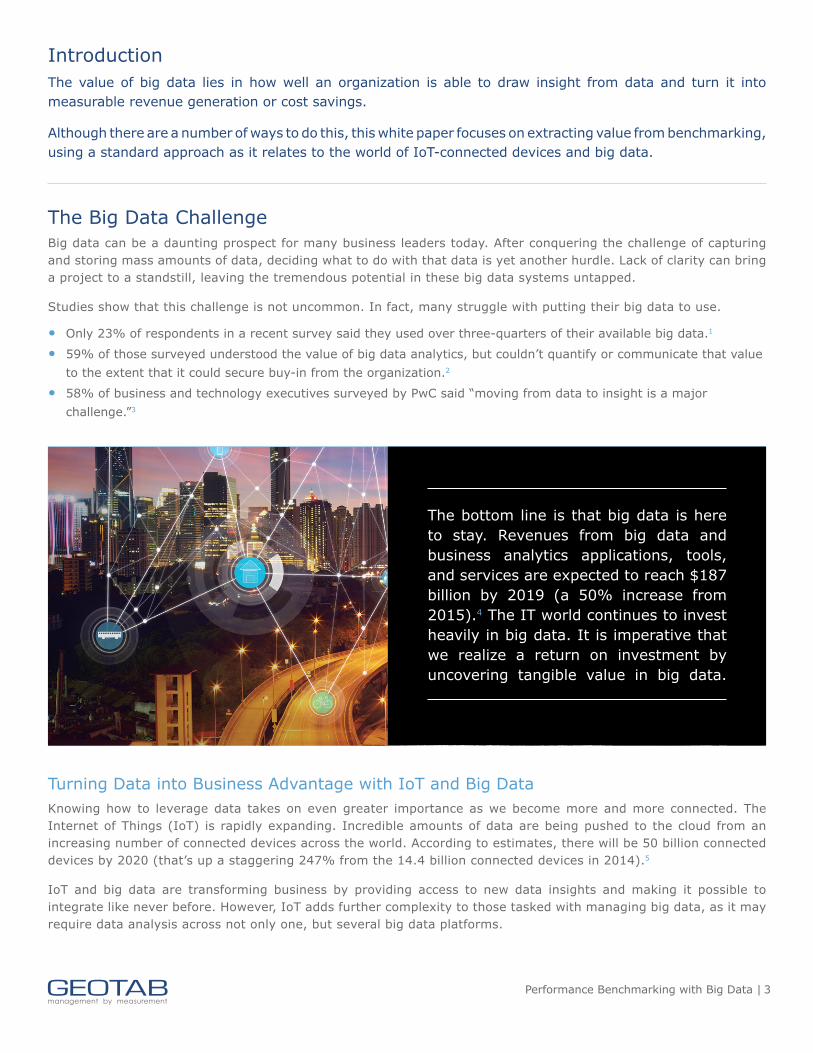
The bottom line is that big data is here to stay. Revenues from big data and business analytics applications, tools, and services are expected to reach $187 billion by 2019 (a 50% increase from 2015).4 The IT world continues to invest heavily in big data. It is imperative that we realize a return on investment by uncovering tangible value in big data.
Turning Data into Business Advantage with IoT and Big DataKnowing how to leverage data takes on even greater importance as we become more and more connected. The Internet of Things (IoT) is rapidly expanding. Incredible amounts of data are being pushed to the cloud from an increasing number of connected devices across the world. According to estimates, there will be 50 billion connected devices by 2020 (that’s up a staggering 247% from the 14.4 billion connected devices in 2014).5
IoT and big data are transforming business by providing access to new data insights and making it possible to integrate like never before. However, IoT adds further complexity to those tasked with managing big data, as it may require data analysis across not only one, but several big data platforms.

Performance Benchmarking with Big Data | 4
Finding Value Through BenchmarkingFor businesses seeking to venture into the world of big data, benchmarking provides an accessible entry point. The knowledge gained from benchmarking lays a solid foundation for decision-making and finding new efficiencies. Measuring your performance against the field can uncover gaps and identify opportunities for improvement.
Overview of BenchmarkingBenchmarking has been a trusted strategy and is heavily used in most successful organizations. In this case study, we follow the standard approach to benchmarking, which is rooted in fairly standard practice:
Benchmarking Process, as outlined by Bain & Company:6
• Select a product, service or process to benchmark• Identify the key performance metrics• Choose companies or internal areas to benchmark• Collect data on performance and practices• Analyze the data and identify opportunities for
improvement• Adapt and implement the best practices, setting
reasonable goals and ensuring company-wide acceptance
Benchmarking with IoT DataCombining the general concept of benchmarking with IoT is game-changing. Feeding real-time data from a network of IoT devices around the world into a big data system can generate powerful analytical insights to fuel productivity, efficiency, and safety.
From energy, mining, utilities, and automotive, to manufacturing, healthcare, and fleet management, IoT is having a major impact in a growing number of industries.7 For example, unmanned drones monitor oil pipelines in remote areas, wireless glucometers help patients easily manage their own health at home, and telematics devices in trucking ensures that food is kept at the proper temperature during transport.
The key advantages of benchmarking with IoT include access to detailed data, in real-time, with the ability to combine and analyze data from multiple devices or sensors together. However, working with IoT doesn’t come without challenges.

Performance Benchmarking with Big Data | 5
Unprecedented Level of Detail An IoT device is capable of collecting an enormous amount of data and streaming it to the cloud. To illustrate the point, Geotab’s telematics devices collect over 1 billion data points per day. When you consider that these devices represent only 0.003% of all IoT-connected devices across the globe, you can see the colossal scale of the IoT ecosystem.4
No matter the device, this volume of data detail allows businesses to truly understand the different facets of their business in a way that was not previously possible. The capacity to extract value from benchmarking will only increase as more devices are connected to the Internet of Things.
No Wait Times for Industry Benchmarks
In the past, industry reports and benchmarks were published on a monthly, quarterly, or even annual basis — meaning you had to wait for weeks, months, or even longer. Modern technology places immediate insight at your fingertips. As soon as the IoT device produces the data, it can be aggregated and benchmarked virtually in real-time, depending on the type of benchmark.
Multi-machine Benchmarking
Combining data from multiple machines into a single key performance index multiplies the benefits of benchmarking. With this type of benchmarking, organizations can create meaningful metrics that horizontally span one or more processes.
Example 1. A municipality wants to benchmark its winter operations.
They combine data from two sources:
• Telematics device (distance driven and location)
• Salt and sand spreader controller on the snow vehicle equipment (amount of material spread, e.g. sand or salt, time spent, and spread rate).
The municipality can create benchmarks from both an operational standpoint (to control substrate costs) and an environmental one (to assess impact). For this municipality or other government organizations, extracting and analyzing this data can have profound impact on policy and practice. To underline the value, take for example the 2009 study by the U.S. Geological Survey which found that an estimated 40% of urban streams in the United States have chloride levels exceeding safe guidelines for aquatic life, in large part due to road salt.8,9
Advantages of Benchmarking with IoT

Performance Benchmarking with Big Data | 6
Data Quality
With so much data available from IoT devices, careful attention must be paid to the quality of the data being retrieved. Erroneous data will produce likewise erroneous conclusions that can misrepresent a situation and lead to poor business decisions. As such, it is critical to work with organizations that have teams of data scientists and engineers who are constantly observing the data for any quality issues.
Understanding Data Nuances
Producing accurate results requires understanding the nuances behind the data being analyzed. For example, Geotab records data using it’s patented curve algorithm, which records the minimal dataset you need to reproduce a series of events. We do not record data every X seconds. If we did so, there would be a risk of missing data between recording events. A clever algorithm, like the one used by Geotab, is critical to ensuring important data is not missed while at the same time not overloading the systems. Depending on the dataset, there will be nuances around the method of recording that must be discussed and understood prior to benchmarking.
Challenges of Working with IoT Data

Performance Benchmarking with Big Data | 7
IntroductionFoodCo is a regional food delivery company with a fleet of 800 trucks and vans. The fleet has a series of daily routes delivering product to a variety of customers, ranging from small “mom and pop” restaurants to international food chains. It should be noted that FoodCo is a fictitious company that was derived from real data to create a representative analysis for the purposes of this white paper.
FoodCo’s challenge is to control rising costs for fuel and operations.
Since the beginning of the year, each truck has been equipped with an IoT telematics device that is continuously streaming data to the cloud. The type of data being streamed consists of GPS data, speed, acceleration, detailed engine diagnostics including engine RPM, fuel usage, seat belt use, and more.
Their primary goal is to reduce the cost of their supply chain operations, while also improving the safety and productivity of their fleet.
Case Study: FoodCo IoT BenchmarkingTo demonstrate how benchmarking with big data works and the value it provides, we present the FoodCo case study. In this section, we follow FoodCo through the benchmarking process from start to finish, through planning, collection of data, analysis, and implementation.
Fleet Snapshot
Company: FoodCo Distribution
Fleet Size: 800 Trucks and Vans
Challenge: Reduce the cost of supply chain operations.
Method: Benchmarking analysis with telematics data.
Results: Identified group of vehicles with higher than average erratic driving incidents.
Solution: Targeted driver coaching.
Performance Benchmarking with Big Data | 8
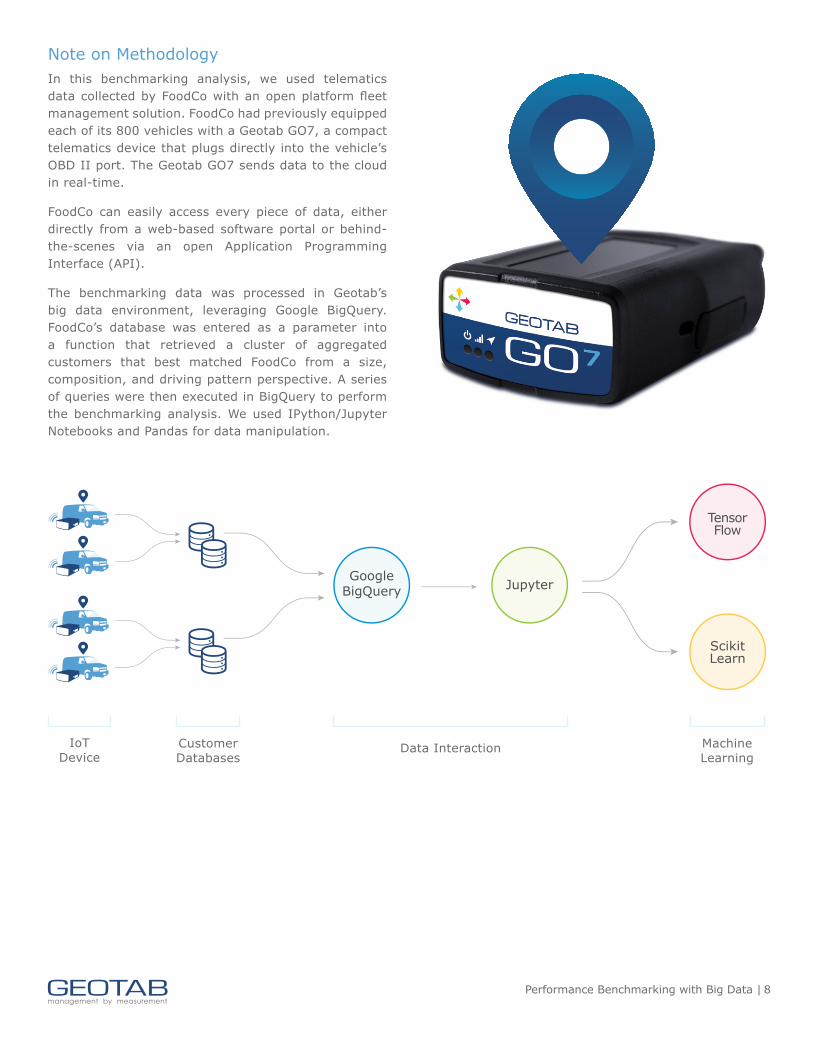
Note on MethodologyIn this benchmarking analysis, we used telematics data collected by FoodCo with an open platform fleet management solution. FoodCo had previously equipped each of its 800 vehicles with a Geotab GO7, a compact telematics device that plugs directly into the vehicle’s OBD II port. The Geotab GO7 sends data to the cloud in real-time.
FoodCo can easily access every piece of data, either directly from a web-based software portal or behind-the-scenes via an open Application Programming Interface (API).
The benchmarking data was processed in Geotab’s big data environment, leveraging Google BigQuery. FoodCo’s database was entered as a parameter into a function that retrieved a cluster of aggregated customers that best matched FoodCo from a size, composition, and driving pattern perspective. A series of queries were then executed in BigQuery to perform the benchmarking analysis. We used IPython/Jupyter Notebooks and Pandas for data manipulation.
IoT Device
Customer Databases
Data Interaction Machine Learning
Google BigQuery Jupyter
TensorFlow
Scikit Learn

Performance Benchmarking with Big Data | 9
Benchmarking AnalysisFoodCo uses the Supply Chain Operations Reference (SCOR) framework for managing and measuring its supply chain operations. The SCOR model focuses on six major management processes: Plan, Source, Make, Deliver, Return, and Enable.10 FoodCo has been tasked with optimizing processes relating to the “Deliver” segment of the SCOR framework which focuses on the creation, maintenance, and fulfilment of customer orders.
Where does FoodCo start? Let’s walk through the six stages of benchmarking to learn how to apply a methodical, data-centric approach toward this problem.
PLANNING STAGE
Select Area to BenchmarkFoodCo wants to reduce the total cost to serve the customer and thereby reduce the operational expenditures as well. As such, we’ll look to benchmark metrics related to the total cost to serve a customer.
Identify the Key Performance IndicatorsIn step one, we identified that we’re looking to uncover key performance indicators (KPIs) related to reducing the total cost to fulfill the customer order. In this case, there are a multitude of KPIs that could be evaluated, including but not limited to:
• Cost of Delivery - Cost of Human Capital - Cost of Vehicle Maintenance - Cost of Fuel
• Order Lead Time
• # Units per Order
• % Delivery In Full (DIF)
• % Delivery On-Time (DOT)
• % Delivery On-Time in Full (DIFOT/OTIF)
Since KPIs differ between organizations and between industries, it’s important in this stage to first define a listing of industry-standard and organization-specific KPIs related to the product or process you’re looking to benchmark.
Note: When dealing with IoT data, we highly recommend involving data scientists in this process. Data scientists have insight into what metrics can be readily obtained from an organization’s big data repository, and may also add value in uncovering data that the business team didn’t even know it collected.
In the case of FoodCo, we’re going to cross-reference this list of KPIs against those that we can monitor strictly through our IoT telematics device, namely cost of fuel.
1
2

Performance Benchmarking with Big Data | 10
Select Benchmarking GroupAt this point, we hypothesize that FoodCo can optimize the cost to serve the customer by reducing the cost of fuel. In the past, FoodCo has been able to benchmark against itself and amongst internal departments. They have done a good job at reducing costs incrementally on a month-over-month basis over the period of a year. FoodCo knows this is true through tracking the total fuel consumption of their fleet, which has shown a consistent downward trend.
Finding Companies with “Like Fleets”FoodCo is getting pressure to be as lean as possible and needs to know what goals they should be setting for themselves to be as competitive as possible in the market. In order to do so, they need to compare themselves against companies with “like fleets.”
A company with a “like fleet” may or may not be in the same industry as FoodCo. To establish a meaningful comparison benchmark, the companies should have these similarities:
• Fleet size
• Fleet composition (i.e. the percentage of trucks vs. vans vs. cars are of a similar mix)
• Driving pattern
Figure 1. FoodCo monthly fuel consumption trend.
3
300,000
225,000
150,000
75,000
0 Jan Feb Mar Apr May Jun
Cost of Fuel ($) Fuel Consumed (L)
January – June: FoodCo Cost of Fuel and Fuel Consumed
Performance Benchmarking with Big Data | 11
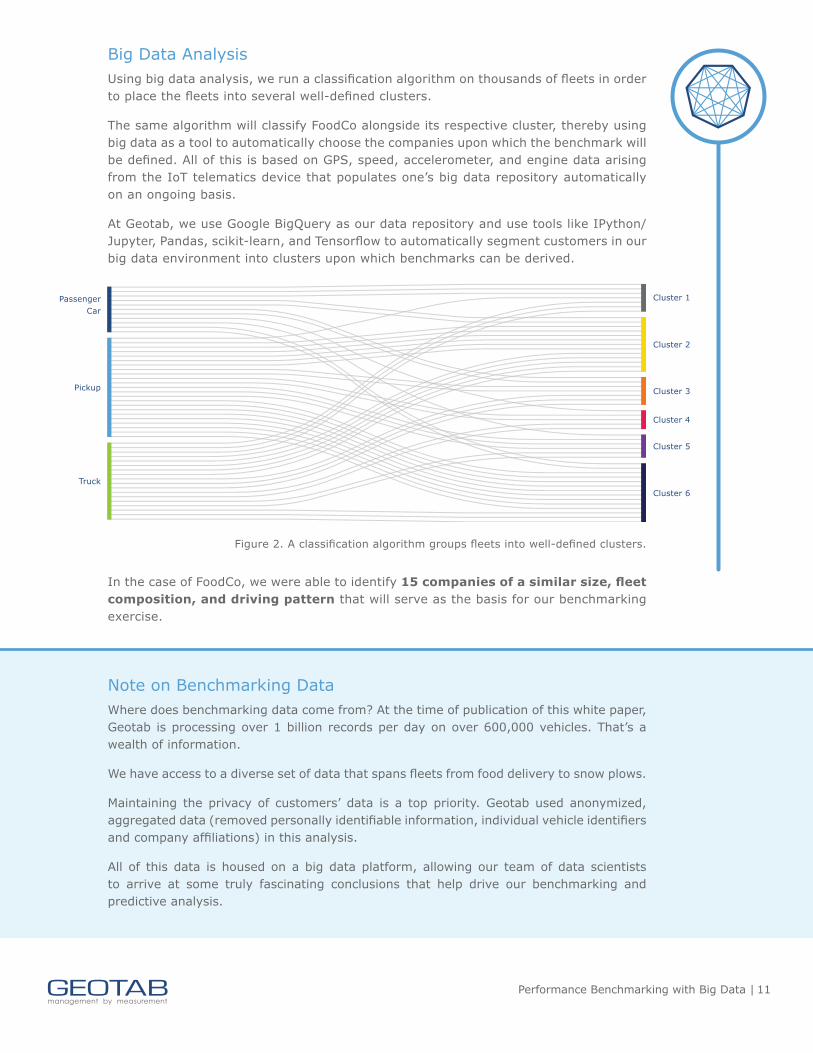
Big Data AnalysisUsing big data analysis, we run a classification algorithm on thousands of fleets in order to place the fleets into several well-defined clusters.
The same algorithm will classify FoodCo alongside its respective cluster, thereby using big data as a tool to automatically choose the companies upon which the benchmark will be defined. All of this is based on GPS, speed, accelerometer, and engine data arising from the IoT telematics device that populates one’s big data repository automatically on an ongoing basis.
At Geotab, we use Google BigQuery as our data repository and use tools like IPython/Jupyter, Pandas, scikit-learn, and Tensorflow to automatically segment customers in our big data environment into clusters upon which benchmarks can be derived.
Passenger Car
Cluster 1
Cluster 2
Cluster 3
Cluster 4
Cluster 5
Cluster 6
Pickup
Truck
In the case of FoodCo, we were able to identify 15 companies of a similar size, fleet composition, and driving pattern that will serve as the basis for our benchmarking exercise.
Note on Benchmarking DataWhere does benchmarking data come from? At the time of publication of this white paper, Geotab is processing over 1 billion records per day on over 600,000 vehicles. That’s a wealth of information.
We have access to a diverse set of data that spans fleets from food delivery to snow plows.
Maintaining the privacy of customers’ data is a top priority. Geotab used anonymized, aggregated data (removed personally identifiable information, individual vehicle identifiers and company affiliations) in this analysis.
All of this data is housed on a big data platform, allowing our team of data scientists to arrive at some truly fascinating conclusions that help drive our benchmarking and predictive analysis.
Figure 2. A classification algorithm groups fleets into well-defined clusters.

Performance Benchmarking with Big Data | 12
Data CollectionFor the purposes of this example, we have focused on benchmarking data for FoodCo arising purely from an IoT device. However, as you develop a more complex model for benchmarking your business, you’ll want to integrate multiple streams of data into your model (both data from IoT devices and your internal business systems).
A clear advantage of incorporating data from IoT devices into your benchmark is the automation and self-sufficiency of the system. As long as the device is installed, data is automatically collected 24 hours a day, 7 days a week. You may decide to supplement this IoT data with data arising from tertiary systems or survey data, if there is qualitative component to your model.
In the case of FoodCo, remember the flow of the metrics we’re looking to benchmark:
1. Reduce the cost to serve the customer.
2. Reduce the cost of fuel.
What data then do we need to capture in order to start our benchmarking analysis?
Data Requirements This part of the process is crucial. Although it may seem simple enough from the onset, careful planning is required. You may ask: Isn’t it sufficient to simply collect fuel consumption data from each of the vehicles? While this will certainly form one of the components of the analysis, this is where a considerable amount of time should be spent with both data scientists and business analysts alike to determine all of the possible ways to slice and dice the data to arrive at recommendations for cost reduction.
For instance, we’ll likely want to look at fuel economy, in which case we’ll need to track fuel consumed and distance driven by vehicle. If we want to really delve into the data to uncover rationale for poor fuel economy, we may want to examine driving behavior and engine data.
4
An IoT device, such as a telematics device, can be extremely useful when conducting a benchmarking exercise. The wealth of data being collected means that you don’t have to initiate a new program to capture data for benchmarking.
In the FoodCo example, we will capture a number of different data points from each vehicle for our analysis.
Data points collected:
• Fuel Consumed (L)
• Total Distance Driven (km)
• Vehicle Make/Model
• Acceleration Front-to-Back (m/s2)
• Acceleration Side-to-Side (m/s2)
• Engine Idling Time (s)
Fuel Economy
Base measurements:• Fuel consumed • Distance driven
Other:• Driving behavior• Engine data
• Plus many other possible variables
You need:
For tracking:
Performance Benchmarking with Big Data | 13
ANALYSIS
Data AnalysisSo far, we have learned that FoodCo has seen a steady reduction in total fuel used over the course of the year. Now, we need to see how their performance measures up against other companies with like fleets.
In the data analysis, we will ask a series of questions to pinpoint the places where FoodCo falls short of other fleets, representing the biggest opportunities for improvement. By targeting these areas, FoodCo can get the best bang for their buck.
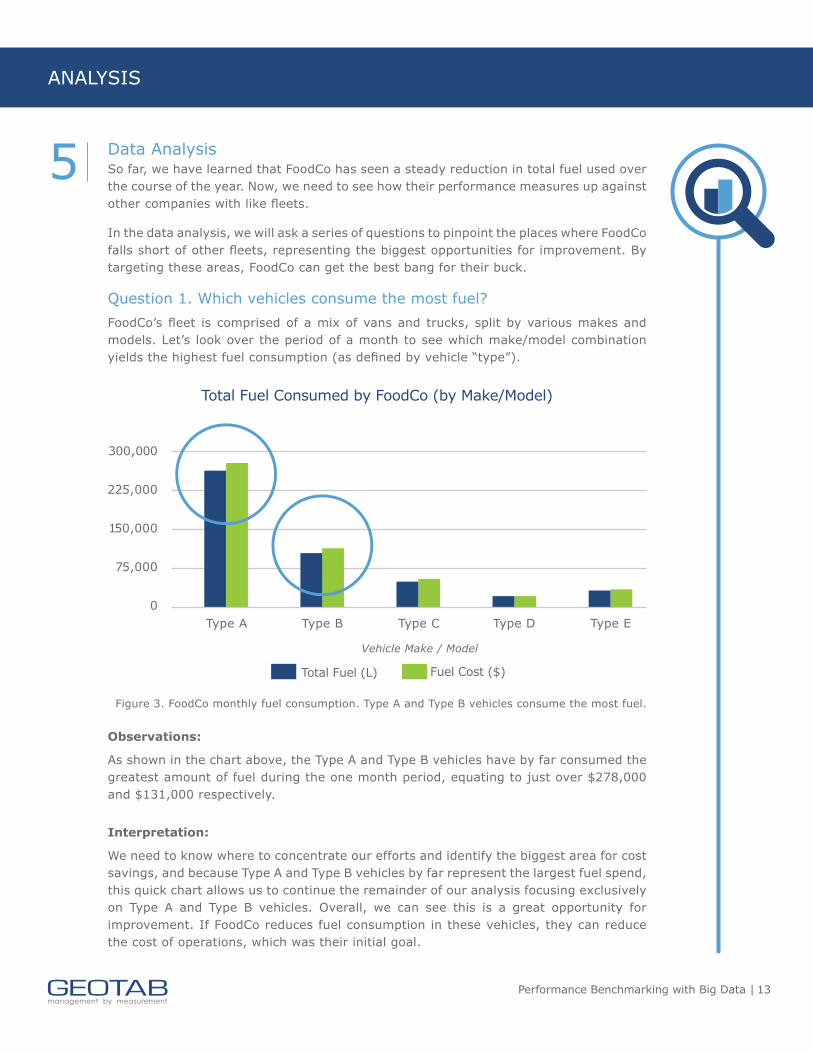
Question 1. Which vehicles consume the most fuel?FoodCo’s fleet is comprised of a mix of vans and trucks, split by various makes and models. Let’s look over the period of a month to see which make/model combination yields the highest fuel consumption (as defined by vehicle “type”).
5
Observations:
As shown in the chart above, the Type A and Type B vehicles have by far consumed the greatest amount of fuel during the one month period, equating to just over $278,000 and $131,000 respectively.
Interpretation:
We need to know where to concentrate our efforts and identify the biggest area for cost savings, and because Type A and Type B vehicles by far represent the largest fuel spend, this quick chart allows us to continue the remainder of our analysis focusing exclusively on Type A and Type B vehicles. Overall, we can see this is a great opportunity for improvement. If FoodCo reduces fuel consumption in these vehicles, they can reduce the cost of operations, which was their initial goal.
Figure 3. FoodCo monthly fuel consumption. Type A and Type B vehicles consume the most fuel.
300,000
225,000
150,000
75,000
0Type A Type B Type C Type D Type E
Total Fuel Consumed by FoodCo (by Make/Model)
Total Fuel (L) Fuel Cost ($)
Vehicle Make / Model

Performance Benchmarking with Big Data | 14
Question 2. What is the fuel economy for Type A and Type B vehicles? How does the fuel economy compare to other vehicles in the FoodCo fleet? Before we can benchmark the fuel economy of these vehicles against our benchmark group, we need to find out their actual fuel economy. To do this, we pulled a chart that illustrates the actual fuel economy for each of these types of vehicles as derived from the data provided by the IoT telematics device.
Observations:
The fuel economy of Type A is 40.3 L/100 km (or 5.84 mpg) and Type B is 42.2 L/100 km (or 5.57 mpg).
Interpretation:
Compared to the others in the fleet, the fuel economy of Type A and Type B vehicles is on par.
This chart tells us something else as well. Type C has the worst fuel economy of the group. However, at this point, since Type C vehicles represent only a smaller portion of the total fleet make up, targeting this group won’t actually result in significant cost savings. Therefore, we won’t take any action with regard to Type C at this point.
We will proceed with the investigation into Type A and Type B vehicles.
Figure 4. FoodCo fuel economy by vehicle make/model.
60
45
30
15
0 Type A Type B Type C Type D Type E
Fuel Economy at FoodCo (by Make/Model)
Vehicle Make / Model
40.342.2
53.1
41.943.9
Fuel
Eco
nom
y (L
/ 1
00 k
m)

Performance Benchmarking with Big Data | 15
Question 3. How does the fuel economy of Type A and Type B compare with companies with like fleets?To judge whether the fuel economy of Type A and Type B is good or bad, we will look at it side-by-side with the benchmark group. We could look it against the manufacturer’s estimated fuel economy, but this will be of little help if we’re more interested in a “real-world” scenario.
Let’s pull the same fuel economy analysis for vehicles in our benchmark group.
Observations:
The results are indeed quite surprising. For Type A vehicles, FoodCo’s average fuel economy is 40.3 L/100 km, while the benchmark is only 30.63 L/100 km (or 7.68 mpg). FoodCo’s fuel economy is 24% worse than the benchmark!
As far as Type B is concerned, the benchmark group and FoodCo were actually quite similar with FoodCo actually having better fuel economy by 0.7%. For the other vehicle types, C through E, the fuel economy is even or very close to the benchmark.
Interpretation:
These results tell us that FoodCo is leaving a significant amount of money on the table and has a tangible opportunity to save 24% in fuel costs for its Type A assets.
Assuming $1.05 per liter, FoodCo spends approximately $278K per month on fuel just for the Type A assets. The opportunity here is to achieve what we know from our benchmark to be an attainable 30.63 L/100 km (a 24% monthly savings) for this class
of vehicles. If we do that, we’re able to see a savings of $66,720 per month – that’s
$800K over the span of one year!
Thus far in our analysis, we have been able to identify a single specific gap utilizing benchmarking with big data and IoT telematics devices; however, how do we correct this action?
Figure 5. Fuel economy of FoodCo vs. benchmark group (for each vehicle make/model).
60
45
30
15
0
Fuel Economy: FoodCo and Benchmark Group
FoodCo Benchmark
Vehicle Make / Model
L /
100
km
Type A Type B TypeC Type D Type E

Performance Benchmarking with Big Data | 16
Question 4. Why is the fuel economy so poor for these Type A vehicles? Many factors affect how much fuel is consumed, such as terrain, load weight, seasonality, and driving habits. In this exercise, we’ll focus on driving habits, since FoodCo’s telematics devices have already been collecting data pertaining to this.
Using the accelerometer data from the telematics device, we can pull in vehicle acceleration in the X, Y, and even Z axis. The accelerometer data will give us some perspective into the erratic driving behavior for the fleet, such as harsh cornering, harsh braking, or hard acceleration.
Defining Aggressive Driving:
Accelerometer events are measured in m/s2 and can easily be converted into G force units. Since different classes of vehicles react to G-forces differently, Geotab has developed a set of criteria for determining erratic driving events by class of vehicle (see table below).
Average G-force Exertions By Vehicle Class
Now we ask the question: Do FoodCo’s Type A vehicles show higher rates of erratic driving incidents than the other vehicles in the fleet? If we find the answer is “Yes,” then aggressive driving may be contributing factor in their below average fuel economy.
To determine this, we cannot simply rely on the number of incidents. We must normalize the number of erratic driving events over the total distance driven. A common metric we use at Geotab is the number of incidents per 100 km. Thus, we have plotted below the average number of erratic driving incidents per 100 km (for each of harsh cornering, braking, and acceleration) broken down by vehicle make/model.
Figure 6. FoodCo number of erratic driving events per 100 km.
Event Passenger Car (G) Truck/Cube Van (G) Heavy Duty
Harsh Breaking < –0.61 < –0.54 < –0.47
Harsh Acceleration > 0.43 > 0.34 > 0.29
Harsh Cornering > 0.47 & <–0.47 > 0.4 & <–0.4 > 0.32 & <–0.32
4
3
2
1
0
Type A Type B Type C Type D Type E
FoodCo Erratic Driving Events
Vehicle Make / Model
Inci
dent
s pe
r 10
0 km
Harsh Braking Hard Cornering Hard Acceleration

Performance Benchmarking with Big Data | 17
Observations:
We can clearly see that the Type A vehicles have a higher than normal erratic driving score with an average of 3.01 harsh cornering incidents, 0.24 harsh braking incidents, and 3.63 hard acceleration incidents (all per 100 km).
This chart reveals that there is room for improvement within FoodCo’s fleet.
Before we go on, let’s measure these results against the benchmark to find out whether this is normal driving behavior for drivers of Type A vehicles in a similar type of fleet.
Observations:
The incidents of harsh braking, hard cornering, and hard acceleration per 100 km for
FoodCo’s Type A vehicles is much higher when compared with the Type A vehicles in the
benchmark group.
Interpretation:
Our benchmark confirms that this is not normal driving behaviour for the same type of vehicle in similar fleets. In fact, FoodCo’s incidents of erratic driving for Type A drivers are over 300% higher than the benchmark group, and for hard cornering specifically, it’s over 400% higher.
Conclusion:
Through our analysis, we have determined that FoodCo’s Type A vehicles have a higher rate of aggressive driving, and therefore represent the best opportunity for improving fuel economy and reducing costs. If FoodCo can improve their average fuel economy for Type A vehicles from 40.3 L/100 km to the benchmark target of 30.63 L/100 km, they can realize a savings of $800,000 per year (based on 24% savings applied to a $278,000 monthly spend on that class of vehicle).
Figure 7. FoodCo Number of Erratic Driving Events
4
3
2
1
0
Harsh Braking Hard Cornering Hard Acceleration
Erratic Driving: FoodCo Type A vs Benchmark Type A
Vehicle Make / Model
Inci
dent
s pe
r 10
0 km
FoodCo Type A Benchmark Type A
0.24 0.65
1.21
0.08
3.013.63

Performance Benchmarking with Big Data | 18
ImplementationArmed with data and insight based on the benchmarking analysis, FoodCo can implement a targeted program to manage driver behavior. To achieve an improvement, FoodCo will focus on the Type A vehicles in the fleet. FoodCo can use their telematics solution to coach drivers and track progress. Working together with drivers from the beginning and gaining support from management are critical to achieving success.
FoodCo’s Goal: Improve fuel economy for Type A vehicles to 30.63 L / 100 km, down from the current 40.3 L / 100 km.
Strategies to Improve Fuel Economy:
• Monitor driving behavior for Type A fleet vehicles. Track week over week metrics as they relate to harsh braking, acceleration, and cornering.
• Clearly communicate the goals of the program to the drivers, both from a safety and cost savings perspective.
• Set up notifications to inform drivers and management when erratic driving thresholds are exceeded. An in-vehicle verbal feedback tool such as Geotab GO TALK can manage aggressive driving on the spot by delivering customized spoken alerts to drivers while they are behind the wheel.
• Regularly track progress to targets. Managers can use automatically populated dashboard reporting and share the results at weekly driver meetings.
Technology can certainly help us to identify and implement aides to affect change, but the human component cannot be overlooked. Gaining company-wide acceptance of these goals is essential to ensuring benchmarking insights will have an impact on FoodCo’s operational expenditures.
Next StepsRecommendations for Further Analysis:
The FoodCo benchmarking analysis was focused on reducing the company’s cost to serve a customer, specifically through fuel cost and fuel economy. However, FoodCo can take this analysis further, and may want to consider the following next steps.
How FoodCo Can Further Leverage Big Data:
• Benchmark engine idling to identify areas of potential fuel cost savings.
• Analyze data from other business systems (e.g. CRM, ERP) to identify areas for savings.
• Identify poorly utilized assets and opportunities for monetization of these assets through resource pooling.
• Build a composite benchmark consisting of a model that pulls in operational data from multiple IoT devices (telematics, weigh scales, beacons, temperature sensors, etc.).
6
IMPLEMENTATION
Performance Benchmarking with Big Data | 19
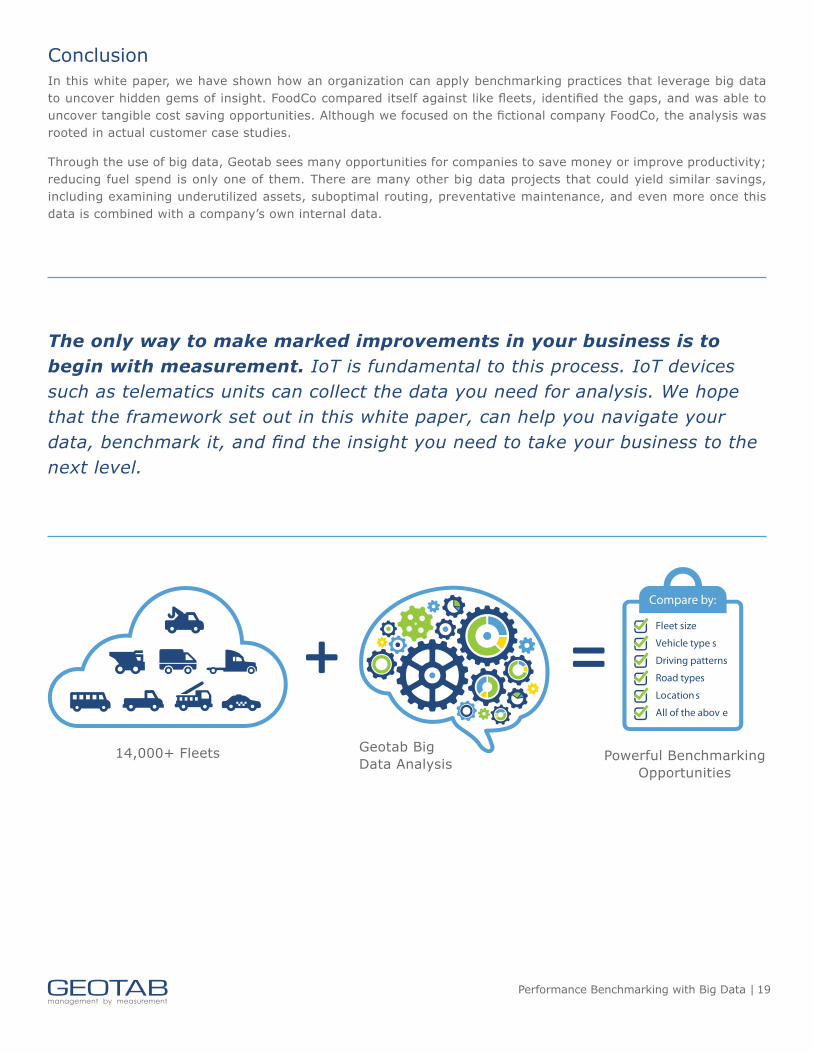
ConclusionIn this white paper, we have shown how an organization can apply benchmarking practices that leverage big data to uncover hidden gems of insight. FoodCo compared itself against like fleets, identified the gaps, and was able to uncover tangible cost saving opportunities. Although we focused on the fictional company FoodCo, the analysis was rooted in actual customer case studies.
Through the use of big data, Geotab sees many opportunities for companies to save money or improve productivity; reducing fuel spend is only one of them. There are many other big data projects that could yield similar savings, including examining underutilized assets, suboptimal routing, preventative maintenance, and even more once this data is combined with a company’s own internal data.
The only way to make marked improvements in your business is to begin with measurement. IoT is fundamental to this process. IoT devices such as telematics units can collect the data you need for analysis. We hope that the framework set out in this white paper, can help you navigate your data, benchmark it, and find the insight you need to take your business to the next level.
Compare by:
Fleet size
Vehicle type s
Driving patterns
Road types
Location s
All of the abov e
14,000+ Fleets Geotab Big Data Analysis Powerful Benchmarking
Opportunities

Performance Benchmarking with Big Data | 20
Glossary of TermsBenchmark: A standard or point of reference used in comparing and evaluating performance or quality. In the case of big data, we are leveraging this data at scale to come up with these points of reference.
Big Data: A term for data sets that are so large or complex that traditional data processing applications are inadequate to deal with them.
Big Data Environment: An organization’s technical infrastructure for housing big data, which may consist of several technologies working together tandem.
BigQuery: A cloud-based web service from Google that enables interactive analysis of massively large datasets.
Clustering: Cluster analysis or clustering is the task of grouping a set of objects in such a way that objects in the same group (called a cluster) are more similar (in some sense or another) to each other than to those in other groups (clusters). In our example above, this was the process of grouping together similar fleets of vehicles.
Data Aggregation: Any process in which information is gathered and expressed in a summary form, for purposes such as statistical analysis. In our example above, we summarized information about a wide number of customers in order to segment them into specific clusters for benchmarking purposes.
Internet of Things (IoT): A vast network of connected devices that collect and exchange data.
Interpolation: An estimation of a value within two known values in a sequence of values. For example, your starting point might be “A” and your destination might be “B”. If these are the only points you’ve received, you must perform an analysis on metrics like speed, acceleration, etc. to arrive at the points traversed between A and B.
KPIs: Key performance indicators are metrics around which an organization can use to measure itself toward achieving a specific goal. Organizations use these indicators to evaluate their success at reaching targets.
Machine Learning: A form of artificial intelligence (AI) which enables computers to learn from data using algorithms instead of programming.

Performance Benchmarking with Big Data | 21
References1. J. Zupan, “Survey of Big Data Decision Makers,” May 25, 2016. [Online] Available:
https://www.attivio.com/blog/post/survey-big-data-decision-makers
2. D. McCafferty, “Big Data’s Biggest Challenges,” CIO Insight, May 30, 2016. [Online] Available: http://www.cioinsight.com/it-strategy/big-data/slideshows/big-datas-biggest-challenges.html
3. PwC, “Big Data: A new way to think about data – and a new way of doing business.” [Online] Available: http://www.pwc.com/us/en/increasing-it-effectiveness/big-data.html
4. J. Davis, “Big Data, Analytics Sales Will Reach $187 Billion By 2019,” InformationWeek, May 24, 2016. [Online] Available: http://www.informationweek.com/big-data/big-data-analytics/big-data-analytics-sales-will-reach-$187-billion-by-2019/d/d-id/1325631
5. Statista, “Internet of Things (IoT): number of connected devices worldwide from 2012 to 2020 (in billions),” 2016. [Online] Available: https://www.statista.com/statistics/471264/iot-number-of-connected-devices-worldwide/
6. Bain & Company, “Insights Management Tools: Benchmarking,” Jun. 10, 2015. [Online] Available: http://www.bain.com/publications/articles/management-tools-benchmarking.aspx
7. J. Riccio, “The top 10 industries adopting the ‘internet of things,’ August 11, 2014. [Online] Available: https://www.digitalpulse.pwc.com.au/top-10-industries-adopting-internet-things/
8. J. Stromberg, “What Happens to All the Salt We Dump On the Roads,” Smithsonian.com, Jan. 26, 2014. [Online] Available: http://www.smithsonianmag.com/science-nature/what-happens-to-all-the-salt-we-dump-on-the-roads-180948079/?no-ist
9. J. Mullaney, D. Lorenz and A.D. Arntson, “Chloride in Groundwater and Surface Water in Areas Underlain by the Glacial Aquifer System, Northern United States,” U.S. Geological Survey Scientific Investigations Report 2009–5086, 2009. [Online] Available: http://pubs.usgs.gov/sir/2009/5086/pdf/sir2009-5086.pdf
10. S. Grant, “Using SCOR® to Manage Supply Chain Operations,” 2016. [Online] Available: http://www.supplychainmanager.com.au/using-scor-to-manage-supply-chain-operations/
