performance diagnostic report pvaas overview 2013 blue bar – current year missing bar –...
TRANSCRIPT

Performance Diagnostic Report
PVAAS Overview 2013
Blue Bar – Current
Year
Missing Bar – Insufficient Number of Students
Whisker – Margin of Error on Growth
Value
1

PVAAS Performance Diagnostic Growth Descriptors - Interpretation
PVAAS Overview 2013
Zero (0) Line
Growth
Met the standard for PA Academic Growth
Did not meet the standard for PA Academic Growth
Exceeded the standard for PA Academic Growth
What the whiskers tell us…
2

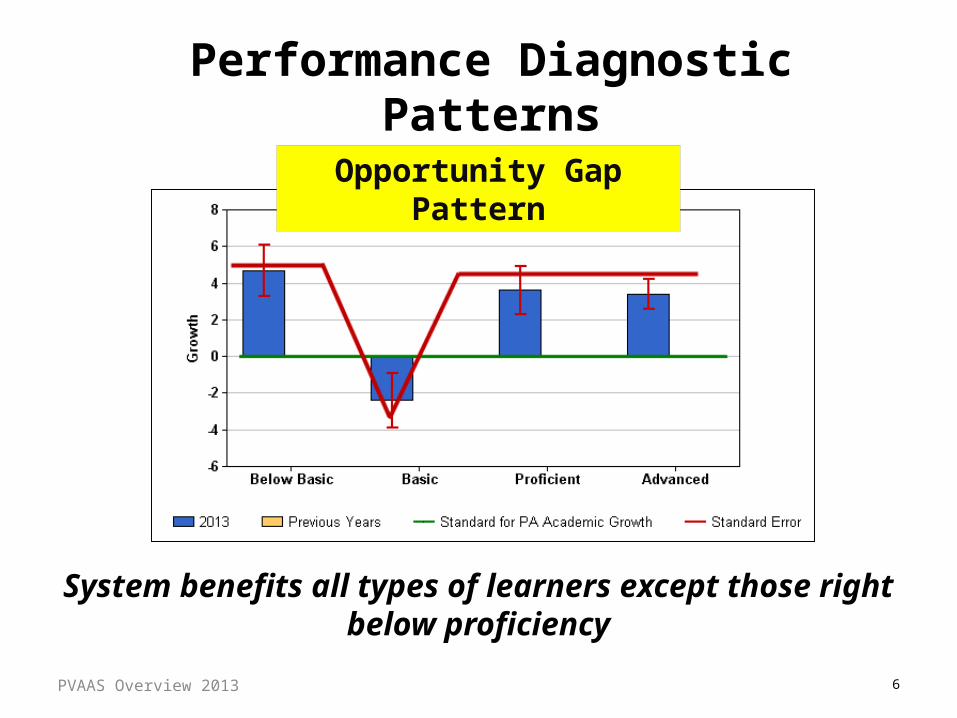
Performance Diagnostic Patterns
3
System benefitslower-achieving students
System benefitshigher-achieving students
Shed Pattern Reverse Shed Pattern
PVAAS Overview 2013

Performance Diagnostic Patterns
4
System benefitsmiddle level learners
System benefitshigher and lower achieving
students
Tent Pattern V Pattern
PVAAS Overview 2013

Performance Diagnostic Patterns
5
System supports growth ofall students similarly and
adequately
System is not supporting growth of any students
Uniform I Pattern Uniform 2 Pattern
PVAAS Overview 2013
Performance Diagnostic Patterns
6
System benefits all types of learners except those right below proficiency
Opportunity Gap Pattern
PVAAS Overview 2013

Performance Diagnostic Patterns
7
System benefits all types of learners with more growth occurring with the lower achieving students
Desirable Pattern
PVAAS Overview 2013

Performance Diagnostic Subgroup Reports
8PVAAS Overview 2013

Performance Diagnostic Subgroup Report
9PVAAS Overview 2013

Best to Compare Subgroup to Entire Grade or Course LevelSame District/School – Same Grade/Course
10
SubgroupEntire grade or course
PVAAS Overview 2013
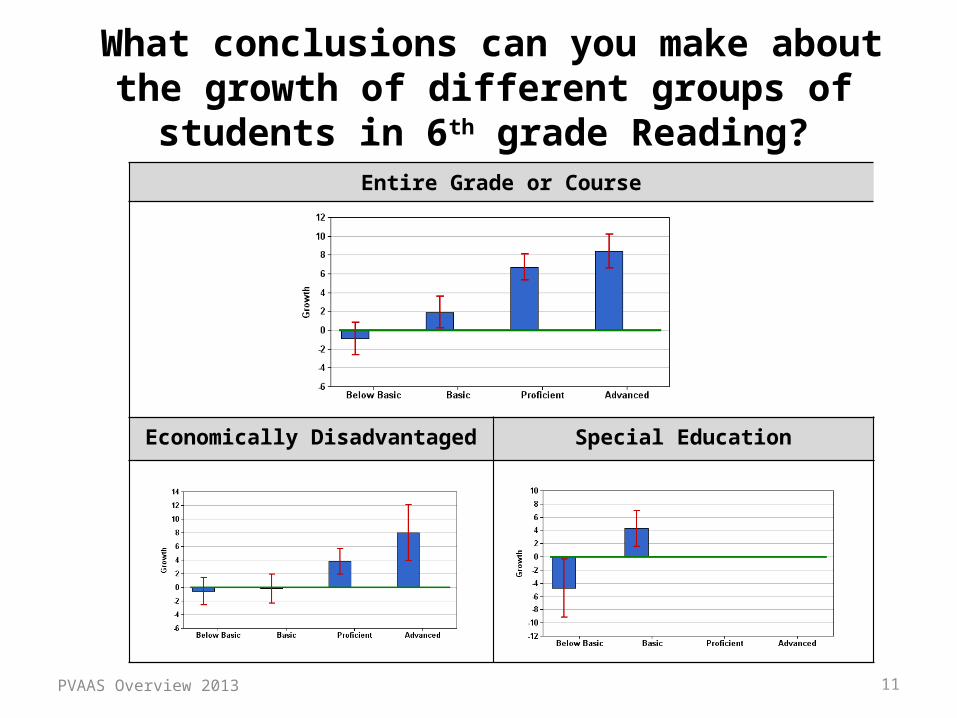
What conclusions can you make about the growth of different groups of students in 6th grade Reading?
Entire Grade or Course
Economically Disadvantaged Special Education
11PVAAS Overview 2013

12
For More Information
VirtualLearning Module
Performance Diagnostic Report
PVAAS Overview 2013

13
Many Reports
PVAAS Overview 2013
14
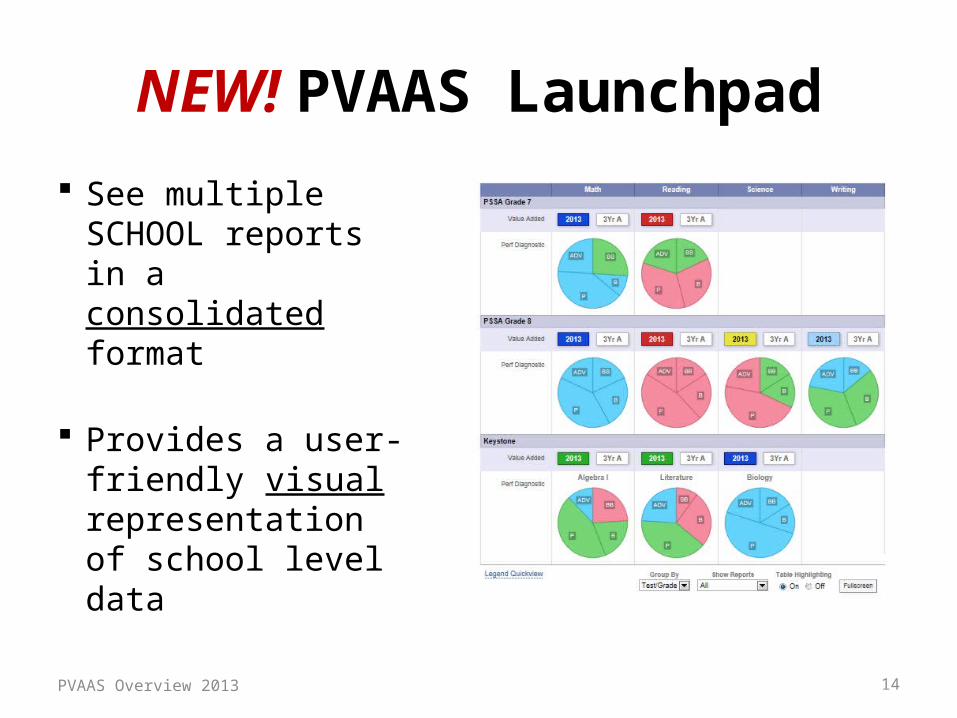
NEW! PVAAS Launchpad
See multiple SCHOOL reports in a consolidated format
Provides a user-friendly visual representation of school level data
PVAAS Overview 2013

15
LAUNCHPAD DEMO
PVAAS Overview 2013

16
Remember
Comprehensive view showing multiple reports on a new single report.
Allows you to see patterns by grade and subject.
Provides you with growth patterns that speak to the strength of your overall core programdeeper analysis is needed, such as looking at
subgroups
PVAAS Overview 2013

Achievement and Growth Together!
PVAAS Overview 2013 17

PVAAS Scatterplots Vertical Axis
Percent Proficient or
Advanced
Horizontal AxisAverage
Growth Index
Standard for PA Academic Growth
PVAAS Overview 2013 18

Scatterplot Quadrants and Their Meanings
Quad 1 - ExcellingAdequate
Achievement,Positive Growth
Quad 4 - Improving
Below Adequate Achievement,
Positive Growth
Quad 2 - SlippingAdequate
Achievement,Negative Growth
Quad 3 - UnderperformingBelow Adequate
Achievement,Negative Growth
PVAAS Overview 2013 19

20
SCATTERPLOT DEMO
PVAAS Overview 2013

21
For More Information
TWO VirtualLearning Modules
Public Scatterplots
Restricted-View Scatterplots
PVAAS Overview 2013

22
Questions
PVAAS Overview 2013

23PVAAS Overview 2013
LOOKING AHEAD
LOOKING BACK

24
Activity 1
• https://pvaas.sas.comUsername: PVAAS.TrainingPassword: demo.site2013
PVAAS Overview 2013
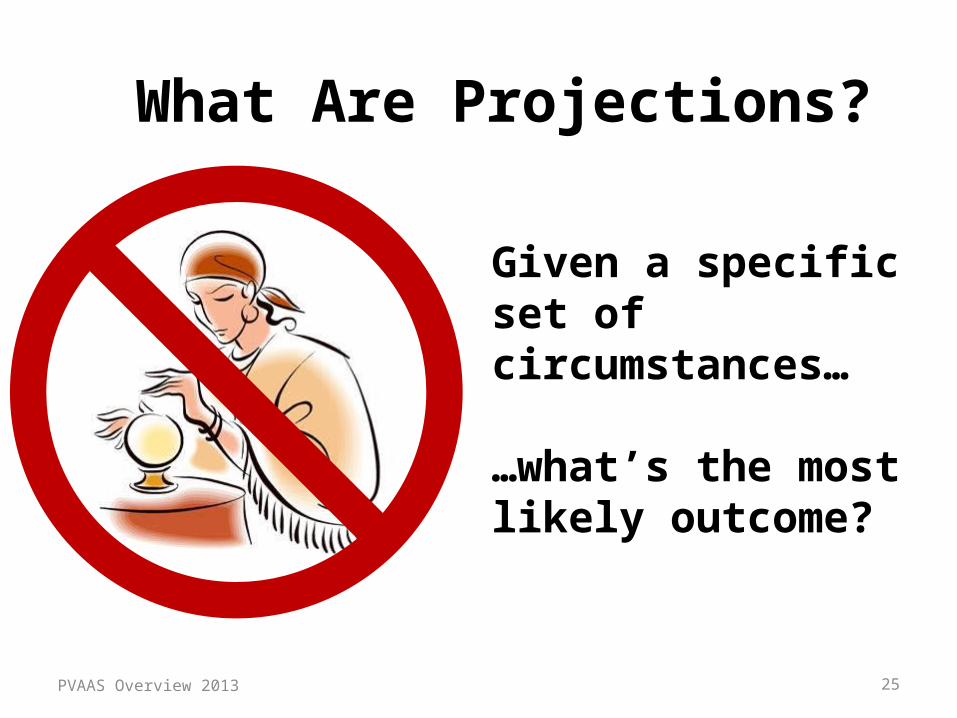
What Are Projections?
Given a specific set of circumstances…
…what’s the most likely outcome?
PVAAS Overview 2013 25
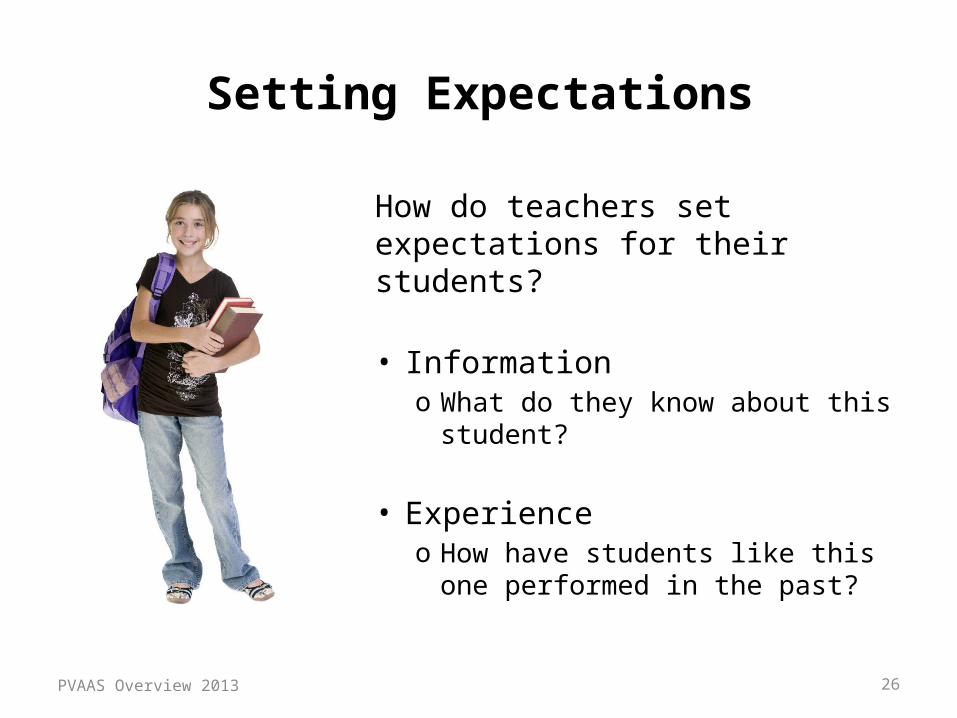
Setting Expectations
How do teachers set expectations for their students?
• Informationo What do they know about this
student?
• Experienceo How have students like this one
performed in the past?
26PVAAS Overview 2013
27
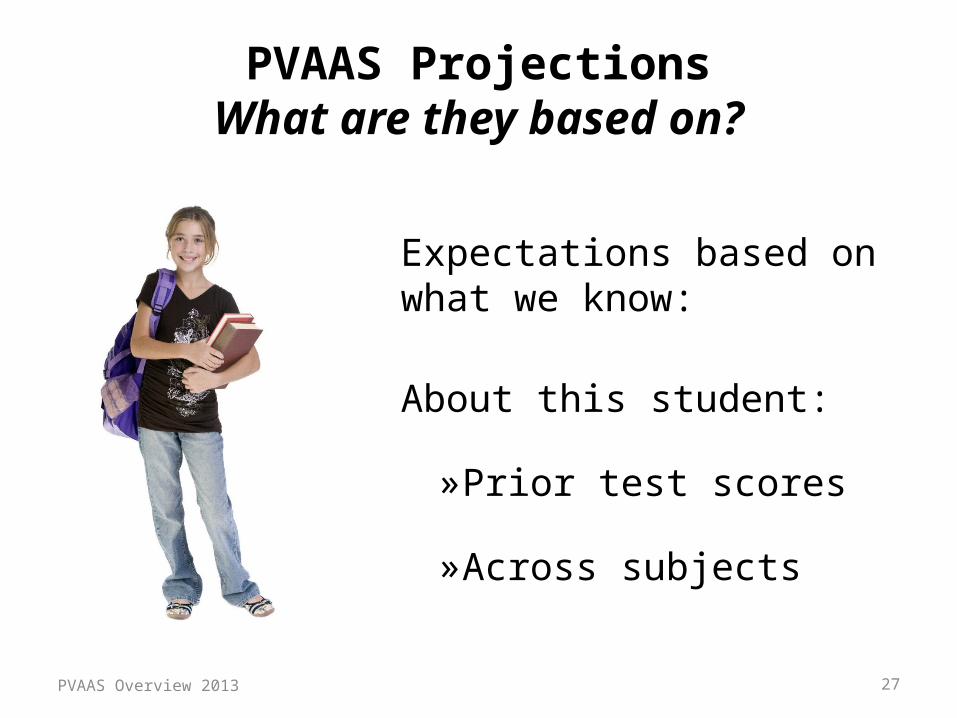
PVAAS ProjectionsWhat are they based on?
Expectations based on what we know:
About this student:
»Prior test scores
»Across subjects
PVAAS Overview 2013

28
PVAAS ProjectionsWhat are they based on?
About other students:
» Prior test scores across subjects
» Scores on the test to which we are projecting
PVAAS Overview 2013

Given this student’s testing history, across subjects…
…what is the student likely to score on an upcoming test, assuming the average schooling experience?
What Are PVAAS Projections?
PVAAS Overview 2013 29

PVAAS Projection Reporting: Projections to PSSA (Basic, Proficient, Advanced)
Grade PSSA
Last Taken
Math and Reading: 3 4 or 5 4 5 or 6 5 6 or 7 6 7, 8 7 8
Writing: 3 5 4 5 5 8 6 8 7 8
Science: 3 4 4 NA 5 8 6 8 7 8
Grade PSSA
Last Taken
Grade PSSA
Last Taken
PVAAS Overview 2013 30

PVAAS Projection Reporting: Projections to Keystones (Basic, Proficient, Advanced)
PVAAS Overview 2013 31
• Anticipating projections to future Keystone exams will be available to students who last tested in grade 5
• Remember, projections to a Keystone exam are NOT grade specific.
• The projection probability indicates the probability of a student reaching the indicated performance level on a future Keystone exam – not necessarily at a specific grade level.

PVAAS Student Projection Report
PVAAS Overview 2013 32

PVAAS Student Projection Report
PVAAS Overview 2013 33

PVAAS Student Projection Report
PVAAS Overview 2013 34

PVAAS Projections for Groups of Students
Student Search
PVAAS Overview 2013 35

Identified Students Meeting Search Requirements
PVAAS Overview 2013 36

How often did students with PVAAS probabilities of 70% or higher score at proficient or advanced?
37PVAAS Overview 2013

How often did students with PVAAS probabilities of 70% or higher score at proficient or advanced?
38PVAAS Overview 2013
A document containing more
information can be found on the PVAAS
Login Page.
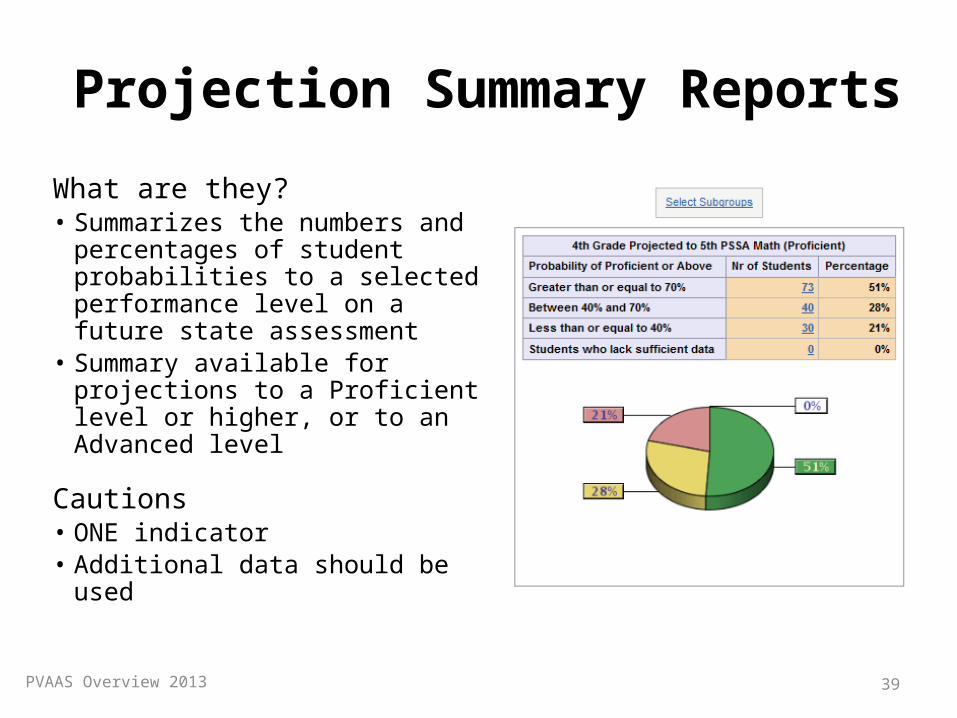
Projection Summary Reports
What are they?• Summarizes the numbers and
percentages of student probabilities to a selected performance level on a future state assessment
• Summary available for projections to a Proficient level or higher, or to an Advanced level
Cautions• ONE indicator • Additional data should be used
PVAAS Overview 2013 39

District/School (Single Grade) Projection Summary Report
PVAAS Overview 2013 40

How Might Educators Use Projection Summary Reports?
Administrators can use for program planning:– Intervention Planning– Resource Allocation– Course Availability & Placement Decisions– Grade-level and Course-level Planning– School-level Planning– Comprehensive Planning
Teachers can use to facilitate instructional planning:– Proportion of students on a path to success (proficiency or higher)– Proportion of students at risk for reaching proficient or advanced levels
of performance– Plan for instructional strategies and classroom practices based on
students’ needsPVAAS Overview 2013 41

42
Questions
PVAAS Overview 2013

43
Activity 2
• https://pvaas.sas.comUsername: PVAAS.TrainingPassword: demo.site2013
PVAAS Overview 2013

44PVAAS Overview 2013
LOOKING AHEAD
LOOKING BACK
PA’s Intent for PVAAS
• Measure of Growth to Add to Existing Achievement Measures
• Indicator of Likelihood of Future Student Performance to Add to Current Achievement Data
• Another Tool for Continuous Improvement
• Not to Be Used in Isolation
PVAAS Overview 2013 45

PVAAS Resources
PVAAS Overview 2013 46

PVAAS Virtual Learning Modules
PVAAS Overview 2013 47
• Various types of VLMs• Concept & foundations of measuring growth• Understanding and using reports• Integrating reports for decision-making
• Online, interactive resources
• Provides real-time professional development
• Designed in sections – pick & choose based on your needs

48
New! Virtual Learning Modules• Scatterplots
• District & School Search
• Concept of Growth: Introduction to Measuring Academic Growth
• Introduction to High Achievement & Growth
• Custom Diagnostic Report
• Student Search & Custom Student Report
• Using PVAAS for Scheduling Students
• PVAAS MisconceptionsPVAAS Overview 2013

PVAAS Help Menus
PVAAS Overview 2013 49
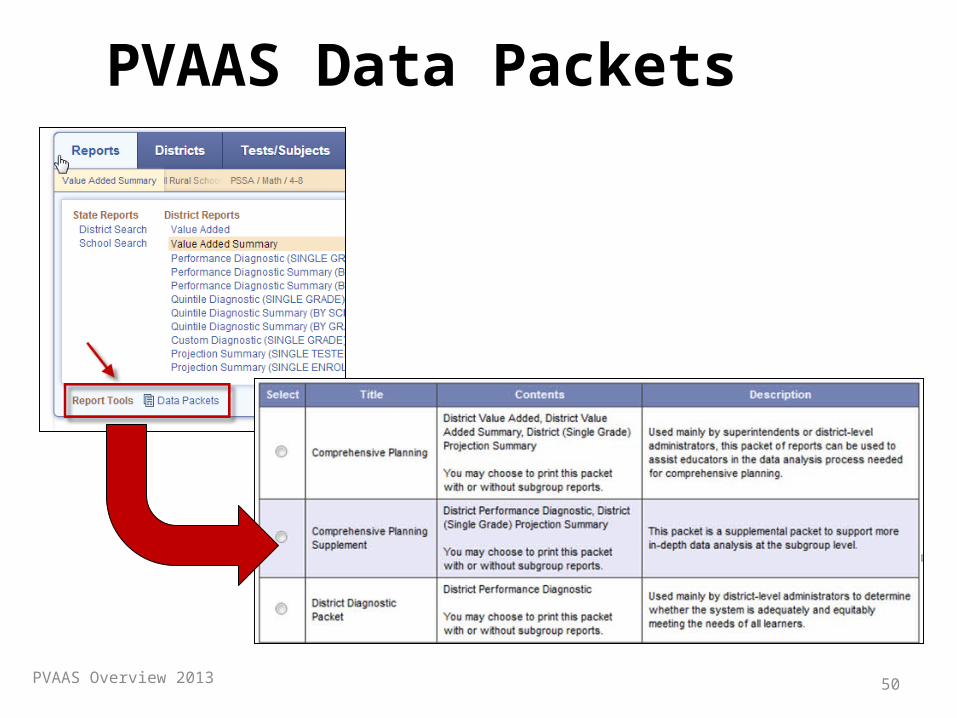
PVAAS Data Packets
PVAAS Overview 2013 50

PVAAS Data Packets
PVAAS Overview 2013 51
Packet choices include:• comprehensive planning• school level planning• grade and course level
planning• district diagnostic• school projection summaries• student projections

Additional PVAAS Supports
PVAAS Overview 2013 52

53http://www.education.state.pa.us/pvaas
Additional PVAAS Supports
PVAAS Overview 2013

Questions?PVAAS Materials or
Statewide Implementation
717-606-1911
PVAAS Report Web Site
https://pvaas.sas.com
PVAAS Overview 2013 54

55
www.pde.state.pa.us
PVAAS Overview 2013
PENNSYLVANIAValue Added Assessment System
______________________________________________________________________
PVAAS
333 Market Street Harrisburg, PA 17126